Abstract
Wine production annually generates an estimated 11 million metric tonnes of grape marc (GM) worldwide. The diversion of this organic waste away from landfill and towards its use in the generation of renewable energy has been investigated. This study aimed to evaluate the effectiveness of operational parameters relating to the treatment regime and inoculum source in the extraction of methane from GM under unmixed anaerobic conditions at 35 °C. The study entailed the recirculation of a previously acclimated sludge (120 days) as downstream inoculum, an increased loading volume (1.3 kg) and a low substrate-to-inoculum ratio (10:3 SIR). The results showed that an incorporation of accessible operational controls can effectively enhance cumulative methane yield (0.145 m3 CH4 kg−1 VS), corresponding to higher amounts of digestible organics converted. The calculated average volumetric methane productivity equalled 0.8802 L CH4 LWork−1 d−1 over 33.6 days whilst moderate pollutant removal (43.50% COD removal efficiency) was achieved. Molecular analyses identified Firmicutes and Bacteroidetes phyla as core organisms for hydrolytic and fermentative stages in trophic relationships with terminal electron acceptors from the methane-producing Methanosarcina genus. Economic projections established that the cost-effective operational enhancements were sustainable for valorisation from grape marc by existing wineries and distilleries.
1. Introduction
Grape is an economically significant fruit crop, with over 79 megatons (Mt) produced globally [1,2]. An estimated 75% of the total grape production is crushed for winemaking [3]. At the end of fermentation, wine contains approximately 20% (w/v) of solid material, known as grape marc (GM) or pomace, which is produced at a rate of 2 t ha−1 [4,5,6]. After the primary grape juice has been extracted, the by-product (GM) is traditionally channelled to distilleries for additional valorisation. Resource recovery includes further alcohol, phenol, and tartrate extraction from GM through distillation [3,6]. Additionally, GM has been used as the raw material for the extraction of natural antioxidants, preservatives, and colouring agents for the food industry [7,8,9,10].
Further benefit from GM includes its application in anaerobic digestion (AD) technology to produce bioenergy whilst concurrently achieving waste reduction [11,12,13,14,15,16,17]. High methane yield is the overarching goal in the anaerobic treatment of organics. The main routes to meet this fundamental objective have been through the refining of pre-treatment, physicochemical, biological, and operational parameters. While such factors are regularly presented individually, they are not mutually exclusive. More often than not, a mix of approaches can compound contributory parameters [18,19,20].
Firstly, the hydrolysis of polymers into monomers requires that organic residues be amenable to hydrolytic enzymes. Consequently, an upstream pre-treatment step is often intercalated in the digestion process to enhance the solubilisation of wastes [21,22]. For example, Tian et al. [23] performed sequential ultrasonication (ULS) and ultrasonication-ozonation (ULS-Ozone) pre-treatments on sewage sludge to improve solubilisation; subsequent semi-continuous anaerobic treatment at 35 °C resulted in the generation of 309 and 348 mL gas g−1 COD for ULS and ULS-Ozone, respectively. In contrast, the baseline control without pre-treatment was at 256 mL gas g−1 COD. Pre-treatment regimes not only increased bioenergy outputs but also halved the solid residence time and presented greater waste remediation, without negatively impacting reactor performance [23]. The pre-treatment strategies can be physical, chemical, biological or an assortment of these [22,24,25,26,27,28]. However, the high costs of acid/alkaline chemicals and their build-up during pre-treatment can be inhibitory to subsequent methane production. The sodium contained in NaOH alkaline pre-treatment solutions was reported to reach 8 g Na L−1, inhibiting methanogenesis [27]. Additionally, a positive correlation between the energy input of various physical pre-treatments and the corresponding cumulative methane yield was observed, rendering the bioenergy production uneconomical; mechanical shredding required the least energy input but resulted in only 10% increased biogas production when compared to other energy-consuming methods, such as sonication [27].
Secondly, physicochemical regulatory options include salinity and conductivity adjustments, nutrient addition, and trace metals addition, among others [29,30]. In using nutrient and trace element solutions in the treatment of GM at 35–37 °C, Fabbri et al. [29] reached a biogas production of 405.65 mL gas g−1 VS over 34 days. However, without physicochemical adjustments at 40 °C, reactor performance was limited to 250 mL gas g−1 VS over 40 days [31]. However, the recurrent drawback in the use of physicochemical enhancers was the environmental impact associated with the use of synthetic materials such as magnetite, iron powder, and granular activated carbon [32,33,34]. Furthermore, the energy balance in most cases has been negative, characterised by incurred costs not compensating for the exergonic outflow.
Thirdly, cases where biological parameterisations were executed in the establishment of reactor performance, shifts in microbial dynamics and community structure were affected by the mixing of different organic types. The ensuing bioaugmentation positively reflected on the bioenergy profile [35,36,37]. For example, Proteobacteria were the predominant microorganisms observed in the mono-digestion of sewage sludge. However, when co-digested with urban organic wastes at 55 °C, Thermonema increased in abundance whereas the Proteobacteria population receded. Proteobacteria are hydrolytic, acidogenic, and non-thermophilic bacteria unsuitable for life at high temperatures [38]; in contrast halophilic Thermonema have an optimal growth temperature of 60 °C and are endowed with fermentative physiologies for the transformation of monosaccharides into acetate, lactate, and gaseous CO2 and H2 [35,39]. Despite the shifts in microbial community richness, there was active degradation of polymers [35,36]. Generally, various types of wastes have been used in co-digestion to alter nutritional compositions, thus selecting for the microbial community in the influent, from lignocellulosic materials such as wood and paper, and food wastes, to the organic fraction of municipal solid waste [40,41,42,43,44,45].
Lastly, a combination of operational parameters can be envisaged for treatment. These include organic loading rate (OLR), hydraulic residence time (HRT), working volume, substrate-to-inoculum ratio (SIR), temperature regimes, and slurry homogenisation, among others [46,47,48]. These operational refinements were aimed at reducing the lag period and accelerating the establishment of sustained biogas production. At increasing total solids (10–15% TS), the mixed manure slurry produced 10–30% more biogas than unmixed conditions at 35 °C [46]. Separately, Ma et al. [48] observed that a lower range of SIR (1:2, 1:1, and 2:1) exhibited steady biogas profiles, whereas a higher range SIR (3:1 and 4:1) showed a prolonged lag time of 15–25 days before establishment of biogas production due to the inhibitory accumulation of volatile fatty acids and low pH over a treatment period of 60 days at 37 °C. Wang et al. [49], while digesting grass silage (20% w/w) and cow manure anaerobically in continuously stirred systems observed a stable microbial community richness. However, when the grass silage mixing ratio was doubled to 40% w/w, there were large variations in the microbial structure. Additionally, Fitamo et al. [35] reported a decrease in the relative abundance of Methanothermobacter and an increase in Methanosarcina upon reduction of the HRT from 20 to 15, and 10 days.
Taken together, operational controls integrate digestion parameters (namely pre-treatment, physicochemical, and biological) by impacting on the various key characteristics of the digestate, thus exerting a selective pressure on the bacterial community that ultimately drives biogas output and digester stability. Therefore, this research aimed to achieve bioenergy production by the targeting of operational controls as a multi-level anaerobic digestion performance enhancer. This was achieved by the application of cost-effective operational parameters of the treatment regime (HRT, working volume, and inoculum source) in a single-stage digester using unmixed conditions at 35 °C for the treatment of GM at high total solids, without exogenous chemical enhancers.
2. Results and Discussion
2.1. Reactor Performance from the Mono-Digestion of Grape Marc
2.1.1. Bioenergy Production
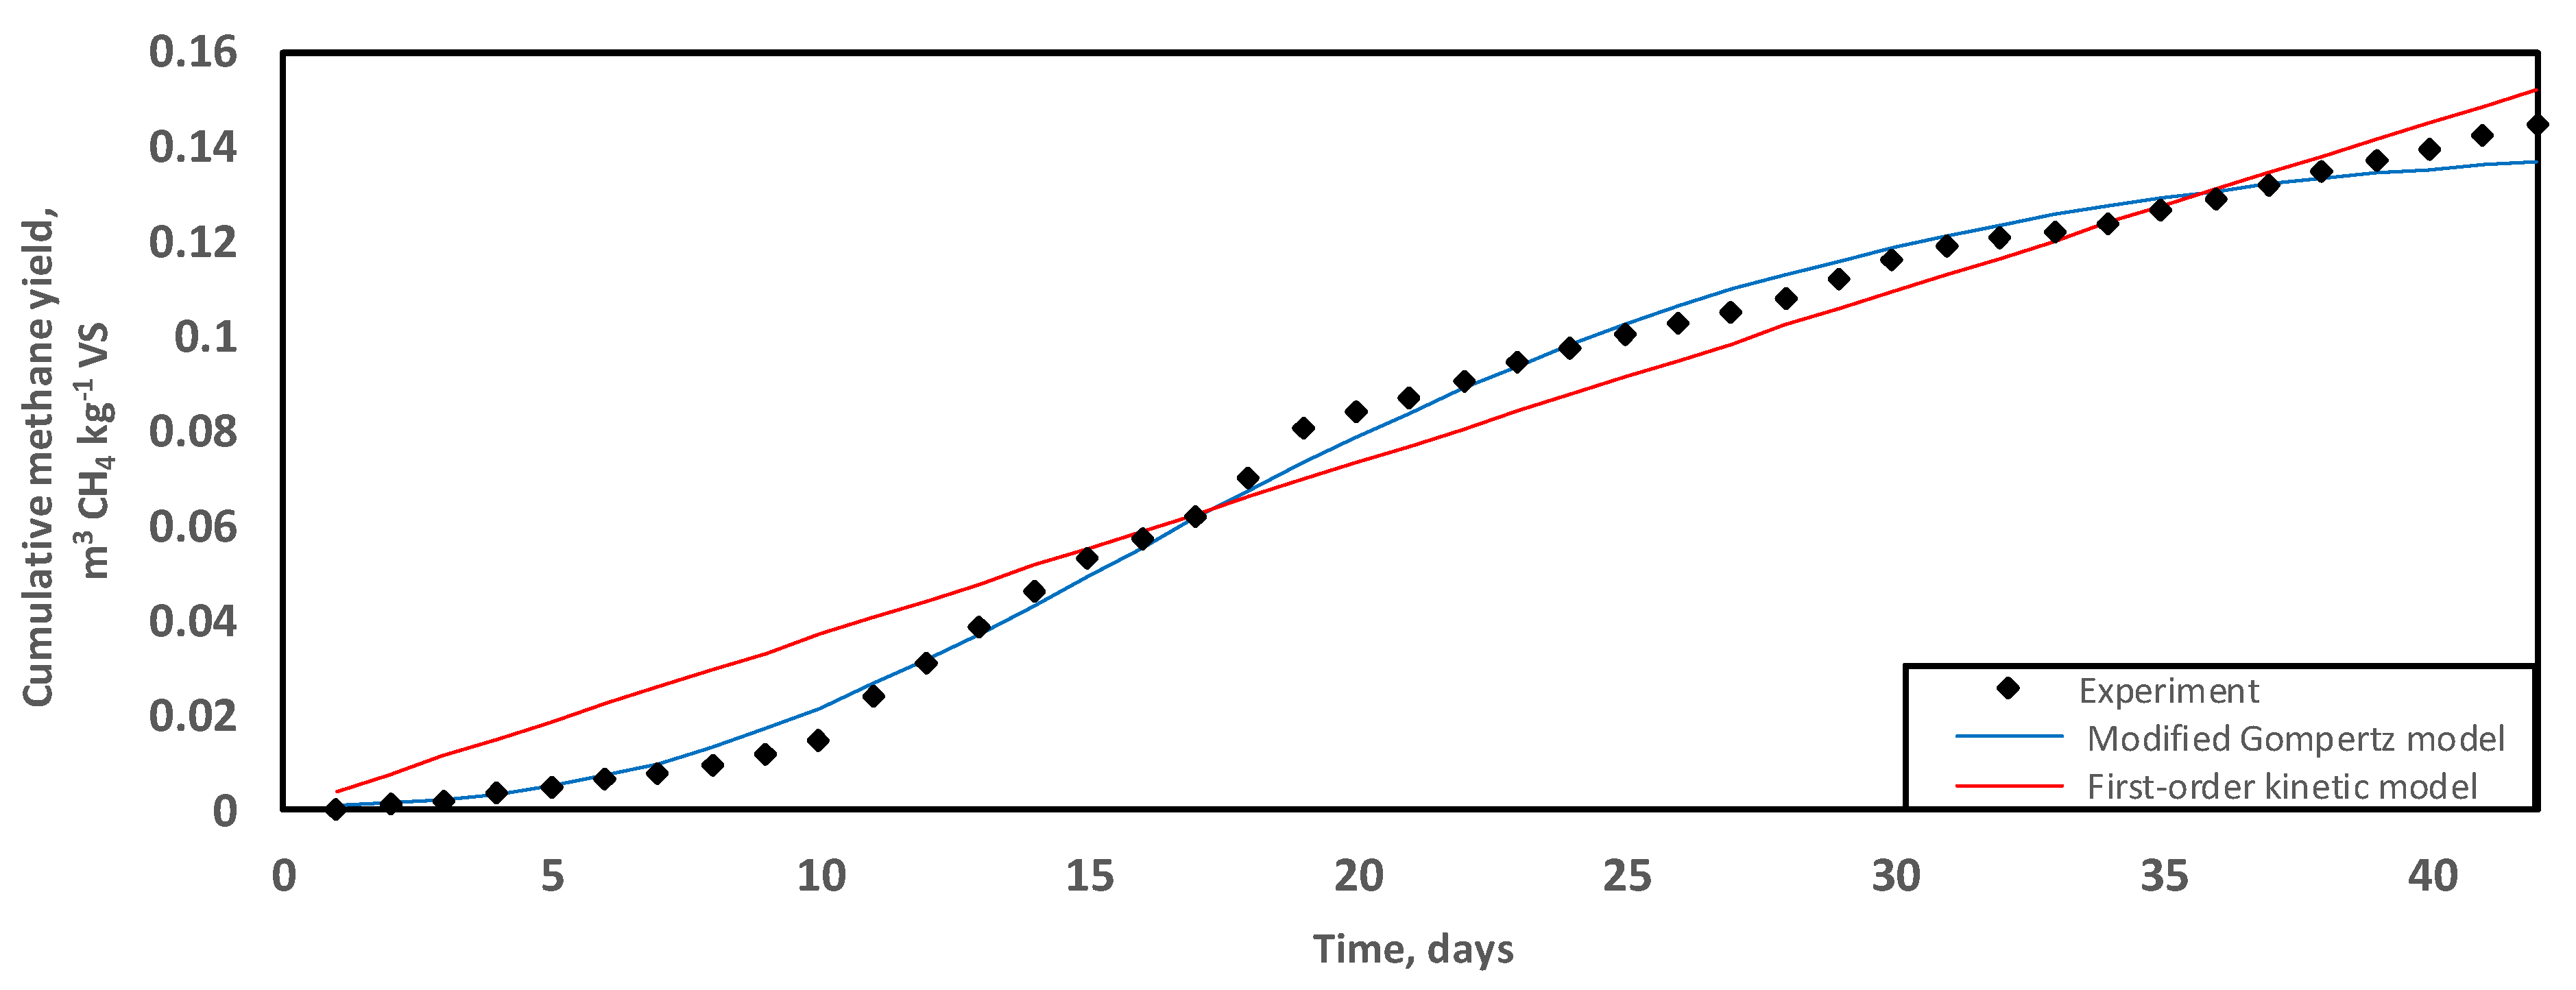
Anaerobic digestion exhibited a predominantly monophasic, linear methane production curve over a treatment period of 42 days at 35 °C (Figure 1). The maximum cumulative SMY equalled 0.145 ± 0.00 m3 CH4 kg−1 VS. On day 19 of treatment, 55% of the overall methane productivity had been extracted from GM. Similarly, Da Ros et al. [50] did not observe a lag time in the establishment of bioenergy production when active microbial consortia were used to inoculate winery residues. Additionally, there was an improved COD/N nutritional composition and the presence of readily digestible soluble compounds in the residues, which accounted for a shortened reactor start-up [15,50].
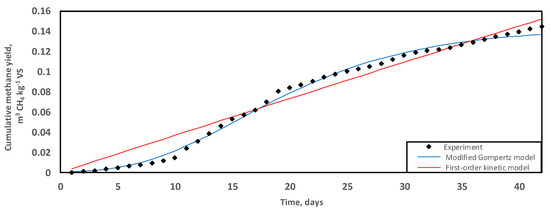
Figure 1.
Trends of methane production (m3 CH4 kg−1 VS) during the digestion of grape marc at 35 °C over a period of 42 days. Experimental data fitted with predictive regression models, the modified Gompertz (blue) and first-order kinetic (red).
The maximum cumulative SMY (0.145 ± 0.00 m3 CH4 kg−1 VS) of the GM mono-digestion for this study was achieved within the limits of a sustainable operation, without requirements for mixing, pH control, and exogenous chemical enhancers. In contrast, Fabbri et al. [29] employed stirred systems supplemented with synthetic nutrients, trace elements, and Na2CO3 for pH adjustment and produced 0.157 m3 CH4 kg−1 and 0.273 m3 CH4 kg−1 for the Nero Buono grape marc and Greco grape marc varieties, respectively. However, research translation into a winery-scale energy production would be impeded by the addition of such exogenous enhancers due to restrictive operating costs and environmental considerations [51,52].
2.1.2. Volumetric Methane Productivity Rate (VMPR)
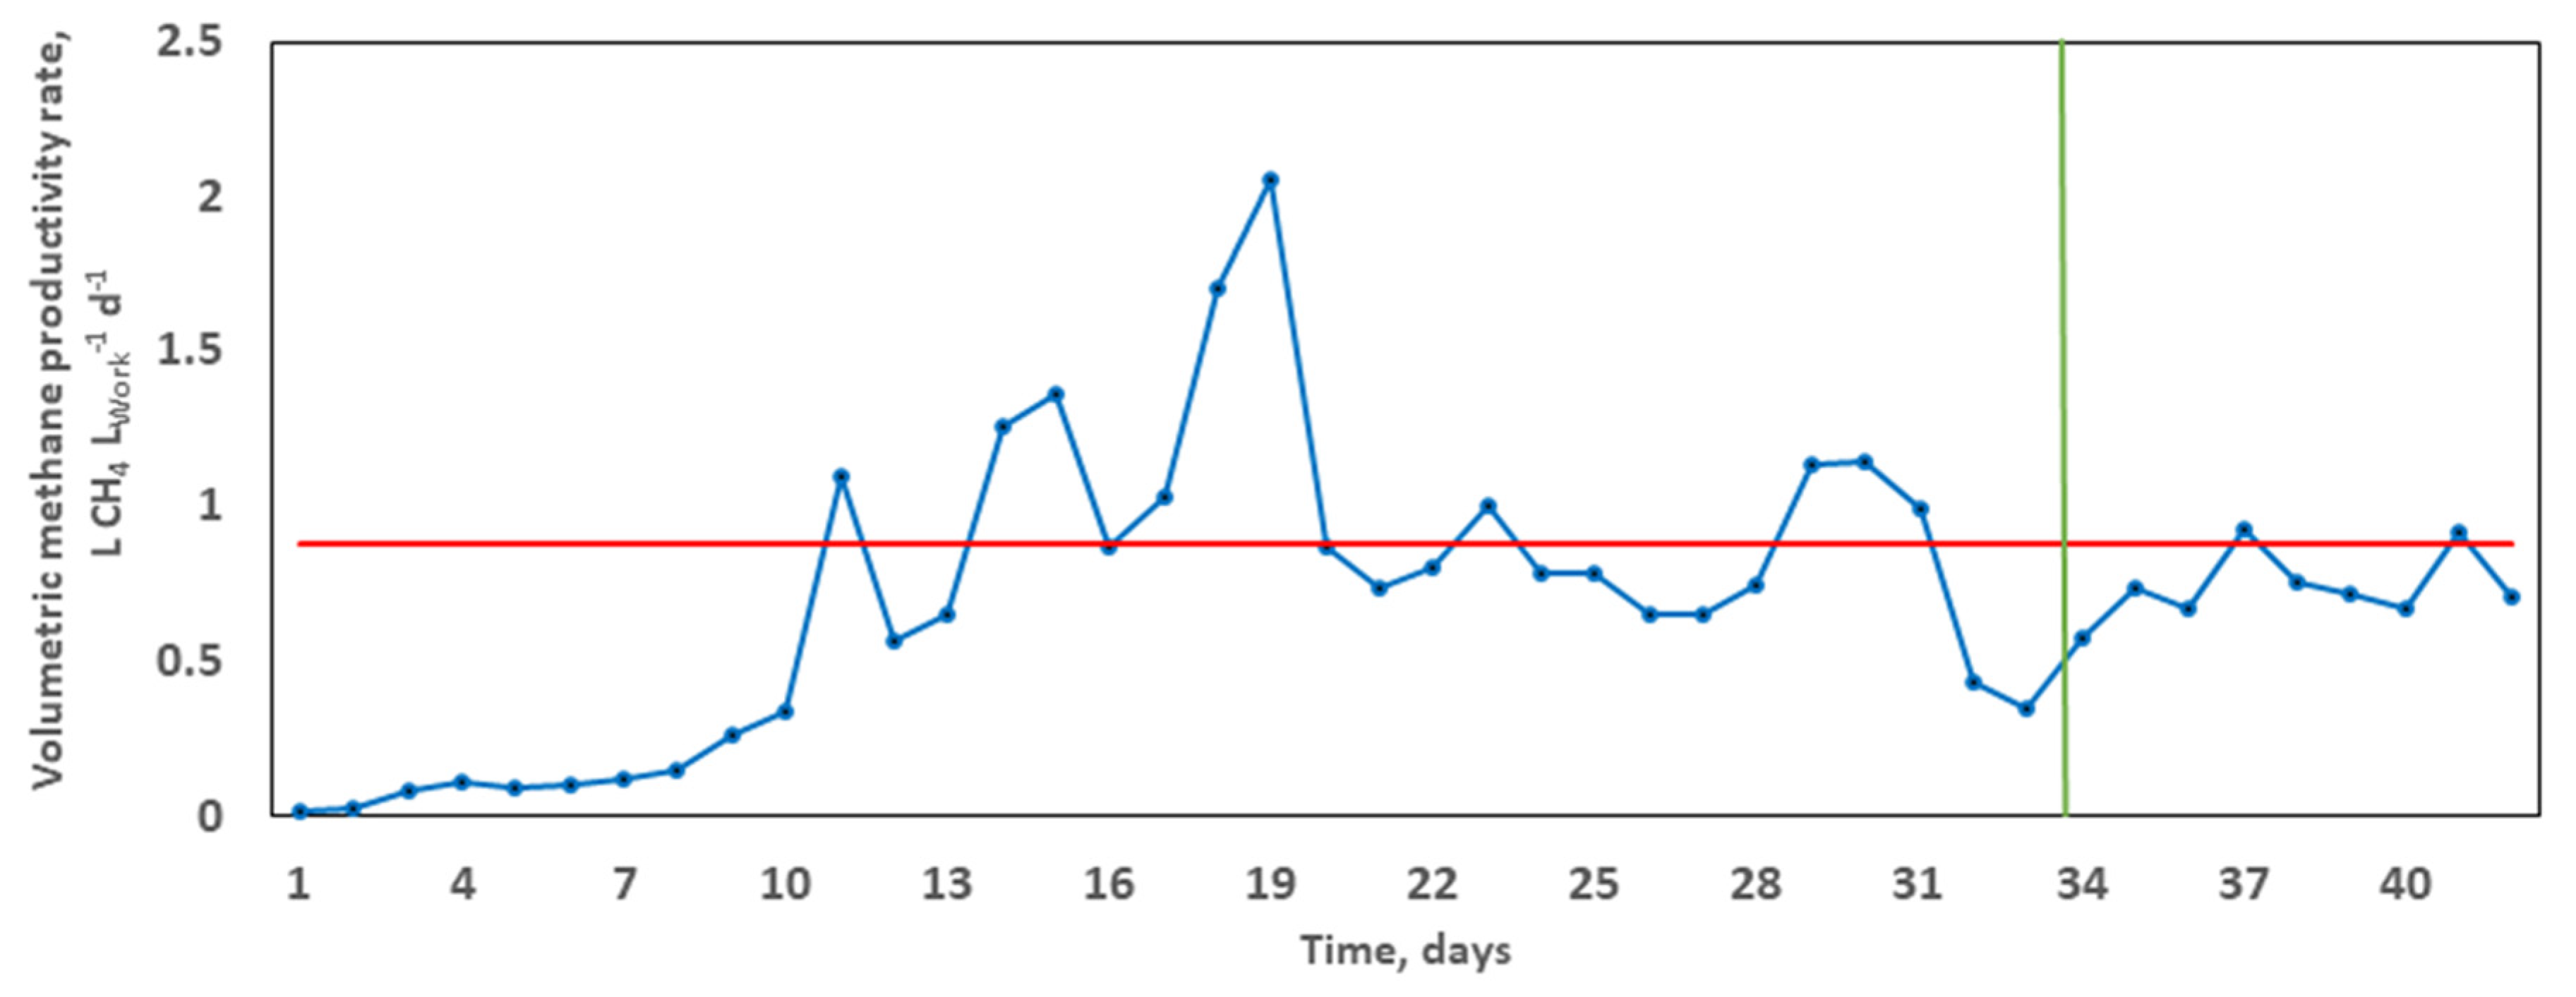
The average specific methane production equalled 38.45 L CH4, corresponding to a calculated average VMPR of 0.8802 L CH4 LWork−1 d−1. It took 33.6 days (x-intercept) to achieve 80% of the overall methane yield (Figure 2). The volumetric methane productivity rate enables satisfactory comparability across studies based on methane extraction, normalised to the overall substrate volume for treatment. For example, in the co-digestion of rape straw and dairy manure, Ma et al. [48] reached lower VMPR values in the range 0.1–0.5 L CH4 LWork−1 d−1, achieving a maximum methane yield of 209.1 mL CH4 g−1 VS and an SIR of 2:3 over 60 days. It can thus be concluded that, at a higher VMPR and shorter HRT, there is the absence of substrate overloading, which is known to result in declined performance and reactor failure [53].
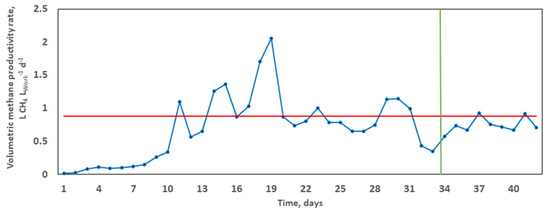
Figure 2.
Typical trend of the volumetric methane productivity rate (VMPR) during the grape marc mono-digestion. The blue curve depicts daily variations. The calculated average VMPR (shown in red) at the corresponding time T80 (x-intercept, shown in green).
2.1.3. Impact of a Fill-and-Draw Inoculum
Mono-digestion at 35 °C required an active inoculum drawn as digestate at day 120 from another GM-based anaerobic digester previously operating at 45 °C. A combination of digestion conditions, such as digestate recirculation as downstream inoculum, allowed for the prior acclimation of microbes to the specific substrate type, resulting in reduced lag time (Figure 1) [54]. Shi et al. [55] observed that, in the treatment of lignocellulosic biomass, a prior acclimation period of the microbes contained in the inoculum was necessary for immediate biogas production in digesters. Additionally, a sufficient contact time reduced the magnitude of the microbial response to potentially toxic compounds, namely excessive levels of ammonia, volatile fatty acids, and heavy metals that can exert bacteriostatic and even bactericidal effects [56,57,58].
2.2. Digestate Characterisation after Treatment
2.2.1. Chemical Oxygen Demand (COD) and Total Kjeldahl Nitrogen (TKN)
The treatment recorded an overall removal of 97 g CODt kg−1, with a daily removal rate of 2.31 g CODt kg−1 d−1. A total of 82.75% of the degraded organic matter was converted to methane.
The TKN and COD values in the effluent were used to approximate the actual nutritional quality of the digestate during reactor runs because not all the nitrogen and carbon present in the feedstock were available for digestion. The COD/N ratio was 28.6/1; following the treatment cycle, nitrogen removal reached 66.67% (Table 1).

Table 1.
Characteristics of the grape marc effluent after mono-digestion in unmixed treatment conditions over 42 days at 35 °C. Values are presented as mean ± standard error.
Gil et al. [59] found that methane production directly correlated with nitrogen removal and that nitrogen accumulation was inhibitory to methanogenesis. Excess nitrogen can lead to excessive ammonia formation, resulting in toxic effects and ultimately reactor failure [60]. A balanced COD/N ratio is required to avoid extremes of nutrient limitation or ammonia toxicity resulting from low and high levels of nitrogen, respectively. In summary, the low CODt and high nitrogen removal provided a suitable nutritional balance to microbes; thus, it was conducive to an increased methane yield [50].
2.2.2. pH
The higher final pH (8.21 ± 0.18) recorded could be attributed to the hydrolytic action on polymers proportional to the hydraulic retention time, resulting in lower cumulative CODt removal (Table 1). However, the accumulation of volatile fatty acids ultimately produced mild acidification in relation to the physicochemical balance at the beginning of the digestion [61]. Additionally, organically-bound nitrogen present in the feedstock can be converted to ammonia that potentially behaved as a base, buffering the volatile acids produced by hydrolytic and acidogenic microbes. These redox reactions adequately neutralised pH fluctuations to maintain favourable metabolic conditions [62].
2.2.3. Electrical Conductivity (EC) and Salinity
EC in the effluent was relatively stable, having lowered to 28.2 ± 1.70 mS cm−1 (9.03% reduction in the initial value). Previous studies correlated high conductivity to methane production and even used conductivity as a predictor for reactor performance [63,64].
Salinity increased to 9.0% in the effluent (Table 1). Microbe-driven solubilisation of polymers is optimal in the salinity range 0.23–0.35 g/L [65]. Throughout treatment, the ionic species and soluble minerals that were initially in the granular state and were organically bound were released into the medium, further raising the salinity. As evidenced by the effluent profiles, salinity positively correlated with a higher SMY.
2.3. Kinetic Results
A kinetic study was carried out by fitting both the first-order and the modified Gompertz models to the experimental data. The predictive parameters and corresponding values of trial results are shown in Table 2. The differences between the measured and the predicted methane production were 5.17% and 5.39% for the first-order kinetic and the modified Gompertz, respectively. In addition, the test statistic root-mean-square deviation (RMSD) was 0.009 m3 CH4 kg−1 VS and 0.003 m3 CH4 kg−1 VS for the first-order kinetic and the modified Gompertz, respectively. In general, the lower the RMSD value, the better the goodness-of-fit.
Table 2.
Kinetic parameters for the grape marc treatment based on the predictive non-linear first-order kinetic and the modified Gompertz models of the process parameters at 35 °C over an incubation period of 42 days.
Both models closely fitted the experimental data. Statistically, the modified Gompertz model would be the better agreement for data fit considering the lower RMSD over the treatment period of 42 days (Table 2). Nevertheless, based on trends in differences between the experimental and predicted methane production, the modified Gompertz model appeared appropriate for short-term treatment where the lag time exerts a greater effect on the maximum cumulative methane produced due to the inhibitory effects of the long-chain fatty acids [29]. The first-order kinetic model improves the fit of data for the long-term because the effect of the initial lag becomes progressively muted as the cumulative methane production rises, hence the apparent linearisation of the methane curve in the final stage of biogas production (Figure 1).
Donoso-Bravo et al. [66] stated that the abundant availability of readily digestible compounds drives predictive simulations towards first-order kinetic mathematical models. However, as observed previously, when cumulative methane production slows down, GM-based progress curves steadily rebalance to the modified Gompertz model [29]. The high content of potassium and lipids in wastes may result in prolonged lag time [54].
Waste management strategies aimed at mitigating the extent of the lag phase to reach stable performance during AD often involve a lengthy preparatory acclimation stage of wastes; a fill-and-draw treatment plant configuration (waste recirculation as subsequent inoculum) to feed the digesters downstream [54], slurry mixing during operation [50], and the lowering of the substrate-to-inoculum ratio [47,67].
2.4. Bacterial Community Structure
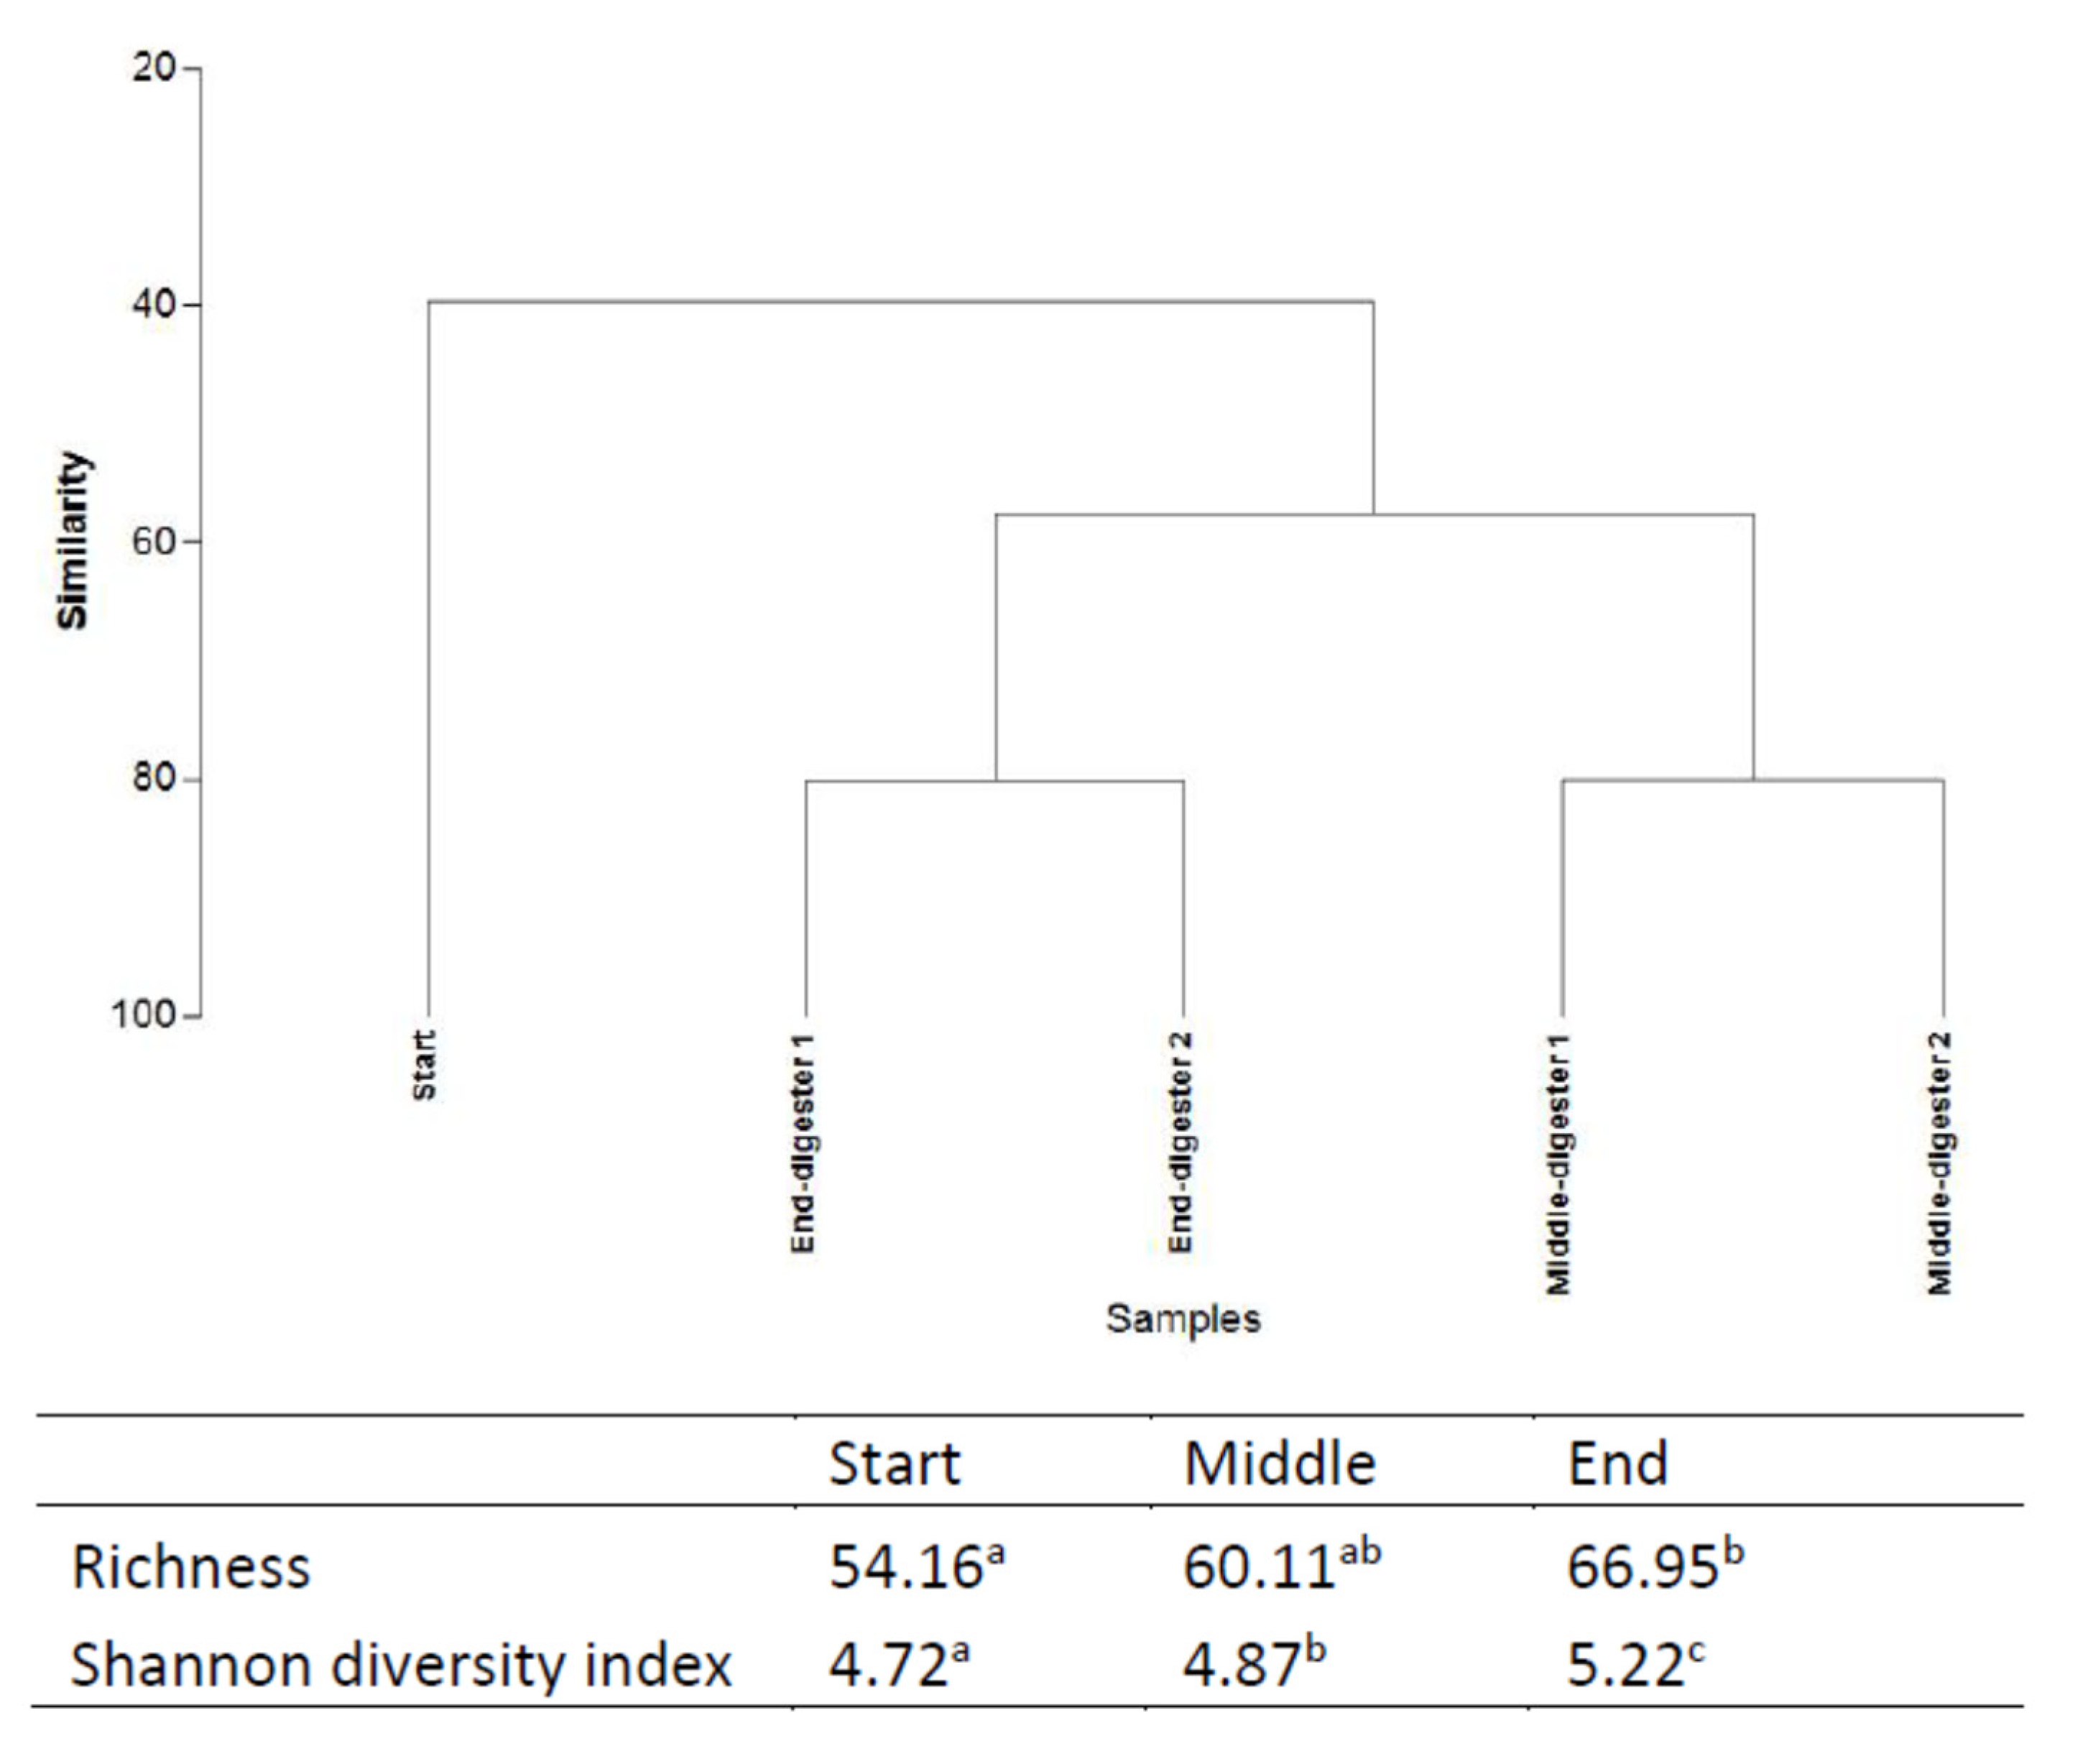
Relating AD performance and microbial community function, molecular analysis was performed through amplicon-based sequencing based on 16S rDNA from digestate samples taken at start-up, during, and at the termination of the digestion [68]. The impact of the selection pressures imposed by the operating parameters and possible functional synergies between the organisms of the bacteriome were evaluated. Both richness and diversity of the bacterial community both during and at the end of the digestion period were significantly increased from day 0 (Figure 3). The Richness index progressively increased from 54.16 (initially) to 60.11 (middle), culminating at 66.95 at the conclusion of treatment. In terms of species richness (total number) and evenness (relative abundance), both correlate to bacterial metabolism rates in ecosystems [68]. For example, in a microcosm study of denitrifying bacterial communities, Wittebolle et al. [69] concluded that both high richness and evenness translated to high metabolic rate (denitrification) among bacterial communities in the presence of salt stress. However, an inverse metabolic trend was observed in the present mono-digestion of GM. Higher richness (66.95) and diversity (5.22) at the termination, in comparison to the middle (richness = 60.11; diversity = 4.87; VMPR = 2.0503 L CH4 LWork−1 d−1) of the digestion correlated to a lower final VMPR (0.7065 L CH4 LWork−1 d−1; Figure 2). Inhibition of methane production is common in AD operations due to the build-up of volatile fatty acids resulting from the faster kinetics in the hydrolysis, acidogenesis, and acetogenesis stages positioned upstream of the generally slower methanogenesis stage, resulting in a drop of final VMPR values, despite increased microbial richness and evenness at the end of the digestion [12].
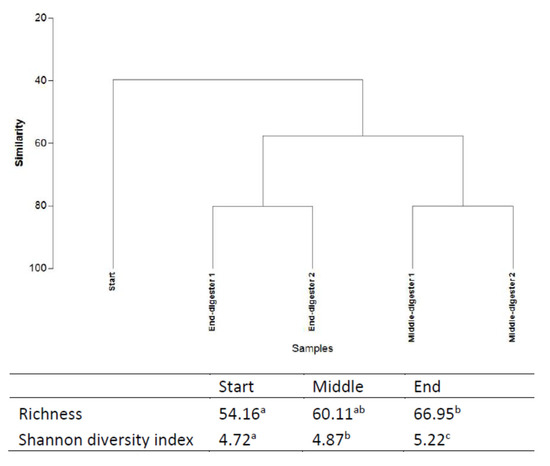
Figure 3.
Cluster analysis (UPGMA method), Richness and Shannon diversity indices based on 16S rDNA sequencing at different time points (start, middle, and end) during the anaerobic digestion (means in the same column with the same letter are not significantly different at p < 0.05). Treatments were conducted in a duplicate anaerobic system (digesters 1 and 2) over 42 days at 35 °C. Letters “a” “b” “c” are indicative of the statistical significance level (where variables are of the same letter, the difference between the means is not statistically significant).
2.5. Bacterial Community Dynamics
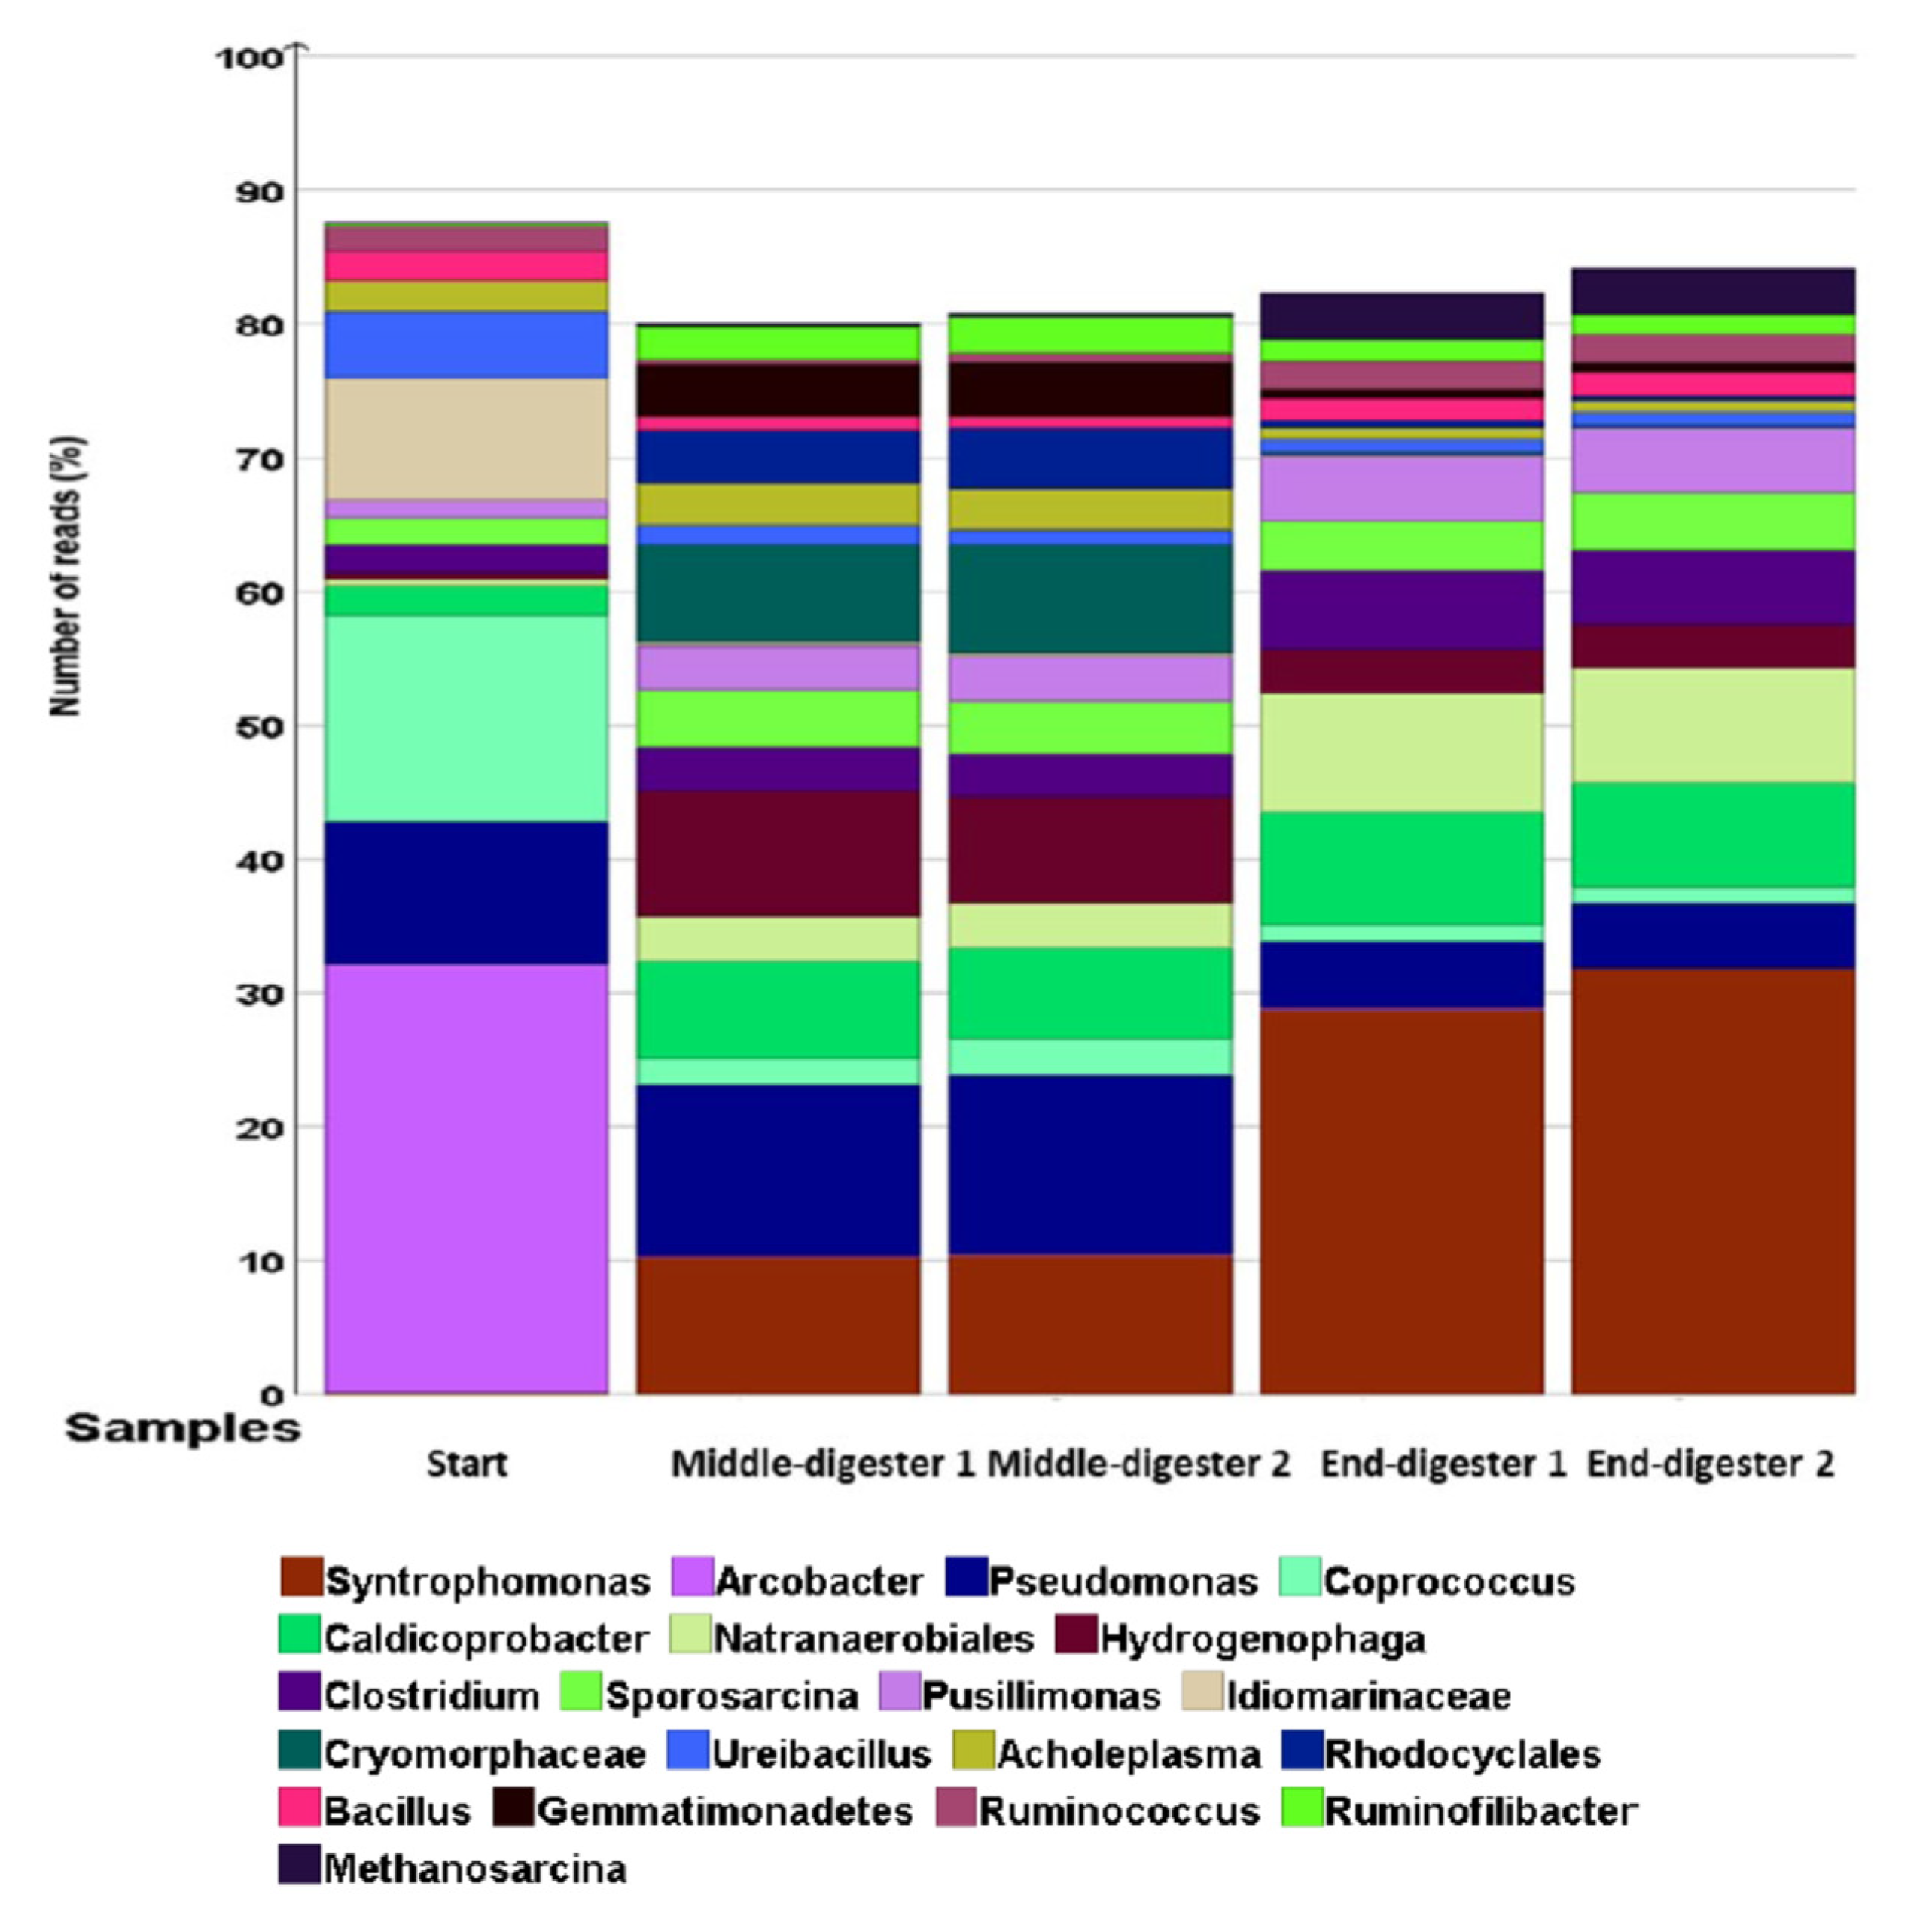
The initial bacterial community was predominantly composed of aerobes that were mainly from Arcobacter (32% of all reads), Pseudomonas (10% of all reads), Idiomarinaceae (10% of all reads), Ureibacillus (5% of all reads), and an amalgamation of other aerobes (Hydrogenophaga, Pusillimonas, Cryomorphaceae, Gemmatimonadetes), making up <2% of the total reads. On day 0, the key anaerobes were from the genera of Coprococcus (16% of all reads reads), Caldicoprobacter (2% of all reads), Clostridium (2% of all reads), Sporosarcina (2% of all reads), Bacillus (2% of all reads), Ruminococcus (2% of all reads), and other Natranaerobiales; Rhodocyclales accounted for <1% of all reads (Figure 4). However, the bacterial profile moved towards anaerobes by the end of the digestion (Figure 4).
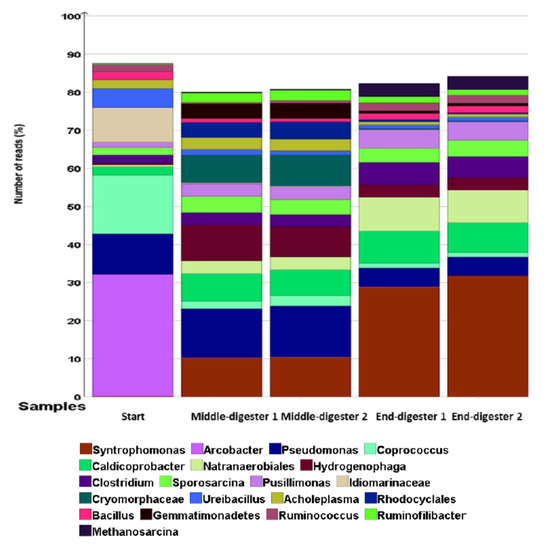
Figure 4.
Relative abundance of bacteria at the genus level based on 16S sequencing at different time points (start, middle, and end) of digestion. Treatments were conducted in a duplicate anaerobic system (digesters 1 and 2) over 42 days at 35 °C. The important genera are shown in the legend.
Because of the depletion of oxygen in the headspace during treatment, there was a reduction in aerobic bacterial populations, especially Pseudomonas, amongst others [70]. Consequently, no detectable aerobic emergent enteropathogen genus of Arcobacter were observed [71]. Similarly, the halophile genus of the Gram-negative Idiomarinaceae decreased to <0.5% of all reads; the genus Ureibacillus reduced to 1% of all reads [72,73]. However, digestion conditions became increasingly favourable to the obligate anaerobes of the genus Caldicoprobacter, increasing to 9% of all reads during the treatment. Other obligate anaerobes of the genus Natranaerobiales increased from <0.5 to 3% of all reads during digestion. Most notably, the population of anoxygenic photoheterotrophic Rhodocyclales increased from <0.1% to 5% of all reads (Figure 4) [74].
At the end of the digestion, the molecular profile was attuned to microbial physiologies better suited to anaerobic conditions. The anaerobic non-phototrophic Syntrophomonas were undetectable in the beginning (<0.1% of all reads) and increasing during the digestion (10% of all reads), reaching 29% of all reads at the end of treatment. In addition, the relative abundance of the Gram-positive population of anaerobic Sporosarcina doubled (from 2% initially, to 4% of all reads). In the same way, an increase in overall richness was observed among anaerobic Clostridium (from 2% of all reads initially, to 6% of all reads), Natranaerobiales (from 2% of all reads, initially, to 9% of all reads), and Caldicoprobacter (from 2% of all reads, initially, to 10% of all reads). Methanogenic Archaea from the genus Methanosarcina represented a clearly identifiable bacterial group at the termination of digestion (from <0.1% of all reads, initially, to 5% of all reads). There was a reduction of the pathogenic Arcobacter to trace levels by the end of the treatment.
In terms of possible symbiotic relationships, the genus Coprococcus is classified as a group for butyrate-producing bacteria [75]. Butyrate, a fermentation intermediate, can be utilised by anaerobic butyrate-degrading bacteria of the Syntrophomonas genus [76,77]. In addition to butyrate, other volatile fatty acids can be digested by Syntrophomonas to produce hydrogen and acetate in a syntrophic dependence on hydrogen-utilising bacteria to reduce carbon dioxide to methane [77]. Concurrently, acetate can be utilised by acetoclastic methanogens such as Methanosarcina, the terminal metabolic group. In addition, the anaerobic genus of the Gram-positive Ruminococcus is known for cellulolytic, pectinolytic and hemicellulolytic activity. Ruminococcus species are capable of degrading organic polymers as their sole carbon source, causing the release of glucose monomers or metabolites for further digestion by adjacent microorganisms [78]. Considering the important hydrolytic functions of Ruminococcus, which release energy from complex polysaccharides to microbes in the microbiome, these anaerobes are regarded as key players in anaerobic ecosystems. Both hydrolytic and fermentative pathways have been reported for organisms assigned to the Firmicutes and Bacteroidetes phyla [68]. Cluster analyses revealed richness of 60% and 19% reads for Firmicutes and Bacteroidetes, respectively. Additionally, Clostridium species were documented in terms of lignocellulosic hydrolysis [35]. Whilst these important microbial groups mediate the upstream metabolic stages of AD for syntrophic electron flow on to Archaea, there may be an accumulation of fermentation products which may in turn inhibit methane production, resulting in a decreased VMPR trend (Figure 2) [12].
It can also be noted from Figure 4 that aerobic Hydrogenophaga and Pusillimonas genera from the Proteobacteria phylum displayed trends of increasing microbial richness from the initial values, despite depleting oxygen levels because of chemoorganotrophic or chemolithoautrophic competence, allowing for oxidation of hydrogen as energy source and CO2 as carbon source [79,80,81]. During the mono-digestion of GM, the CO2 concentration reached a peak of 23.6% of total biogas volume on day 5 of digestion, lowering to 11.4% and 11.0%, on day 20 and 42, respectively. Moreover, the physicochemical composition of the mixed GM and inoculum resulted in highly saline and alkaline conditions suitable for the growth of haloalkaliphiles such as anaerobic Natranaerobiales [82]. Conversely, other known aerobic halophiles such as Idiomarinaceae and Cryomorphaceae could not take advantage of substrate utilisation, likely due to the prolonged unfavourable anoxic environment for growth, and thus they were progressively sieved out of digestion (Figure 4) [73,83].
2.6. Valorisation from Winery Residues
Depending on the magnitude of the grape crush, an economic model, Table 3, was projected from the following parameters: (i) electrical and calorific efficacies of 35% and 40%, respectively [29]; (ii) 362.3 g of CO2 for each kWh produced, in metric tonnes [29]; (iii) Australian average electricity and gas prices of EUR 0.17/kWh and EUR 0.13/MJ, respectively, excluding off-peak tariffs and user discounts [84]; (iv) EUR 9.52 per ACCU, unit by the Clean Energy Regulator as of September 2019; each ACCU issued represents one metric tonne of carbon dioxide equivalent (Mt CO2-e) stored or avoided by a project [85].
Table 3.
An economic simulation of the valorisation from available biomass based on the size of a winery in tandem with a distillery operation (totals may not sum due to rounding). The currency used is EUR (Euro).
In order to achieve the required 35 °C temperature regime for digestion, some form of energy input, such as biogas combustion from a preceding reactor run, would be envisaged [86]. Wineries and GM-based distilleries routinely have an abundant seasonal biomass that can be channelled to anaerobic treatment. An on-site development would reduce collection, transport, and delivery costs to the energy-conversion site. In addition, a fill-and-draw AD operational model for a winery-wide scale, involving the reuse of digestate to drive downstream digesters configured as industrial tubular reactors, would further reinforce the tenets for an economy of proximity. Improvements in methane production efficiencies from winery residues would further offset the investment and running costs of AD [13,87].
Taking into consideration the escalating year-on-year electricity and gas tariffs as well as technological advancements in energy conversion systems, wineries would increasingly capture economic value when investing in the anaerobic treatment of GM as an integrated step in a waste valorisation strategy. Additionally, the CO2 avoidance achieved during GM treatment can be further capitalised on carbon credit trading platforms (Table 3). These proactive measures would translate into energy cost-savings and self-reliance, as well as the exporting of energy surplus to the power grid, seasonally.
3. Materials and Methods
3.1. Substrate Characterisation and Analytical Methods
Dried GM that had undergone prior distillation for alcohol recovery was sourced from Tarac Technologies, Australia. Grape marc was milled with the use of a household blender to obtain mass homogeneity with particle sizes of 1–2 mm [47,88] and stored at 4 °C until use [67]. The methanogenic inoculum was sampled, in a fill-and-draw approach, from an active 120-day laboratory-scale digester of composition 3/1 grape marc and cheese whey, respectively, operating at 45 °C. The characterisation parameters reported in Table 4 were determined, in triplicate, on the digestion content before and after incubation. The solids, COD, and the total Kjeldahl nitrogen (TKN) were determined according to standard methods [89]. Briefly, the total chemical oxygen demand (CODt) was determined by sample digestion with manufacturer-provided reagents in a HACH DRB 200 heating block with values read on a HACH DR 900 colorimeter. The soluble COD (CODs) in the liquid fraction was determined by first spinning down samples in a centrifuge at 13,000 rpm for 5 min and then determining the COD of the supernatant, as described previously. Total solids (TS) were determined by subjecting 100 g of samples to 105 °C dry heating in an oven for 24 h, cooled in a desiccator and weighed followed by incubation in a furnace at 550 °C for 2 h for determination of volatile solids (VS) with an intervening cooling down before weighing. For bacterial analysis, 5 g of digestate was also sampled during the digestion as well as at the beginning and end. HANNA Instruments edgepH was used to measure pH. Salinity and conductivity were determined by means of a Compact Salt Meter (LAQUAtwin-Salt-11, HORIBA Scientific, Kyoto, Japan) and a Compact Conductivity Meter (LAQUAtwin-CC-11, HORIBA Scientific), respectively.
Table 4.
Analytical characterisation of the grape marc-based reactor setup and inocula at reactor start-up before treatment at 35 °C; data reported as mean ± standard error.
3.2. Substrate-to-Inoculum Ratio (SIR)
Ma et al. [48] reported that a high SIR resulted in a considerable lag, accumulation of volatile fatty acids, and low pH. In contrast, reactors operating at lower SIR values were defined by increased microbial activity, high volumetric methane productivity, high daily methane yield, and retracted lag [48]. Motte et al. [47] concluded that low SIR exerted a substantial positive impact on the start-up phase, resulting in the early production of methane in the anaerobic treatment of lignocellulosic substrates. Previously, in the co-digestion of solid winery wastes and agri-industrial dairy wastes, Kassongo et al. [90] used 10:1 SIR. Understanding the importance of SIR on reactor performance, the study of the dynamic effect of methane production further lowered the SIR to 10:3 for the mesophilic mono-digestion of marc.
3.3. Methane Production and Performance Monitoring
The treatment conditions required an inoculum previously acclimatised to GM; the SIR was at 10:3 (wet weight basis) and the working volume (VW) reached 1.3 kg. Before digestion at 35 °C, GM and inoculum were thoroughly mixed; there was no subsequent mixing or substrate feeding during digestion.
The batch mode treatment configuration closely mimics the characteristics of an ideal plug-flow reactor comparable to industrial tubular reactors for the treatment of solid-state organic wastes, with an assumed reaction rate proportional to the reactant concentration [87]. The study was conducted in a W8 Anaerobic Digester (Armfield, Ringwood, UK); the temperature was raised to 35 °C in a single step [50].
Biogas was determined by water displacement in cylinders paired with the reaction vessels [50]. The biogas composition was measured in a GEM2000 Landfill Gas Analyser (Geotech, Coventry, UK). The specific methane yield (SMY) of the digestion setups corresponded to the cumulative methane fraction of the biogas as a function of the volatile solids (VS) as digestion progressed; SMY is expressed as m3 CH4 kg−1 VS. Blank assays, without substrate, were conducted for the determination of the residual methane potential of the inoculum [19].
3.4. Volumetric Methane Productivity Rate (VMPR)
The VMPR is the daily methane produced (L) per unit working volume of the reactor. VMPR is expressed as L CH4 LWork−1 d−1 [48,91]. The average VMPR that describes the whole digestion process is calculated according to Equation (1):
where V2 is the reactor working volume (L) and T80 is the shortest technical digestion time (d) calculated according to the time for the cumulative methane volume to achieve 80% of V1.
3.5. Biodegradability Index (BI)
The BI, in %, was calculated using the theoretical methane potential (B0) determined based on the COD removed and that a maximum 350 mL of methane emissions can be extracted from 1 g of COD daily, using Equation (2):
3.6. Regression Models for Data Fit
To describe the biomethanation process, non-linear regressions were utilised [29,92]. The degradation of organics was assumed to be patterned along with a first-order rate of decay due to the microbial role in the fermentation process; thus, the first-order equation (Equation (3)) is as follows:
where B(t) is the cumulative methane volume (m3 CH4 kg−1 VS) at a digestion time t (d), B0 is the methane potential of the substrate material (m3 CH4 kg−1 VS), k is the first-order disintegration rate constant (d−1), and t is the digestion time (d).
To estimate the lag phase, a modified Gompertz model was simulated (Equation (4)):
where Rm is the maximal methane production rate (m3 CH4 kg−1 VS d−1) and λ is the lag phase (d); all mathematical models were simulated with the Solver tool of Microsoft Office Excel.
3.7. Microbial DNA Isolation and Sequencing
An aliquot (0.25g) of digestate samples (in duplicate) were processed for DNA extraction using a PowerSoil® DNA Isolation Kit (Mo Bio Laboratories, Carlsbad, CA, USA). Purified DNA samples were sent to AGRF (Westmead, Australia) for Next Generation Sequencing in Illumina’s MiSeq platform. Primer, PCR, and library preparations were prepared according to AGRF guidelines. Illuminabcl2fastq 2.20.0.422 pipeline was then used to generate the sequence data. Diversity profiling analysis was performed with QIIME 2 2019.7 [93]. The demultiplexed raw reads were primer trimmed and quality filtered using the cutadapt plugin followed by denoising with DADA2 (via q2-dada2) [94]. Taxonomy was assigned to ASVs using the q2-feature classifier classify-sklearn naïve Bayes taxonomy Taxonomic classifier [95]. Results were then analysed on PRIMERS7 and MEGAN 6 in terms of cluster analysis, Shannon diversity, and richness. Community composition was conducted at the genus level using Bray–Curtis similarity via non-metric multidimensional scaling.
3.8. Statistical Analyses
Mean values ± standard error were reported for the study. Experimental data were processed in the statistical computer programs GraphPad Prism v. 7.02 and SPSS v. 23. Statistical significance at the level of p < 0.05 was evaluated by multivariate one-way ANOVA. Means were separated using Tukey’s HSD posthoc parametric test, where the F-value was significant, by comparing the differences between means of values [96].
4. Conclusions
Based on the experiments conducted with grape marc, there was a cost-effective regulation of operational parameters such as inoculum sourcing, substrate-to-inoculum ratio, digester working volume, and hydraulic residence time, collectively impacting on the overall bioenergy production profile and the attainable remediation levels of winery residues. A fill-and-draw approach for digestate recirculation as an incoming downstream inoculum allowed for sufficient acclimation time between microbes and the substrate type, resulting in a shortened lag in subsequent treatment setups, additionally reducing operating costs and increasing treatment efficiency. A higher inoculum dose (10:3 SIR) in the reaction mixture naturally increased the bio-catalytic density. These operational adjustments, without requirements for exogenous synthetic enhancers, improved the inherent catalytic capabilities of the digestion cycle and provided abundant readily digestible compounds for the short-term, and slowly biodegradable substrates for the long-term treatments. The results were in line with previous studies where operational regulation positively impacted anaerobic treatment.
There was sanitisation of the digestate by the removal of known potential zoonotic Arcobacter by the end of digestion. Additionally, consortia of anaerobic hydrolytic and fermentative Firmicutes and Bacteroidetes were core microorganisms in the digester, representing nearly 80% of the microbial community. Archaea from the Methanosarcina genus were credited with methane production through acetoclastic methanogenesis. The maximum cumulative methane productivity achieved after the grape marc treatment was 0.145 m3 CH4 kg−1 VS. Economic simulations for valorisation from grape marc through investments in anaerobic digestion technology showed potential for a seasonal revenue stream for wineries through energy savings and commercialisation of excess energetic equivalents and carbon credits, further entrenching an economy of proximity.
Future research will explore the impact of lower substrate-to-inoculum ratios on reactor performance and target progressive microbial community engineering during anaerobic digestion of grape marc.
Author Contributions
Conceptualization, J.K., E.S. and A.S.B.; methodology, J.K. and E.S.; software, E.S.; validation, J.K., E.S. and A.S.B.; formal analysis, J.K., E.S. and A.S.B.; investigation, J.K.; resources, E.S. and A.S.B.; data curation, J.K., E.S. and A.S.B.; writing—original draft preparation, J.K.; writing—review and editing, E.S. and A.S.B.; visualization, J.K., E.S. and A.S.B.; supervision, E.S. and A.S.B.; project administration, A.S.B.; funding acquisition, A.S.B. All authors have read and agreed to the published version of the manuscript.
Funding
Commonwealth Government of Australia: RTP Scholarship.
Institutional Review Board Statement
Not applicable.
Informed Consent Statement
Not applicable.
Data Availability Statement
The data presented in this study are available on request from the corresponding author.
Acknowledgments
The authors would like to thank the Commonwealth Government of Australia for having provided financial support through the Research Training Program Scholarship.
Conflicts of Interest
The authors declare no conflict of interest.
Sample Availability
Samples of the compounds in this article are not available from the authors.
References
- FAOSTAT. Food and Agriculture Organization of the United Nations. 2018. Available online: http://www.fao.org/faostat/en/#data/QC (accessed on 5 April 2020).
- Rajković, M.B.; Minić, D.P.; Milinčić, D.; Zdravković, M. Circular economy in food industry. Zast. Mater. 2020, 61, 229–250. [Google Scholar] [CrossRef]
- García-Lomillo, J.; González-SanJosé, M.L. Applications of wine pomace in the food Industry: Approaches and functions. Compr. Rev. Food Sci. Food Saf. 2017, 16, 3–22. [Google Scholar] [CrossRef]
- Toscano, G.; Riva, G.; Duca, D.; Pedretti, E.F.; Corinaldesi, F.; Rossini, G. Analysis of the characteristics of the residues of the wine production chain finalized to their industrial and energy recovery. Biomass Bioenergy 2013, 55, 260–267. [Google Scholar] [CrossRef]
- Kiger, P.J. What Do Winemakers Do with Grape Waste? How Stuff Works. 2018. Available online: https://science.howstuffworks.com/environmental/green-tech/sustainable/what-do-winemakers-do-with-grape-waste.htm (accessed on 6 April 2020).
- Luga, M.; Mironeasa, S. Potential of grape byproducts as functional ingredients in baked goods and pasta. Compr. Rev. Food Sci. Food Saf. 2020, 19, 2473–2505. [Google Scholar]
- Pedroza, M.A.; Carmona, M.; Pardo, F.; Salinas, M.R.; Zalacain, A. Waste grape skins thermal dehydration: Potential release of colour, phenolic and aroma compounds into wine. CyTA J. Food 2012, 10, 225–234. [Google Scholar] [CrossRef]
- Lorenzo, J.M.; Sineiro, J.; Amado, I.R.; Franco, D. Influence of natural extracts on the shelf life of modified atmosphere-packaged pork patties. Meat Sci. 2014, 96, 526–534. [Google Scholar] [CrossRef]
- Stoll, L.; Costa, T.M.H.; Jablonski, A.; Flôres, S.H.; de Oliveira Rios, A. Microencapsulation of anthocyanins with different wall materials and its application in active biodegradable films. Food Bioprocess Technol. 2016, 9, 172–181. [Google Scholar] [CrossRef]
- Antonić, B.; Jančíková, S.; Dordević, D.; Tremlová, B. Grape pomace valorization: A systematic review and meta-analysis. Foods 2020, 9, 1627. [Google Scholar] [CrossRef]
- Baere, D.L. Anaerobic digestion of solid waste: State-of-the-art. Water Sci. Technol. 2000, 41, 283–290. [Google Scholar] [CrossRef]
- Chen, Y.; Cheng, J.J.; Creamer, K.S. Inhibition of anaerobic digestion process: A review. Bioresour. Technol. 2008, 99, 4044–4064. [Google Scholar] [CrossRef]
- Mata-Alvarez, J.; Dosta, J.; Macé, S.; Astals, S. Co-digestion of solid wastes: A review of its uses and perspectives including modelling. Crit. Rev. Biotechnol. 2011, 31, 99–111. [Google Scholar] [CrossRef]
- Makadia, T.; Shahsavari, E.; Adetutu, E.M.; Sheppard, P.J.; Ball, A.S. Effect of anaerobic co-digestion of grape marc and winery wastewater on energy production. Aust. J. Crop Sci. 2016, 10, 57–61. [Google Scholar]
- Da Ros, C.; Cavinato, C.; Pavan, P.; Bolzonella, B. Mesophilic and thermophilic anaerobic co-digestion of winery wastewater sludge and wine lees: An integrated approach for sustainable wine production. J. Environ. Manag. 2017, 203, 745–752. [Google Scholar] [CrossRef]
- Muhlack, R.A.; Potumarthi, R.; Jeffery, D.W. Sustainable wineries through waste valorisation: A review of grape marc utilisation for value-added products. Waste Manag. 2018, 72, 99–118. [Google Scholar] [CrossRef]
- Ahmad, B.; Yadav, V.; Yadav, A.; Rahman, R.U.; Yuan, W.Z.; Li, Z.; Wang, X. Integrated biorefinery approach to valorize winery waste: A review from waste to energy perspectives. Sci. Total Environ. 2020, 719, 137315. [Google Scholar] [CrossRef] [PubMed]
- Lee, W.S.; Chua, A.S.M.; Yeoh, H.K.; Ngoh, G.C. A review of the production and applications of waste-derived volatile fatty acids. Chem. Eng. J. 2014, 235, 83–99. [Google Scholar] [CrossRef]
- Pellera, F.-M.; Gidarakos, E. Microwave pretreatment of lignocellulosic agroindustrial waste for methane production. J. Environ. Chem. Eng. 2017, 5, 352–365. [Google Scholar] [CrossRef]
- Pellera, F.-M.; Gidarakos, E. Chemical pretreatment of lignocellulosic agroindustrial waste for methane production. Waste Manag. 2018, 71, 689–703. [Google Scholar] [CrossRef] [PubMed]
- Tyagi, V.K.; Güelfo, L.A.F.; Zhou, Y.; Gallego, C.J.A.; Garcia, L.I.R.; Ng, W.J. Anaerobic co-digestion of organic fraction of municipal solid waste (OFMSW): Progress and challenges. Renew. Sustain. Energy Rev. 2018, 93, 380–399. [Google Scholar] [CrossRef]
- Kumar, A.; Samadder, S.R. Performance evaluation of anaerobic digestion technology for energy recovery from organic fraction of municipal solid waste: A review. Energy 2020, 197, 117253. [Google Scholar] [CrossRef]
- Tian, X.; Trzcinski, A.P.; Lin, L.L.; Ng, W.J. Impact of ozone assisted ultrasonication pre-treatment on anaerobic digestibility of sewage sludge. J. Environ. Sci. 2015, 33, 29–38. [Google Scholar] [CrossRef] [PubMed] [Green Version]
- Blank, A.; Hoffmann, E. Upgrading of a co-digestion plant by implementation of a hydrolysis stage. Waste Manag. Res. 2011, 29, 1145–1152. [Google Scholar] [CrossRef]
- Güelfo, L.F.; Álvarez-Gallego, C.; Sales, D.; Romero, L.I. The use of thermochemical and biological pretreatments to enhance organic matter hydrolysis and solubilization from organic fraction of municipal solid waste (OFMSW). Chem. Eng. J. 2011, 168, 249–254. [Google Scholar] [CrossRef]
- Güelfo, L.F.; Álvarez-Gallego, C.; Márquez, D.S.; Romero García, L.I. Biological pretreatment applied to industrial organic fraction of municipal solid wastes (OFMSW): Effect on anaerobic digestion. Chem. Eng. J. 2011, 172, 321–325. [Google Scholar] [CrossRef]
- Hidalgo, D.; Sastre, E.; Gómez, M.; Nieto, P. Evaluation of pre-treatment processes for increasing biodegradability of agro-food wastes. Environ. Technol. 2012, 33, 1497–1503. [Google Scholar] [CrossRef]
- Affes, R.; Palatsi, J.; Flotats, X.; Carrere, H.; Steyer, J.-P.; Battimelli, A. Saponification pretreatment and solids recirculation as a new anaerobic process for the treatment of slaughterhouse waste. Bioresour. Technol. 2013, 131, 460–467. [Google Scholar] [CrossRef] [PubMed]
- Fabbri, A.; Bonifazi, G.; Serranti, S. Micro-scale energy valorization of grape marc wastes in winery production plants. Waste Manag. 2015, 36, 156–165. [Google Scholar] [CrossRef] [PubMed]
- Monte, J.A.; Rico, C. Biogas potential of wastes and by-products of the alcoholic beverage production industries in the Spanish region of Cantabria. Appl. Sci. 2020, 10, 7481. [Google Scholar] [CrossRef]
- Dinuccio, E.; Balsari, P.; Gioelli, F.; Menardo, S. Evaluation of the biogas productivity potential of some Italian agro-industrial biomasses. Bioresour. Technol. 2010, 101, 3780–3783. [Google Scholar] [CrossRef] [PubMed]
- Lee, J.Y.; Lee, S.H.; Park, H.D. Enrichment of specific electro-active microorganisms and enhancement of methane production by adding granular activated carbon in anaerobic reactors. Bioresour. Technol. 2016, 205, 205–212. [Google Scholar] [CrossRef]
- Baek, G.; Jung, H.; Kim, J.; Lee, C. A long-term study on the effect of magnetite supplementation in continuous anaerobic digestion of dairy effluent—Magnetic separation and recycling of magnetite. Bioresour. Technol. 2017, 241, 830–840. [Google Scholar] [CrossRef]
- Suanon, F.; Sun, Q.; Li, M.; Cai, X.; Zhang, Y.; Yan, Y.; Yu, C.P. Application of nanoscale zero valent iron and iron powder during sludge anaerobic digestion: Impact on methane yield and pharmaceutical and personal care products degradation. J. Hazard. Mater. 2017, 321, 47–53. [Google Scholar] [CrossRef]
- Fitamo, T.; Treu, L.; Boldrin, A.; Sartori, C.; Angelidaki, I.; Scheutz, C. Microbial population dynamics in urban organic waste anaerobic co-digestion with mixed sludge during a change in feedstock composition and different hydraulic retention times. Water Res. 2017, 118, 261–271. [Google Scholar] [CrossRef] [Green Version]
- Zamanzadeh, M.; Hagen, L.H.; Svensson, K.; Linjordet, R.; Horn, S.J. Biogas production from food waste via co-digestion and digestion- effects on performance and microbial ecology. Sci. Rep. 2017, 7, 17664. [Google Scholar] [CrossRef] [PubMed]
- Saha, S.; Basak, B.; Hwang, J.-H.; Salama, E.-S.; Chatterjee, P.K.; Jeon, B.-H. Microbial Symbiosis: A Network towards Biomethanation. Trends Microbiol. 2020, 28, 968–984. [Google Scholar] [CrossRef]
- Zitomer, D.; Maki, J.; Venkiteshwaran, K.; Bocher, B. Relating anaerobic digestion microbial community and process function. Microbiol. Insights 2016, 8, 37. [Google Scholar]
- Tenreiro, S.; Nobre, M.F.; Rainey, F.A.; Miguel, C.; da Costa, M.S. Thermonema rossianum sp. nov., a new thermophilic and slightly halophilic species from saline hot springs in Naples, Italy. Int. J. Syst. Bacteriol. 1997, 47, 122–126. [Google Scholar] [CrossRef] [PubMed] [Green Version]
- Lebrato, J.; Pérez-Rodríguez, J.; Maqueda, C. Domestic solid waste and sewage improvement by anaerobic digestion: A stirred digester. Resour. Conserv. Recycl. 1995, 13, 83–88. [Google Scholar] [CrossRef]
- Edelmann, W. Co-digestion of organic solid waste and sludge from sewage treatment. Water Sci. Technol. 2000, 41, 213–221. [Google Scholar] [CrossRef]
- Kim, H.-W.; Han, S.-K.; Shin, H.-S. The optimisation of food waste addition as a co-substrate in anaerobic digestion of sewage sludge. Waste Manag. Res. 2003, 21, 515–526. [Google Scholar] [CrossRef] [PubMed]
- Leonzio, G. Biogas produced from different feedstocks in anaerobic digesters. In Nanotechnology in Oil and Gas Industries; Springer: Cham, Switzerland, 2017; pp. 291–338. [Google Scholar]
- Bres, P.; Beily, M.E.; Young, B.J.; Gasulla, J.; Butti, M.; Crespo, D.; Candal, R.; Komilis, D. Performance of semi-continuous anaerobic co-digestion of poultry manure with fruit and vegetable waste and analysis of digestate quality: A bench scale study. Waste Manag. 2018, 82, 276–284. [Google Scholar] [CrossRef]
- Ganesh, K.S.; Sridhar, A.; Vishali, S. Utilization of fruit and vegetable waste to produce value-added products: Conventional utilization and emerging opportunities—A review. Chemosphere 2022, 287, 132221. [Google Scholar] [CrossRef]
- Karim, K.; Hoffmann, R.; Klasson, K.T.; Al-Dahhan, M.H. Anaerobic digestion of animal waste: Effect of mode of mixing. Water Res. 2005, 9, 3597–3606. [Google Scholar] [CrossRef] [PubMed]
- Motte, J.; Escudié, R.; Bernet, N.; Delgenés, J.P.; Steyer, J.P.; Dumas, C. Dynamic effect of total solid content, low substrate/inoculum ratio and particle size on solid-state anaerobic digestion. Bioresour. Technol. 2013, 144, 141–148. [Google Scholar] [CrossRef] [PubMed]
- Ma, X.; Jiang, T.; Chang, J.; Tang, Q.; Luo, T.; Cui, Z. Effect of substrate to inoculum ratio on biogas production and microbial community during hemi-solid-state batch anaerobic co-digestion of rape straw and dairy manure. Appl. Biochem. Biotechnol. 2019, 189, 884–902. [Google Scholar] [CrossRef] [PubMed]
- Wang, H.; Tolvanen, K.; Lehtomäki, A.; Puhakka, J.; Rintala, J. Microbial community structure in anaerobic co-digestion of grass silage and cow manure in a laboratory continuously stirred tank reactor. Biodegradation 2010, 21, 135–146. [Google Scholar] [CrossRef]
- Da Ros, C.; Cavinato, C.; Pavan, P.; Bolzonella, B. Renewable energy from thermophilic anaerobic digestion of winery residue: Preliminary evidence from batch and continuous lab-scale trials. Biomass Bioenergy 2016, 91, 150–159. [Google Scholar] [CrossRef]
- McKendry, P. Energy production from biomass (part 2): Conversion technologies. Bioresour. Technol. 2002, 83, 47–54. [Google Scholar] [CrossRef]
- Carlu, E.; Truong, T.; Kundevski, M. Biogas Opportunities for Australia; ENEA Consulting: Paris, France, 2019. [Google Scholar]
- Xu, F.; Wang, F.; Lin, L.; Li, Y. Comparison of digestate from solid anaerobic digesters and dewatered effluent from liquid anaerobic digesters as inocula for solid state anaerobic digestion of yard trimmings. Bioresour. Technol. 2016, 200, 753–760. [Google Scholar] [CrossRef] [PubMed] [Green Version]
- Carucci, G.; Carrasco, F.; Trifoni, K.; Majone, M.; Beccari, M. Anaerobic digestion of food industry waste: Effect of codigestion on methane yield. J. Environ. Eng. 2005, 131, 1037–1045. [Google Scholar] [CrossRef]
- Shi, J.; Wang, Z.; Stiverson, J.A.; Yu, Z.; Li, Y. Reactor performance and microbial community dynamics during solid-state anaerobic digestion of corn stover at mesophilic and thermophilic conditions. Bioresour. Technol. 2013, 136, 574–581. [Google Scholar] [CrossRef]
- Hansen, K.H.; Angelidaki, I.; Ahring, B.K. Anaerobic digestion of swine manure: Inhibition by ammonia. Water Res. 1998, 32, 5–12. [Google Scholar] [CrossRef]
- De Vrieze, J.; Saunders, A.M.; He, Y.; Fang, J.; Nielsen, P.H.; Verstraete, W.; Boon, N. Ammonia and temperature determine potential clustering in the anaerobic digestion microbiome. Water Res. 2015, 75, 312–323. [Google Scholar] [CrossRef] [PubMed]
- Wang, T.; Li, Z.; Chen, X.; Long, X.-E. Effects of nickel and cobalt on methane production and methanogen abundance and diversity in paddy soil. Peer J. 2019, 7, 6274. [Google Scholar] [CrossRef] [PubMed] [Green Version]
- Gil, A.; Siles, J.A.; Serrano, A.; Chica, A.F.; Martin, M.A. Effect of variation in the C/[N+P] ratio on anaerobic digestion. Environ. Prog. Sustain. Energy 2019, 38, 228–236. [Google Scholar] [CrossRef] [Green Version]
- Simm, R.A.; Mavinic, D.S.; Ramey, W.D. A targeted study on possible free ammonia inhibition of Nitrospira. J. Environ. Eng. Sci. 2006, 5, 365–376. [Google Scholar] [CrossRef]
- Abbassi-Guendouz, A.; Brockmann, D.; Trably, E.; Dumas, C.; Delgenès, J.-P.; Steyer, J.-P.; Escudié, R. Total solids content drives high solid anaerobic digestion via mass transfer limitation. Bioresour. Technol. 2012, 111, 55–61. [Google Scholar] [CrossRef] [PubMed]
- Mata-Alvarez, J.; Dosta, J.; Romero-Guiza, M.S.; Fonoll, X.; Peces, M.; Astals, S. A critical review on anaerobic co-digestion achievements between 2010 and 2013. Renew. Sustain. Energy Rev. 2014, 36, 412–427. [Google Scholar] [CrossRef]
- Stams, A.J.M.; Plugge, C.M. Electron transfer in syntrophic communities of anaerobic bacteria and archaea. Nat. Rev. Microbiol. 2009, 7, 568–577. [Google Scholar] [CrossRef]
- Klein, R.; Slany, V.; Krcalova, E. Conductivity measurement for control of a biogas plant. Acta Univ. Agric. Silv. Mendel. Brun 2018, 66, 1151–1156. [Google Scholar] [CrossRef] [Green Version]
- Zhao, J.; Liu, Y.; Wang, D.; Chen, F.; Li, X.; Zeng, G.; Yang, Q. Potential impact of salinity on methane production from food waste anaerobic digestion. Waste Manag. 2017, 6, 308–314. [Google Scholar] [CrossRef]
- Donoso-Bravo, A.; Pérez-Elvira, S.I.; Fdz-Polanco, F. Application of simplified models for anaerobic biodegradability tests. Evaluation of pre-treatment processes. Chem. Eng. J. 2010, 160, 607–614. [Google Scholar] [CrossRef]
- Koch, K.; Hafner, S.D.; Weinrich, S.; Astals, S. Identification of critical problems in biochemical methane potential (BMP) tests from methane production curves. Front. Environ. Sci. 2019, 7, 178. [Google Scholar] [CrossRef]
- Venkiteshwaran, K.; Milferstedt, K.; Hamelin, J.; Fujimoto, M.; Johnson, M.; Zitomer, D.H. Correlating methane production to microbiota in anaerobic digesters fed synthetic wastewater. Water Res. 2017, 110, 161–169. [Google Scholar] [CrossRef] [PubMed] [Green Version]
- Wittebolle, L.; Marzorati, M.; Clement, L. Initial community evenness favours functionality under selective stress. Nature 2009, 458, 623–626. [Google Scholar] [CrossRef]
- Iglewski, B.H. Pseudomonas. In Medical Microbiology, 4th ed.; Baron, S., Ed.; University of Texas Medical Branch at Galveston: Glaveston, TX, USA, 1996; Chapter 27. Available online: https://www.ncbi.nlm.nih.gov/books/NBK8326/ (accessed on 11 February 2020).
- Collado, L.; Figueras, M.J. Taxonomy, epidemiology, and clinical relevance of the genus Arcobacter. Clin. Microbiol. Rev. 2011, 24, 174–192. [Google Scholar] [CrossRef] [Green Version]
- Akita, H.; Kimura, Z.I.; Matsushika, A. Complete genome sequence of Ureibacillus thermosphaericus A1, a thermophilic bacillus isolated from compost. Genome Announc. 2017, 5, e00910-17. [Google Scholar] [CrossRef] [Green Version]
- Liu, Y.; Lai, Q.; Shao, Z. Genome-based analysis reveals the taxonomy and diversity of the family Idiomarinaceae. Front. Microbiol. 2018, 9, 2453. [Google Scholar] [CrossRef] [PubMed]
- Wang, Z.; Li, W.; Li, H.; Zheng, W.; Guo, F. Phylogenomics of Rhodocyclales and its distribution in wastewater treatment systems. Sci. Rep. 2020, 10, 3883. [Google Scholar] [CrossRef] [PubMed] [Green Version]
- Ai, D.; Pan, H.; Li, X.; Gao, Y.; Liu, G.; Xia, L.C. Identifying gut microbiota associated with colorectal cancer using a zero-inflated lognormal model. Front. Microbiol. 2019, 10, 826. [Google Scholar] [CrossRef]
- McInerney, M.J.; Bryant, M.P.; Hespbell, R.B.; Costerton, J.W. Syntrophomonas wolfei gen. nov. sp. nov., an anaerobic, syntrophic, fatty acid-oxidizing bacterium. Appl. Environ. Microbiol. 1981, 4, 1029–1039. [Google Scholar] [CrossRef] [PubMed] [Green Version]
- Zou, B.-Z.; Takeda, K.; Tonouchi, A.; Akada, S.; Fujita, T. Characteristics of an anaerobic, syntrophic, butyrate-degrading bacterium in paddy field soil. Biosci. Biotechnol. Biochem. 2003, 67, 2059–2067. [Google Scholar] [CrossRef] [Green Version]
- Crost, E.H.; Le Gall, G.; Laverde-Gomez, J.A.; Mukhopadhya, I.; Flint, H.J.; Juge, N. Mechanistic insights into the cross-feeding of Ruminococcus gnavus and Ruminococcus bromii on host and dietary carbohydrates. Front. Microbiol. 2018, 9, 2558. [Google Scholar] [CrossRef] [Green Version]
- Lee, M.; Woo, S.G.; Chae, M.; Ten, L.N. Pusillimonas soli sp. nov., isolated from farm soil. Int. J. Syst. Evol. Microbiol. 2010, 60, 2326–2330. [Google Scholar] [CrossRef]
- Mantri, S.; Chinthalagiri, M.R.; Gundlapally, S.R. Description of Hydrogenophaga laconesensis sp. nov. isolated from tube well water. Arch. Microbiol. 2016, 198, 637–644. [Google Scholar] [CrossRef]
- Koh, H.-W.; Song, M.-S.; Do, K.-T.; Kim, H.; Park, S.-J. Pusillimonas thiosulfatoxidans sp. nov., a thiosulfate oxidizer isolated from activated sludge. Int. J. Syst. Evol. Microbiol. 2019, 69, 1041–1046. [Google Scholar] [CrossRef]
- Mesbah, N.M.; Wiegel, J. Halophiles exposed concomitantly to multiple stressors: Adaptive mechanisms of halophilic alkalithermophiles. In Halophiles and Hypersaline Environments; Ventosa, A., Oren, A., Ma, Y., Eds.; Springer: Berlin/Heidelberg, Germany, 2011. [Google Scholar]
- Bowman, J.P. Out from the shadows—Resolution of the taxonomy of the family Cryomorphaceae. Front. Microbiol. 2020, 11, 795. [Google Scholar] [CrossRef] [PubMed]
- Origin Energy. Current Residential Electricity & Gas Tariffs. 2020. Available online: https://www.originenergy.com.au/content/dam/origin/residential/docs/new-connections/multi-site-pricing-booklet.pdf (accessed on 2 February 2020).
- Clean Energy Regulator. Australian Carbon Credit Units Market Update—October. 2019. Available online: http://www.cleanenergyregulator.gov.au/Infohub/Markets/Pages/Buying%20ACCUs/ACCU%20market%20updates/Australian-Carbon-Credit-Units-Market-Update-%E2%80%93-October-2019.aspx (accessed on 2 February 2020).
- Javier, H.; Ángel, S.J.; Aida, G.; Carmen, G.M.D.; Ángeles, M.M.D.L. Revalorization of grape marc waste fromliqueur wine: Biomethanization. J. Chem. Technol. Biotechnol. 2019, 94, 1499–1508. [Google Scholar] [CrossRef]
- Karthikeyan, O.; Visvanathan, C. Bio-energy recovery from high-solid organic substrates by dry anaerobic bio-conversion processes: A review. Rev. Environ. Sci. Biotechnol. 2013, 12, 257–284. [Google Scholar] [CrossRef]
- Barakat, A.; De Vries, H.; Rouau, X. Dry fractionation process as an important step in current and future lignocellulose biorefineries: A review. Bioresour. Technol. 2013, 134, 362–373. [Google Scholar] [CrossRef]
- Eaton, A.; Clesceri, L.S.; Rice, E.W.; Greenberg, A.E.; Franson, M. APHA: Standard Methods for the Examination of Water and Wastewater; Centennial ed.; APHA; AWWA; WEF: Washington, DC, USA, 2005. [Google Scholar]
- Kassongo, J.; Shahsavari, E.; Ball, A.S. Renewable energy from the solid-state anaerobic digestion of grape marc and cheese whey at high treatment capacity. Biomass Bioenergy 2020, 143, 105880. [Google Scholar] [CrossRef]
- Jankowska, E.; Duber, A.; Chwialkowska, J.; Stodolny, M.; Oleskowicz-Popiel, P. Conversion of organic waste into volatile fatty acids—The influence of process operating parameters. Chem. Eng. 2018, 345, 395–403. [Google Scholar] [CrossRef]
- Borja, R.; Martin, A.; Banks, C.J.; Alonso, V.; Chica, A. A kinetic study of anaerobic digestion of olive mill wastewater at mesophilic and thermophilic temperatures. Environ. Pollut. 1995, 88, 13–18. [Google Scholar] [CrossRef]
- Bolyen, E.; Rideout, J.R.; Dillon, M.R.; Bokulich, N.A.; Abnet, C.C.; Al-Ghalith, G.A.; Alexander, H.; Alm, E.J.; Arumugam, M.; Asnicar, F.; et al. Reproducible, interactive, scalable and extensible microbiome data science using QIIME 2. Nat. Biotechnol. 2019, 37, 852–857. [Google Scholar] [CrossRef] [PubMed]
- Callahan, B.J.; McMurdie, P.J.; Rosen, M.J.; Han, A.W.; Johnson, A.J.A.; Holmes, S.P. DADA2: High-resolution sample inference from Illumina amplicon data. Nat. Methods 2016, 13, 581–583. [Google Scholar] [CrossRef] [Green Version]
- Bokulich, N.A.; Dillon, M.R.; Zhang, Y.; Rideout, J.R.; Bolyen, E.; Li, H.; Albert, P.S.; Caporaso, J.G. q2-longitudinal: Longitudinal and paired-sample analyses of microbiome data. mSystems 2018, 3, e00219-18. [Google Scholar] [CrossRef] [Green Version]
- Antonic, B.; Dordevic, D.; Jancikova, S.; Holeckova, D.; Tremlova, B.; Kulawik, P. Effect of Grape Seed Flour on the Antioxidant Profile, Textural and Sensory Properties of Waffles. Processes 2021, 9, 131. [Google Scholar] [CrossRef]
Publisher’s Note: MDPI stays neutral with regard to jurisdictional claims in published maps and institutional affiliations. |
© 2021 by the authors. Licensee MDPI, Basel, Switzerland. This article is an open access article distributed under the terms and conditions of the Creative Commons Attribution (CC BY) license (https://creativecommons.org/licenses/by/4.0/).