
Nanoplastic Labelling with Metal Probes: Analytical Strategies for Their Sensitive Detection and Quantification by ICP Mass Spectrometry


Abstract
:
1. Introduction
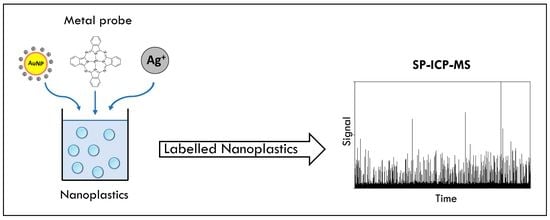
2. Labelling Strategies
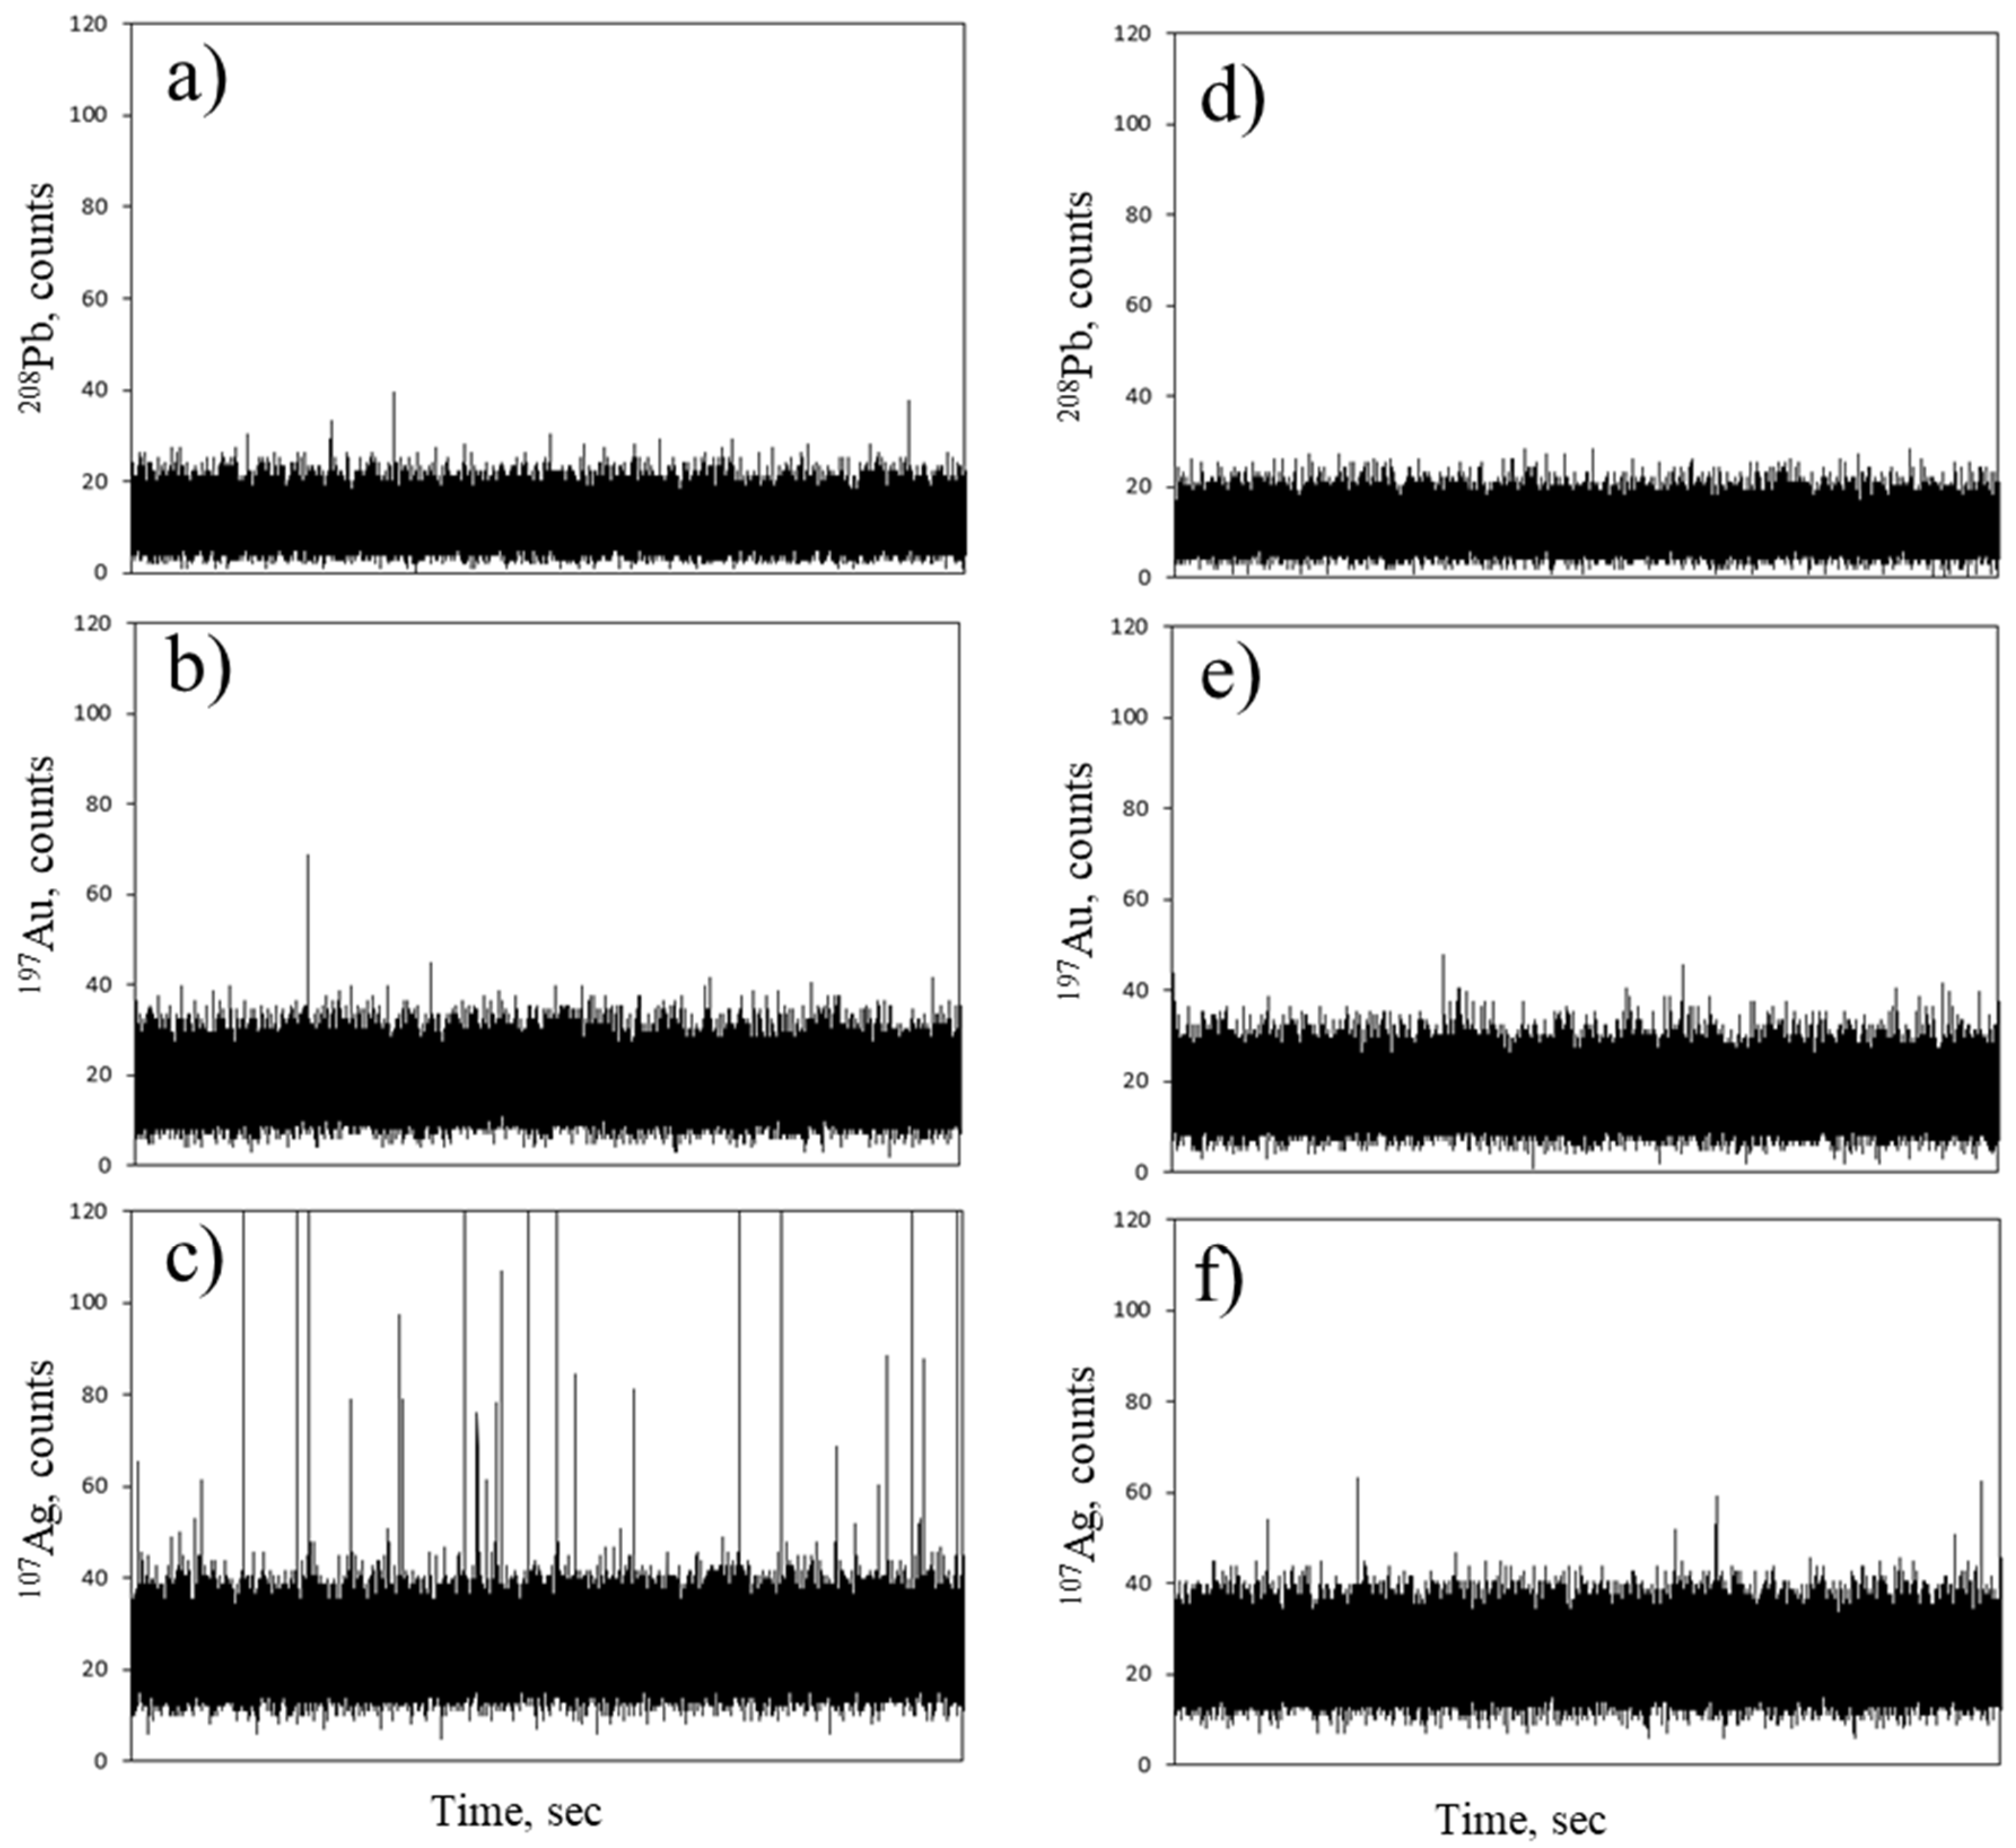
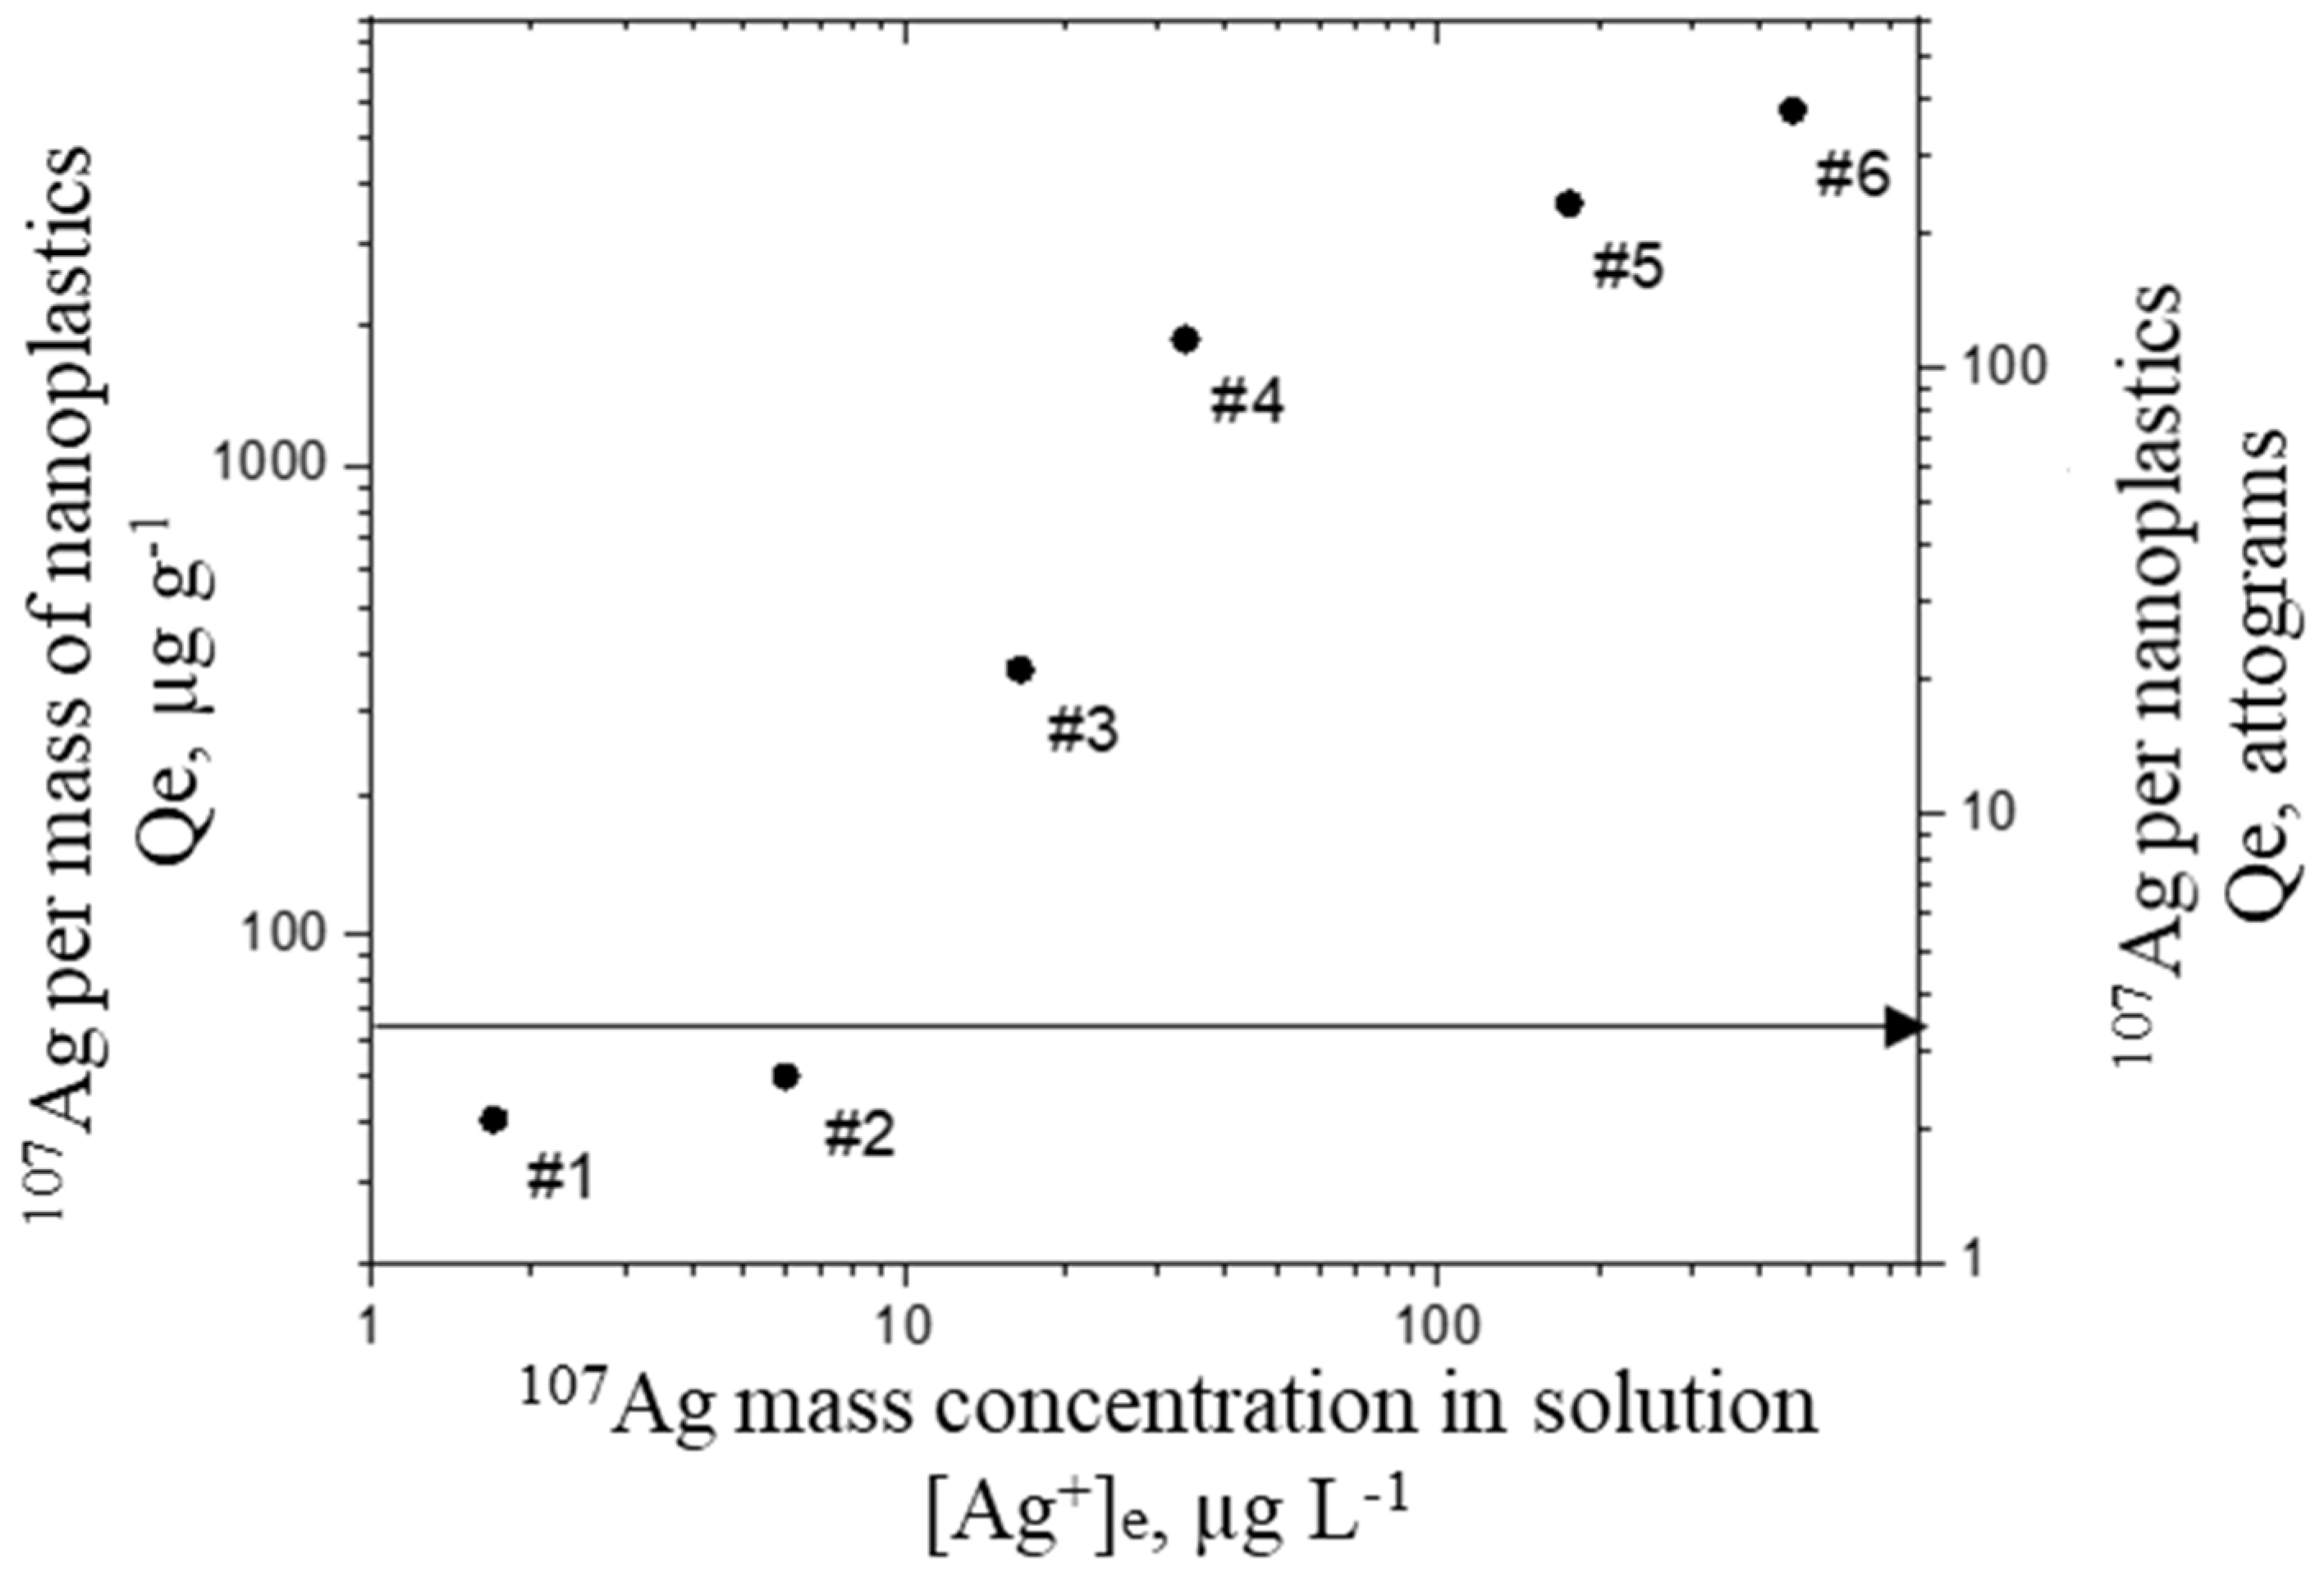
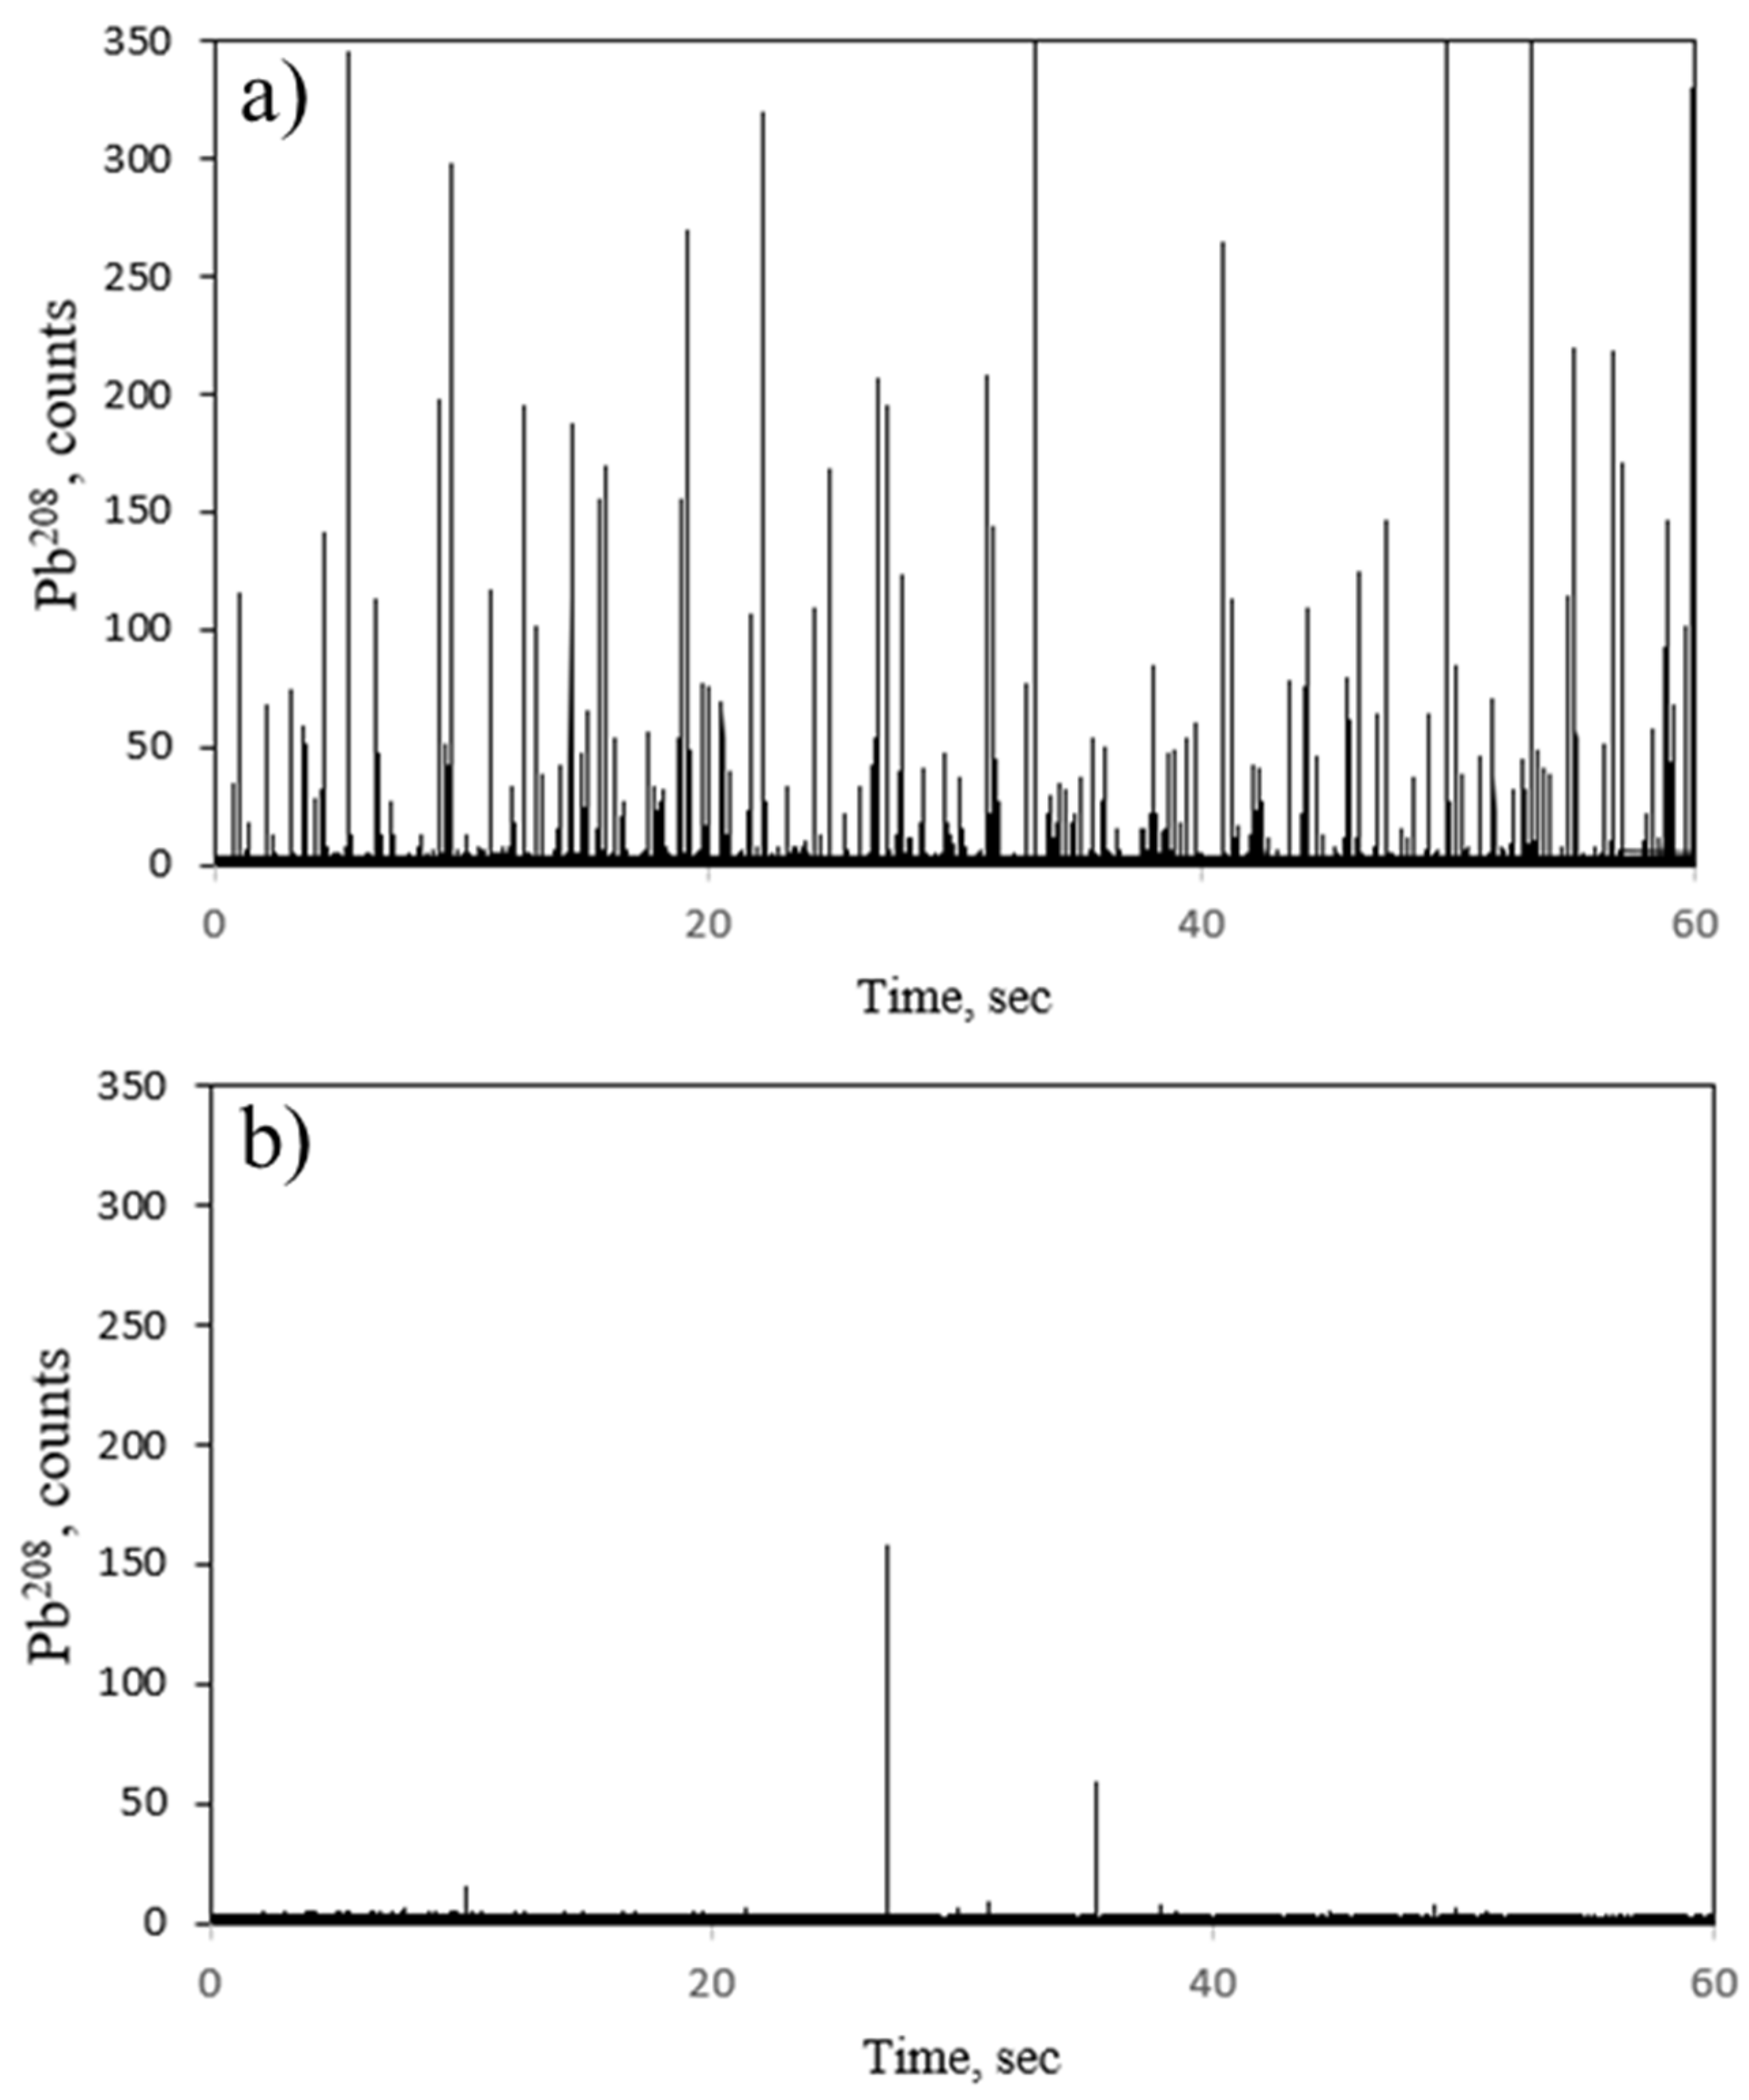
2.1. Labelling with Metal Ions
2.2. Labelling with a Hydrophobic Organometallic Compound
2.3. Labelling with Metal Nanoparticles
3. Materials and Methods
3.1. Reagents and Standards
3.2. Sample Preparation Procedures
3.2.1. Labelling with Metal Ions
3.2.2. Labelling with a Hydrophobic Organometallic Compound
3.2.3. Labelling with Metal Nanoparticles
3.3. Instrumentation
3.3.1. Total Metal Content Analysis
3.3.2. Single Particle ICP-MS Analysis
4. Conclusions and Future Directions
Supplementary Materials
Author Contributions
Funding
Data Availability Statement
Acknowledgments
Conflicts of Interest
Sample Availability
References
- Gigault, J.; ter Halle, A.; Baudrimont, M.; Pascal, P.Y.; Gauffre, F.; Phi, T.L.; El Hadri, H.; Grassl, B.; Reynaud, S. Current opinion: What is a nanoplastic? Environ. Pollut. 2018, 235, 1030–1034. [Google Scholar] [CrossRef]
- Jambeck, J.R.; Geyer, R.; Wilcox, C.; Siegler, T.R.; Perryman, M.; Andrady, A.; Narayan, R.; Law, K.L. Plastic waste inputs from land into the ocean. Science 2015, 347, 764–768. [Google Scholar] [CrossRef] [PubMed]
- Jahnke, A.; Arp, H.P.H.; Escher, B.I.; Gewert, B.; Gorokhova, E.; Kühnel, D.; Ogonowski, M.; Potthoff, A.; Rummel, C.; Schmitt-Jansen, M.; et al. Reducing Uncertainty and Confronting Ignorance about the Possible Impacts of Weathering Plastic in the Marine Environment. Environ. Sci. Technol. Lett. 2017, 4, 85–90. [Google Scholar] [CrossRef]
- Andrady, A.L. Microplastics in the marine environment. Mar. Pollut. Bull. 2011, 62, 1596–1605. [Google Scholar] [CrossRef] [PubMed]
- Roager, L.; Sonnenschein, E.C. Bacterial Candidates for Colonization and Degradation of Marine Plastic Debris. Environ. Sci. Technol. 2019, 53, 11636–11643. [Google Scholar] [CrossRef]
- Mattsson, K.; Hansson, L.A.; Cedervall, T. Nano-plastics in the aquatic environment. Environ. Sci. Process. Impacts 2015, 17, 1712–1721. [Google Scholar] [CrossRef] [PubMed]
- Besseling, E.; Redondo-Hasselerharm, P.; Koelmans, A.A. Quantifying ecological risks of aquatic micro- and nanoplastic. Crit. Rev. Environ. Sci. Technol. 2019, 49, 32–80. [Google Scholar] [CrossRef] [Green Version]
- Gewert, B.; Plassmann, M.M.; Macleod, M. Pathways for degradation of plastic polymers floating in the marine environment. Environ. Sci. Process. Impacts 2015, 17, 1513–1521. [Google Scholar] [CrossRef] [PubMed] [Green Version]
- Mao, R.; Lang, M.; Yu, X.; Wu, R.; Yang, X.; Guo, X. Aging mechanism of microplastics with UV irradiation and its effects on the adsorption of heavy metals. J. Hazard. Mater. 2020, 393, 122515. [Google Scholar] [CrossRef] [PubMed]
- Jakubowicz, I.; Enebro, J.; Yarahmadi, N. Challenges in the search for nanoplastics in the environment—A critical review from the polymer science perspective. Polym. Test. 2021, 93, 106953. [Google Scholar] [CrossRef]
- Caldwell, J.; Taladriz-blanco, P.; Rothen-rutishauser, B.; Petri-fink, A. Detection of sub-micro- and nanoplastic particles on gold nanoparticle-based substrates through surface-enhanced raman scattering (Sers) spectroscopy. Nanomaterials 2021, 11, 1149. [Google Scholar] [CrossRef] [PubMed]
- Sullivan, G.L.; Gallardo, J.D.; Jones, E.W.; Holliman, P.J.; Watson, T.M.; Sarp, S. Detection of trace sub-micron (nano) plastics in water samples using pyrolysis-gas chromatography time of flight mass spectrometry (PY-GCToF). Chemosphere 2020, 249, 126179. [Google Scholar] [CrossRef] [PubMed]
- Materić, D.; Kasper-Giebl, A.; Kau, D.; Anten, M.; Greilinger, M.; Ludewig, E.; Van Sebille, E.; Röckmann, T.; Holzinger, R. Micro-and Nanoplastics in Alpine Snow: A New Method for Chemical Identification and (Semi)Quantification in the Nanogram Range. Environ. Sci. Technol. 2020, 54, 2353–2359. [Google Scholar] [CrossRef]
- Mintenig, S.; Bäuerlein, P.S.; Koelmans, A.A.; Dekker, S.; van Wezel, A.P. Closing the gap between small and smaller: Towards a framework to analyse nano- and microplastics in aqueous environmental samples. Environ. Sci. Nano 2018, 5, 1640–1649. [Google Scholar] [CrossRef]
- Gagné, F. Detection of polystyene nanoplastics in biological tissues with a fluorescent molecular rotor probe. J. Xenobiot. 2019, 9, 7–9. [Google Scholar] [CrossRef] [Green Version]
- Mattsson, K.; Björkroth, F.; Karlsson, T.; Hassellöv, M. Nanofragmentation of Expanded Polystyrene Under Simulated Environmental Weathering (Thermooxidative Degradation and Hydrodynamic Turbulence). Front. Mar. Sci. 2021, 7, 1–9. [Google Scholar] [CrossRef]
- Lambert, S.; Wagner, M. Formation of microscopic particles during the degradation of different polymers. Chemosphere 2016, 161, 510–517. [Google Scholar] [CrossRef] [PubMed]
- Lambert, S.; Wagner, M. Characterisation of nanoplastics during the degradation of polystyrene. Chemosphere 2016, 145, 265–268. [Google Scholar] [CrossRef] [Green Version]
- Enfrin, M.; Lee, J.; Gibert, Y.; Basheer, F.; Kong, L.; Dumée, L.F. Release of hazardous nanoplastic contaminants due to microplastics fragmentation under shear stress forces. J. Hazard. Mater. 2020, 384, 121393. [Google Scholar] [CrossRef]
- Hernandez, L.M.; Xu, E.G.; Larsson, H.C.E.; Tahara, R.; Maisuria, V.B.; Tufenkji, N. Plastic Teabags Release Billions of Microparticles and Nanoparticles into Tea. Environ. Sci. Technol. 2019, 53, 12300–12310. [Google Scholar] [CrossRef]
- Valsesia, A.; Parot, J.; Ponti, J.; Mehn, D.; Marino, R.; Melillo, D.; Muramoto, S.; Verkouteren, M.; Hackley, V.A.; Colpo, P. Detection, counting and characterization of nanoplastics in marine bioindicators: A proof of principle study. Microplast. Nanoplast. 2021, 1, 1–13. [Google Scholar] [CrossRef]
- Baalousha, M.; Prasad, A.; Lead, J.R. Quantitative measurement of the nanoparticle size and number concentration from liquid suspensions by atomic force microscopy. Environ. Sci. Process. Impacts 2014, 16, 1338–1347. [Google Scholar] [CrossRef] [PubMed]
- Caputo, F.; Vogel, R.; Savage, J.; Vella, G.; Law, A.; Della Camera, G.; Hannon, G.; Peacock, B.; Mehn, D.; Ponti, J.; et al. Measuring particle size distribution and mass concentration of nanoplastics and microplastics: Addressing some analytical challenges in the sub-micron size range. J. Colloid Interface Sci. 2021, 588, 401–417. [Google Scholar] [CrossRef] [PubMed]
- Molenaar, R.; Chatterjee, S.; Kamphuis, B.; Segers-Nolten, I.M.J.; Claessens, M.M.A.E.; Blum, C. Nanoplastic sizes and numbers: Quantification by single particle tracking. Environ. Sci. Nano 2021, 8, 723–730. [Google Scholar] [CrossRef]
- Lenz, R.; Enders, K.; Gissel, T. Microplastic exposure studies should be environmentally realistic. Proc. Natl. Acad. Sci. USA 2016, 113, 4121–4122. [Google Scholar] [CrossRef] [PubMed] [Green Version]
- Reynaud, S.; Aynard, A.; Grassl, B.; Gigault, J. Nanoplastics: From model materials to colloidal fate. Curr. Opin. Colloid Interface Sci. 2021, 101528, in press. [Google Scholar] [CrossRef]
- Montoro Bustos, A.R.; Purushotham, K.P.; Possolo, A.; Farkas, N.; Vladár, A.E.; Murphy, K.E.; Winchester, M.R. Validation of Single Particle ICP-MS for Routine Measurements of Nanoparticle Size and Number Size Distribution. Anal. Chem. 2018, 90, 14376–14386. [Google Scholar] [CrossRef]
- Bolea-Fernandez, E.; Rua-Ibarz, A.; Velimirovic, M.; Tirez, K.; Vanhaecke, F. Detection of microplastics using inductively coupled plasma-mass spectrometry (ICP-MS) operated in single-event mode. J. Anal. At. Spectrom. 2020, 35, 455–460. [Google Scholar] [CrossRef]
- Laborda, F.; Trujillo, C.; Lobinski, R. Analysis of microplastics in consumer products by single particle-inductively coupled plasma mass spectrometry using the carbon-13 isotope. Talanta 2021, 221, 121486. [Google Scholar] [CrossRef]
- Hildebrandt, L.; Zimmermann, T. Microplastics as a Trojan horse for trace metals. J. Hazard. Mater. Lett. 2021, 2, 100035. [Google Scholar] [CrossRef]
- Laborda, F.; Gimenez-ingalaturre, A.C.; Bolea, E.; Castillo, J.R. Single particle inductively coupled plasma mass spectrometry as screening tool for detection of particles. Spectrochim. Acta Part B 2019, 159, 105654. [Google Scholar] [CrossRef]
- Laborda, F.; Bolea, E.; Jimenez-Lamana, J. Single Particle Inductively Coupled Plasma Mass Spectrometry: A Powerful Tool for Nanoanalysis. Anal. Chem. 2014, 86, 2270–2278. [Google Scholar] [CrossRef] [PubMed]
- Laborda, F.; Jiménez-Lamana, J.; Bolea, E.; Castillo, J.R. Critical considerations for the determination of nanoparticle number concentrations, size and number size distributions by single particle ICP-MS. J. Anal. At. Spectrom. 2013, 28, 1220–1232. [Google Scholar] [CrossRef]
- Lee, H.; Shim, W.J.; Kwon, J.H. Sorption capacity of plastic debris for hydrophobic organic chemicals. Sci. Total Environ. 2014, 470–471, 1545–1552. [Google Scholar] [CrossRef]
- Agboola, O.D.; Benson, N.U. Physisorption and Chemisorption Mechanisms Influencing Micro (Nano) Plastics-Organic Chemical Contaminants Interactions: A Review. Front. Environ. Sci. 2021, 9, 1–27. [Google Scholar] [CrossRef]
- Velzeboer, I.; Kwadijk, C.J.A.F.; Koelmans, A.A. Strong sorption of PCBs to Nanoplastics, Microplastics, carbon nanotubes and fullerenes. Environ. Sci. Technol. 2014, 48, 4869–4876. [Google Scholar] [CrossRef] [PubMed]
- Hildebrandt, L.; Mitrano, D.M.; Zimmermann, T.; Pröfrock, D. A Nanoplastic Sampling and Enrichment Approach by Continuous Flow Centrifugation. Front. Environ. Sci. 2020, 8, 1–13. [Google Scholar] [CrossRef]
- Wisniewska, M.; Urban, T.; Grzadka, E.; Zarko, V.I.; Gun’ko, V.M. Comparison of adsorption affinity of polyacrylic acid for surfaces of mixed silica–alumina. Colloid Polym. Sci. 2013, 292, 699–705. [Google Scholar] [CrossRef] [Green Version]
- Pirman, T.; Ocepek, M.; Likozar, B. Radical Polymerization of Acrylates, Methacrylates, and Styrene: Biobased Approaches, Mechanism, Kinetics, Secondary Reactions, and Modeling. Ind. Eng. Chem. Res. 2021, 60, 9347–9367. [Google Scholar] [CrossRef]
- Jiménez-lamana, J.; Marigliano, L.; Allouche, J.; Grassl, B.; Szpunar, J.; Reynaud, S. A novel strategy for the detection and quantification of nanoplastics by single particle inductively coupled plasma mass spectrometry (ICP-MS). Anal. Chem. 2020, 92, 11664–11672. [Google Scholar] [CrossRef]
- Lai, Y.; Dong, L.; Li, Q.; Li, P.; Hao, Z.; Yu, S.; Liu, J. Counting Nanoplastics in Environmental Waters by Single Particle Inductively Coupled Plasma Mass Spectroscopy after Cloud-Point Extraction and In Situ Labeling of Gold Nanoparticles. Environ. Sci. Technol. 2021, 55, 4783–4791. [Google Scholar] [CrossRef]
- Pessoni, L.; Veclin, C.; El Hadri, H.; Cugnet, C.; Davranche, M.; Pierson-Wickmann, A.C.; Gigault, J.; Grassl, B.; Reynaud, S. Soap- and metal-free polystyrene latex particles as a nanoplastic model. Environ. Sci. Nano 2019, 6, 2253–2258. [Google Scholar] [CrossRef]
- Pace, H.E.; Rogers, N.J.; Jarolimek, C.; Coleman, V.A.; Higgins, C.P.; Ranville, J.F. Determining Transport Efficiency for the Purpose of Counting and Sizing Nanoparticles via Single Particle Inductively Coupled Plasma Mass Spectrometry. Anal. Chem. 2011, 83, 9361–9369. [Google Scholar] [CrossRef] [PubMed] [Green Version]
- Francis, A.P.; Devasena, T. Toxicity of carbon nanotubes: A review. Toxicol. Ind. Health 2018, 34, 200–210. [Google Scholar] [CrossRef] [PubMed]


| Sample Name | Silver Concentration mg L−1 | PSAA22:Ag Ratio |
|---|---|---|
| #1 | 0.005 | 100:0.005 |
| #2 | 0.1 | 100:0.01 |
| #3 | 0.05 | 100:0.05 |
| #4 | 0.2 | 100:0.2 |
| #5 | 0.5 | 100:0.5 |
| #6 | 1 | 100:1 |
| NPT | Expected Concentration, NPTs L−1 | SP-ICP-MS Concentration, NPTs L−1 |
|---|---|---|
| PSAA22 | 5.58 × 10⁷ | 6.30 × 10⁷ |
| PSAA18 | 3.34 × 10⁷ | 2.48 × 10⁷ |
| PSAA13 | 5.18 × 10⁷ | 3.33 × 10⁶ |
| PSAA9 | 4.16 × 10⁸ | 2.43 × 10⁷ |
Publisher’s Note: MDPI stays neutral with regard to jurisdictional claims in published maps and institutional affiliations. |
© 2021 by the authors. Licensee MDPI, Basel, Switzerland. This article is an open access article distributed under the terms and conditions of the Creative Commons Attribution (CC BY) license (https://creativecommons.org/licenses/by/4.0/).
Share and Cite
Marigliano, L.; Grassl, B.; Szpunar, J.; Reynaud, S.; Jiménez-Lamana, J. Nanoplastic Labelling with Metal Probes: Analytical Strategies for Their Sensitive Detection and Quantification by ICP Mass Spectrometry. Molecules 2021, 26, 7093. https://doi.org/10.3390/molecules26237093
Marigliano L, Grassl B, Szpunar J, Reynaud S, Jiménez-Lamana J. Nanoplastic Labelling with Metal Probes: Analytical Strategies for Their Sensitive Detection and Quantification by ICP Mass Spectrometry. Molecules. 2021; 26(23):7093. https://doi.org/10.3390/molecules26237093
Chicago/Turabian StyleMarigliano, Lucile, Bruno Grassl, Joanna Szpunar, Stéphanie Reynaud, and Javier Jiménez-Lamana. 2021. "Nanoplastic Labelling with Metal Probes: Analytical Strategies for Their Sensitive Detection and Quantification by ICP Mass Spectrometry" Molecules 26, no. 23: 7093. https://doi.org/10.3390/molecules26237093
APA StyleMarigliano, L., Grassl, B., Szpunar, J., Reynaud, S., & Jiménez-Lamana, J. (2021). Nanoplastic Labelling with Metal Probes: Analytical Strategies for Their Sensitive Detection and Quantification by ICP Mass Spectrometry. Molecules, 26(23), 7093. https://doi.org/10.3390/molecules26237093