
Identification of Influenza PAN Endonuclease Inhibitors via 3D-QSAR Modeling and Docking-Based Virtual Screening

 , , ,
, , , 
Abstract
:1. Introduction
2. Result and Discussion
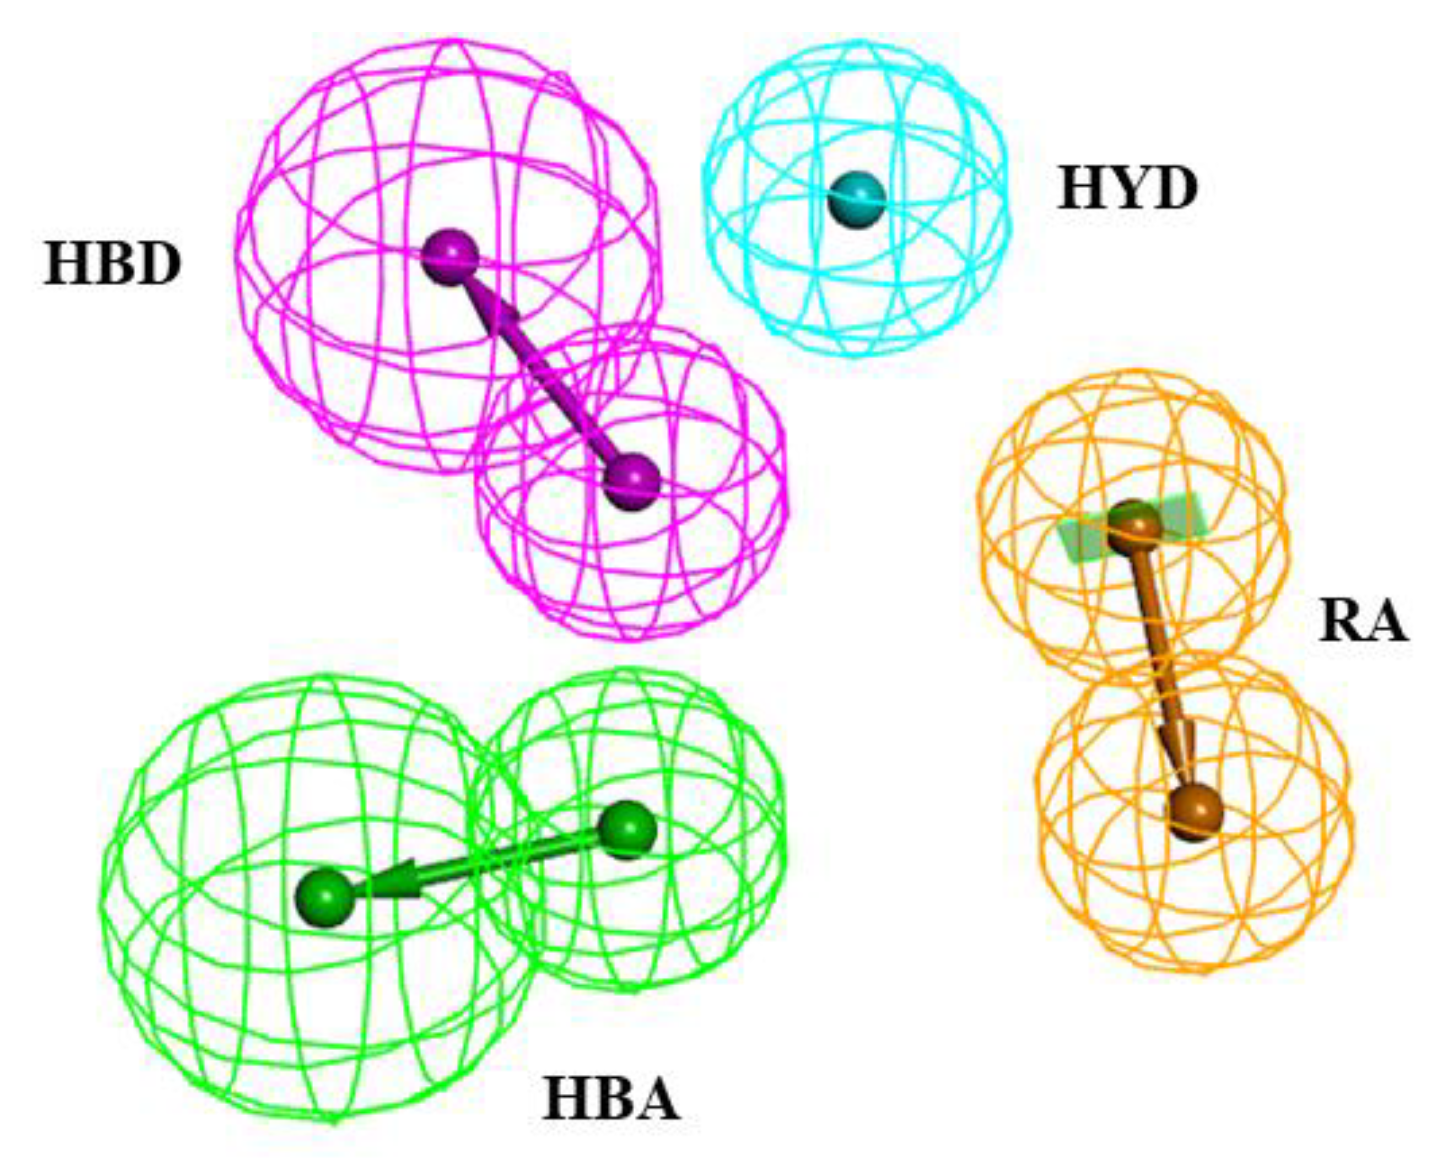
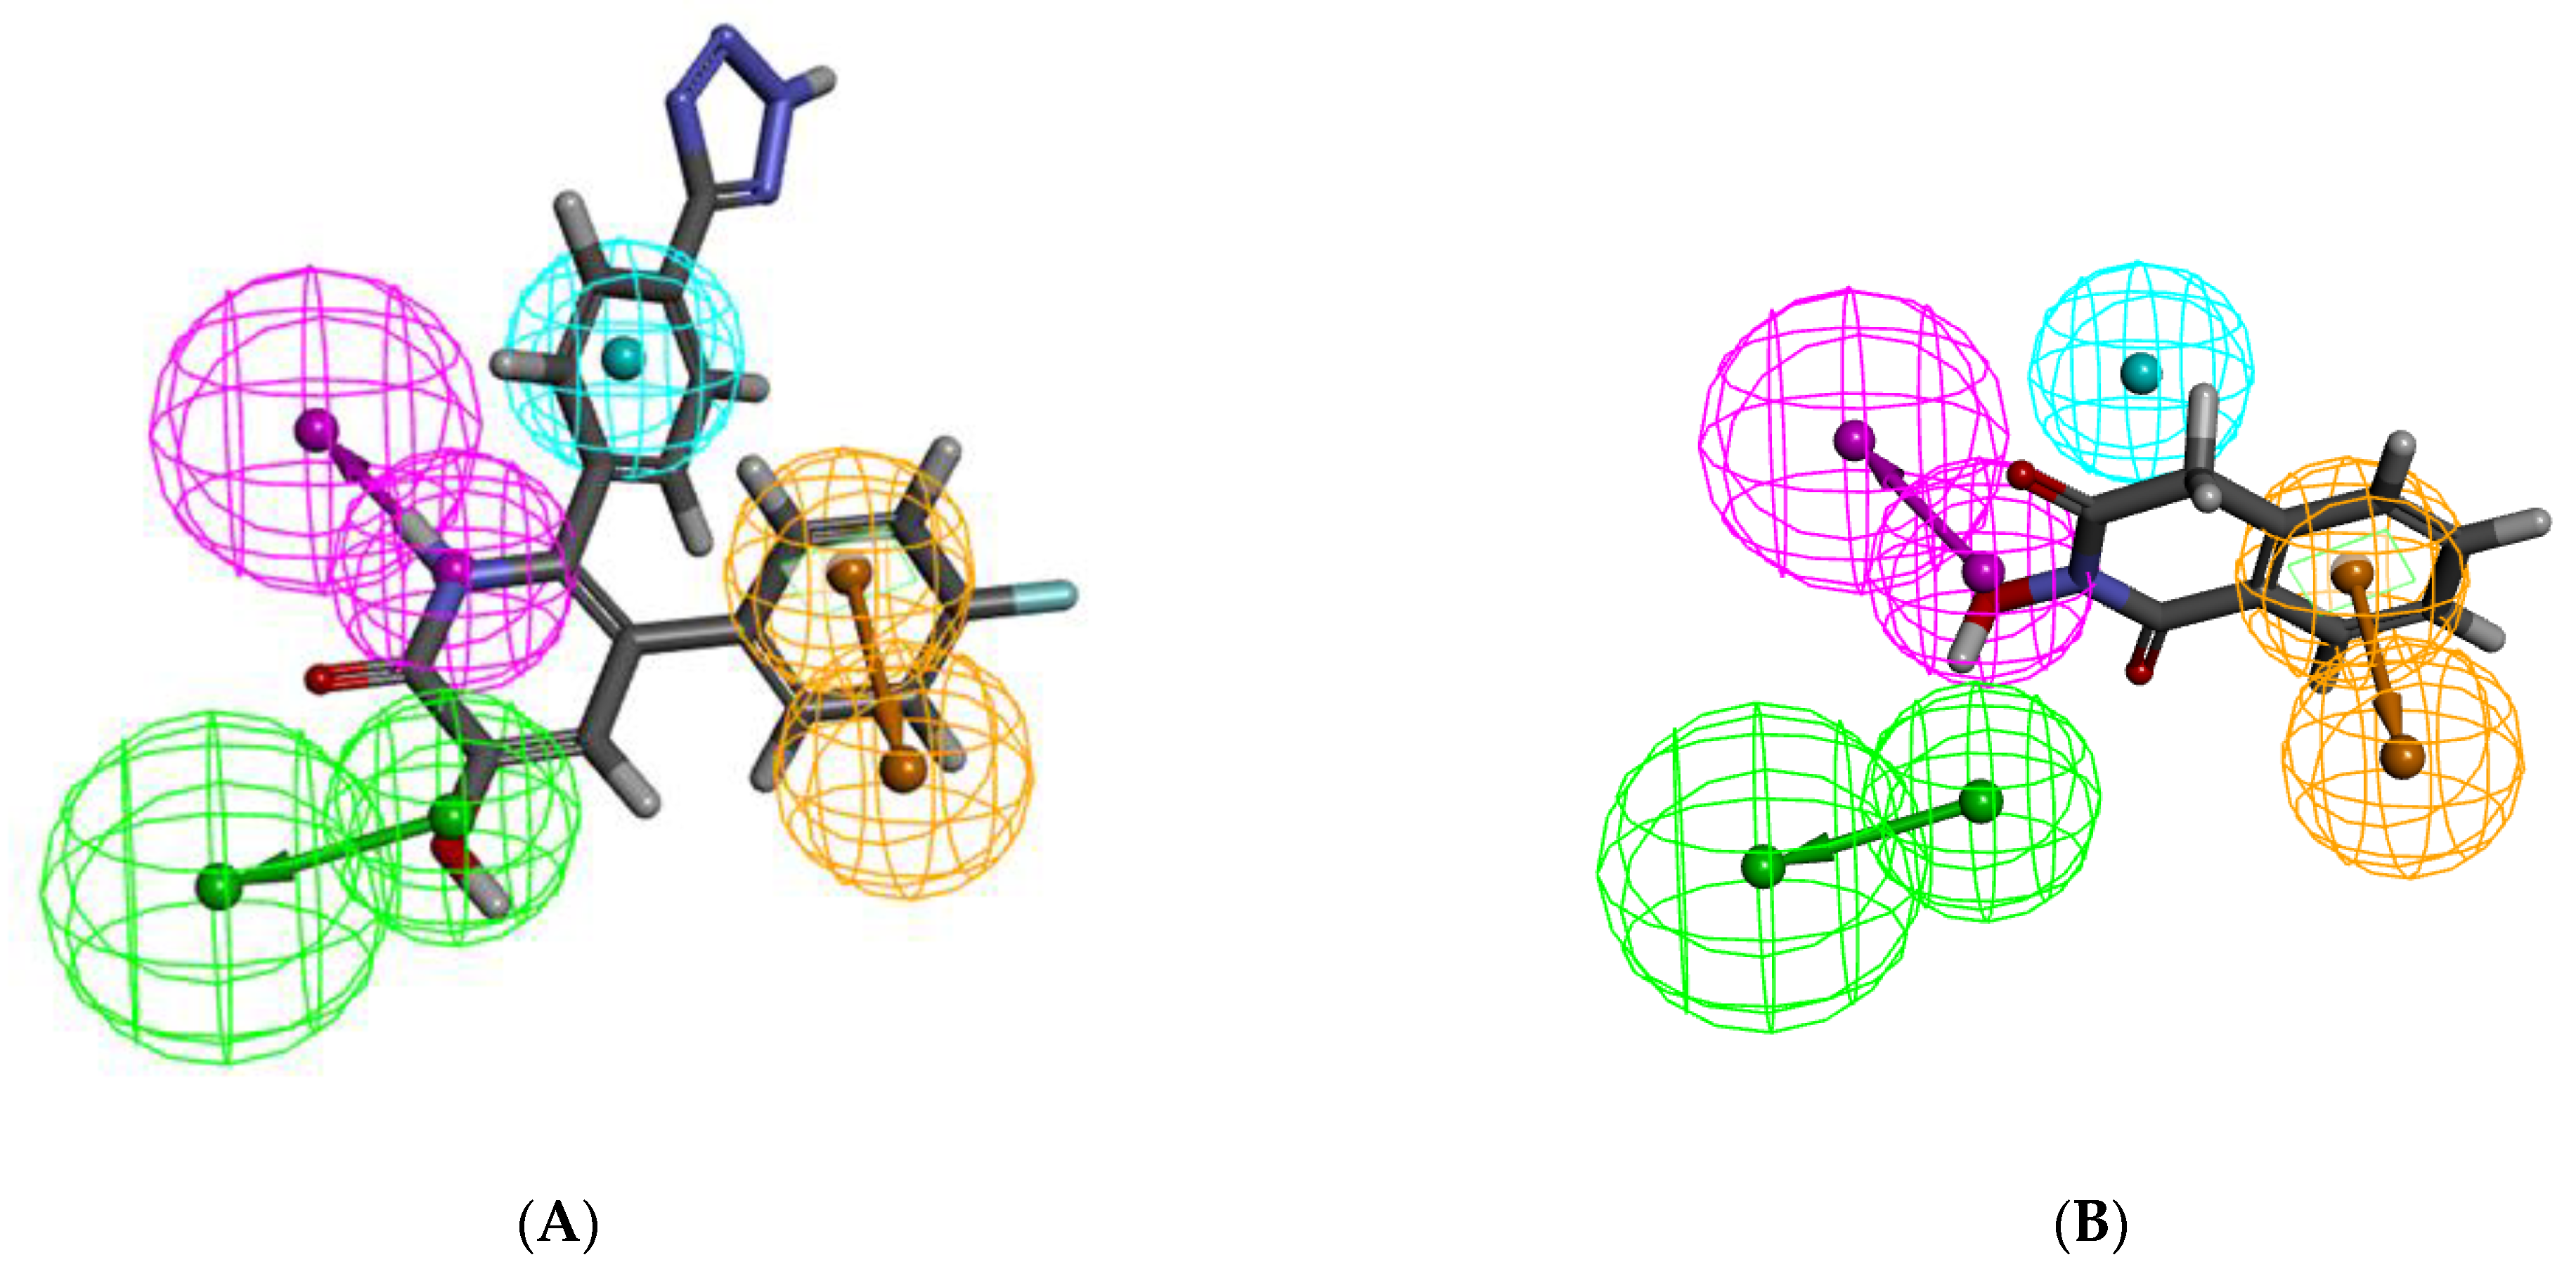
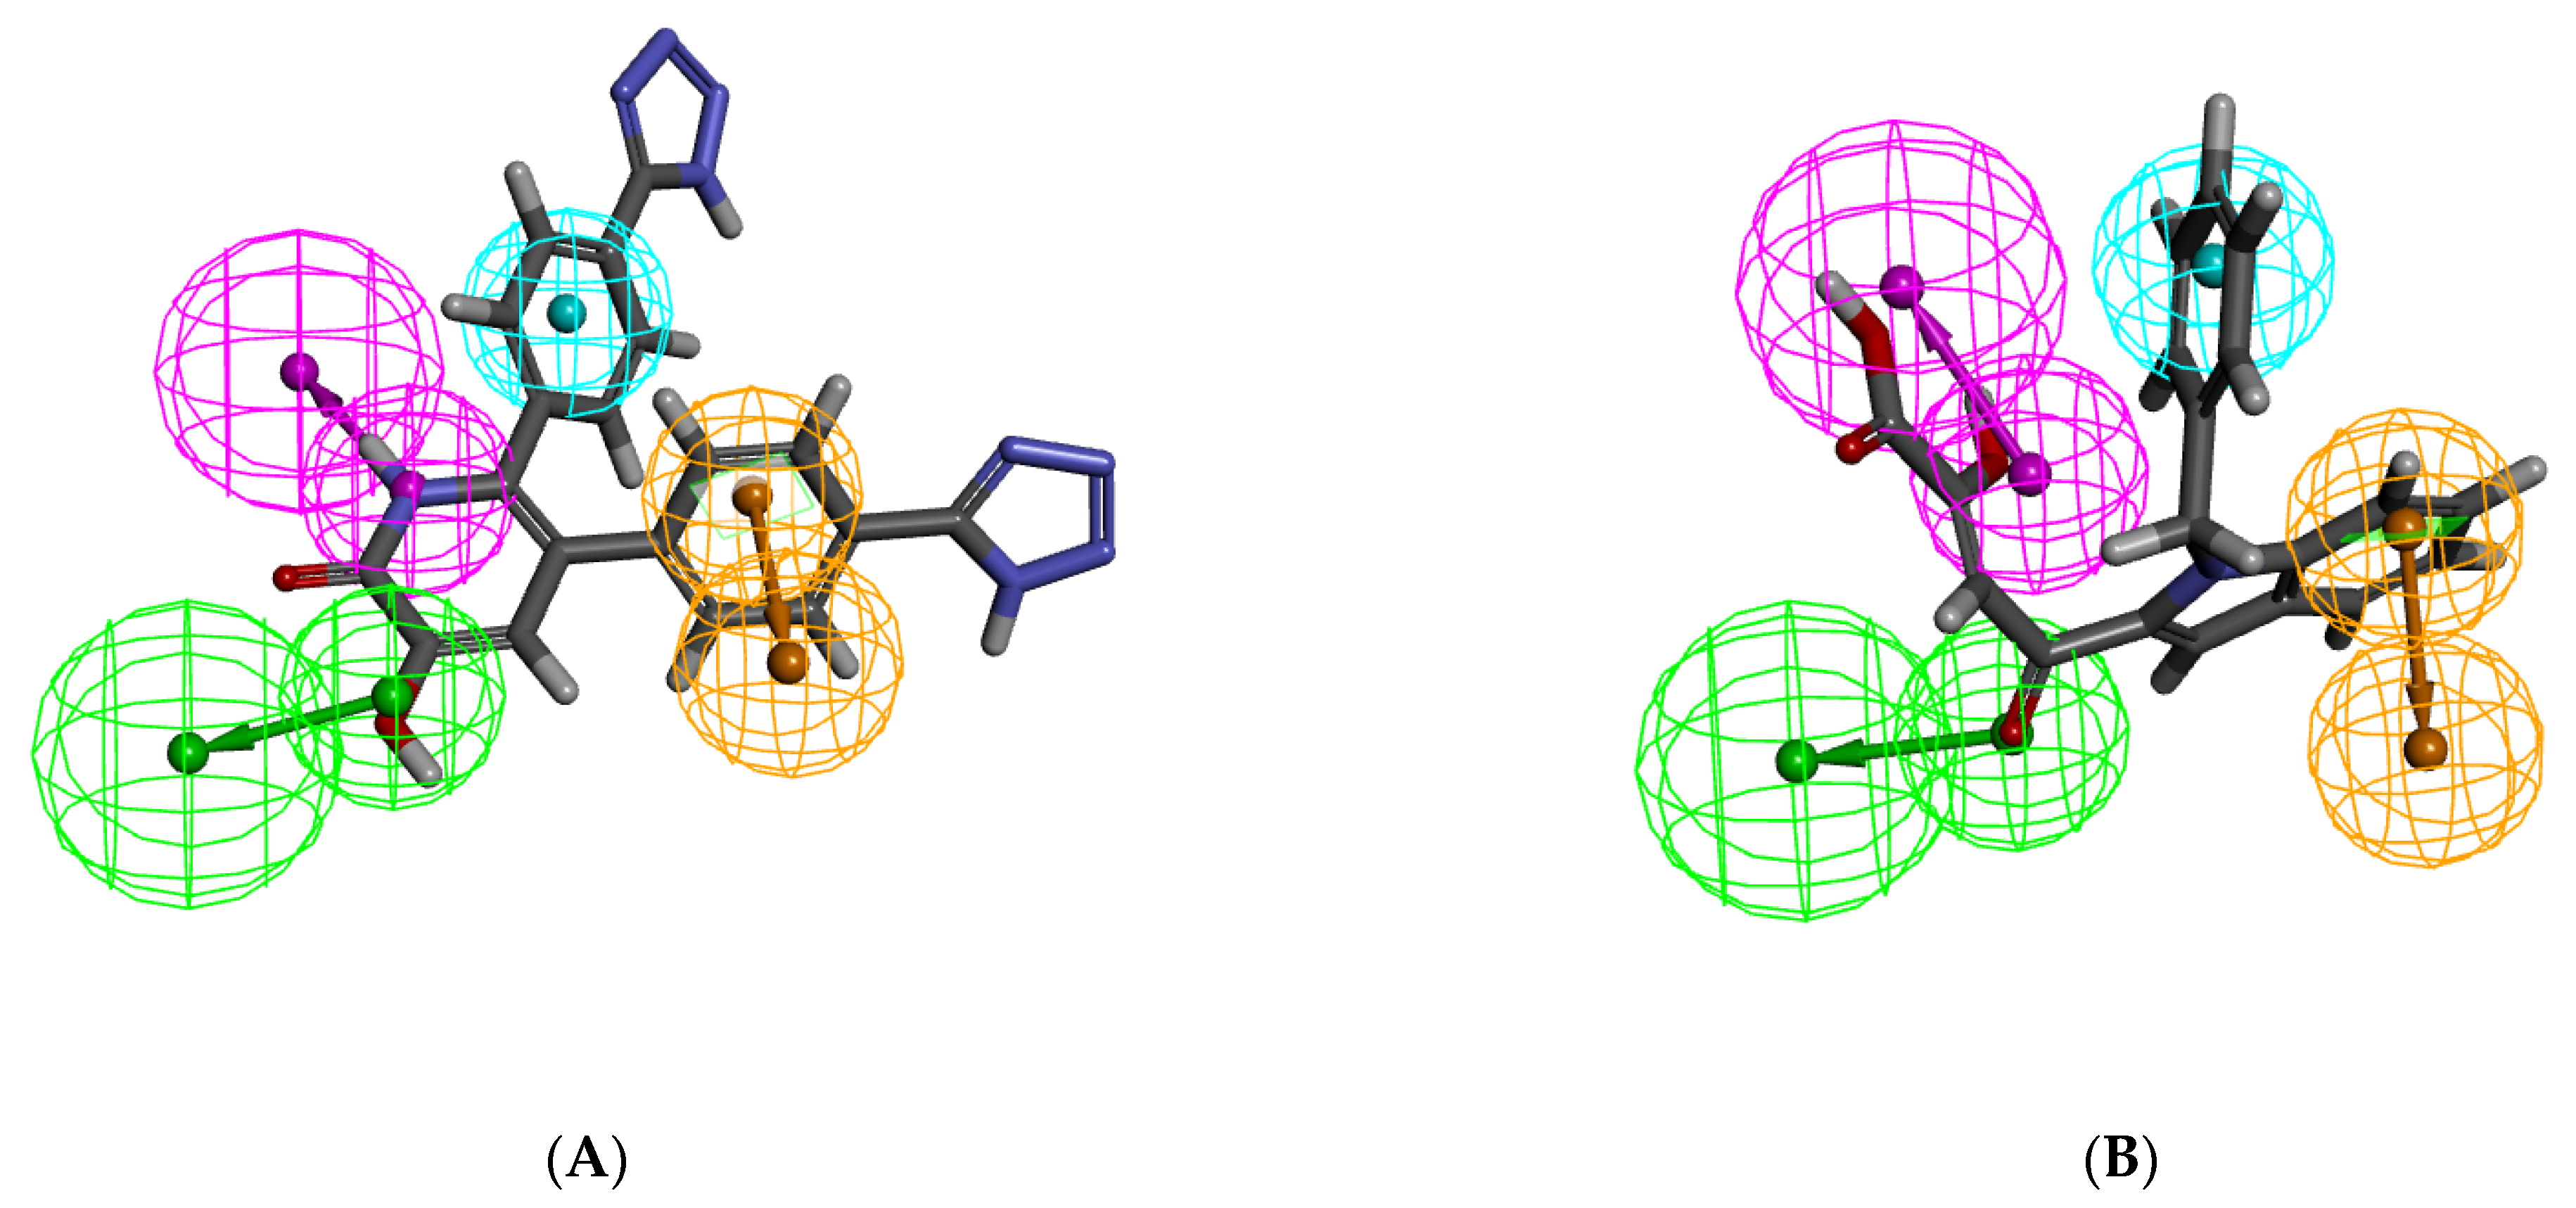
2.1. Pharmacophore Model Generation
2.2. Validation of the Pharmacophore Models
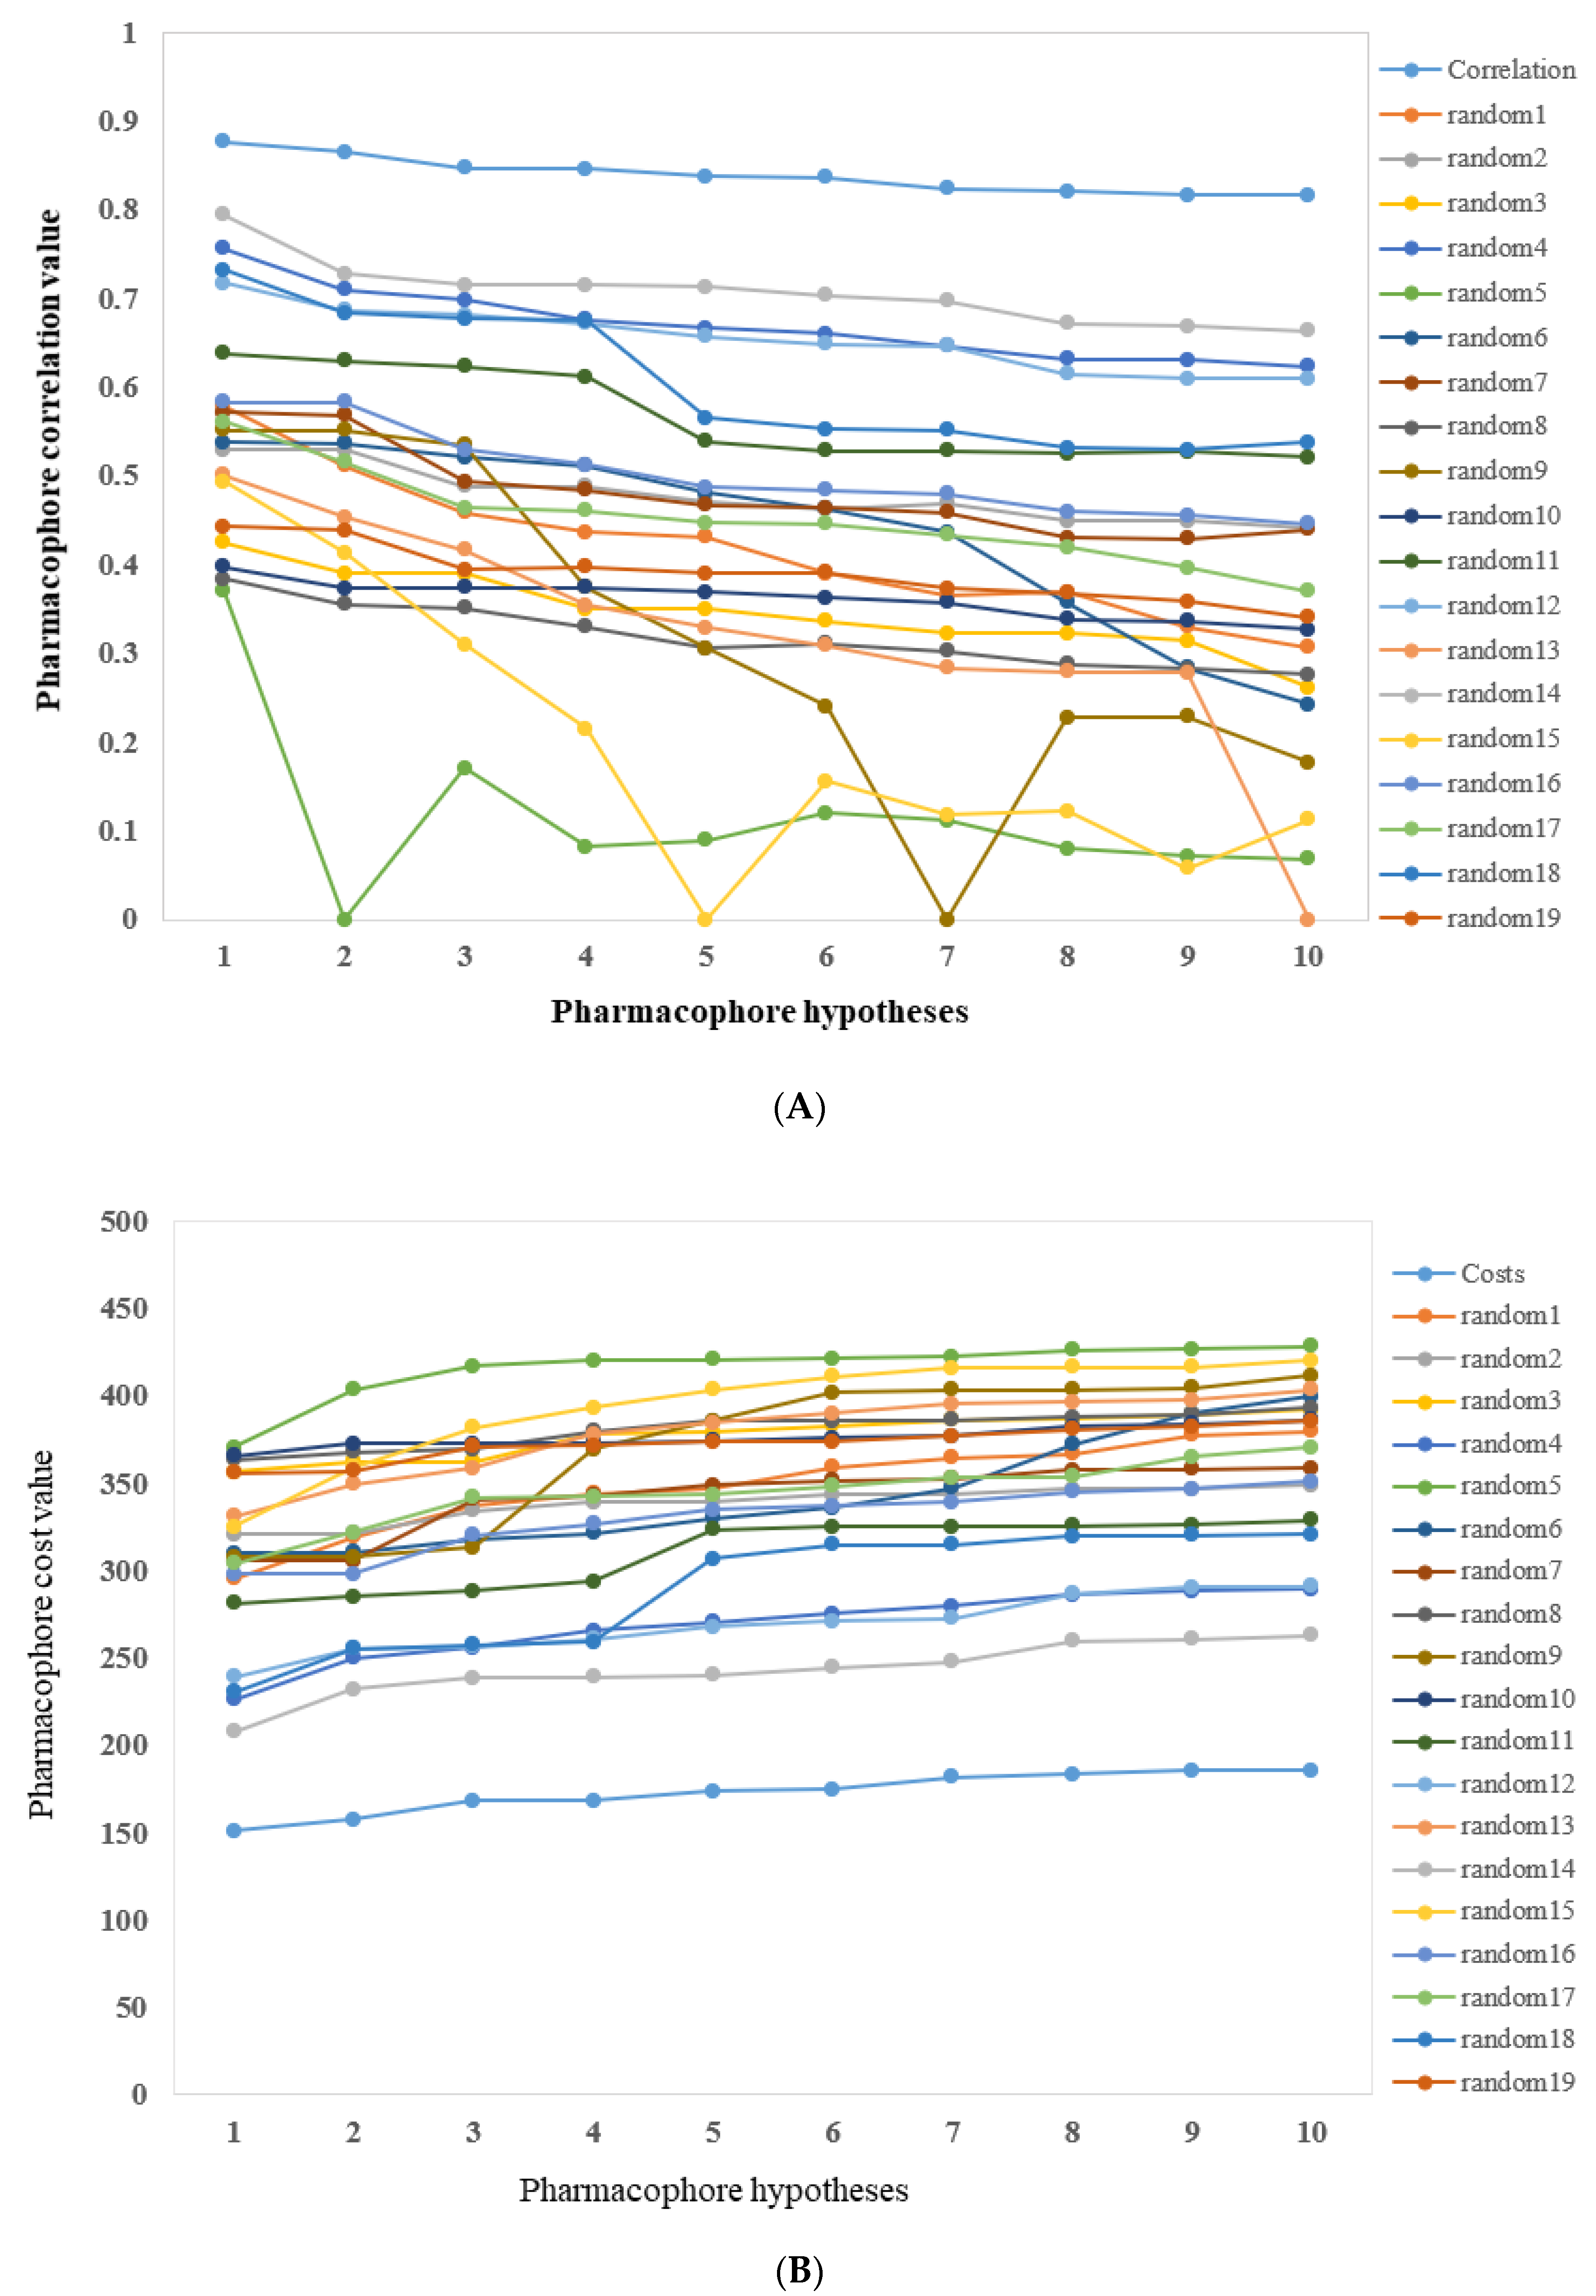
2.2.1. Cost Analysis
2.2.2. Fischer’s Randomization Test
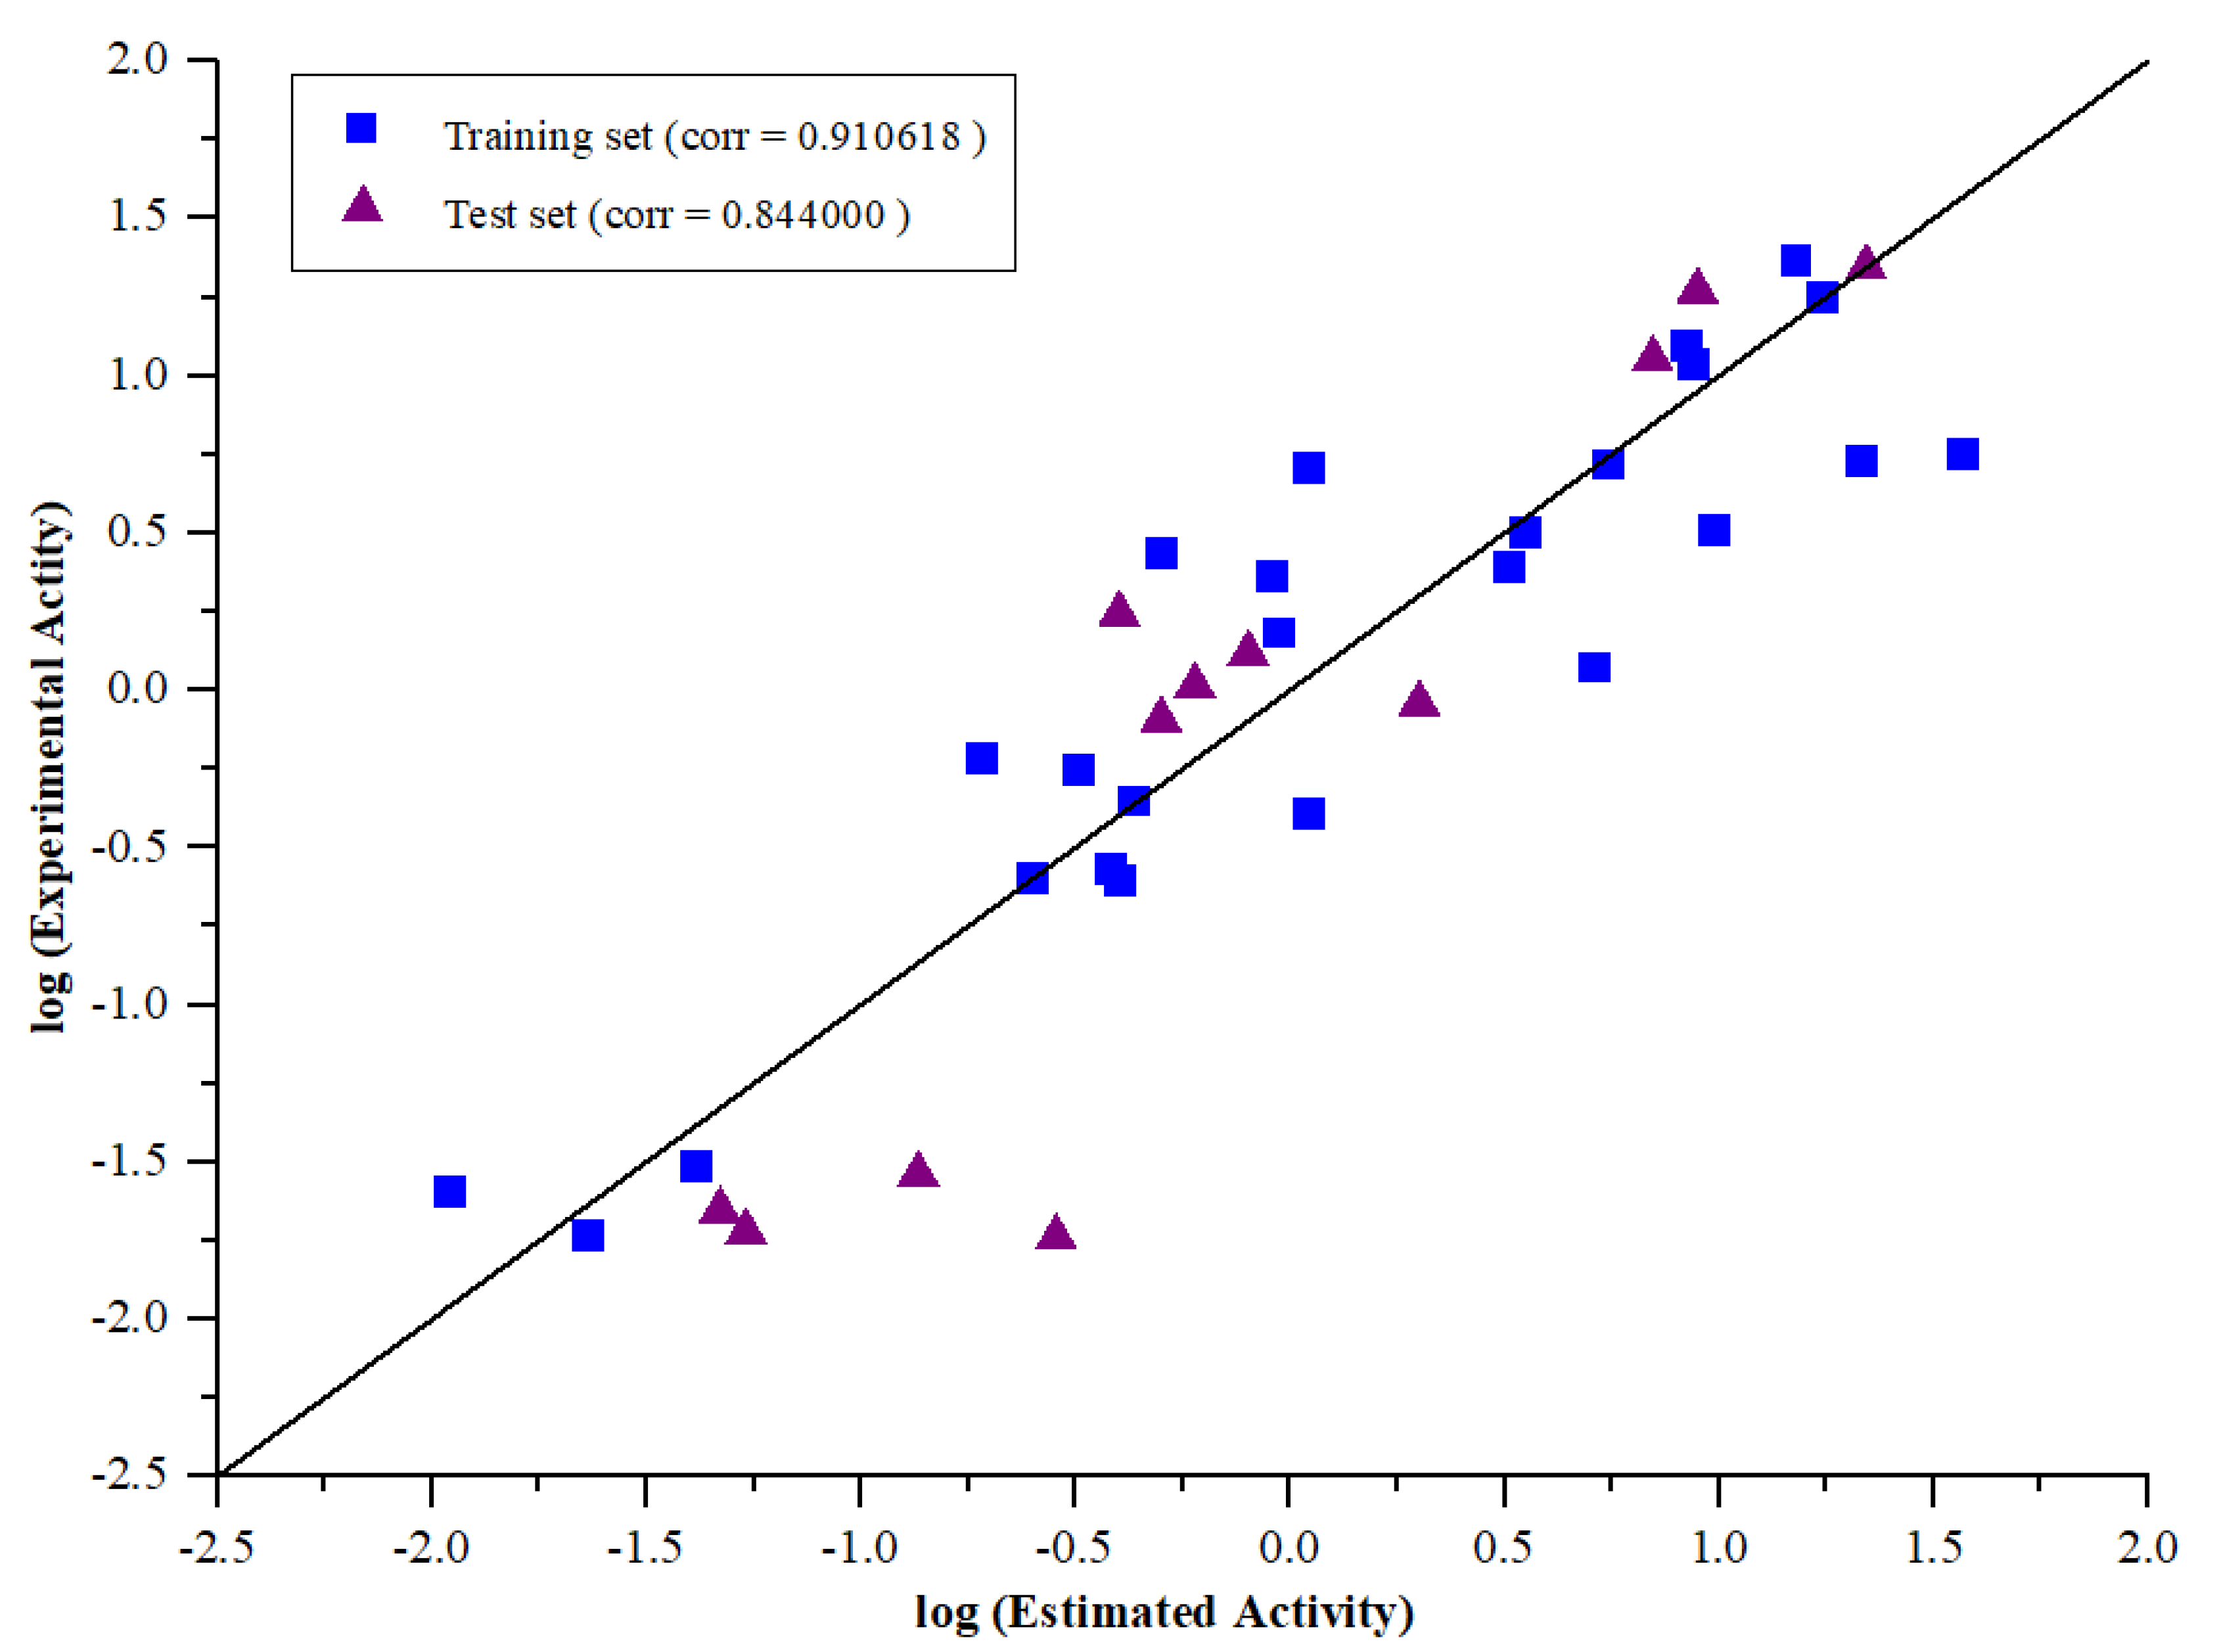
2.2.3. Test Set Analysis
2.3. Database Screening
2.4. ADMET and Toxicity Prediction
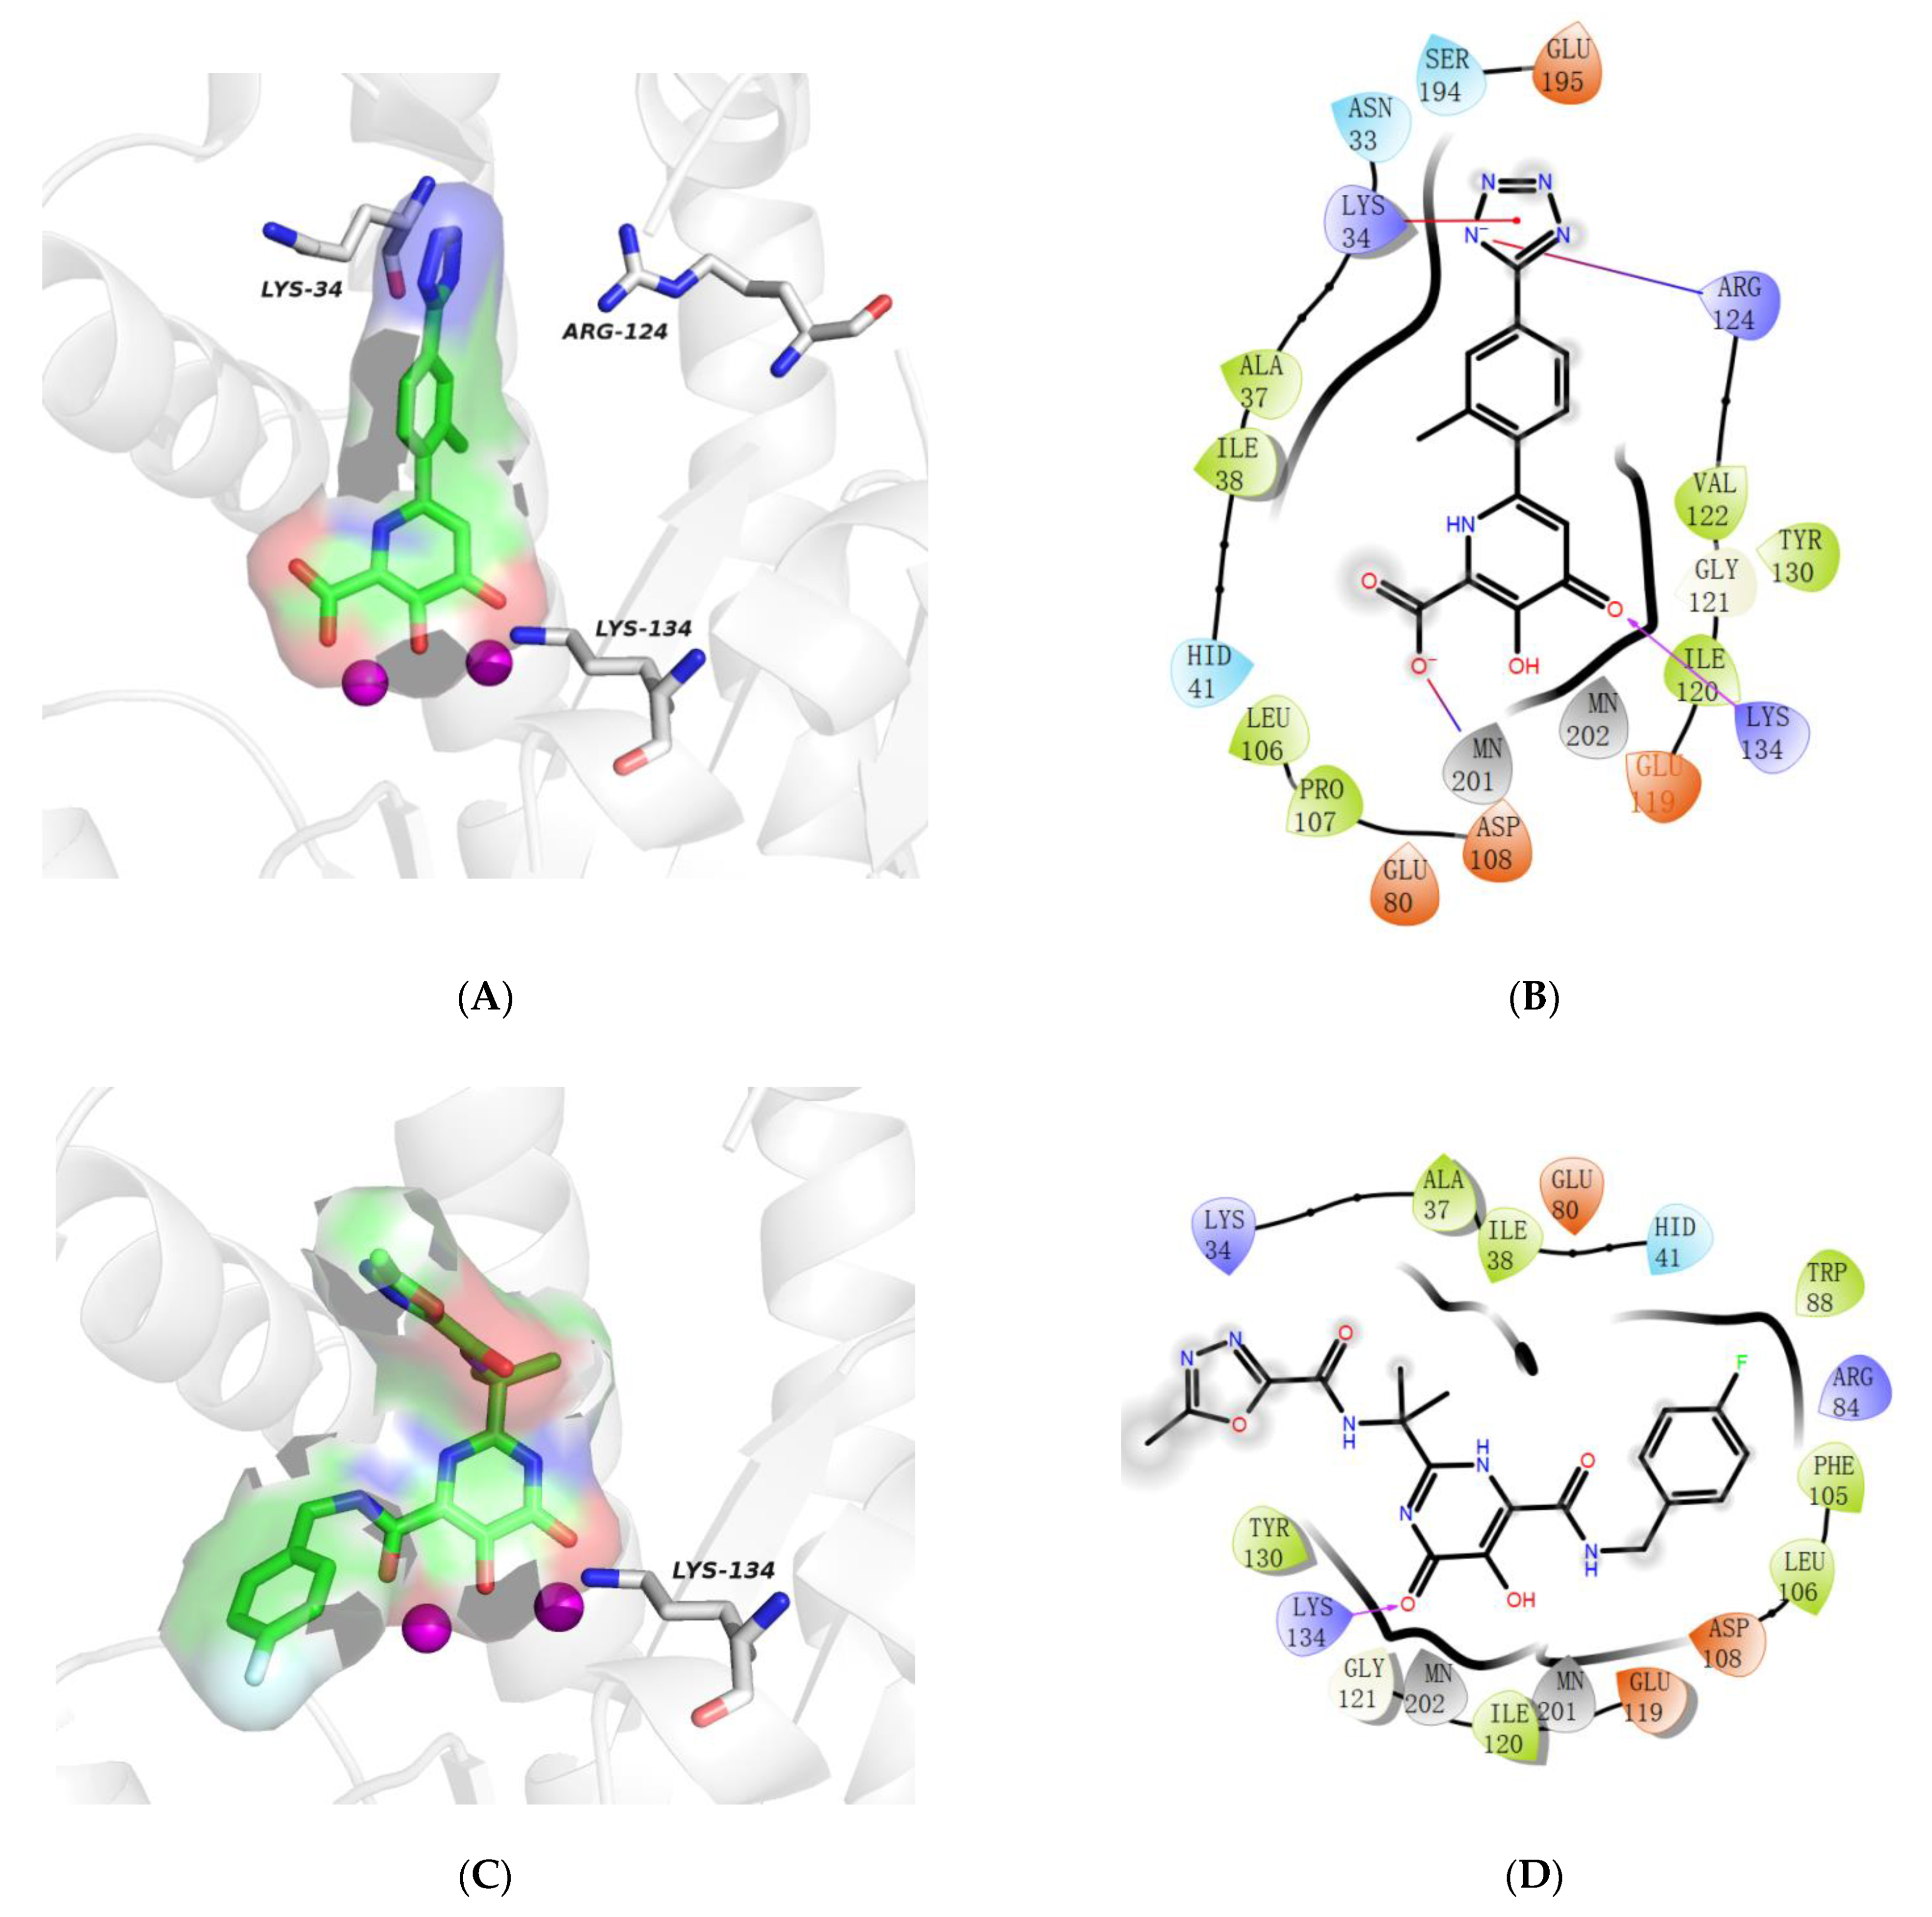
2.5. Molecular Docking Study
2.6. New Designed Compounds
3. Materials and Method
3.1. Compound Preparations
3.2. Generation of Pharmacophore Models
3.3. Pharmacophore Validation
3.4. Database Screening
3.5. Determination of In-Silico Pharmacokinetic Properties
3.6. Molecular Docking
3.7. New Designed Compounds
4. Conclusions
Supplementary Materials
Author Contributions
Funding
Institutional Review Board Statement
Informed Consent Statement
Data Availability Statement
Conflicts of Interest
Sample Availability
References
- Paules, C.; Subbarao, K. Influenza. Lancet 2017, 390, 697–708. [Google Scholar] [CrossRef]
- Gao, R.; Cao, B.; Hu, Y.; Feng, Z.; Wang, D.; Hu, W.; Chen, J.; Jie, Z.; Qiu, H.; Xu, K.; et al. Human infection with a novel avian-origin influenza A (H7N9) virus. N. Engl. J. Med. 2013, 368, 1888–1897. [Google Scholar] [CrossRef] [PubMed] [Green Version]
- Le, Q.M.; Kiso, M.; Someya, K.; Sakai, Y.T.; Nguyen, T.H.; Nguyen, K.H.L.; Pham, N.D.; Ngyen, H.H.; Yamada, S.; Muramoto, Y. Avian flu: Isolation of drug-resistant H5N1 virus. Nature 2005, 437, 1108. [Google Scholar] [CrossRef]
- Mcgowan, D.C.; Balemans, W.; Embrechts, W.; Motte, M.; Guillemont, J. Design, synthesis, and biological evaluation of novel indoles targeting the influenza PB2 cap binding region. J. Med. Chem. 2019, 62, 9680–9690. [Google Scholar] [CrossRef]
- Mills, C.E.; Robins, J.M.; Lipsitch, M. Transmissibility of 1918 pandemic influenza. Nature 2004, 432, 904–906. [Google Scholar] [CrossRef]
- Hayden, F.G.; Hay, A.J. Emergence and transmission of influenza A viruses resistant to amantadine and rimantadine. Curr. Top. Microbiol. Immunol. 1992, 176, 119–130. [Google Scholar] [CrossRef] [PubMed]
- Bright, R.A.; Medina, M.; Xu, X.; Perez-Oronoz, G.; Wallis, T.R.; Davis, X.M.; Povinelli, L.; Cox, N.J.; Klimov, A.I. Incidence of adamantane resistance among influenza A (H3N2) viruses isolated worldwide from 1994 to 2005: A cause for concern. Lancet 2005, 366, 1175–1181. [Google Scholar] [CrossRef]
- Moscona, A. Oseltamivir resistance—Disabling our influenza defenses. N. Engl. J. Med. 2005, 353, 2633–2636. [Google Scholar] [CrossRef] [PubMed]
- Bloom, J.D.; Gong, L.I.; Baltimore, D. Permissive secondary mutations enable the evolution of influenza oseltamivir resistance. Science 2010, 328, 1272–1275. [Google Scholar] [CrossRef] [Green Version]
- O’Hanlon, R.; Shaw, M.L. Baloxavir marboxil: The new influenza drug on the market. Curr. Opin. Virol. 2019, 35, 14–18. [Google Scholar] [CrossRef]
- Koszalka, P.; Tilmanis, D.; Roe, M.; Vijaykrishna, D.; Hurt, A.C. Baloxavir marboxil susceptibility of influenza viruses from the Asia-Pacific, 2012–2018. Antivir. Res. 2019, 164, 91–96. [Google Scholar] [CrossRef] [PubMed]
- Das, K.; Aramini, J.M.; Ma, L.; Krug, R.M.; Arnold, E. Structures of influenza A proteins and insights into antiviral drug targets. Nat. Struct. Mol. Biol. 2010, 17, 530–538. [Google Scholar] [CrossRef] [PubMed] [Green Version]
- He, X.; Zhou, J.; Bartlam, M.; Zhang, R.; Ma, J.; Lou, Z.; Li, X.; Li, J.; Joachimiak, A.; Zeng, Z. Crystal structure of the polymerase PAC–PB1N complex from an avian influenza H5N1 virus. Nature 2008, 454, 1123–1126. [Google Scholar] [CrossRef]
- Yuan, P.; Bartlam, M.; Lou, Z.; Chen, S.; Zhou, J.; He, X.; Ge, R.; Li, X.; Deng, T.; Lv, Z. Crystal structure of an avian influenza polymerase PA(N) reveals an endonuclease active site. Nature 2009, 458, 909–913. [Google Scholar] [CrossRef] [PubMed]
- Dias, A.; Bouvier, D.; Crépin, T.; McCarthy, A.A.; Hart, D.J.; Baudin, F.; Cusack, S.; Ruigrok, R.W.H. The cap-snatching endonuclease of influenza virus polymerase resides in the PA subunit. Nature 2009, 458, 914–918. [Google Scholar] [CrossRef]
- Barat, S.; Willer, Y.; Rizos, K.; Claudi, B.; Mazé, A.; Schemmer, A.K.; Kirchhoff, D.; Schmidt, A.; Burton, N.l; Bumann, D.; et al. Immunity to intracellular salmonella depends on surface-associated antigens. PLoS Pathog. 2012, 8, e1002966. [Google Scholar] [CrossRef] [Green Version]
- Tefsen, B.; Lu, G.; Zhu, Y.; Haywood, J.; Zhao, L.; Deng, T.; Qi, J.; Gao, G.F. The N-terminal domain of PA from bat-derived influenza-like virus H17N10 has endonuclease activity. J. Virol. 2014, 88, 1935–1941. [Google Scholar] [CrossRef] [Green Version]
- Jagger, B.W.; Wise, H.M.; Kash, J.C.; Walters, K.A.; Wills, N.M.; Xiao, Y.L.; Dunfee, R.L.; Schwartzman, L.M.; Ozinsky, A.; Bell, G.L.; et al. An overlapping protein-coding region in influenza A virus segment 3 modulates the host response. Science 2012, 337, 199–204. [Google Scholar] [CrossRef] [Green Version]
- Hara, K.; Schmidt, F.I.; Crow, M.; Brownlee, G.G. Amino acid residues in the N-terminal region of the PA subunit of influenza A virus RNA polymerase play a critical role in protein stability, endonuclease activity, cap binding, and virion RNA promoter binding. J. Virol. 2006, 80, 7789–7798. [Google Scholar] [CrossRef] [Green Version]
- Liu, X.; Zhu, F.; Ma, X.H.; Shi, Z.; Yang, S.Y.; Wei, Y.Q.; Chen, Y.Z. Predicting targeted polypharmacology for drug repositioning and multi-target drug discovery. Curr. Med. Chem. 2013, 20, 1646–1661. [Google Scholar] [CrossRef]
- Huang, H.; Yu, H.W.; Chen, C.; Hsu, C.; Chen, H.; Lee, K.; Tsai, F.; Chen, Y.C. Current developments of computer-aided drug design. J. Taiwan Inst. Chem. E. 2010, 41, 623–635. [Google Scholar] [CrossRef]
- Pal, S.; Kumar, V.; Kundu, B.; Bhattacharya, D.; Preethy, N.; Reddy, M.P.; Talukdar, A. Ligand-based pharmacophore modeling, virtual screening and molecular docking studies for discovery of potential topoisomerase I inhibitors. Comput. Struct. Biotech. J. 2019, 17, 291–310. [Google Scholar] [CrossRef]
- Ju, H.; Zhang, J.; Huang, B.; Kang, D.; Huang, B.; Liu, X.; Zhan, P. Inhibitors of influenza virus polymerase acidic (PA) endonuclease: Contemporary developments and perspectives. J. Med. Chem. 2017, 60, 3533–3551. [Google Scholar] [CrossRef]
- Stevaert, A.; Nurra, S.; Pala, N.; Carcelli, M.; Rogolino, D.; Shepard, C.; Domaoal, R.A.; Kim, B.; Alfonso-Prieto, M.; Marras, S.A.E.; et al. An integrated biological approach to guide the development of metal-chelating inhibitors of influenza virus PA endonuclease. Mol. Pharmacol. 2015, 87, 323–337. [Google Scholar] [CrossRef] [PubMed]
- Sagong, H.Y.; Parhi, A.; Bauman, J.D.; Patel, D.; Vijayan, R.S.K.; Das, K.; Arnold, E.; LaVoie, E.J. 3-Hydroxyquinolin-2(1H)-ones as inhibitors of influenza A endonuclease. ACS Med. Chem. Lett. 2013, 4, 547–550. [Google Scholar] [CrossRef] [PubMed] [Green Version]
- Parhi, A.K.; Xiang, A.; Bauman, J.D.; Patel, D.; Vijayan, R.S.K.; Das, K.; Arnold, E.; LaVoie, E.J. Phenyl substituted 3-hydroxypyridin-2(1H)-ones: Inhibitors of influenza A endonuclease. Bioorg. Med. Chem. 2013, 21, 6435–6446. [Google Scholar] [CrossRef]
- Zhang, C.; Xie, Q.; Wan, C.C.; Jin, Z.; Hu, C. Recent advances in small-molecule HIV-1 integrase inhibitors. Curr. Med. Chem. 2021, 28, 4910–4934. [Google Scholar] [CrossRef]
- Credille, C.V.; Morrison, C.N.; Stokes, R.W.; Dick, B.L.; Feng, Y.; Sun, J.; Chen, Y.; Cohen, S.M. SAR exploration of tight binding inhibitors of influenza virus PA endonuclease. J. Med. Chem. 2019, 62, 9438–9449. [Google Scholar] [CrossRef]
- Monod, A.; Swale, C.; Tarus, B.; Tissot, A.; Delmas, B.; Ruigrok, R.W.H.; Crépin, T.; Slama-Schwok, A. Learning from structure-based drug design and new antivirals targeting the ribonucleoprotein complex for the treatment of influenza. Expert Opin. Drug Dis. 2015, 10, 345–371. [Google Scholar] [CrossRef]
- Song, M.; Kumar, G.; Shadrick, W.R.; Zhou, W.; Jeevan, T.; Li, Z.; Slavish, P.J.; Fabrizio, T.P.; Yoon, S.; Webb, T.R.; et al. Identification and characterization of influenza variants resistant to a viral endonuclease inhibitor. Proc. Nat. Acad. Sci. USA 2016, 113, 3669–3674. [Google Scholar] [CrossRef] [Green Version]
- Zima, V.; Radilova, K.; Kozisek, M.; Albinana, C.B.; Karlukova, E.; Brynda, J.; Fanfrlik, J.; Flieger, M.; Hodek, J.; Weber, J.; et al. Unraveling the anti-influenza effect of flavonoids: Experimental validation of luteolin and its congeners as potent influenza endonuclease inhibitors. Eur. J. Med. Chem. 2020, 227, 112754. [Google Scholar] [CrossRef] [PubMed]
- DuBois, R.M.; Slavish, P.J.; Baughman, B.M.; Yun, M.; Bao, J.; Webby, R.J.; Webb, T.R.; White, S.W.; Pekosz, A. Structural and biochemical basis for development of influenza virus inhibitors targeting the PA endonuclease. PLoS Pathog. 2012, 8, 1002830. [Google Scholar] [CrossRef] [PubMed]
- Zhao, C.; Lou, Z.; Guo, Y.; Ma, M.; Chen, Y.; Liang, S.; Zhang, L.; Chen, S.; Li, X.; Liu, Y.; et al. Nucleoside monophosphate complex structures of the endonuclease domain from the influenza virus polymerase PA subunit reveal the substrate binding site inside the catalytic center. J. Virol. 2009, 83, 9024–9030. [Google Scholar] [CrossRef] [PubMed] [Green Version]
- Kotlarek, D.; Worch, R.; Huang, X. New insight into metal ion-driven catalysis of nucleic acids by influenza PA-Nter. PLoS ONE 2016, 11, e0156972. [Google Scholar] [CrossRef] [Green Version]
- Mbhele, N.; Chimukangara, B.; Gordon, M. HIV-1 integrase strand transfer inhibitors: A review of current drugs, recent advances and drug resistance. Int. J. Antimicrob. Agents 2021, 57, 106343. [Google Scholar] [CrossRef]
- Yesselman, J.D.; Price, D.J.; Knight, J.L.; Brooks, C.L., III. MATCH: An atom-typing toolset for molecular mechanics force fields. J. Comput. Chem. 2012, 33, 189–202. [Google Scholar] [CrossRef] [Green Version]
- Deng, P.; Jiang, J.; Yu, Y.; Hu, X.; Yuan, J.; Gan, Z. Application of Discovery Studio software in the teaching of medicinal chemistry. Pharm. Educ. 2021, 37, 56–61. [Google Scholar] [CrossRef]
- Dai, Y.; Wang, Q.; Zhang, X.; Jia, S.; Zheng, H.; Feng, D.; Yu, P. Molecular docking and QSAR study on steroidal compounds as aromatase inhibitors. Eur. J. Med. Chem. 2010, 45, 5612–5620. [Google Scholar] [CrossRef]
- Sastry, G.M.; Adzhigirey, M.; Day, T.; Annabhimoju, R.; Sherman, W. Protein and ligand preparation: Parameters, protocols, and influence on virtual screening enrichments. J. Comput. Aid. Mol. Des. 2013, 27, 221–234. [Google Scholar] [CrossRef]
- Ponnan, P.; Gupta, S.; Chopra, M.; Tandon, R.; Baghel, A.S.; Gupta, G.; Prasad, A.K.; Rastogi, R.C.; Bose, M.; Raj, H.G. 2D-QSAR, docking studies, and in silico ADMET prediction of polyphenolic acetates as substrates for protein acetyltransferase function of glutamine synthetase of mycobacterium tuberculosis. ISRN Struct. Biol. 2013, 2013, 1–12. [Google Scholar] [CrossRef] [Green Version]
- Gaur, R.; Cheema, H.S.; Kumar, Y.; Singh, S.P.; Yadav, D.K.; Darokar, M.P.; Khan, F.; Bhakuni, R.S. In vitro antimalarial activity and molecular modeling studies of novel artemisinin derivatives. RSC Adv. 2015, 5, 47959–47974. [Google Scholar] [CrossRef]
- Shahin, R.; Swellmeen, L.; Shaheen, O.; Aboalhaija, N.; Habash, M. Identification of novel inhibitors for Pim-1 kinase using pharmacophore modeling based on a novel method for selecting pharmacophore generation subsets. J. Comput. Aid. Mol. Des. 2016, 30, 39–68. [Google Scholar] [CrossRef] [PubMed]
- John, S.; Thangapandian, S.; Arooj, M.; Hong, J.C.; Kim, K.D.; Lee, K.W. Development, evaluation and application of 3D QSAR pharmacophore model in the discovery of potential human renin inhibitors. BMC Bioinform. 2011, 12, S4. [Google Scholar] [CrossRef] [Green Version]
- Schuster, D.; Laggner, C.; Steindl, T.M.; Palusczak, A.; Hartmann, R.W.; Langer, T. Pharmacophore modeling and in silico screening for new P450 19 (aromatase) inhibitors. J. Chem. Inf. Model. 2006, 46, 1301–1311. [Google Scholar] [CrossRef]
- Hess, B.; Bekker, H.; Berendsen, H.J.C.; Fraaije, J.G.E.M. LINCS: A linear constraint solver for molecular simulations. J. Comput. Chem. 1997, 18, 1463–1472. [Google Scholar] [CrossRef]
- Dube, D.; Periwal, V.; Kumar, M.; Sharma, S.; Singh, T.P.; Kaur, P. 3D-QSAR based pharmacophore modeling and virtual screening for identification of novel pteridine reductase inhibitors. J. Mol. Model. 2012, 18, 1701–1711. [Google Scholar] [CrossRef]
- Ahamed, J.I.; Meena, K.S. Synthesis, characterization, antibacterial activities and molecular docking studies of some novel therapeutic N, N’-disubstituted β-branched nitroolefin piperazine derivatives. Int. J. Pharm. Bio Sci. 2018, 9, 1–15. [Google Scholar] [CrossRef]
- Kuck, D.; Singh, N.; Lyko, F.; Medina-Franco, J.L. Novel and selective DNA methyltransferase inhibitors: Docking-based virtual screening and experimental evaluation. Bioorg. Med. Chem. 2010, 18, 822–829. [Google Scholar] [CrossRef] [PubMed]
- Medina-Franco, J.L.; López-Vallejo, F.; Kuck, D.; Lyko, F. Natural products as DNA methyltransferase inhibitors: A computer-aided discovery approach. Mol. Divers. 2011, 15, 293–304. [Google Scholar] [CrossRef]
- Friesner, R.A.; Murphy, R.B.; Repasky, M.P.; Frye, L.L.; Greenwood, J.R.; Halgren, T.A.; Sanschagrin, P.C.; Mainz, D.T. Extra precision glide: Docking and scoring incorporating a model of hydrophobic enclosure for protein-ligand complexes. J. Med. Chem. 2006, 49, 6177–6196. [Google Scholar] [CrossRef] [Green Version]


| Hypo. No. | Total Cost | Cost Difference | RMSD | Correlation | Max.Fit | Features |
|---|---|---|---|---|---|---|
| 1 | 130.623 | 272.95 | 2.16926 | 0.910618 | 7.00748 | HBA, HBD, HYD, RA |
| 2 | 156.57 | 247.01 | 2.60686 | 0.867964 | 7.31818 | HBA, HBA, HBD, HYD |
| 3 | 157.184 | 246.39 | 2.5833 | 0.870548 | 5.4078 | HBD, HBD, HYD, RA |
| 4 | 160.073 | 243.50 | 2.62325 | 0.866204 | 5.25001 | HBD, HBD, HYD, HYD |
| 5 | 165.706 | 237.87 | 2.74058 | 0.852888 | 6.97954 | HBA, HBA, HYD, RA |
| 6 | 168.233 | 235.34 | 2.74498 | 0.852405 | 5.2546 | HBD, HBD, HYD, HYD |
| 7 | 168.516 | 235.06 | 2.77498 | 0.848851 | 6.47651 | HBA, HBD, HBD, HYD |
| 8 | 171.636 | 231.94 | 2.82585 | 0.842729 | 6.98225 | HBA, HBD, HYD, RA |
| 9 | 172.439 | 231.14 | 2.81172 | 0.84447 | 5.49327 | HBA, HBD, HYD, RA |
| 10 | 172.486 | 231.09 | 2.82443 | 0.842919 | 6.04898 | HBA, HBA, HYD, RA |
| Comp. No. | IC50 Value (μM) | Errors a | Fit Value b | Activity Scale c | ||
|---|---|---|---|---|---|---|
| Experimental | Estimated | Experimental | Estimated | |||
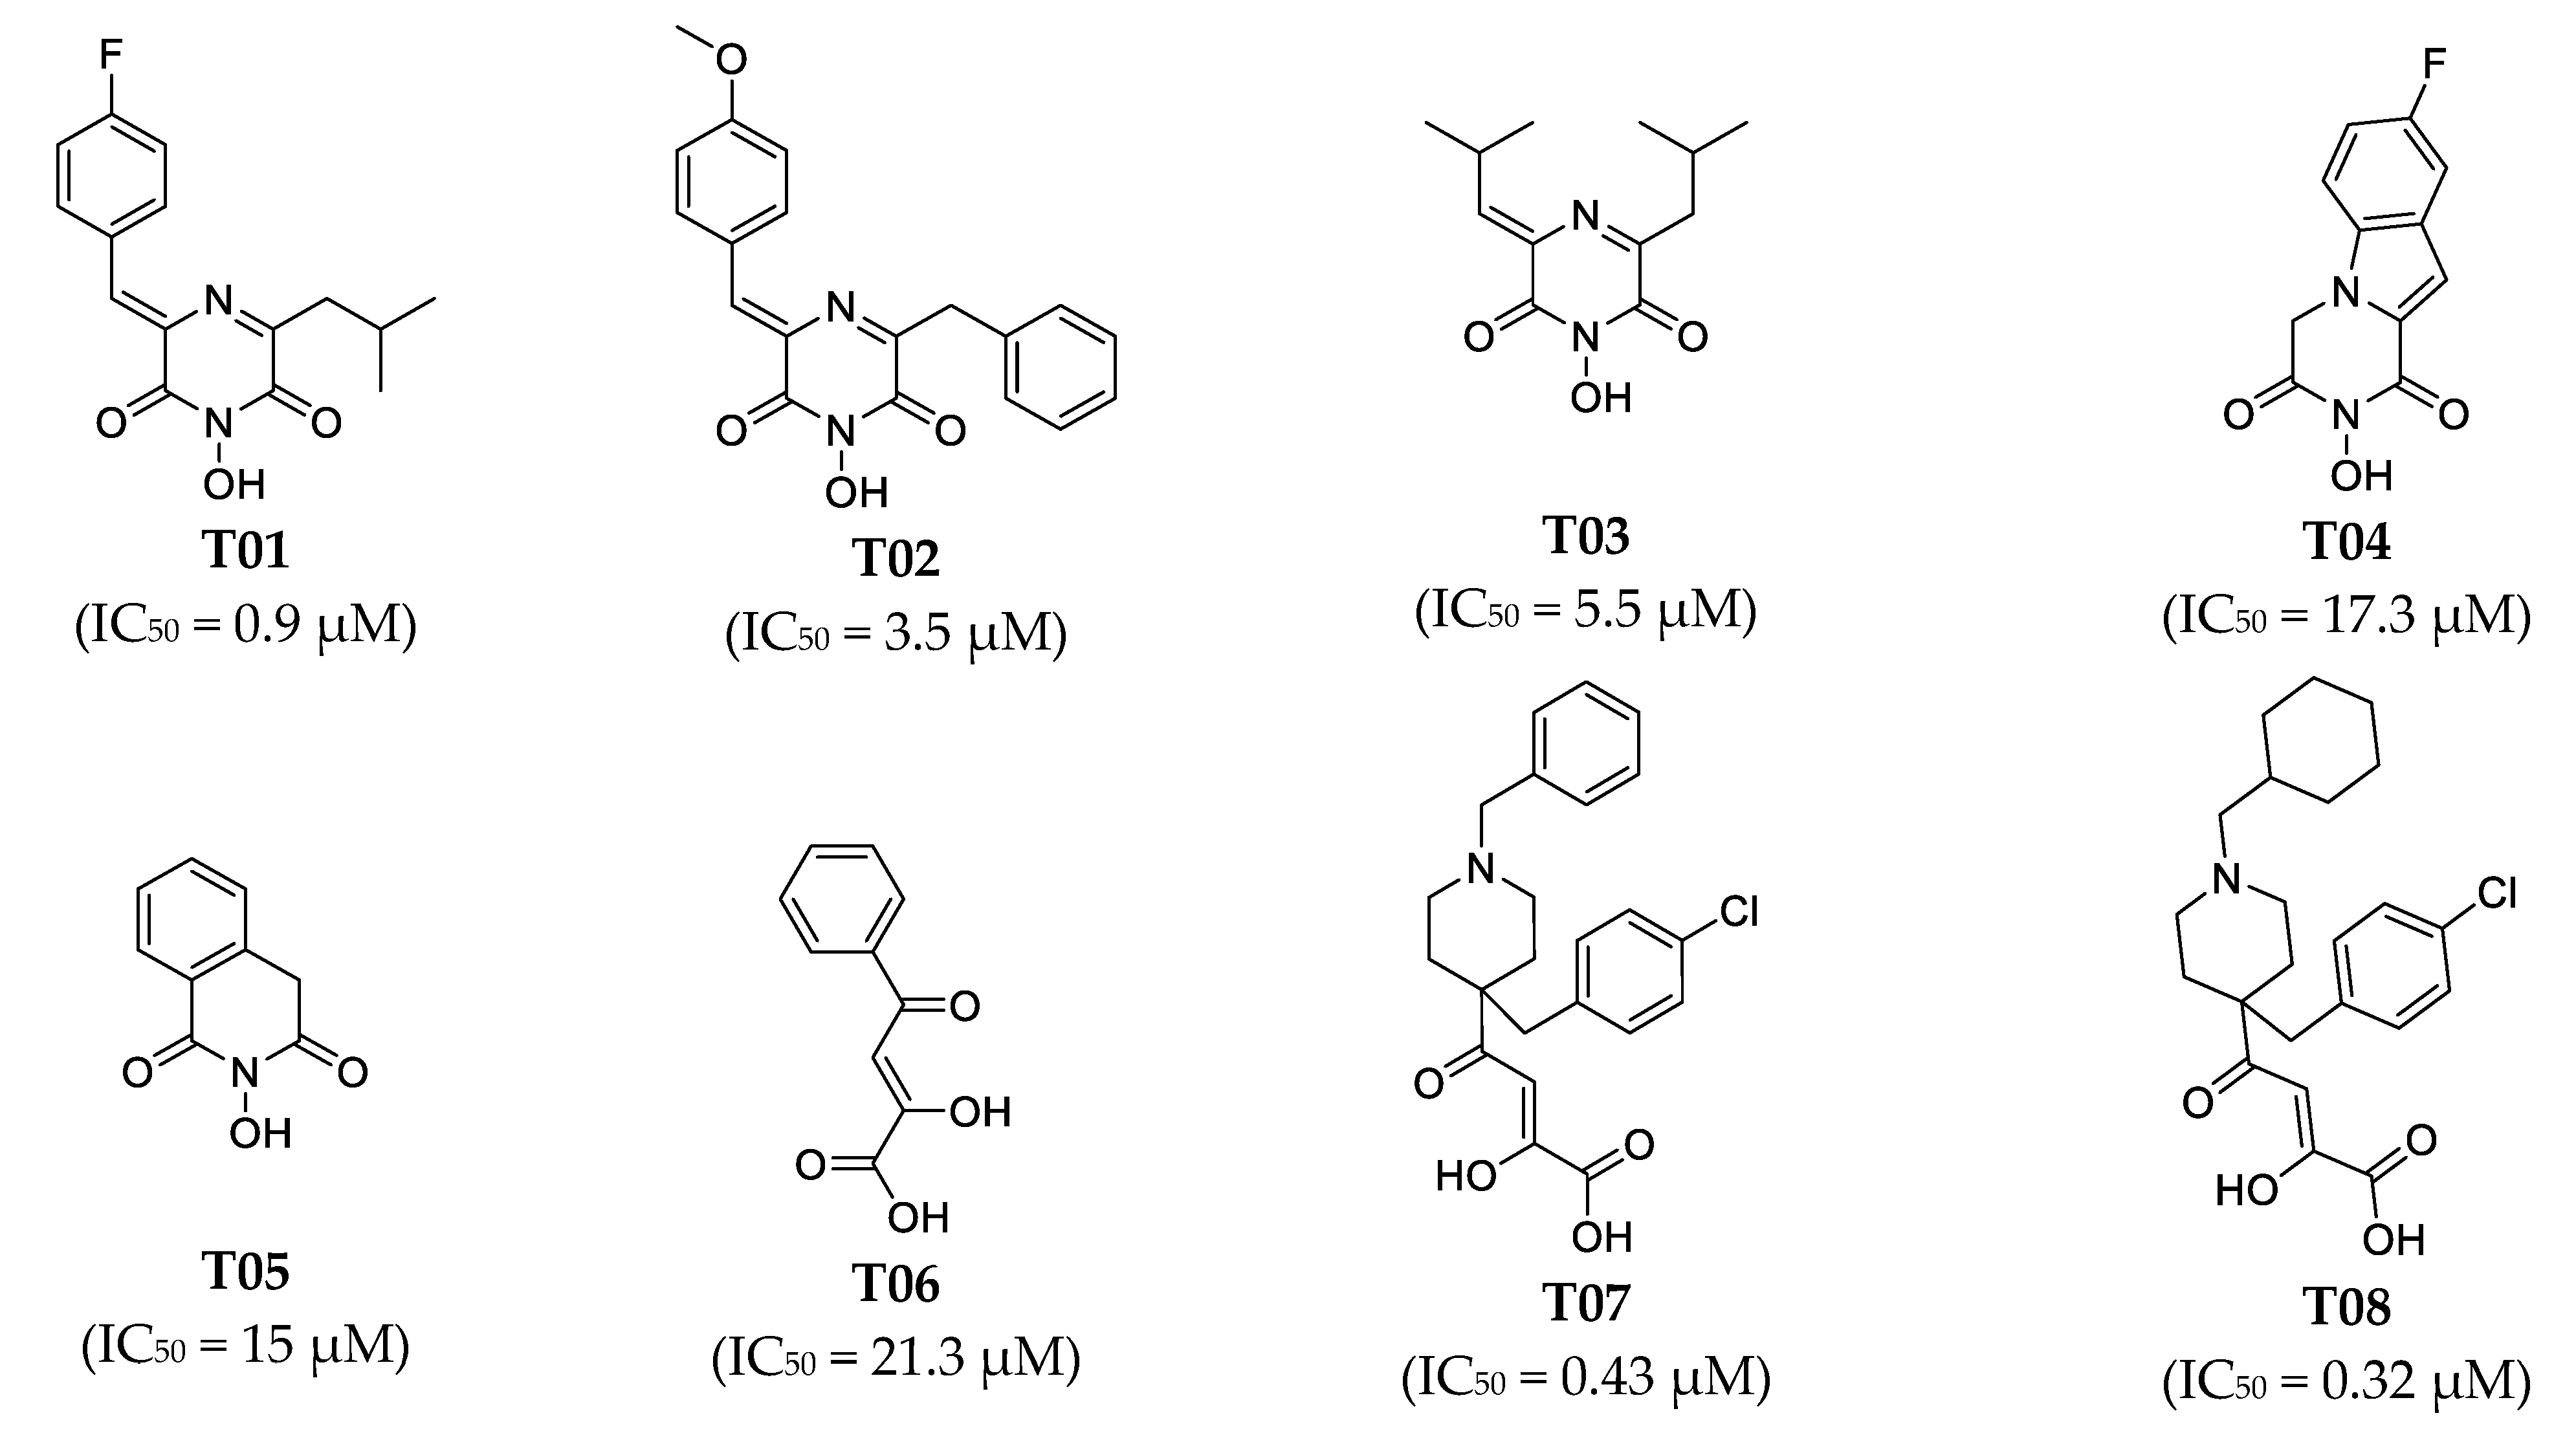
| T01 | 0.9 | 2.4 | 2.6 | 4.26 | +++ | ++ |
| T02 | 3.5 | 3.2 | −1.1 | 4.12 | ++ | ++ |
| T03 | 5.5 | 5.3 | −1 | 3.91 | ++ | ++ |
| T04 | 17.3 | 18 | 1 | 3.38 | + | + |
| T05 | 15 | 23 | 1.5 | 3.26 | + | + |
| T06 | 21.3 | 5.4 | −4 | 3.9 | + | ++ |
| T07 | 0.43 | 0.44 | 1 | 4.99 | +++ | +++ |
| T08 | 0.32 | 0.56 | 1.7 | 4.89 | +++ | +++ |
| T09 | 1.1 | 0.41 | −2.7 | 5.02 | ++ | +++ |
| T10 | 0.19 | 0.6 | 3.2 | 4.85 | +++ | +++ |
| T11 | 0.5 | 2.7 | 5.5 | 4.19 | +++ | ++ |
| T12 | 1.1 | 5.1 | 4.7 | 3.92 | ++ | ++ |
| T13 | 0.25 | 0.25 | 1 | 5.22 | +++ | +++ |
| T14 | 0.4 | 0.25 | −1.6 | 5.23 | +++ | +++ |
| T15 | 0.041 | 0.031 | −1.3 | 6.14 | ++++ | ++++ |
| T16 | 0.38 | 0.27 | −1.4 | 5.19 | +++ | +++ |
| T17 | 3.23 | 2.5 | −1.3 | 4.23 | ++ | ++ |
| T18 | 5.12 | 1.2 | −4.3 | 4.55 | ++ | ++ |
| T19 | 0.94 | 1.5 | 1.6 | 4.44 | +++ | ++ |
| T20 | 8.7 | 11 | 1.2 | 3.6 | ++ | + |
| T21 | 9.7 | 3.4 | −2.9 | 4.1 | ++ | ++ |
| T22 | 8.3 | 13 | 1.5 | 3.53 | ++ | + |
| T23 | 37 | 5.7 | −6.5 | 3.88 | + | ++ |
| T24 | 0.011 | 0.026 | 2.3 | 6.22 | ++++ | ++++ |
| T25 | 0.023 | 0.019 | −1.2 | 6.35 | ++++ | ++++ |
| Comp. No. | IC50 Value (μM) | Errors a | Fit Value b | Activity Scale c | ||
|---|---|---|---|---|---|---|
| Experimental | Estimated | Experimental | Estimated | |||
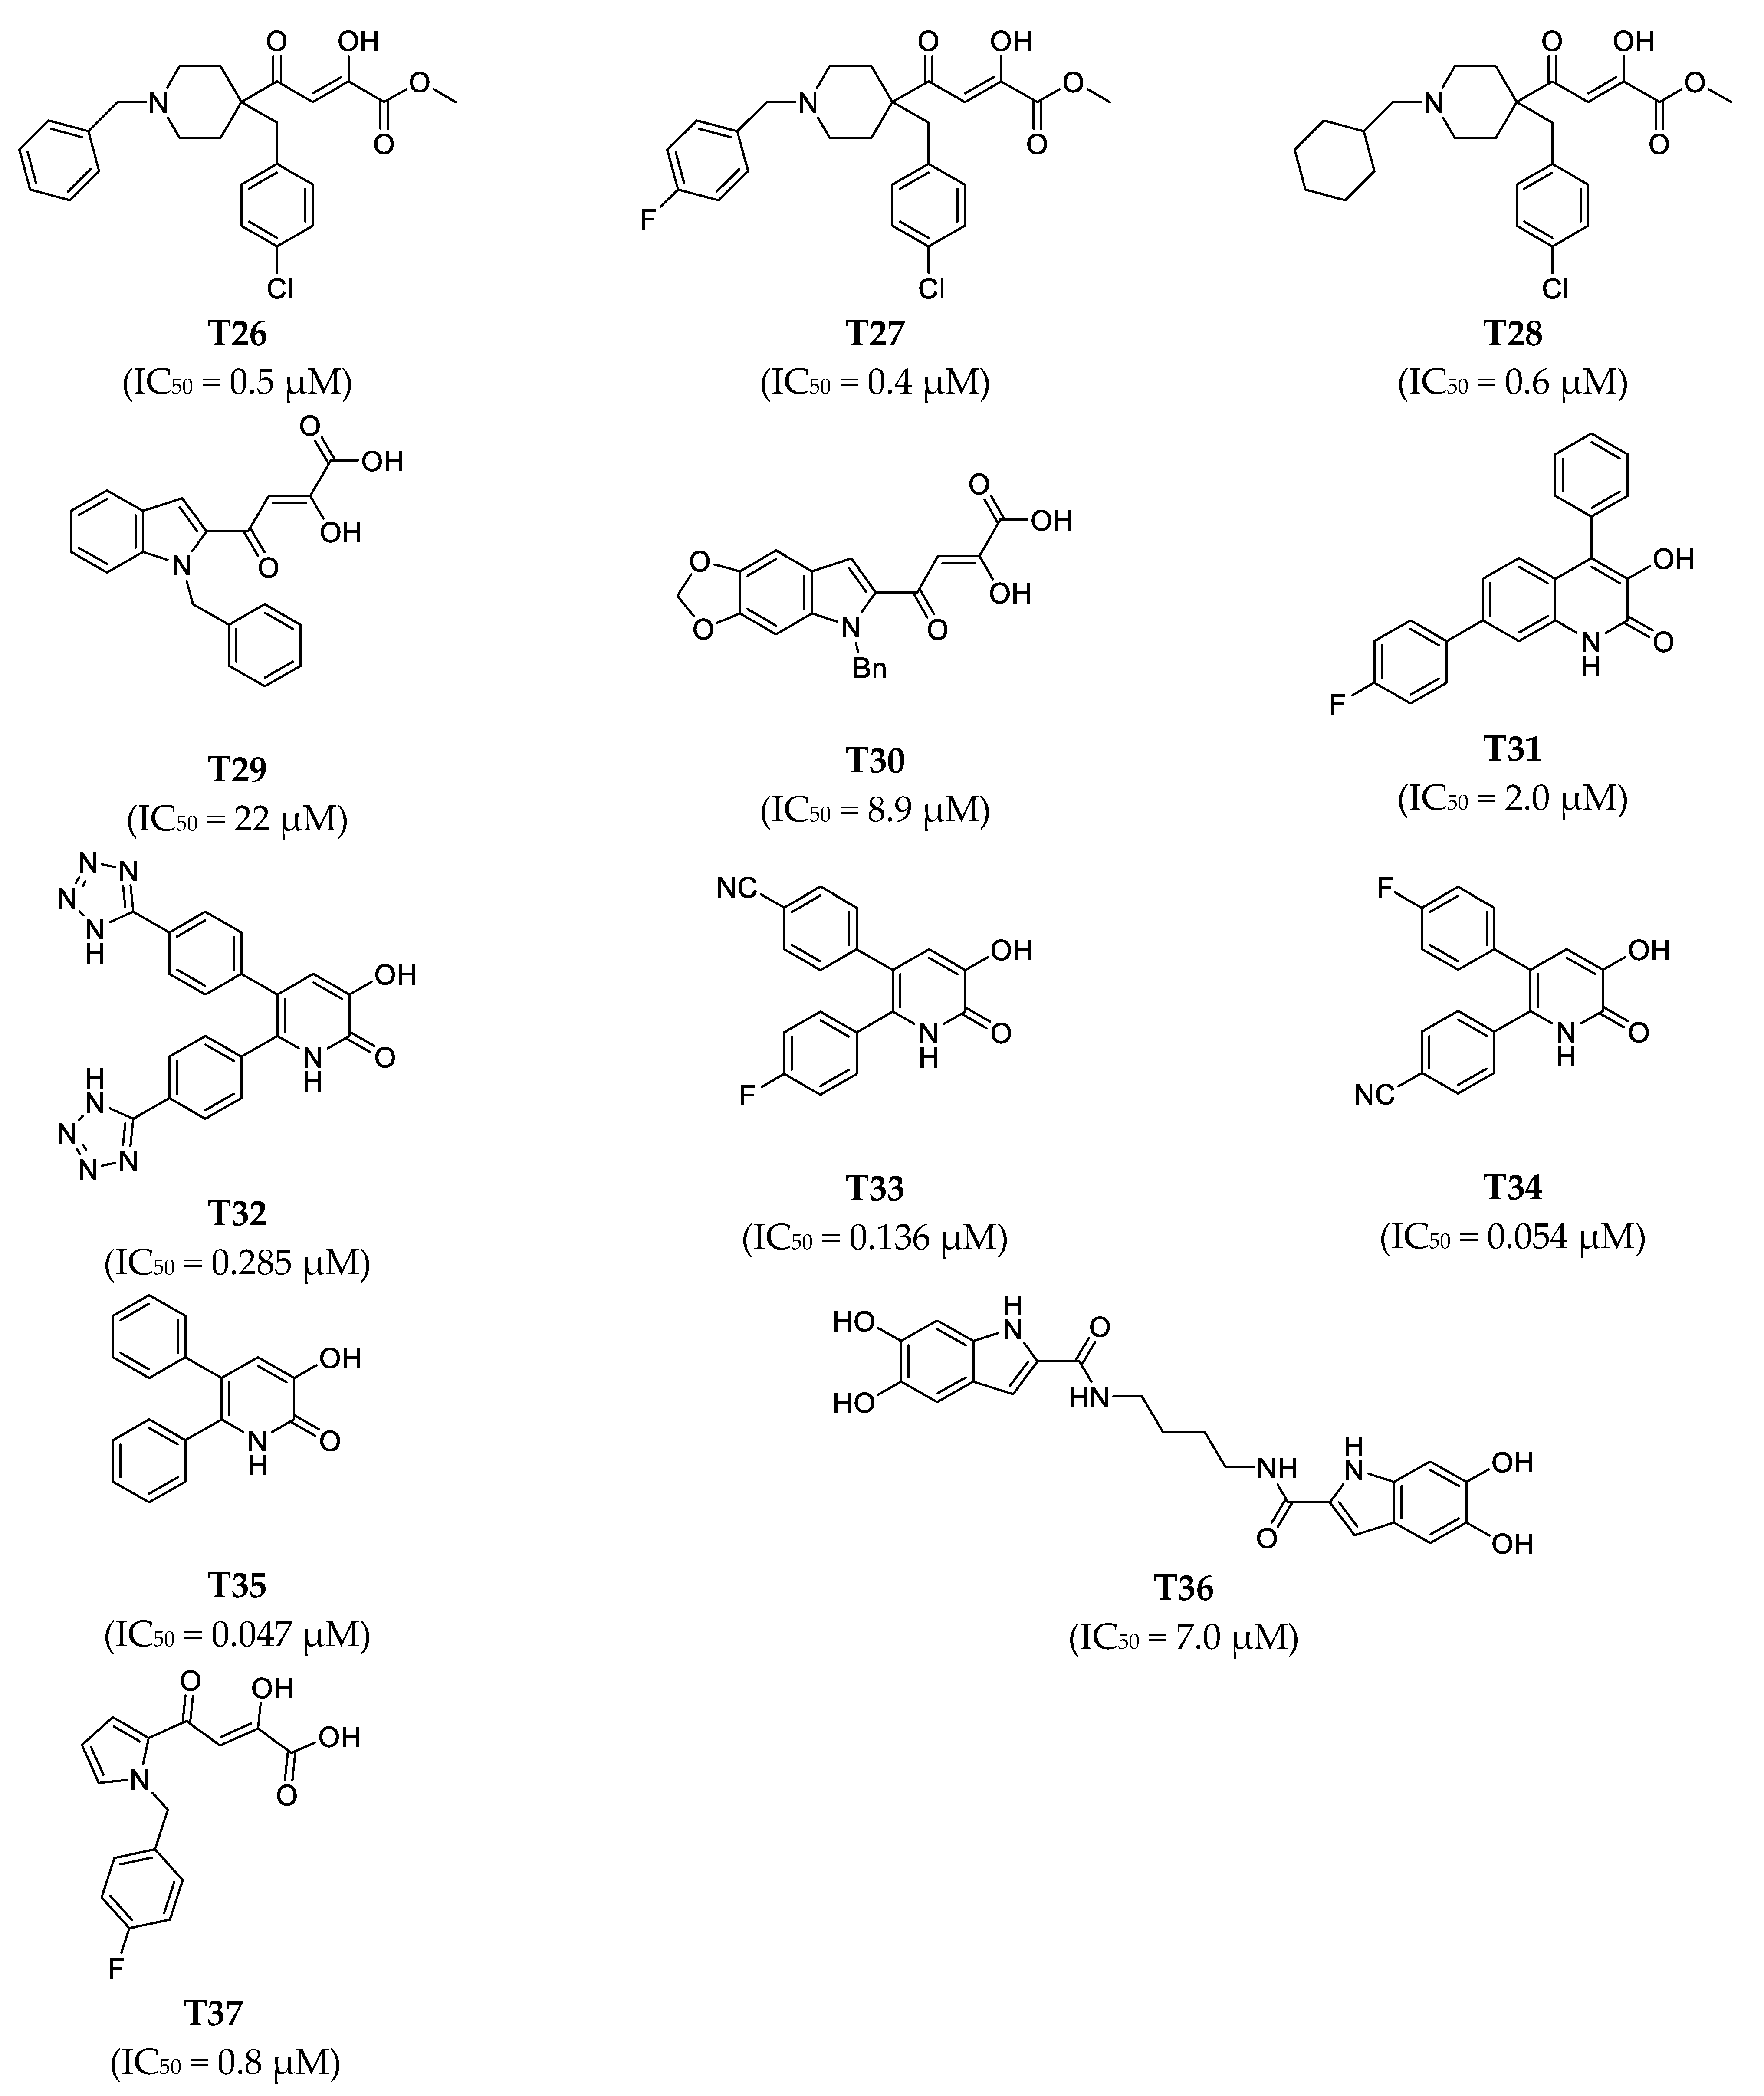
| T26 | 0.5 | 0.81 | 1.6 | 4.72 | +++ | +++ |
| T27 | 0.4 | 1.8 | 4.4 | 4.39 | +++ | ++ |
| T28 | 0.6 | 1.0 | 1.7 | 4.62 | +++ | ++ |
| T29 | 22 | 22 | 1.0 | 3.28 | + | + |
| T30 | 8.9 | 19 | 2.1 | 3.36 | ++ | + |
| T31 | 2.0 | 0.91 | −2.2 | 4.67 | ++ | +++ |
| T32 | 0.285 | 0.018 | −16 | 6.37 | +++ | ++++ |
| T33 | 0.136 | 0.029 | −4.7 | 6.17 | +++ | ++++ |
| T34 | 0.054 | 0.019 | −2.8 | 6.35 | ++++ | ++++ |
| T35 | 0.047 | 0.022 | −2.1 | 6.28 | ++++ | ++++ |
| T36 | 7.0 | 11 | 1.6 | 3.58 | ++ | + |
| T37 | 0.8 | 1.3 | 1.6 | 4.51 | +++ | ++ |
| Comp. No. | ADME Solubility Level | ADME BBB Level | ADME Absorption Level | CYP2D6 Prediction | PPB Prediction |
|---|---|---|---|---|---|
| Hit01 | 3 | 4 | 3 | false | false |
| Hit02 | 3 | 3 | 0 | false | true |
| Hit03 | 2 | 3 | 0 | false | false |
| Hit04 | 3 | 2 | 0 | false | true |
| Hit05 | 2 | 4 | 1 | false | true |
| Hit06 | 3 | 4 | 0 | false | false |
| Comp. No. | Hit01 | Hit02 | Hit03 | Hit04 | Hit05 | Hit06 |
|---|---|---|---|---|---|---|
| NTP carcinogenicity male Rat | NC | NC | NC | NC | NC | NC |
| NTP carcinogenicity female Rat | NC | NC | NC | NC | NC | NC |
| NTP carcinogenicity Call (Male mouse) | NC | C | C | C | C | NC |
| NTP carcinogenicity Call (Female mouse) | NC | NC | NC | NC | NC | NC |
| Ames mutagenicity | NM | NM | NM | NM | NM | NM |
| Developmental Toxicity Potential (DTP) | NT | T | NT | NT | NT | T |
| Rat oral LD50 (in g/kg) | 0.39282 | 0.183468 | 0.627103 | 0.216087 | 0.744138 | 2.43894 |
| Skin irritation | None | None | None | None | None | None |
| Comp. No. | H-Bond Interaction | H-Bond Distance (Å) | Docking Score (kcal/mol) |
|---|---|---|---|
| T38 | Lys134 | 1.9 | −8.227 |
| Hit01 | Lys134 | 2.8 | −6.622 |
| Comp. No. | Structure | Estimate | Fit Value | Docking Scores (kcal/mol) |
|---|---|---|---|---|
| Hit07 |  | 0.12478 | 5.53416 | −5.791 |
| Hit08 |  | 0.13246 | 5.50822 | −10.803 |
| Hit09 |  | 0.159602 | 5.42726 | −8.626 |
| Hit10 |  | 0.800934 | 4.7267 | −8.944 |
| Hit11 |  | 1.03327 | 4.61609 | −7.131 |
| Hit12 | 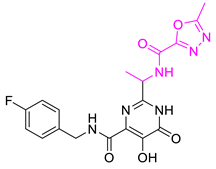 | 1.08169 | 4.5962 | −9.938 |
Publisher’s Note: MDPI stays neutral with regard to jurisdictional claims in published maps and institutional affiliations. |
© 2021 by the authors. Licensee MDPI, Basel, Switzerland. This article is an open access article distributed under the terms and conditions of the Creative Commons Attribution (CC BY) license (https://creativecommons.org/licenses/by/4.0/).
Share and Cite
Zhang, C.; Xiang, J.; Xie, Q.; Zhao, J.; Zhang, H.; Huang, E.; Shaw, P.; Liu, X.; Hu, C. Identification of Influenza PAN Endonuclease Inhibitors via 3D-QSAR Modeling and Docking-Based Virtual Screening. Molecules 2021, 26, 7129. https://doi.org/10.3390/molecules26237129
Zhang C, Xiang J, Xie Q, Zhao J, Zhang H, Huang E, Shaw P, Liu X, Hu C. Identification of Influenza PAN Endonuclease Inhibitors via 3D-QSAR Modeling and Docking-Based Virtual Screening. Molecules. 2021; 26(23):7129. https://doi.org/10.3390/molecules26237129
Chicago/Turabian StyleZhang, Chao, Junjie Xiang, Qian Xie, Jing Zhao, Hong Zhang, Erfang Huang, Pangchui Shaw, Xiaoping Liu, and Chun Hu. 2021. "Identification of Influenza PAN Endonuclease Inhibitors via 3D-QSAR Modeling and Docking-Based Virtual Screening" Molecules 26, no. 23: 7129. https://doi.org/10.3390/molecules26237129