
Surface Pretreatments of AA5083 Aluminum Alloy with Enhanced Corrosion Protection for Cerium-Based Conversion Coatings Application: Combined Experimental and Computational Analysis

 ,
,
Abstract
:1. Introduction
2. Experimental Procedures
2.1. Sample Pretreatment and Preparation
2.2. Electrochemical Tests
2.3. Surface Characterization
3. The Procedures for Computational Analysis
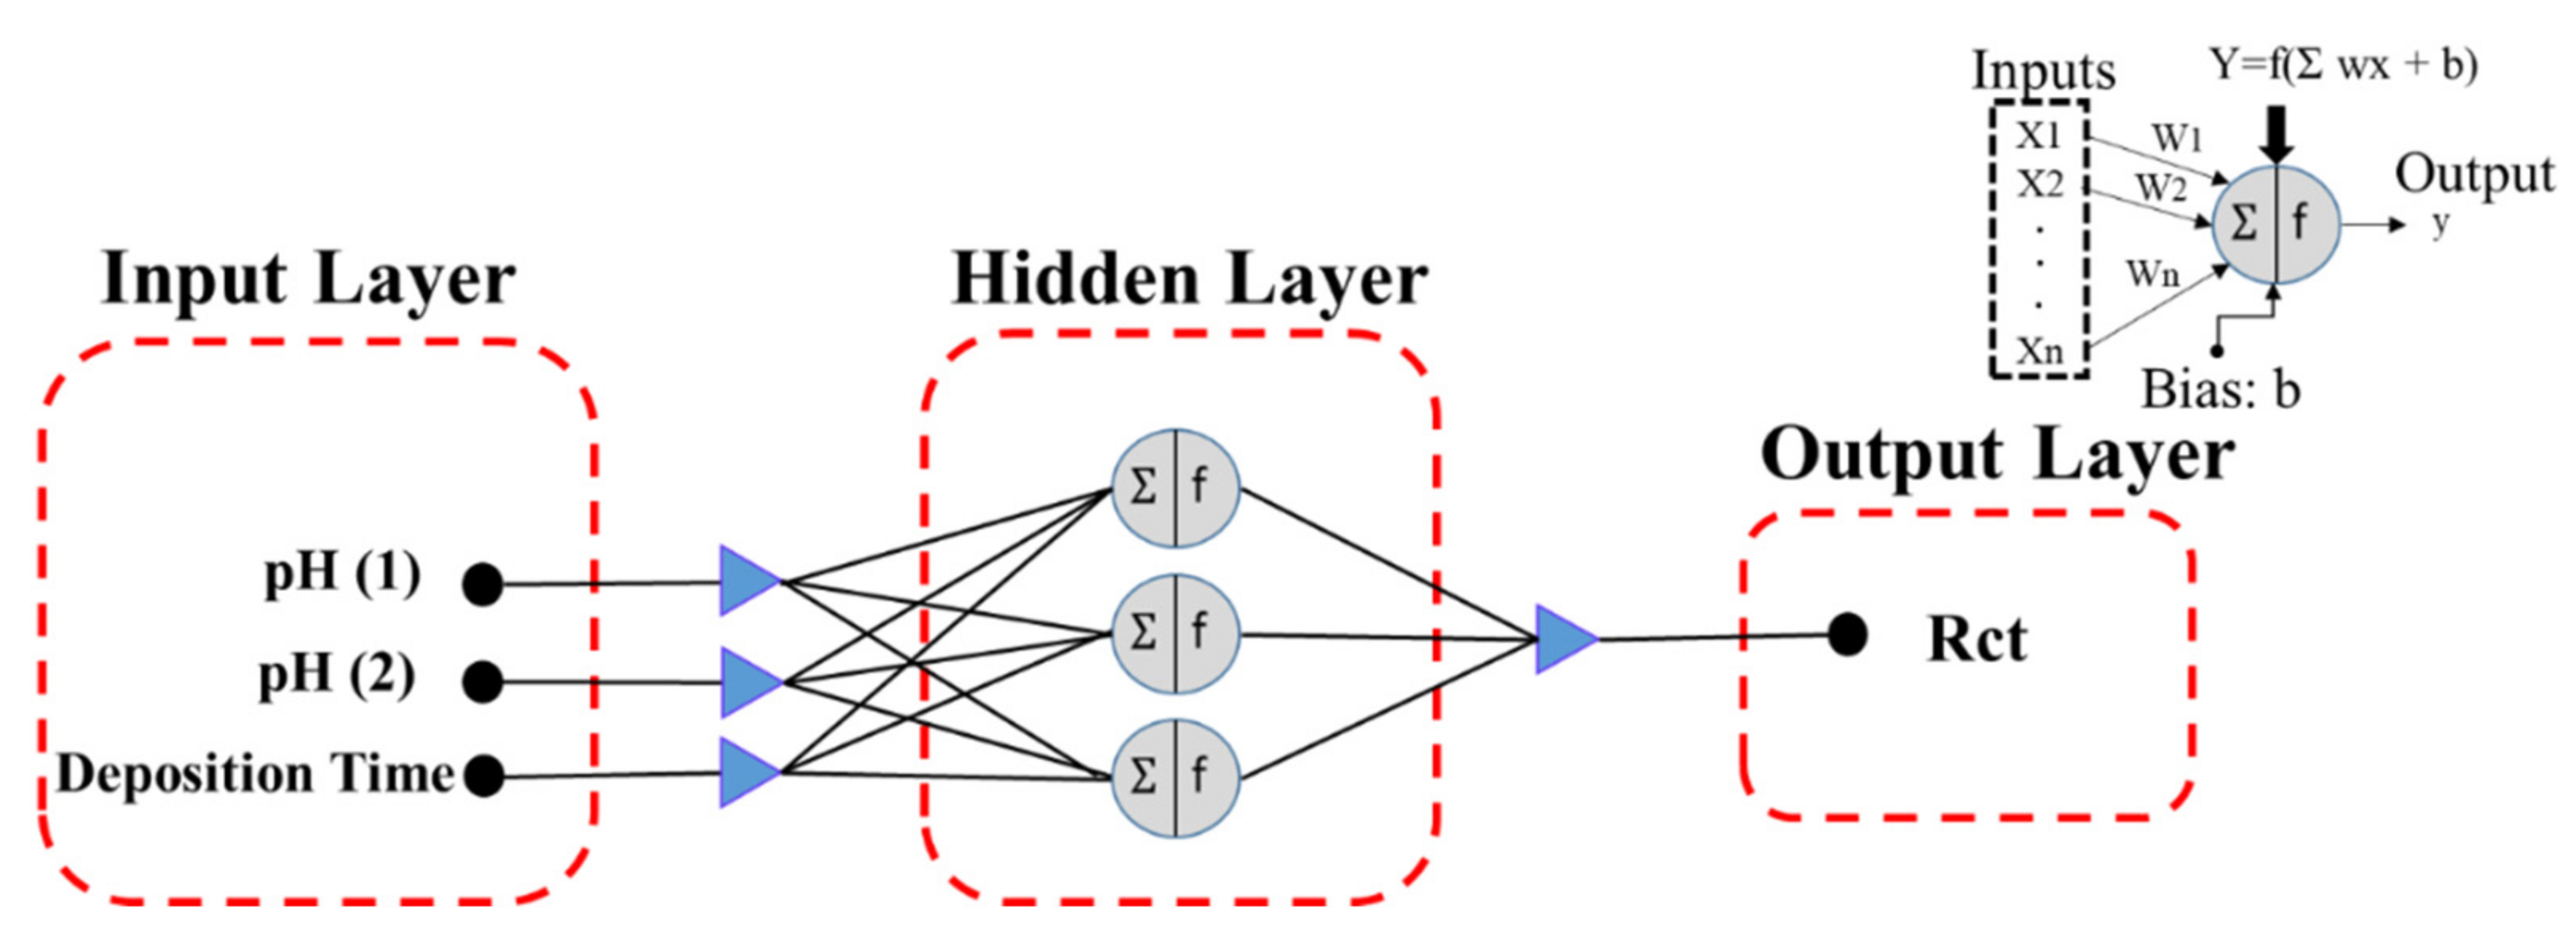
3.1. ANN Modeling
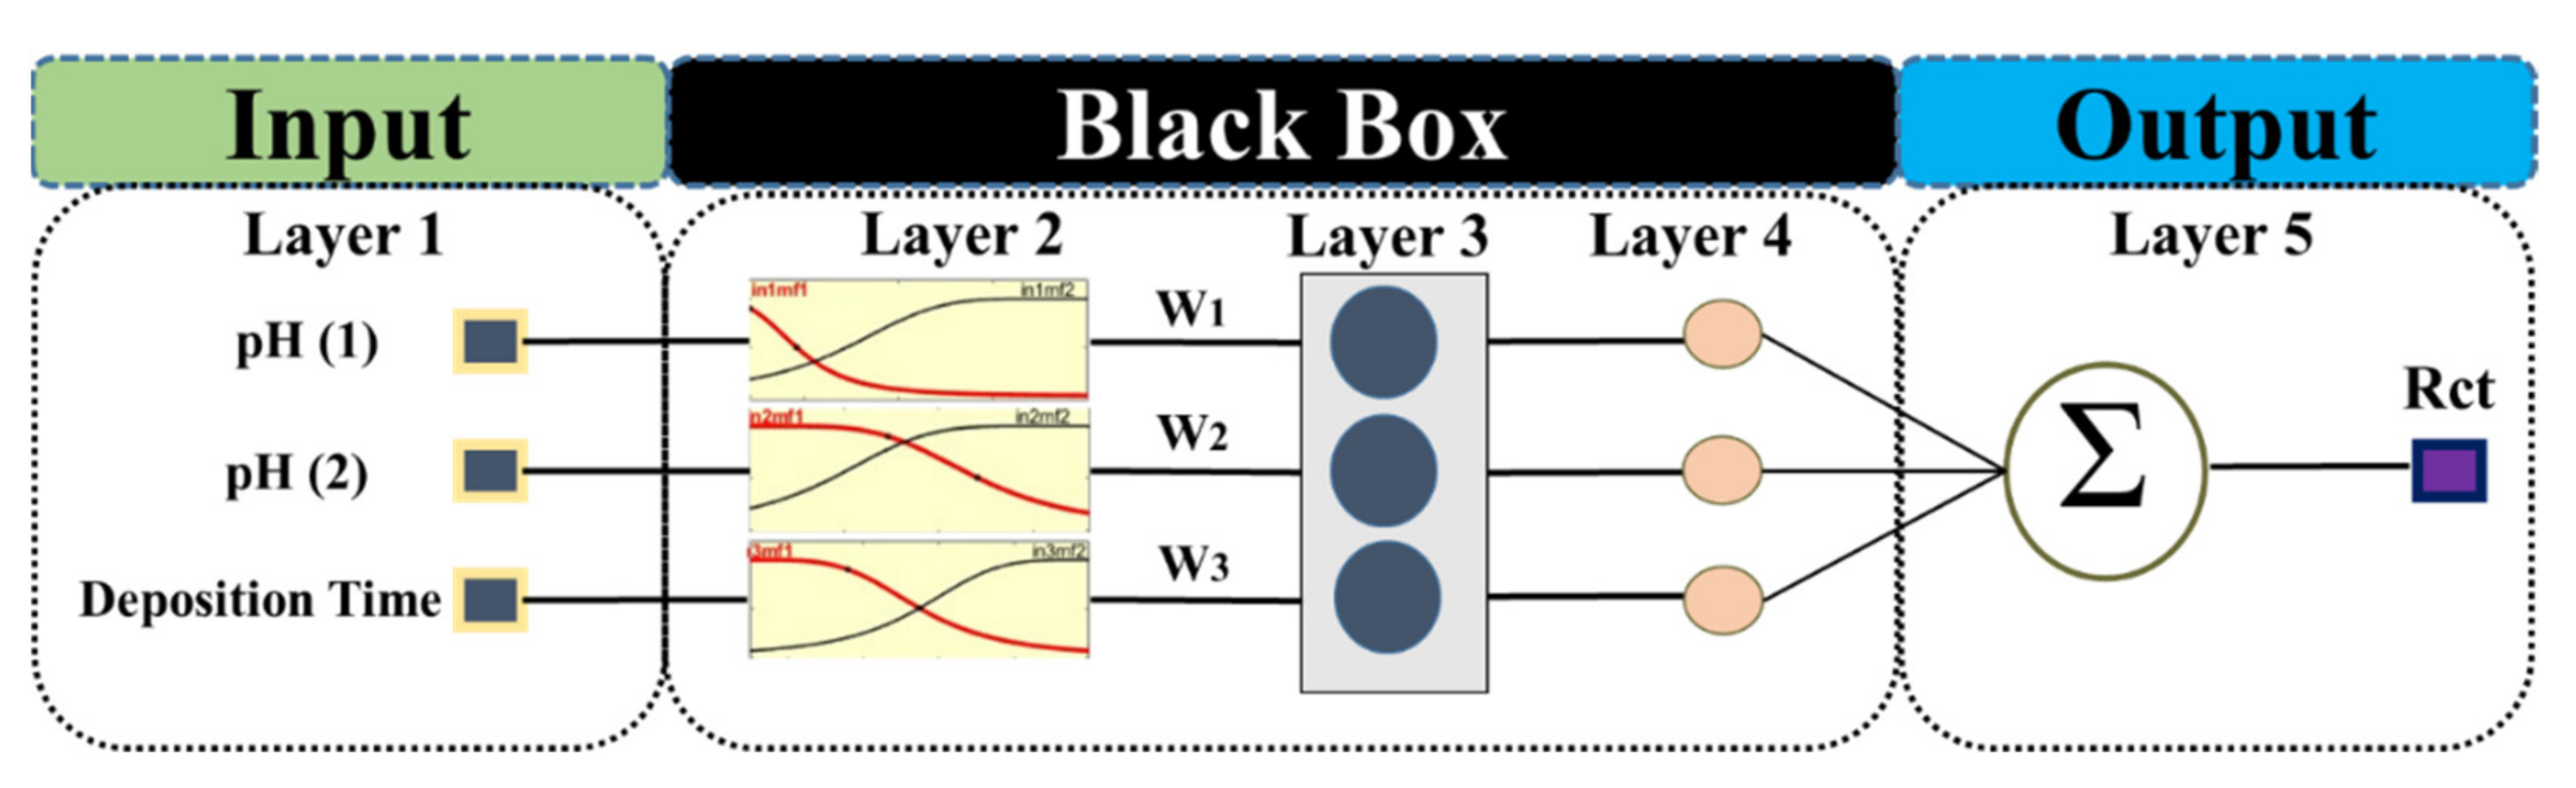
3.2. ANFIS Modeling
3.3. SVMR Technique
4. Results and Discussion
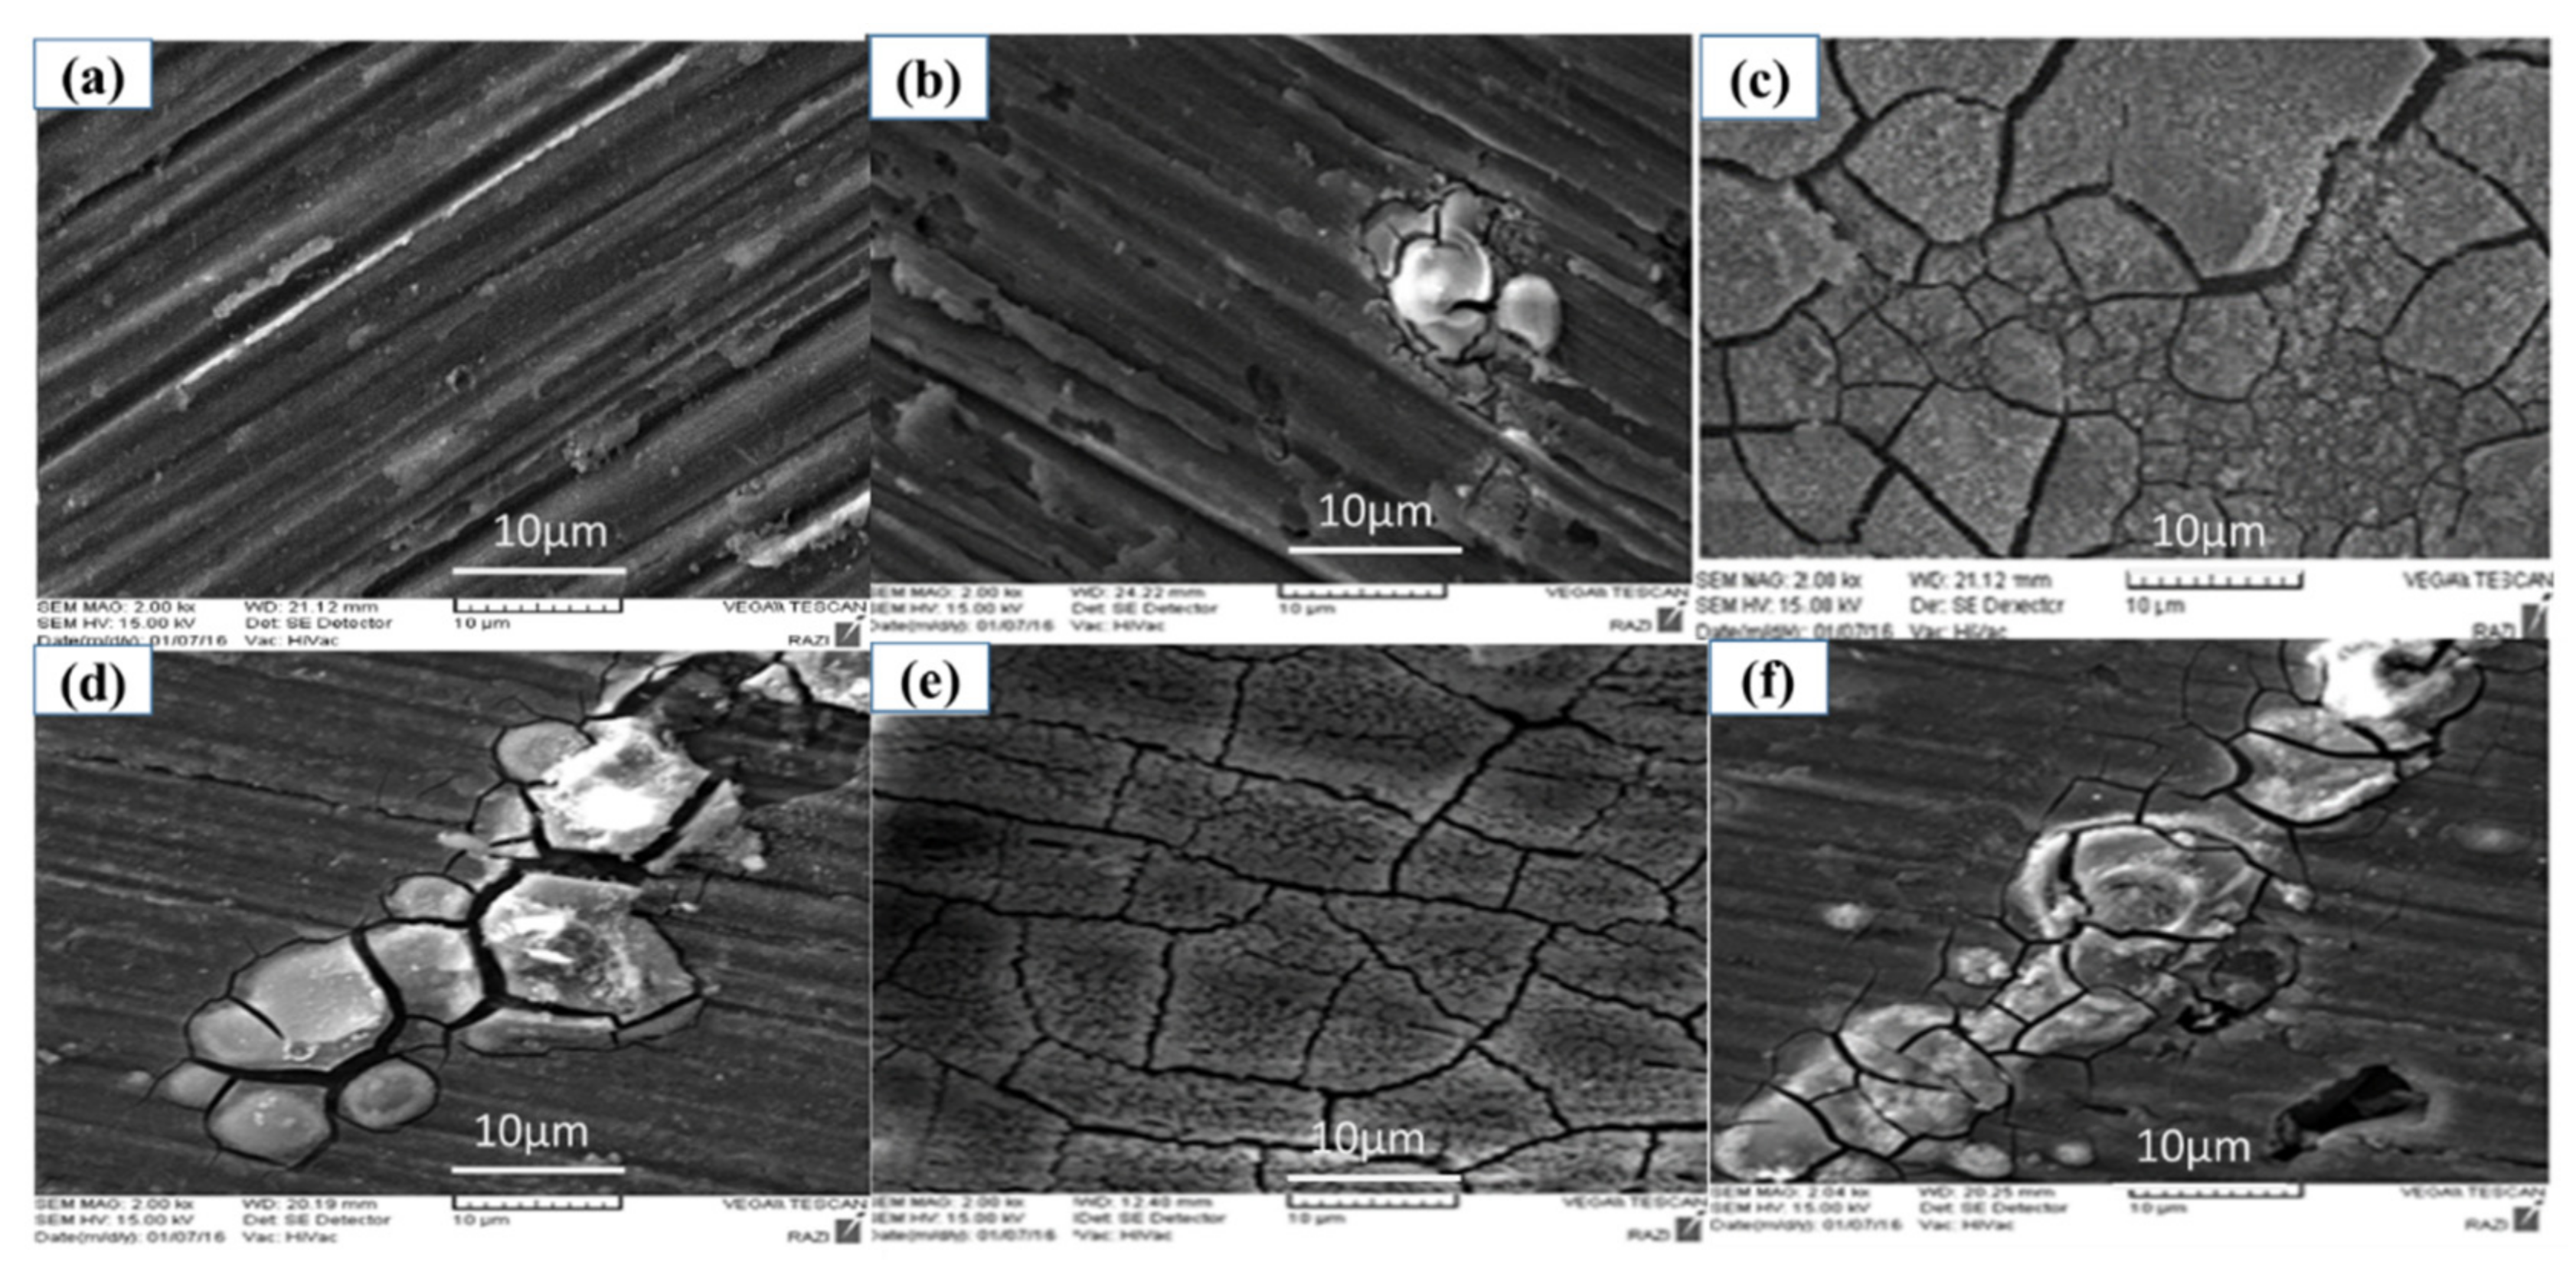
4.1. Different Pretreatments on AA5083 before Applying CeCC
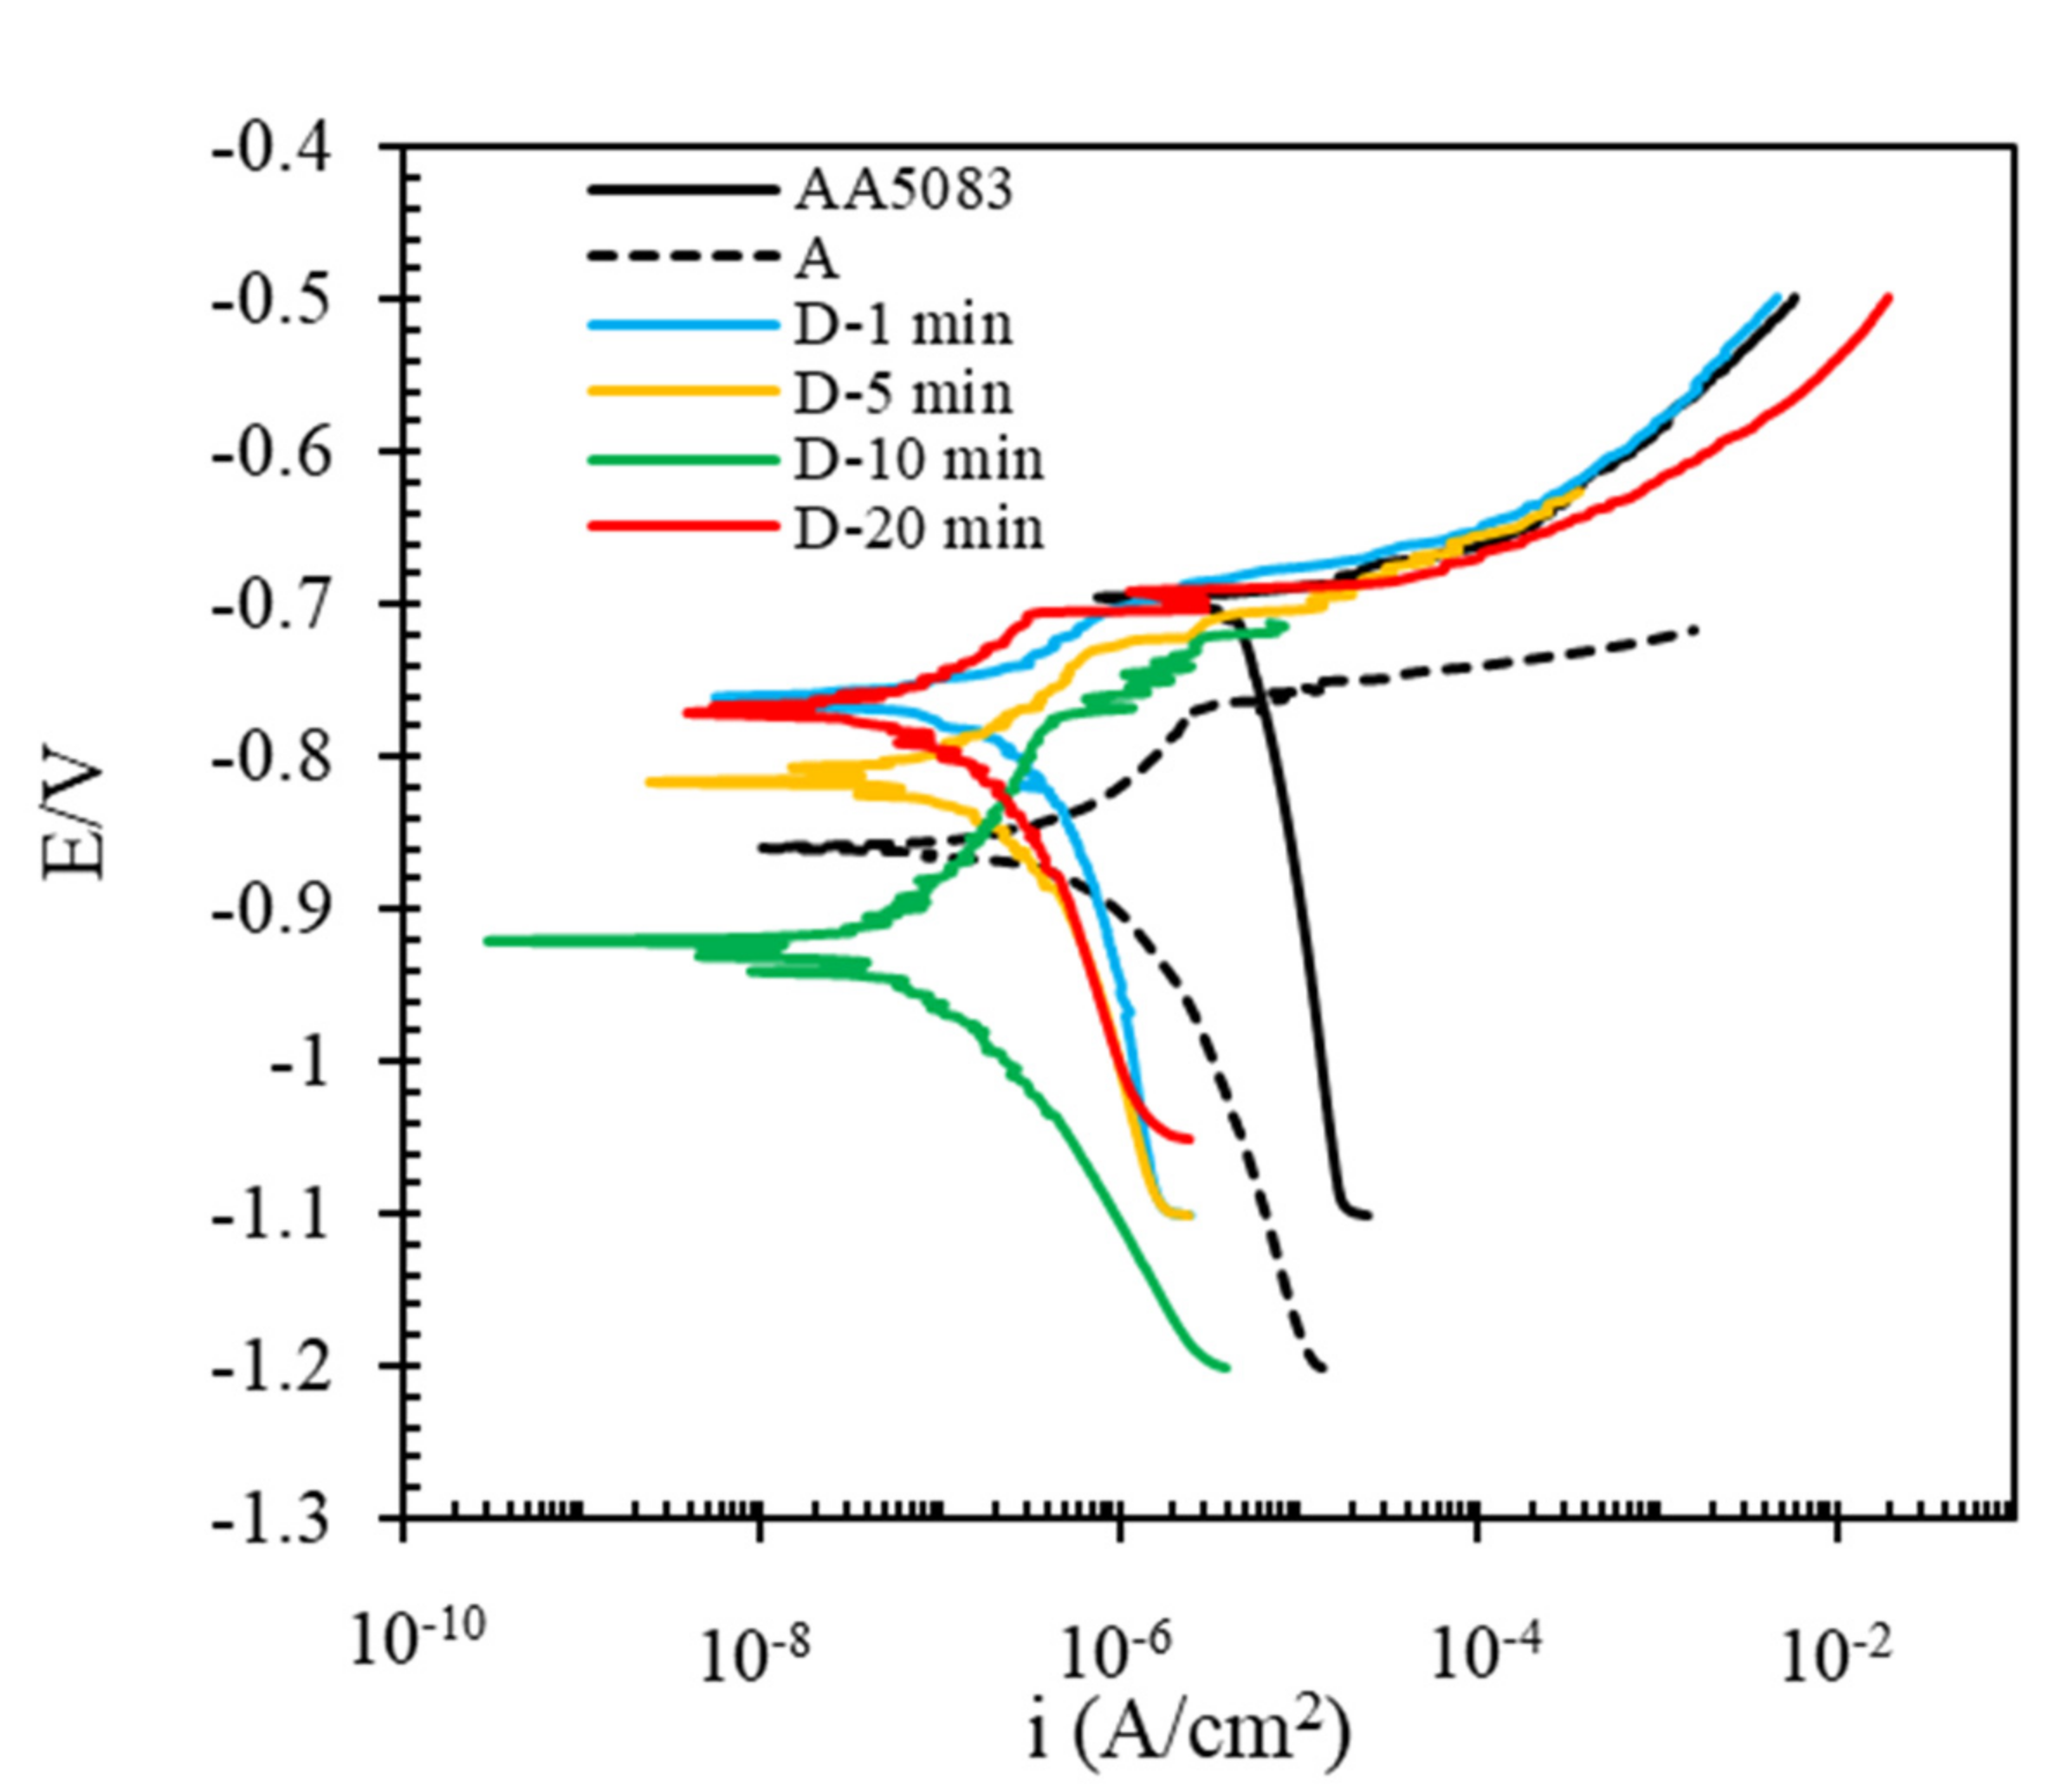
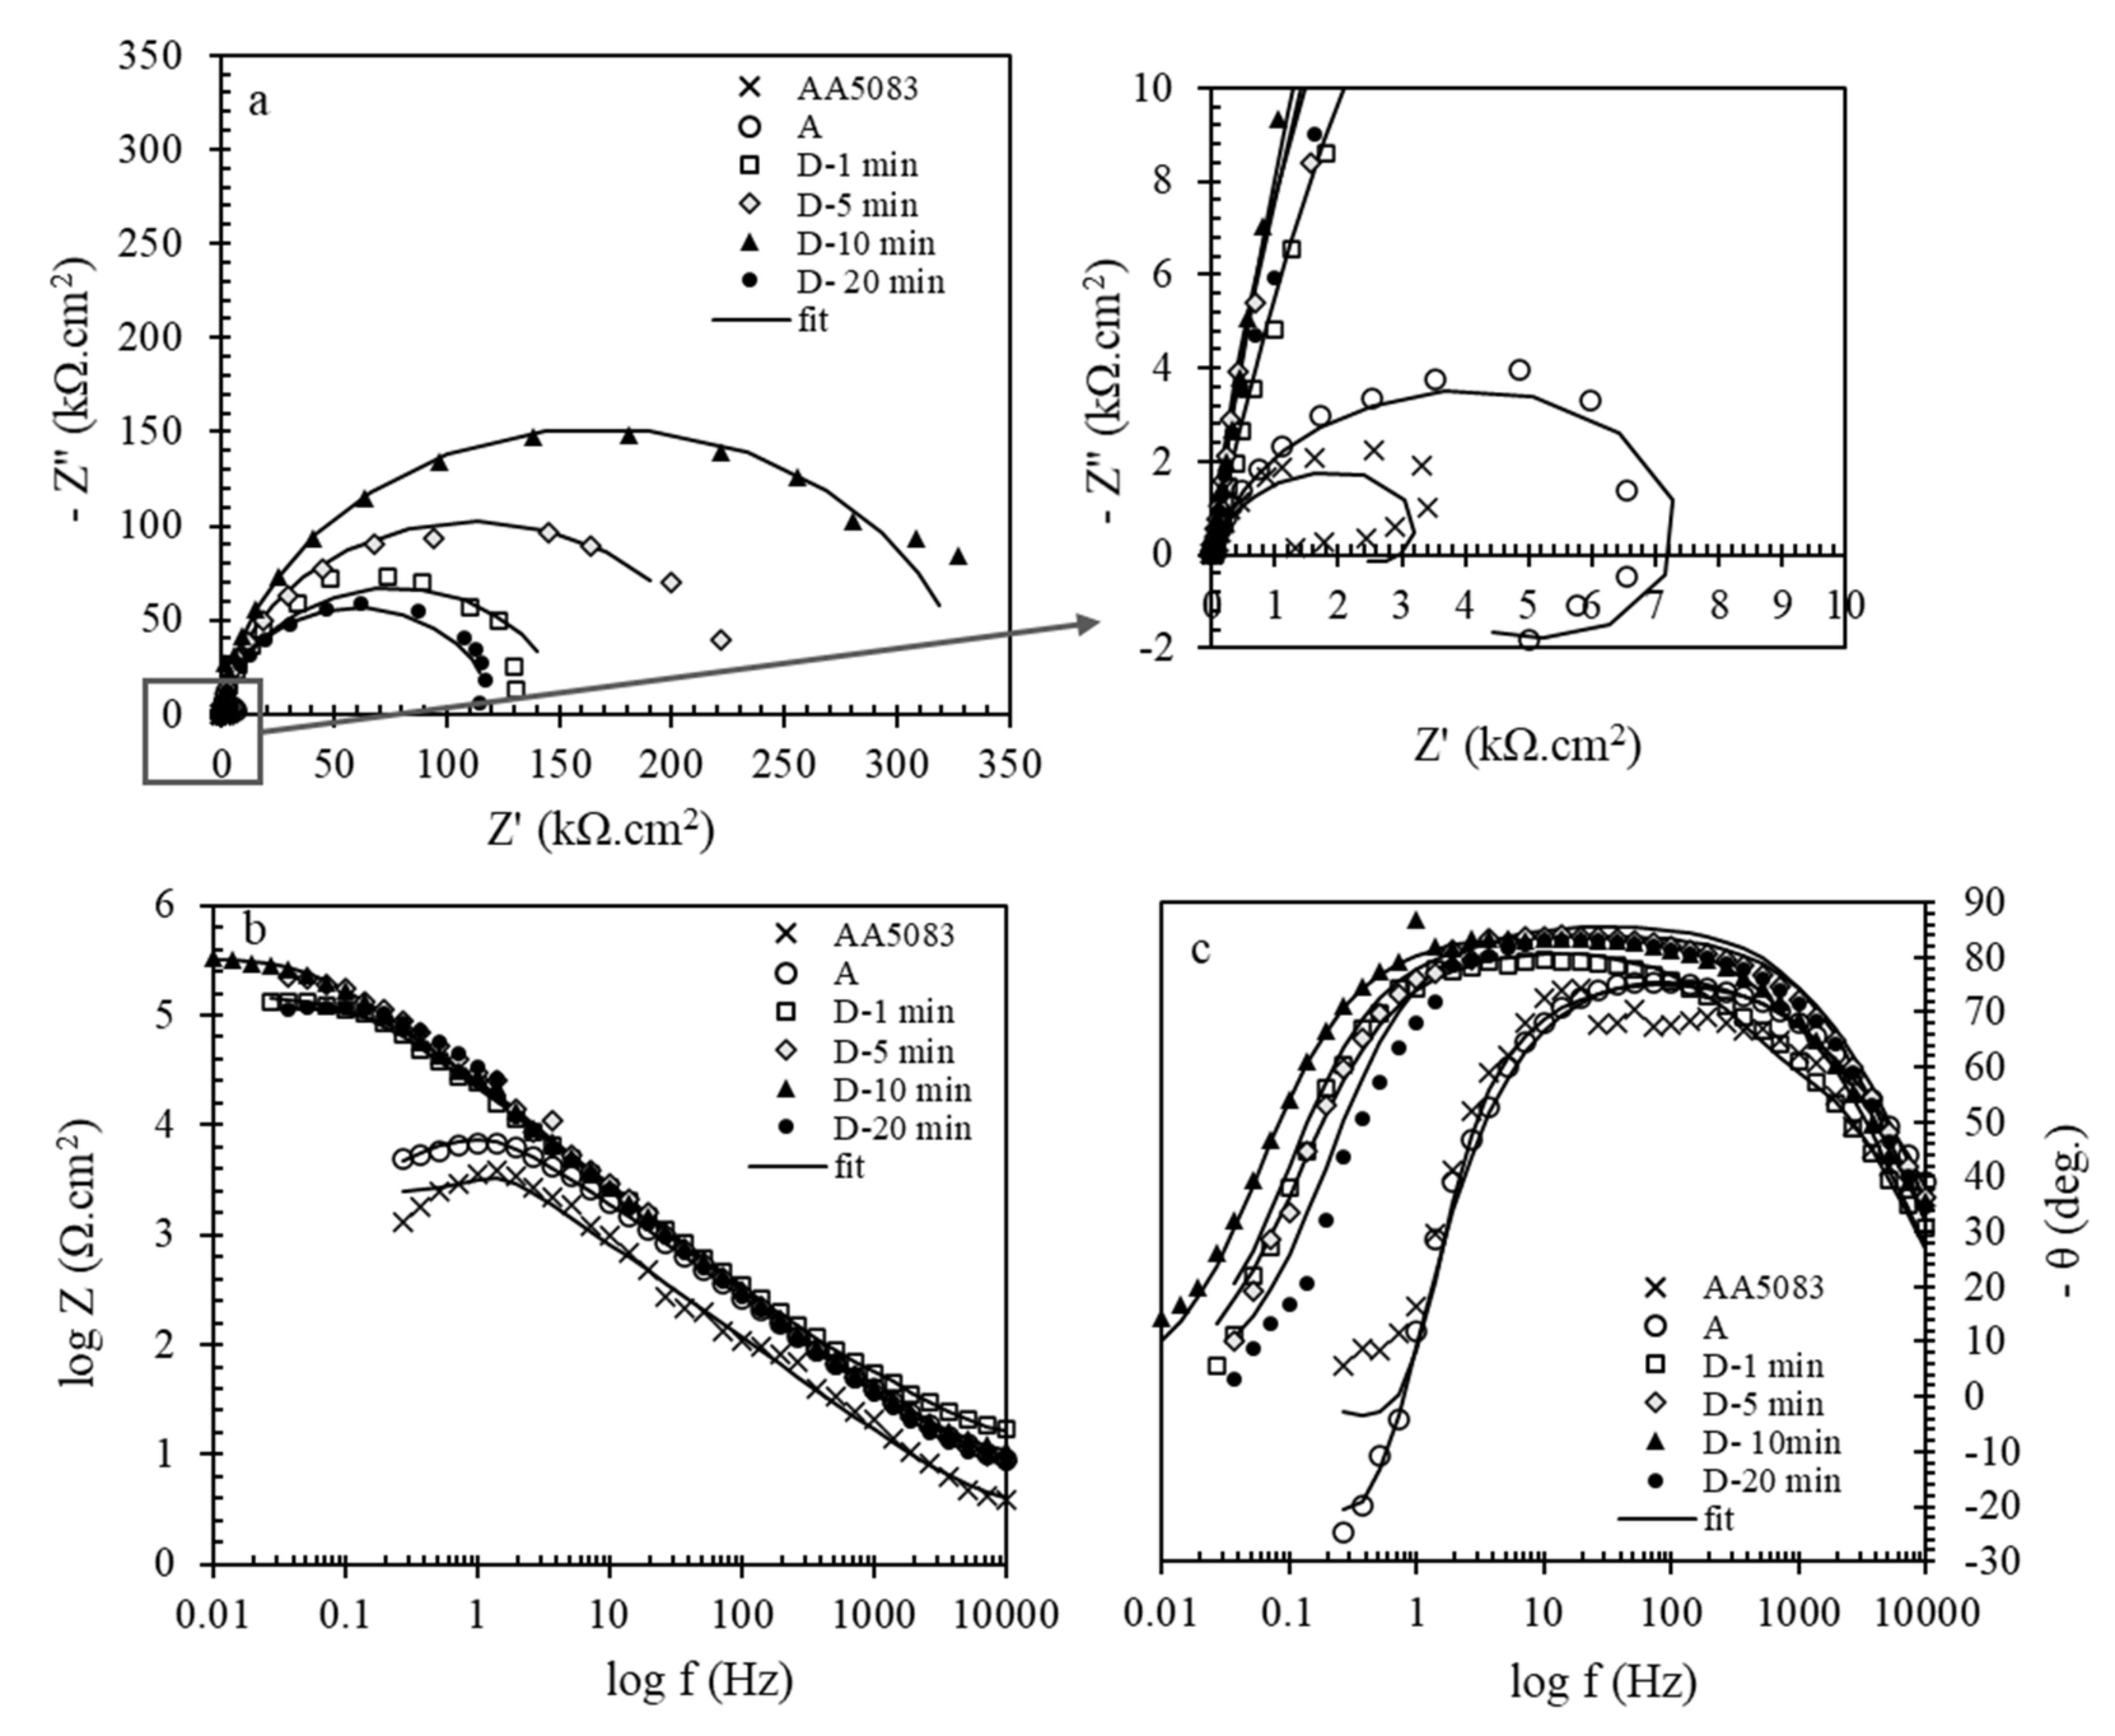
4.2. Effect of Different Deposition Times for D Pretreatment Method
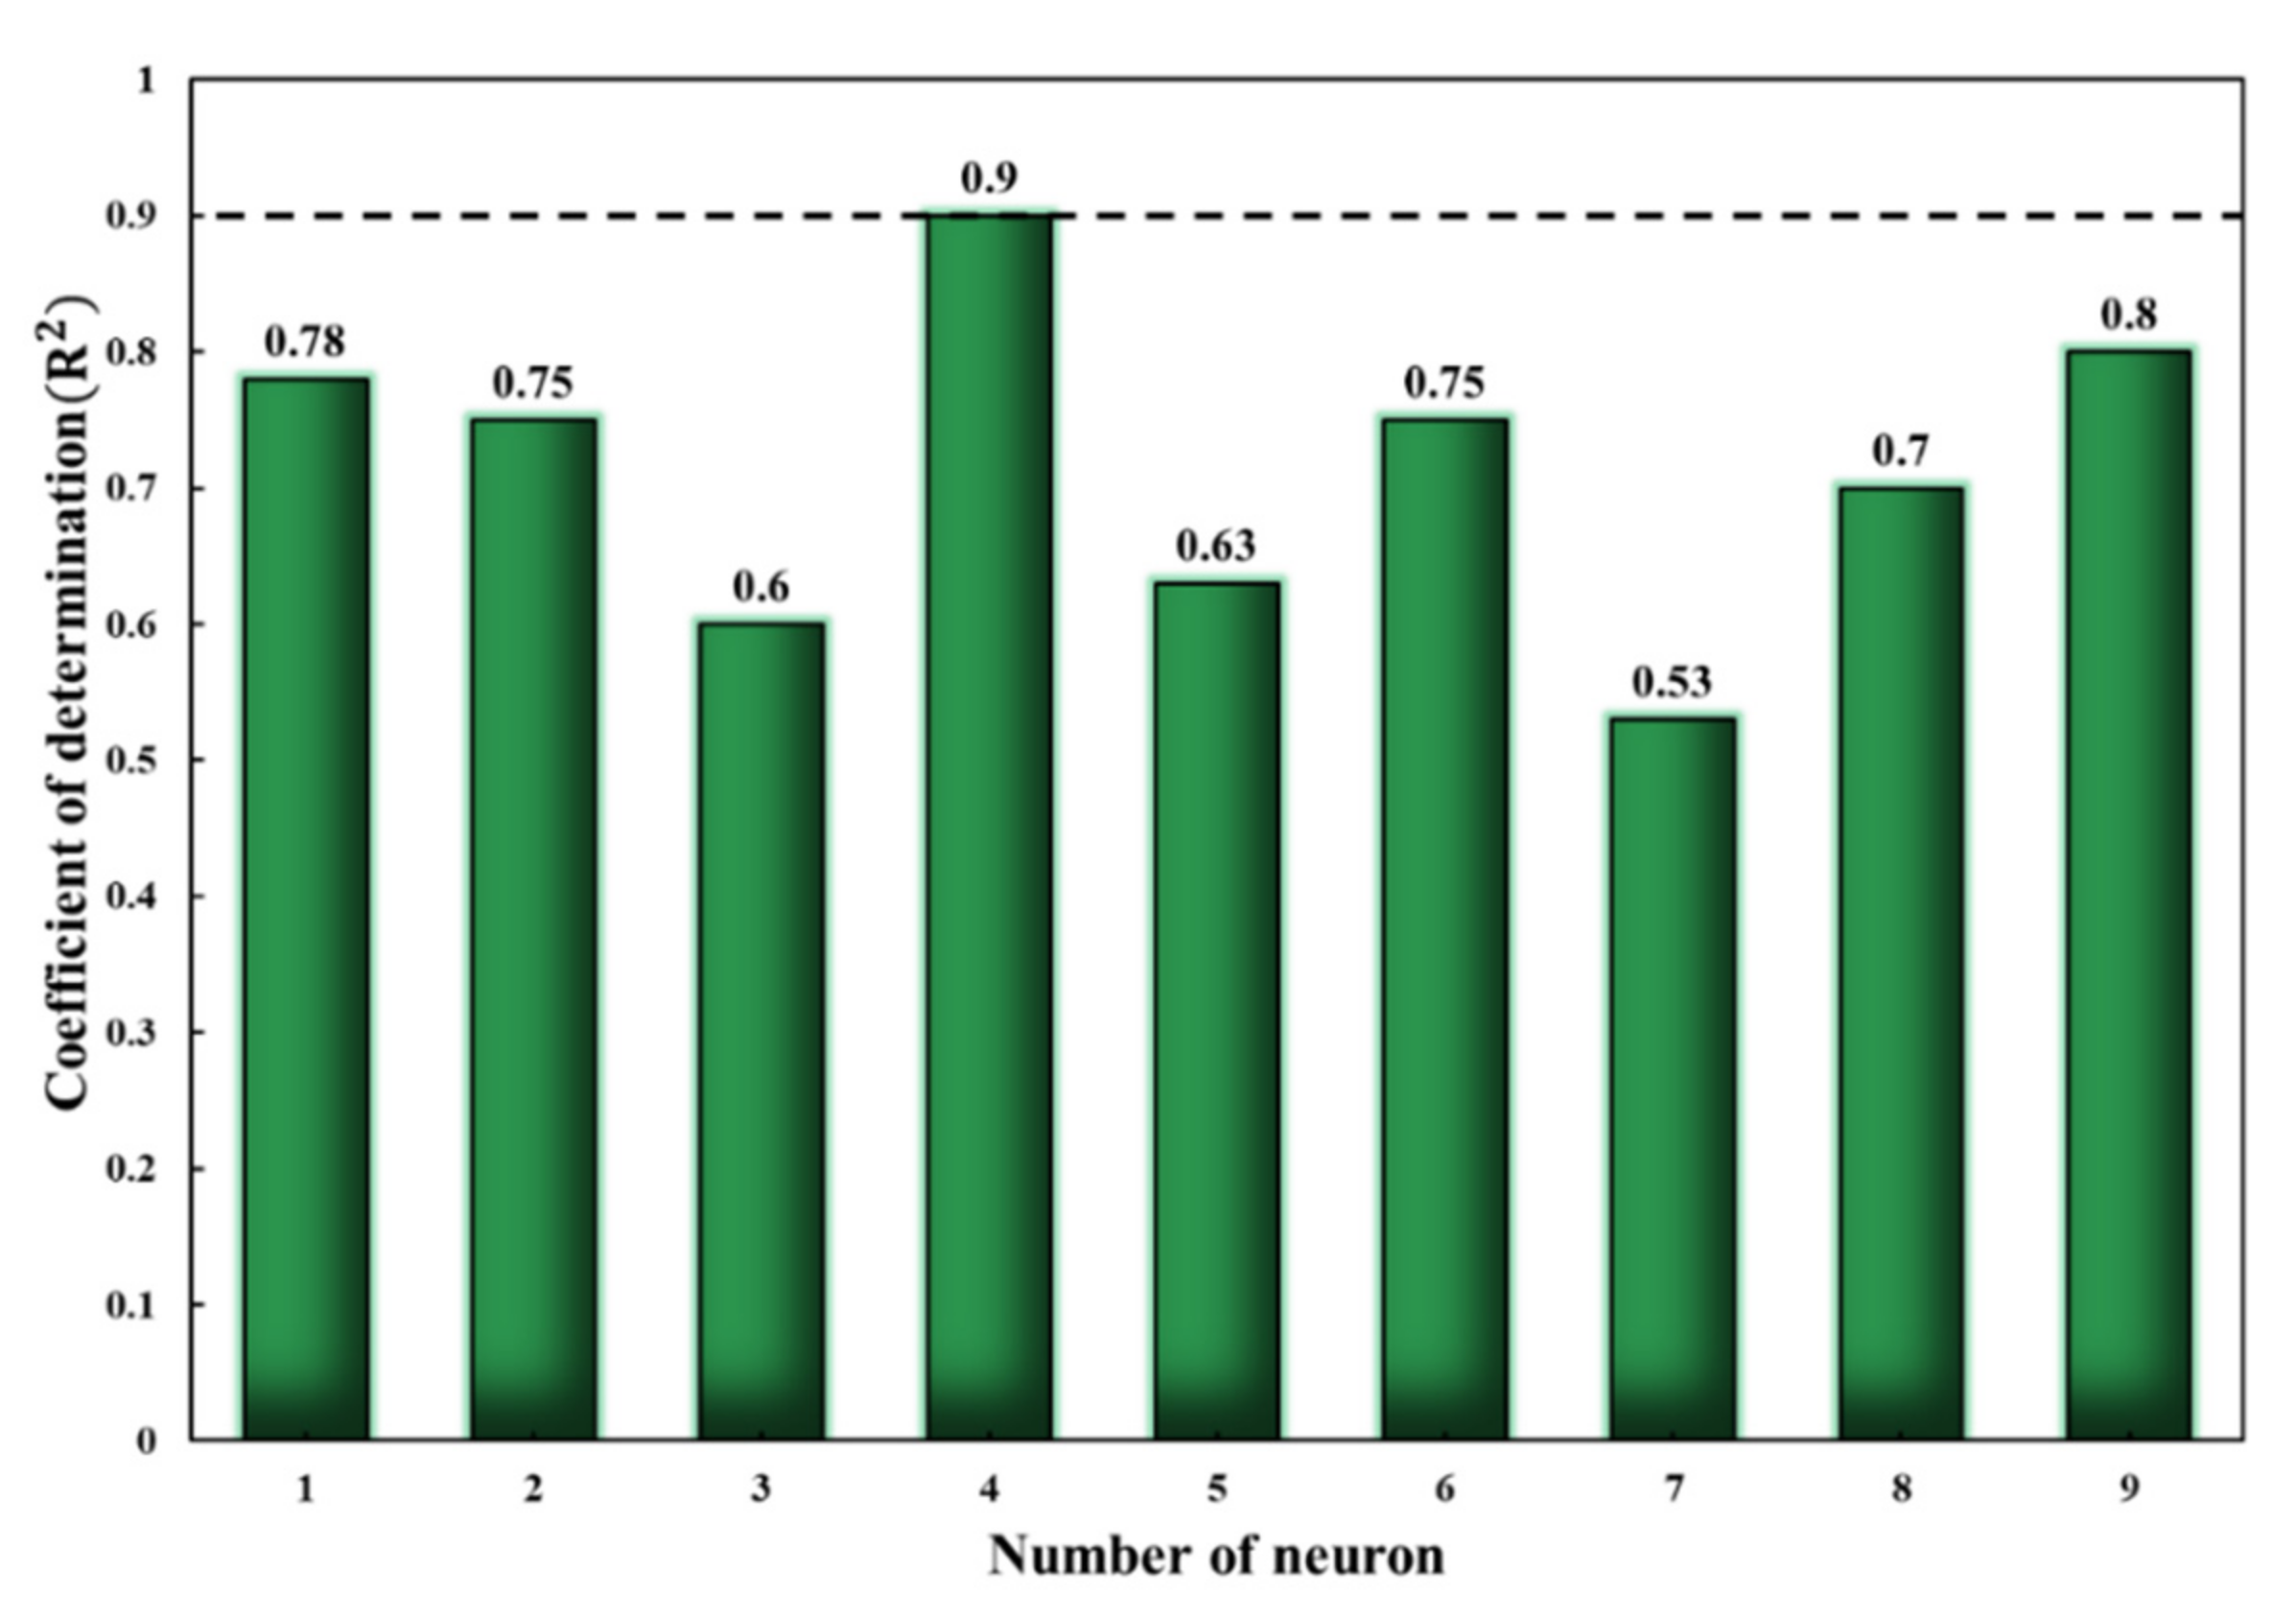
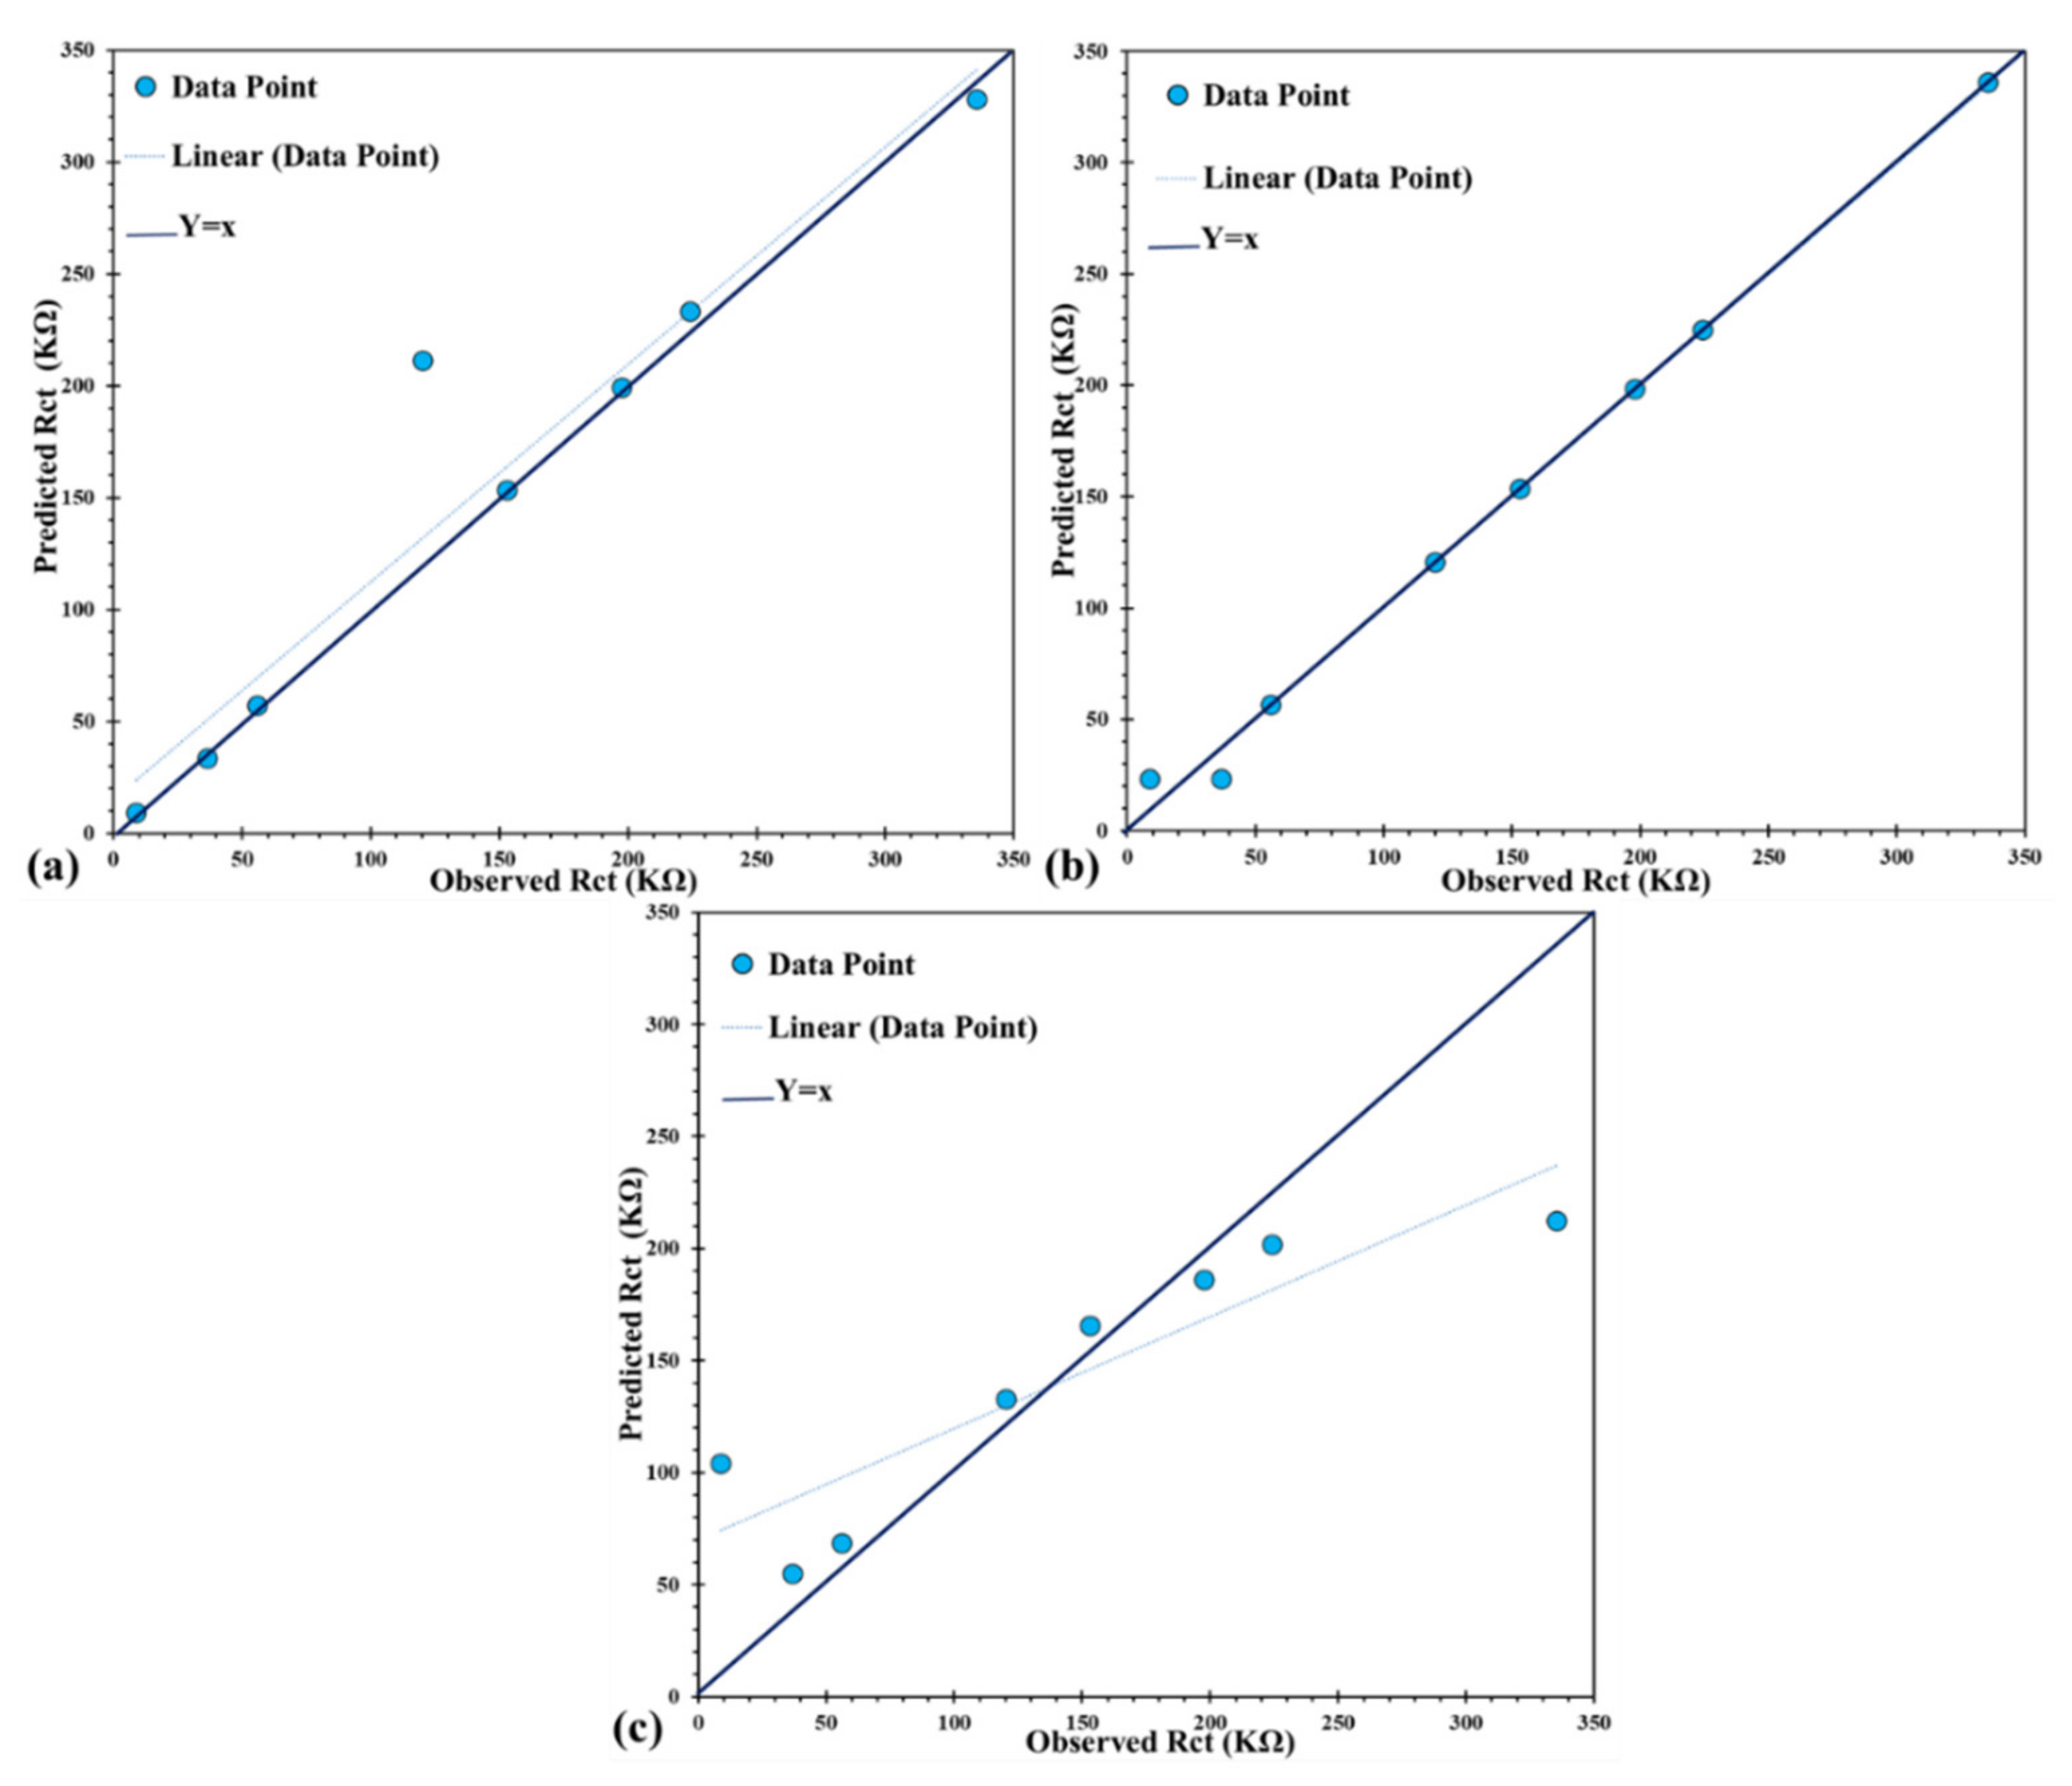
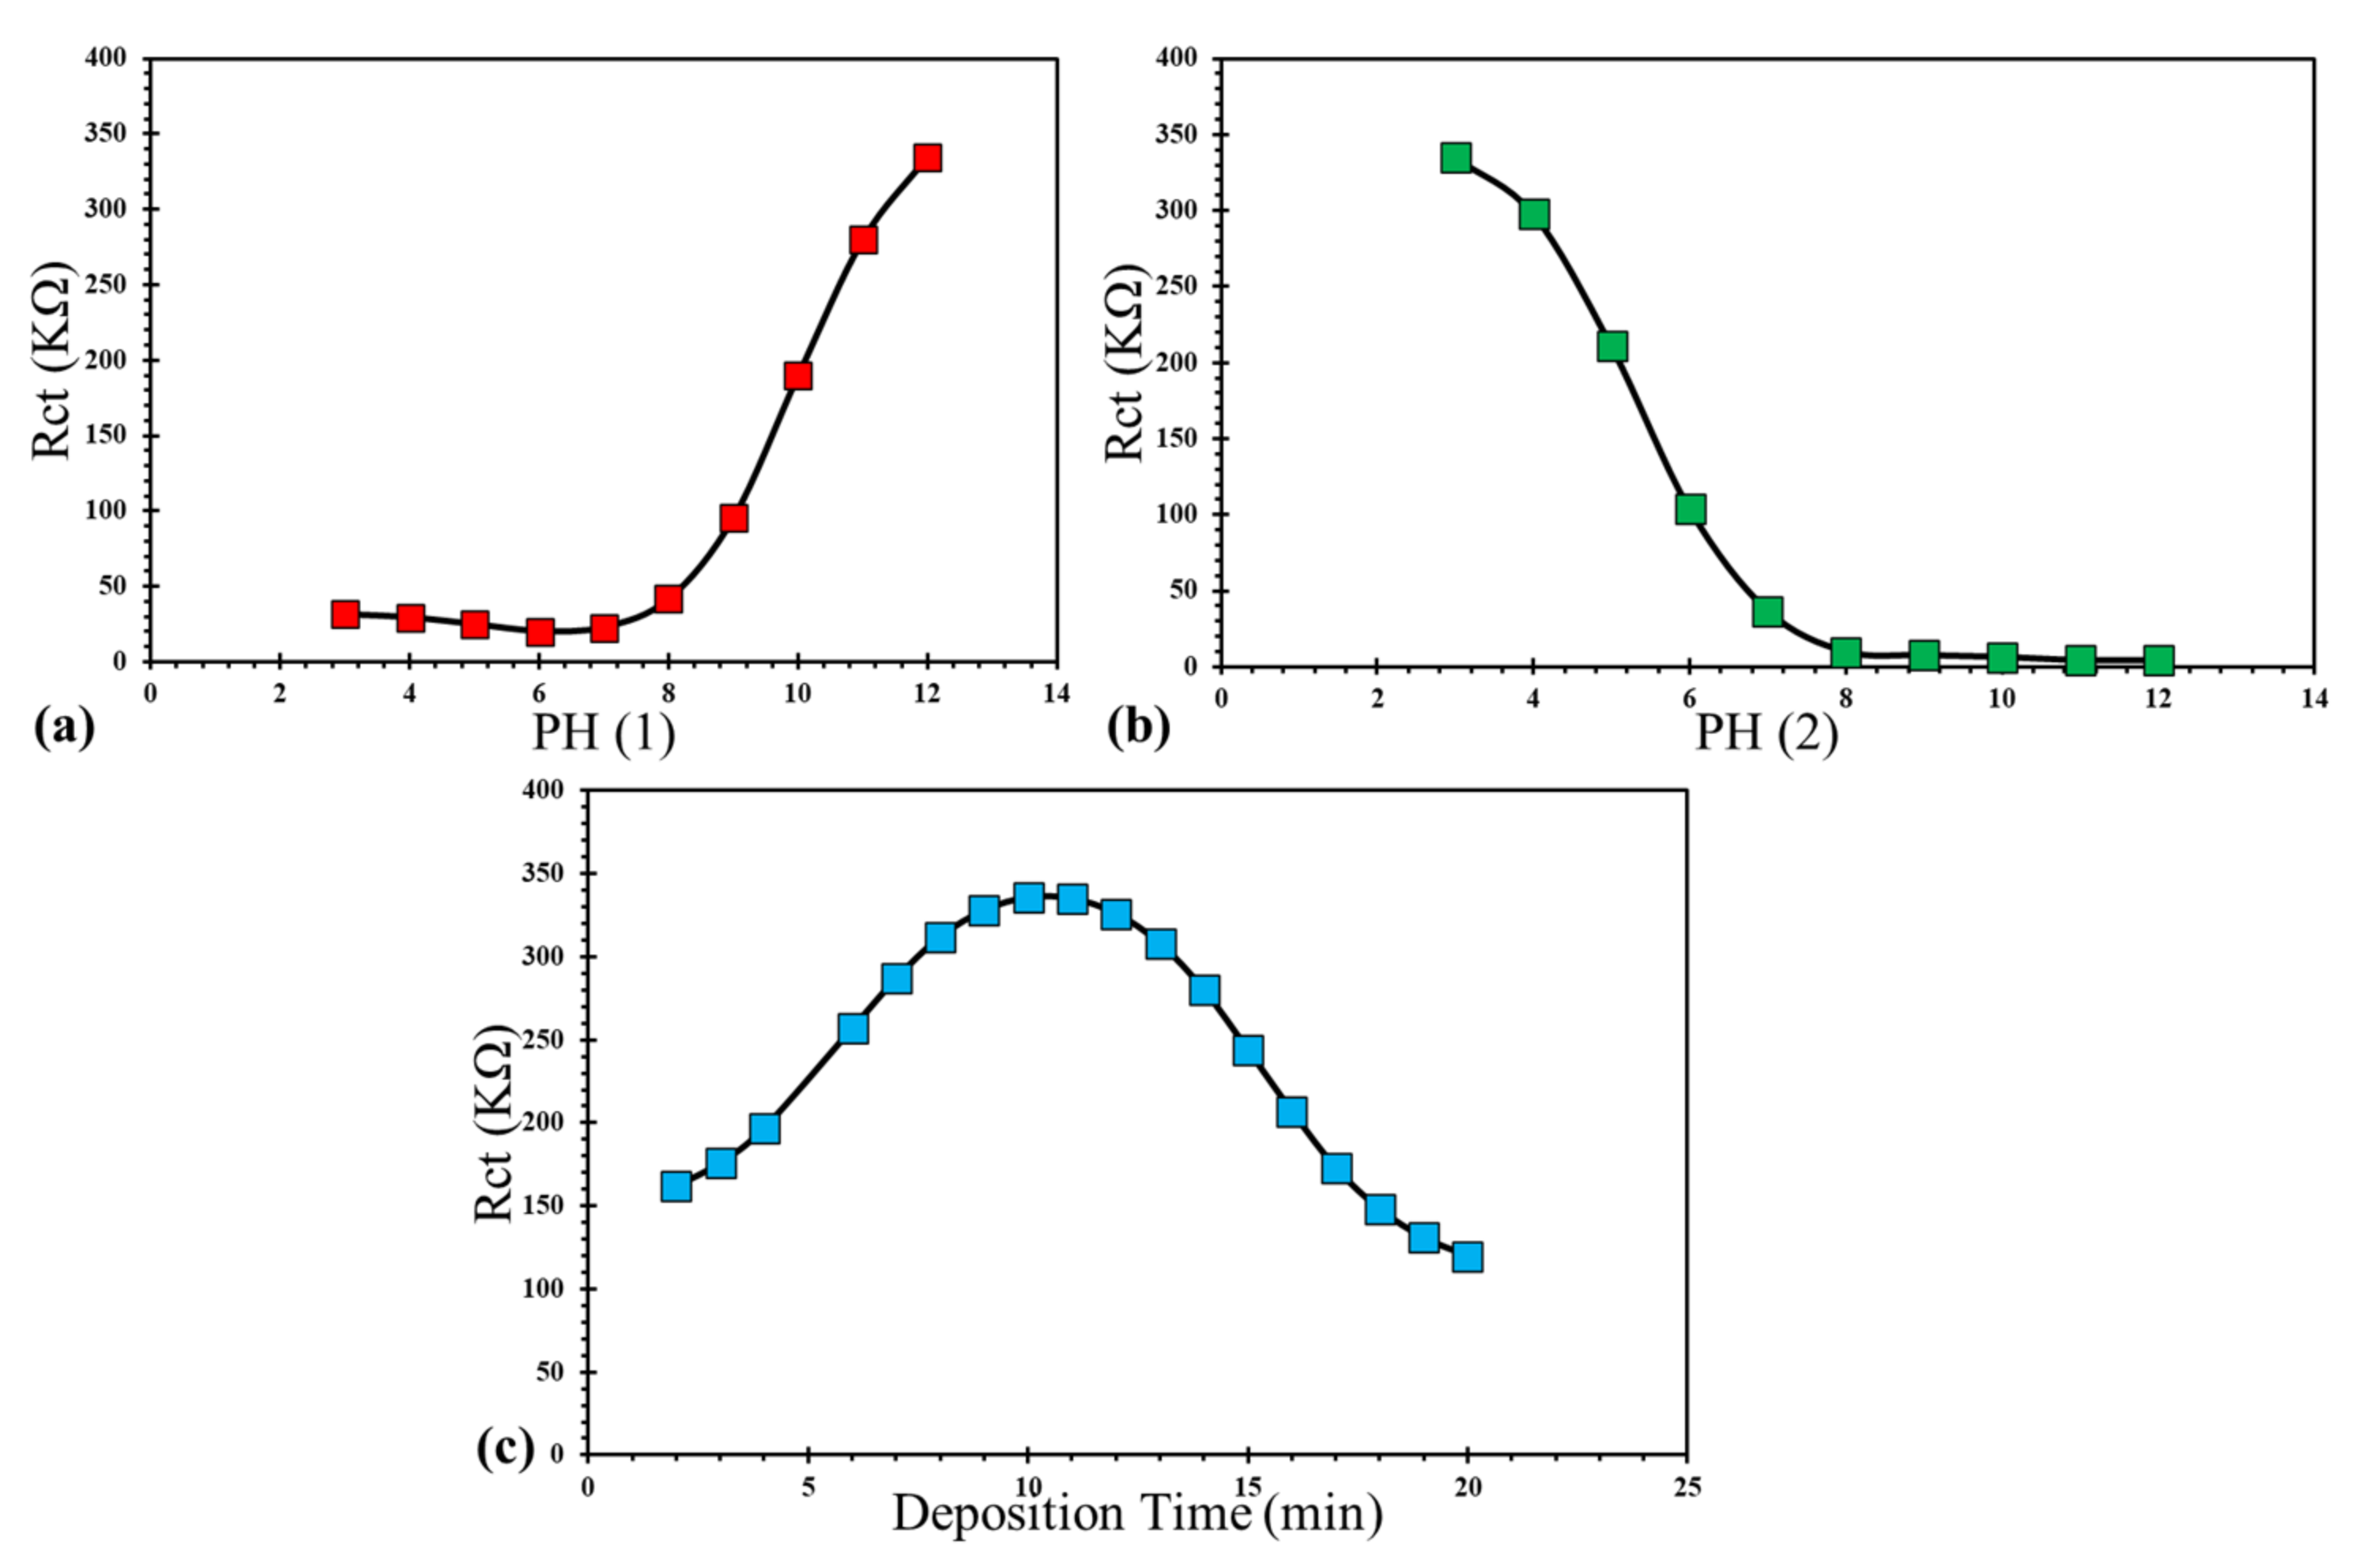
4.3. Modeling Results
5. Conclusions
Author Contributions
Funding
Institutional Review Board Statement
Informed Consent Statement
Data Availability Statement
Conflicts of Interest
Sample Availability
References
- Mehdizade, M.; Eivani, A.R.; Soltanieh, M. Effects of reduced surface grain structure and improved particle distribution on pitting corrosion of AA6063 aluminum alloy. J. Alloys Compd. 2020, 838, 155464. [Google Scholar] [CrossRef]
- Wall, F.; Martinez, M. A statistics-based approach to studying aluminum pit initiation: Intrinsic and defect-driven pit initiation phenomena. J. Electrochem. Soc. 2003, 150, B146. [Google Scholar] [CrossRef]
- Cerezo, J.; Vandendael, I.; Posner, R.; Lill, K.; De Wit, J.; Mol, J.; Terryn, H. Initiation and growth of modified Zr-based conversion coatings on multi-metal surfaces. Surf. Coat. Technol. 2013, 236, 284–289. [Google Scholar] [CrossRef]
- Nordlien, J.; Walmsley, J.; Østerberg, H.; Nisancioglu, K. Formation of a zirconium-titanium based conversion layer on AA 6060 aluminium. Surf. Coat. Technol. 2002, 153, 72–78. [Google Scholar] [CrossRef]
- Chong, K.Z.; Shih, T.S. Conversion-coating treatment for magnesium alloys by a permanganate–phosphate solution. Mater. Chem. Phys. 2003, 80, 191–200. [Google Scholar] [CrossRef]
- Silva, J.; Codaro, E.; Nakazato, R.; Hein, L. Influence of chromate, molybdate and tungstate on pit formation in chloride medium. Appl. Surf. Sci. 2005, 252, 1117–1122. [Google Scholar] [CrossRef]
- Yu, S.-X.; Zhang, R.-J.; Tang, Y.-F.; Ma, Y.-L.; Du, W.-C. Composition and performance of nanostructured zirconium titanium conversion coating on aluminum-magnesium alloys. J. Nanomater. 2013, 2013, 594273. [Google Scholar] [CrossRef]
- Yoon, H.-I.; Yeo, I.-S.; Han, J.-S. Effect of various surface treatments on the interfacial adhesion between zirconia cores and porcelain veneers. Int. J. Adhes. Adhes. 2016, 69, 79–85. [Google Scholar] [CrossRef]
- Dan, Z.; Jie, S.; ZHANG, L.; Yong, T.; Ji, L. Corrosion behavior of rare earth cerium based conversion coating on aluminum alloy. J. Rare Earths 2010, 28, 371–374. [Google Scholar]
- Brunelli, K.; Dabala, M.; Calliari, I.; Magrini, M. Effect of HCl pre-treatment on corrosion resistance of cerium-based conversion coatings on magnesium and magnesium alloys. Corros. Sci. 2005, 47, 989–1000. [Google Scholar] [CrossRef]
- Shi, H.; Han, E.-H.; Liu, F. Corrosion protection of aluminium alloy 2024-T3 in 0.05 M NaCl by cerium cinnamate. Corros. Sci. 2011, 53, 2374–2384. [Google Scholar] [CrossRef]
- Iqbal, M.A.; Asghar, H.; Fedel, M. Double doped cerium-based superhydrophobic layered double hydroxide protective films grown on anodic aluminium surface. J. Alloys Compd. 2020, 844, 156112. [Google Scholar] [CrossRef]
- Hassannejad, H.; Moghaddasi, M.; Saebnoori, E.; Baboukani, A.R. Microstructure, deposition mechanism and corrosion behavior of nanostructured cerium oxide conversion coating modified with chitosan on AA2024 aluminum alloy. J. Alloys Compd. 2017, 725, 968–975. [Google Scholar] [CrossRef]
- Xu, S.-A.; Wang, S.-N.; Gu, Y.-Y. Microstructure and adhesion properties of cerium conversion coating modified with silane coupling agent on the aluminum foil for lithium ion battery. Results Phys. 2019, 13, 102262. [Google Scholar] [CrossRef]
- Guixiang, W.; Gang, G.; Xinchen, H.; Lixia, Y.; Fuqiu, M. Effect of Benzotriazole on Corrosion Resistance of Al2O3/Cerium Oxide Composite Films on the Al Surface. Rare Met. Mater. Eng. 2018, 47, 3597–3603. [Google Scholar] [CrossRef]
- Johnson, B.Y.; Edington, J.; O’Keefe, M.J. Effect of coating parameters on the microstructure of cerium oxide conversion coatings. Mater. Sci. Eng. A 2003, 361, 225–231. [Google Scholar] [CrossRef]
- Johnson, B.Y.; Edington, J.; Williams, A.; O’Keefe, M. Microstructural characteristics of cerium oxide conversion coatings obtained by various aqueous deposition methods. Mater. Charact. 2005, 54, 41–48. [Google Scholar] [CrossRef]
- Campestrini, P.; Terryn, H.; Hovestad, A.; De Wit, J. Formation of a cerium-based conversion coating on AA2024: Relationship with the microstructure. Surf. Coat. Technol. 2004, 176, 365–381. [Google Scholar] [CrossRef]
- Jones, P.S.; Padwal, A.; Yu, P.; O’Keefe, M.; O’Keefe, T.J.; Fahrenholtz, W. Characterization of alkaline cleaned and cerium oxide coated Al 2024-T3. In Proceedings of the Materials Science & Technology Conference, Salt Lake City, UT, USA, 23–27 October 2006. [Google Scholar]
- Geng, S.; Pinc, W.; Yu, P.; Jones, P.; O’Keefe, M.; Fahrenholtz, W.; O’Keefe, T. Influence of cleaning on the deposition rate of cerium based conversion coatings on Al alloy 2024-T3. J. Appl. Surf. Finish. 2007, 2, 276–282. [Google Scholar]
- Valdez, B.; Kiyota, S.; Stoytcheva, M.; Zlatev, R.; Bastidas, J. Cerium-based conversion coatings to improve the corrosion resistance of aluminium alloy 6061-T6. Corros. Sci. 2014, 87, 141–149. [Google Scholar] [CrossRef] [Green Version]
- Maddela, S.; O’Keefe, M.; Wang, Y.-M.; Kuo, H.-H. Influence of surface pretreatment on coating morphology and corrosion performance of cerium-based conversion coatings on AZ91D alloy. Corrosion 2010, 66, 115006–115008. [Google Scholar] [CrossRef]
- De Frutos, A.; Arenas, M.; Liu, Y.; Skeldon, P.; Thompson, G.; De Damborenea, J.; Conde, A. Influence of pre-treatments in cerium conversion treatment of AA2024-T3 and 7075-T6 alloys. Surf. Coat. Technol. 2008, 202, 3797–3807. [Google Scholar] [CrossRef] [Green Version]
- Esteves, L.; Witharamage, C.; Christudasjustus, J.; Walunj, G.; O’Brien, S.; Ryu, S.; Borkar, T.; Akans, R.; Gupta, R. Corrosion behavior of AA5083 produced by high-energy ball milling. J. Alloy Compd. 2021, 857, 158268. [Google Scholar] [CrossRef]
- Baldwin, K.; Bates, R.; Arnell, R.; Smith, C. Aluminium-magnesium alloys as corrosion resistant coatings for steel. Corros. Sci. 1996, 38, 155–170. [Google Scholar] [CrossRef]
- Yasakau, K.A.; Zheludkevich, M.L.; Lamaka, S.V.; Ferreira, M.G. Role of intermetallic phases in localized corrosion of AA5083. Electrochim. Acta 2007, 52, 7651–7659. [Google Scholar] [CrossRef]
- Memarbashi, S.; Saebnoori, E.; Shahrabi, T. A Study on the Passivation Behavior and Semiconducting Properties of Gamma Titanium Aluminide in 0.1 NH2 SO4, HNO3, and HClO4 Acidic Solutions. J. Mater. Eng. Perform. 2014, 23, 912–917. [Google Scholar] [CrossRef]
- Saebnoori, E.; Shahrabi, T.; Jafarian, H.; Ghaffari, M. Changes in the resistance to corrosion of thermally passivated titanium aluminide during exposure to sodium chloride solution. Res. Chem. Intermed. 2015, 41, 1079–1095. [Google Scholar] [CrossRef]
- Arenas, M.; Bethencourt, M.; Botana, F.; De Damborenea, J.; Marcos, M. Inhibition of 5083 aluminium alloy and galvanised steel by lanthanide salts. Corros. Sci. 2001, 43, 157–170. [Google Scholar] [CrossRef]
- Yasakau, K.; Zheludkevich, M.; Ferreira, M. Lanthanide salts as corrosion inhibitors for AA5083. Mechanism and efficiency of corrosion inhibition. J. Electrochem. Soc. 2008, 155, C169. [Google Scholar] [CrossRef]
- Aballe, A.; Bethencourt, M.; Botana, F.; Cano, M.; Marcos, M. Influence of the cathodic intermetallics distribution on the reproducibility of the electrochemical measurements on AA5083 alloy in NaCl solutions. Corros. Sci. 2003, 45, 161–180. [Google Scholar] [CrossRef]
- Aballe, A.; Bethencourt, M.; Botana, F.; Marcos, M.; Sánchez-Amaya, J. Influence of the degree of polishing of alloy AA 5083 on its behaviour against localised alkaline corrosion. Corros. Sci. 2004, 46, 1909–1920. [Google Scholar] [CrossRef]
- Salimi, S.; Nasr-Esfahani, M.; Umoren, S.A.; Saebnoori, E. Complexes of imidazole with Poly (ethylene glycol) as a corrosion inhibitor for carbon steel in sulphuric acid. J. Mater. Eng. Perform. 2015, 24, 4696–4709. [Google Scholar] [CrossRef]
- Hasannejad, H.; Aliofkhazraei, M.; Shanaghi, A.; Shahrabi, T.; Sabour, A. Nanostructural and electrochemical characteristics of cerium oxide thin films deposited on AA5083-H321 aluminum alloy substrates by dip immersion and sol–gel methods. Thin Solid Film 2009, 517, 4792–4799. [Google Scholar] [CrossRef]
- Dabalà, M.; Ramous, E.; Magrini, M. Corrosion resistance of cerium-based chemical conversion coatings on AA5083 aluminium alloy. Mater. Corros. 2004, 55, 381–386. [Google Scholar] [CrossRef]
- Golafshani, E.M.; Behnood, A.; Arashpour, M. Predicting the compressive strength of normal and High-Performance Concretes using ANN and ANFIS hybridized with Grey Wolf Optimizer. Constr. Build. Mater. 2020, 232, 117266. [Google Scholar] [CrossRef]
- Vakili, M.; Yahyaei, M.; Ramsay, J.; Aghajannezhad, P.; Paknezhad, B. Adaptive neuro-fuzzy inference system modeling to predict the performance of graphene nanoplatelets nanofluid-based direct absorption solar collector based on experimental study. Renew. Energy 2021, 163, 807–824. [Google Scholar] [CrossRef]
- Sampath, K.; Perera, M.; Ranjith, P.; Matthai, S.; Tao, X.; Wu, B. Application of neural networks and fuzzy systems for the intelligent prediction of CO2-induced strength alteration of coal. Measurement 2019, 135, 47–60. [Google Scholar] [CrossRef]
- Khalaj, O.; Ghobadi, M.; Zarezadeh, A.; Saebnoori, E.; Jirková, H.; Chocholaty, O.; Svoboda, J. Potential role of machine learning techniques for modeling the hardness of OPH steels. Mater. Today Commun. 2021, 26, 101806. [Google Scholar] [CrossRef]
- Nesfchi, M.M.; Pirbazari, A.E.; Saraei, F.E.K.; Rojaee, F.; Mahdavi, F.; Fa’al Rastegar, S.A. Fabrication of plasmonic nanoparticles/cobalt doped TiO2 nanosheets for degradation of tetracycline and modeling the process by artificial intelligence techniques. Mater. Sci. Semicond. Process. 2021, 122, 105465. [Google Scholar] [CrossRef]
- Hosseinzadeh, A.; Zhou, J.L.; Altaee, A.; Baziar, M.; Li, X. Modeling water flux in osmotic membrane bioreactor by adaptive network-based fuzzy inference system and artificial neural network. Bioresour. Technol. 2020, 310, 123391. [Google Scholar] [CrossRef] [PubMed]
- Jang, J.-S. ANFIS: Adaptive-network-based fuzzy inference system. IEEE Trans. Syst. Man Cybern. 1993, 23, 665–685. [Google Scholar] [CrossRef]
- Hernández-Julio, Y.F.; Prieto-Guevara, M.J.; Nieto-Bernal, W. Fuzzy clustering and dynamic tables for knowledge discovery and decision-making: Analysis of the reproductive performance of the marine copepod Cyclopina sp. Aquaculture 2020, 523, 735183. [Google Scholar] [CrossRef]
- Ghobadi, M.; Zaarei, D.; Naderi, R.; Asadi, N.; Seyedi, S.R.; Avard, M.R. Improvement the protection performance of lanolin based temporary coating using benzotriazole and cerium (III) nitrate: Combined experimental and computational analysis. Prog. Org. Coat. 2021, 151, 106085. [Google Scholar] [CrossRef]
- Bucolo, M.; Fortuna, L.; Nelke, M.; Rizzo, A.; Sciacca, T. Prediction models for the corrosion phenomena in Pulp & Paper plant. Control Eng. Pract. 2002, 10, 227–237. [Google Scholar]
- Mousavifard, S.; Attar, M.; Ghanbari, A.; Dadgar, M. Application of artificial neural network and adaptive neuro-fuzzy inference system to investigate corrosion rate of zirconium-based nano-ceramic layer on galvanized steel in 3.5% NaCl solution. J. Alloys Compd. 2015, 639, 315–324. [Google Scholar] [CrossRef]
- Balabin, R.M.; Lomakina, E.I. Support vector machine regression (SVR/LS-SVM)—An alternative to neural networks (ANN) for analytical chemistry? Comparison of nonlinear methods on near infrared (NIR) spectroscopy data. Analyst 2011, 136, 1703–1712. [Google Scholar] [CrossRef] [PubMed]
- Jajarmi, E.; Sajjadi, S.A.; Mohebbi, J. Predicting the relative density and hardness of 3YPSZ/316L composites using adaptive neuro-fuzzy inference system and support vector regression models. Measurement 2019, 145, 472–479. [Google Scholar] [CrossRef]
- Sánchez-Amaya, J.; Blanco, G.; Garcia-Garcia, F.; Bethencourt, M.; Botana, F. XPS and AES analyses of cerium conversion coatings generated on AA5083 by thermal activation. Surf. Coat. Technol. 2012, 213, 105–116. [Google Scholar] [CrossRef]
- Asadi, N.; Naderi, R.; Saremi, M.; Arman, S.; Fedel, M.; Deflorian, F. Study of corrosion protection of mild steel by eco-friendly silane sol–gel coating. J. Sol-Gel Sci. Technol. 2014, 70, 329–338. [Google Scholar] [CrossRef]
- Franco, D.S.; Duarte, F.A.; Salau, N.P.G.; Dotto, G.L. Analysis of indium (III) adsorption from leachates of LCD screens using artificial neural networks (ANN) and adaptive neuro-fuzzy inference systems (ANIFS). J. Hazard. Mater. 2020, 384, 121137. [Google Scholar] [CrossRef] [PubMed]
- Zhou, Q.; Wang, F.; Zhu, F. Estimation of compressive strength of hollow concrete masonry prisms using artificial neural networks and adaptive neuro-fuzzy inference systems. Constr. Build. Mater. 2016, 125, 417–426. [Google Scholar] [CrossRef]
- Xu, J.; Zhao, X.; Yu, Y.; Xie, T.; Yang, G.; Xue, J. Parametric sensitivity analysis and modelling of mechanical properties of normal-and high-strength recycled aggregate concrete using grey theory, multiple nonlinear regression and artificial neural networks. Constr. Build. Mater. 2019, 211, 479–491. [Google Scholar] [CrossRef]
- Reddy, N.; Krishnaiah, J.; Hong, S.-G.; Lee, J.S. Modeling medium carbon steels by using artificial neural networks. Mater. Sci. Eng. A 2009, 508, 93–105. [Google Scholar] [CrossRef]
- Gupta, T.; Patel, K.; Siddique, S.; Sharma, R.K.; Chaudhary, S. Prediction of mechanical properties of rubberised concrete exposed to elevated temperature using ANN. Measurement 2019, 147, 106870. [Google Scholar] [CrossRef]
- Sugeno, M.; Kang, G. Structure identification of fuzzy model. Fuzzy Sets Syst. 1988, 28, 15–33. [Google Scholar] [CrossRef]
- Gerek, I.H. House selling price assessment using two different adaptive neuro-fuzzy techniques. Autom. Constr. 2014, 41, 33–39. [Google Scholar] [CrossRef]
- Abadi, S.N.R.; Mehrabi, M.; Meyer, J.P. Prediction and optimization of condensation heat transfer coefficients and pressure drops of R134a inside an inclined smooth tube. Int. J. Heat Mass Transf. 2018, 124, 953–966. [Google Scholar] [CrossRef] [Green Version]
- Alrashed, A.A.; Gharibdousti, M.S.; Goodarzi, M.; de Oliveira, L.R.; Safaei, M.R.; Bandarra Filho, E.P. Effects on thermophysical properties of carbon based nanofluids: Experimental data, modelling using regression, ANFIS and ANN. Int. J. Heat Mass Transf. 2018, 125, 920–932. [Google Scholar] [CrossRef]
- Thissen, U.; Pepers, M.; Üstün, B.; Melssen, W.; Buydens, L. Comparing support vector machines to PLS for spectral regression applications. Chemom. Intell. Lab. Syst. 2004, 73, 169–179. [Google Scholar] [CrossRef]
- Chauchard, F.; Cogdill, R.; Roussel, S.; Roger, J.; Bellon-Maurel, V. Application of LS-SVM to non-linear phenomena in NIR spectroscopy: Development of a robust and portable sensor for acidity prediction in grapes. Chemom. Intell. Lab. Syst. 2004, 71, 141–150. [Google Scholar] [CrossRef] [Green Version]
- Aballe, A.; Bethencourt, M.; Botana, F.; Cano, M.; Marcos, M. On the mixed nature of cerium conversion coatings. Mater. Corros. 2002, 53, 176–184. [Google Scholar] [CrossRef]
- Palomino, L.E.; Aoki, I.V.; de Melo, H.G. Microstructural and electrochemical characterization of Ce conversion layers formed on Al alloy 2024-T3 covered with Cu-rich smut. Electrochim. Acta 2006, 51, 5943–5953. [Google Scholar] [CrossRef]
- Conde, A.; Arenas, M.; De Frutos, A.; De Damborenea, J. Effective corrosion protection of 8090 alloy by cerium conversion coatings. Electrochim. Acta 2008, 53, 7760–7768. [Google Scholar] [CrossRef]
- Deflorian, F.; Rossi, S.; Fedel, M.; Motte, C. Electrochemical investigation of high-performance silane sol–gel films containing clay nanoparticles. Prog. Org. Coat. 2010, 69, 158–166. [Google Scholar] [CrossRef]
- Aballe, A.; Bethencourt, M.; Botana, F.; Marcos, M. CeCl3 and LaCl3 binary solutions as environment-friendly corrosion inhibitors of AA5083 Al–Mg alloy in NaCl solutions. J. Alloys Compd. 2001, 323, 855–858. [Google Scholar] [CrossRef]
- Danaee, I.; Zamanizadeh, H.; Fallahi, M.; Lotfi, B. The effect of surface pre-treatments on corrosion behavior of cerium-based conversion coatings on Al 7075-T6. Mater. Corros. 2014, 65, 815–819. [Google Scholar] [CrossRef]
- Fahrenholtz, W.G.; O’Keefe, M.J.; Zhou, H.; Grant, J. Characterization of cerium-based conversion coatings for corrosion protection of aluminum alloys. Surf. Coat. Technol. 2002, 155, 208–213. [Google Scholar] [CrossRef]
- Pinc, W.; Geng, S.; O’keefe, M.; Fahrenholtz, W.; O’keefe, T. Effects of acid and alkaline based surface preparations on spray deposited cerium based conversion coatings on Al 2024-T3. Appl. Surf. Sci. 2009, 255, 4061–4065. [Google Scholar] [CrossRef]
- Smith, G.N. Probability and Statistics in Civil Engineering; Collins Professional and Technical Books; Nichols Publishing Company: New York, NY, USA, 1986; 244p. [Google Scholar]
- Gandomi, A.H.; Mohammadzadeh, D.; Pérez-Ordóñez, J.L.; Alavi, A.H. Linear genetic programming for shear strength prediction of reinforced concrete beams without stirrups. Appl. Soft Comput. 2014, 19, 112–120. [Google Scholar] [CrossRef]
- Roy, P.P.; Roy, K. On some aspects of variable selection for partial least squares regression models. QSAR Comb. Sci. 2008, 27, 302–313. [Google Scholar] [CrossRef]
- Tavana, M.; Fallahpour, A.; Di Caprio, D.; Santos-Arteaga, F.J. A hybrid intelligent fuzzy predictive model with simulation for supplier evaluation and selection. Expert Syst. Appl. 2016, 61, 129–144. [Google Scholar] [CrossRef]
- Khalaj, O.; Ghobadi, M.; Saebnoori, E.; Zarezadeh, A.; Shishesaz, M.; Mašek, B.; Štadler, C.; Svoboda, J. Development of Machine Learning Models to Evaluate the Toughness of OPH Alloys. Materials 2021, 14, 6713. [Google Scholar] [CrossRef] [PubMed]


| Sample Code | Step 1 | Step 2 | Duration of Pretreatment (s) |
|---|---|---|---|
| A | No | No | - |
| B | Acidic solution (1N H2SO4) | No | 30 |
| C | Alkaline solution (1N NaOH) | No | 30 |
| D | Alkaline solution (1N NaOH) | Acidic solution (1N H2SO4) | 30 |
| E | Acidic solution (1N H2SO4) | Alkaline solution (1N NaOH) | 30 |
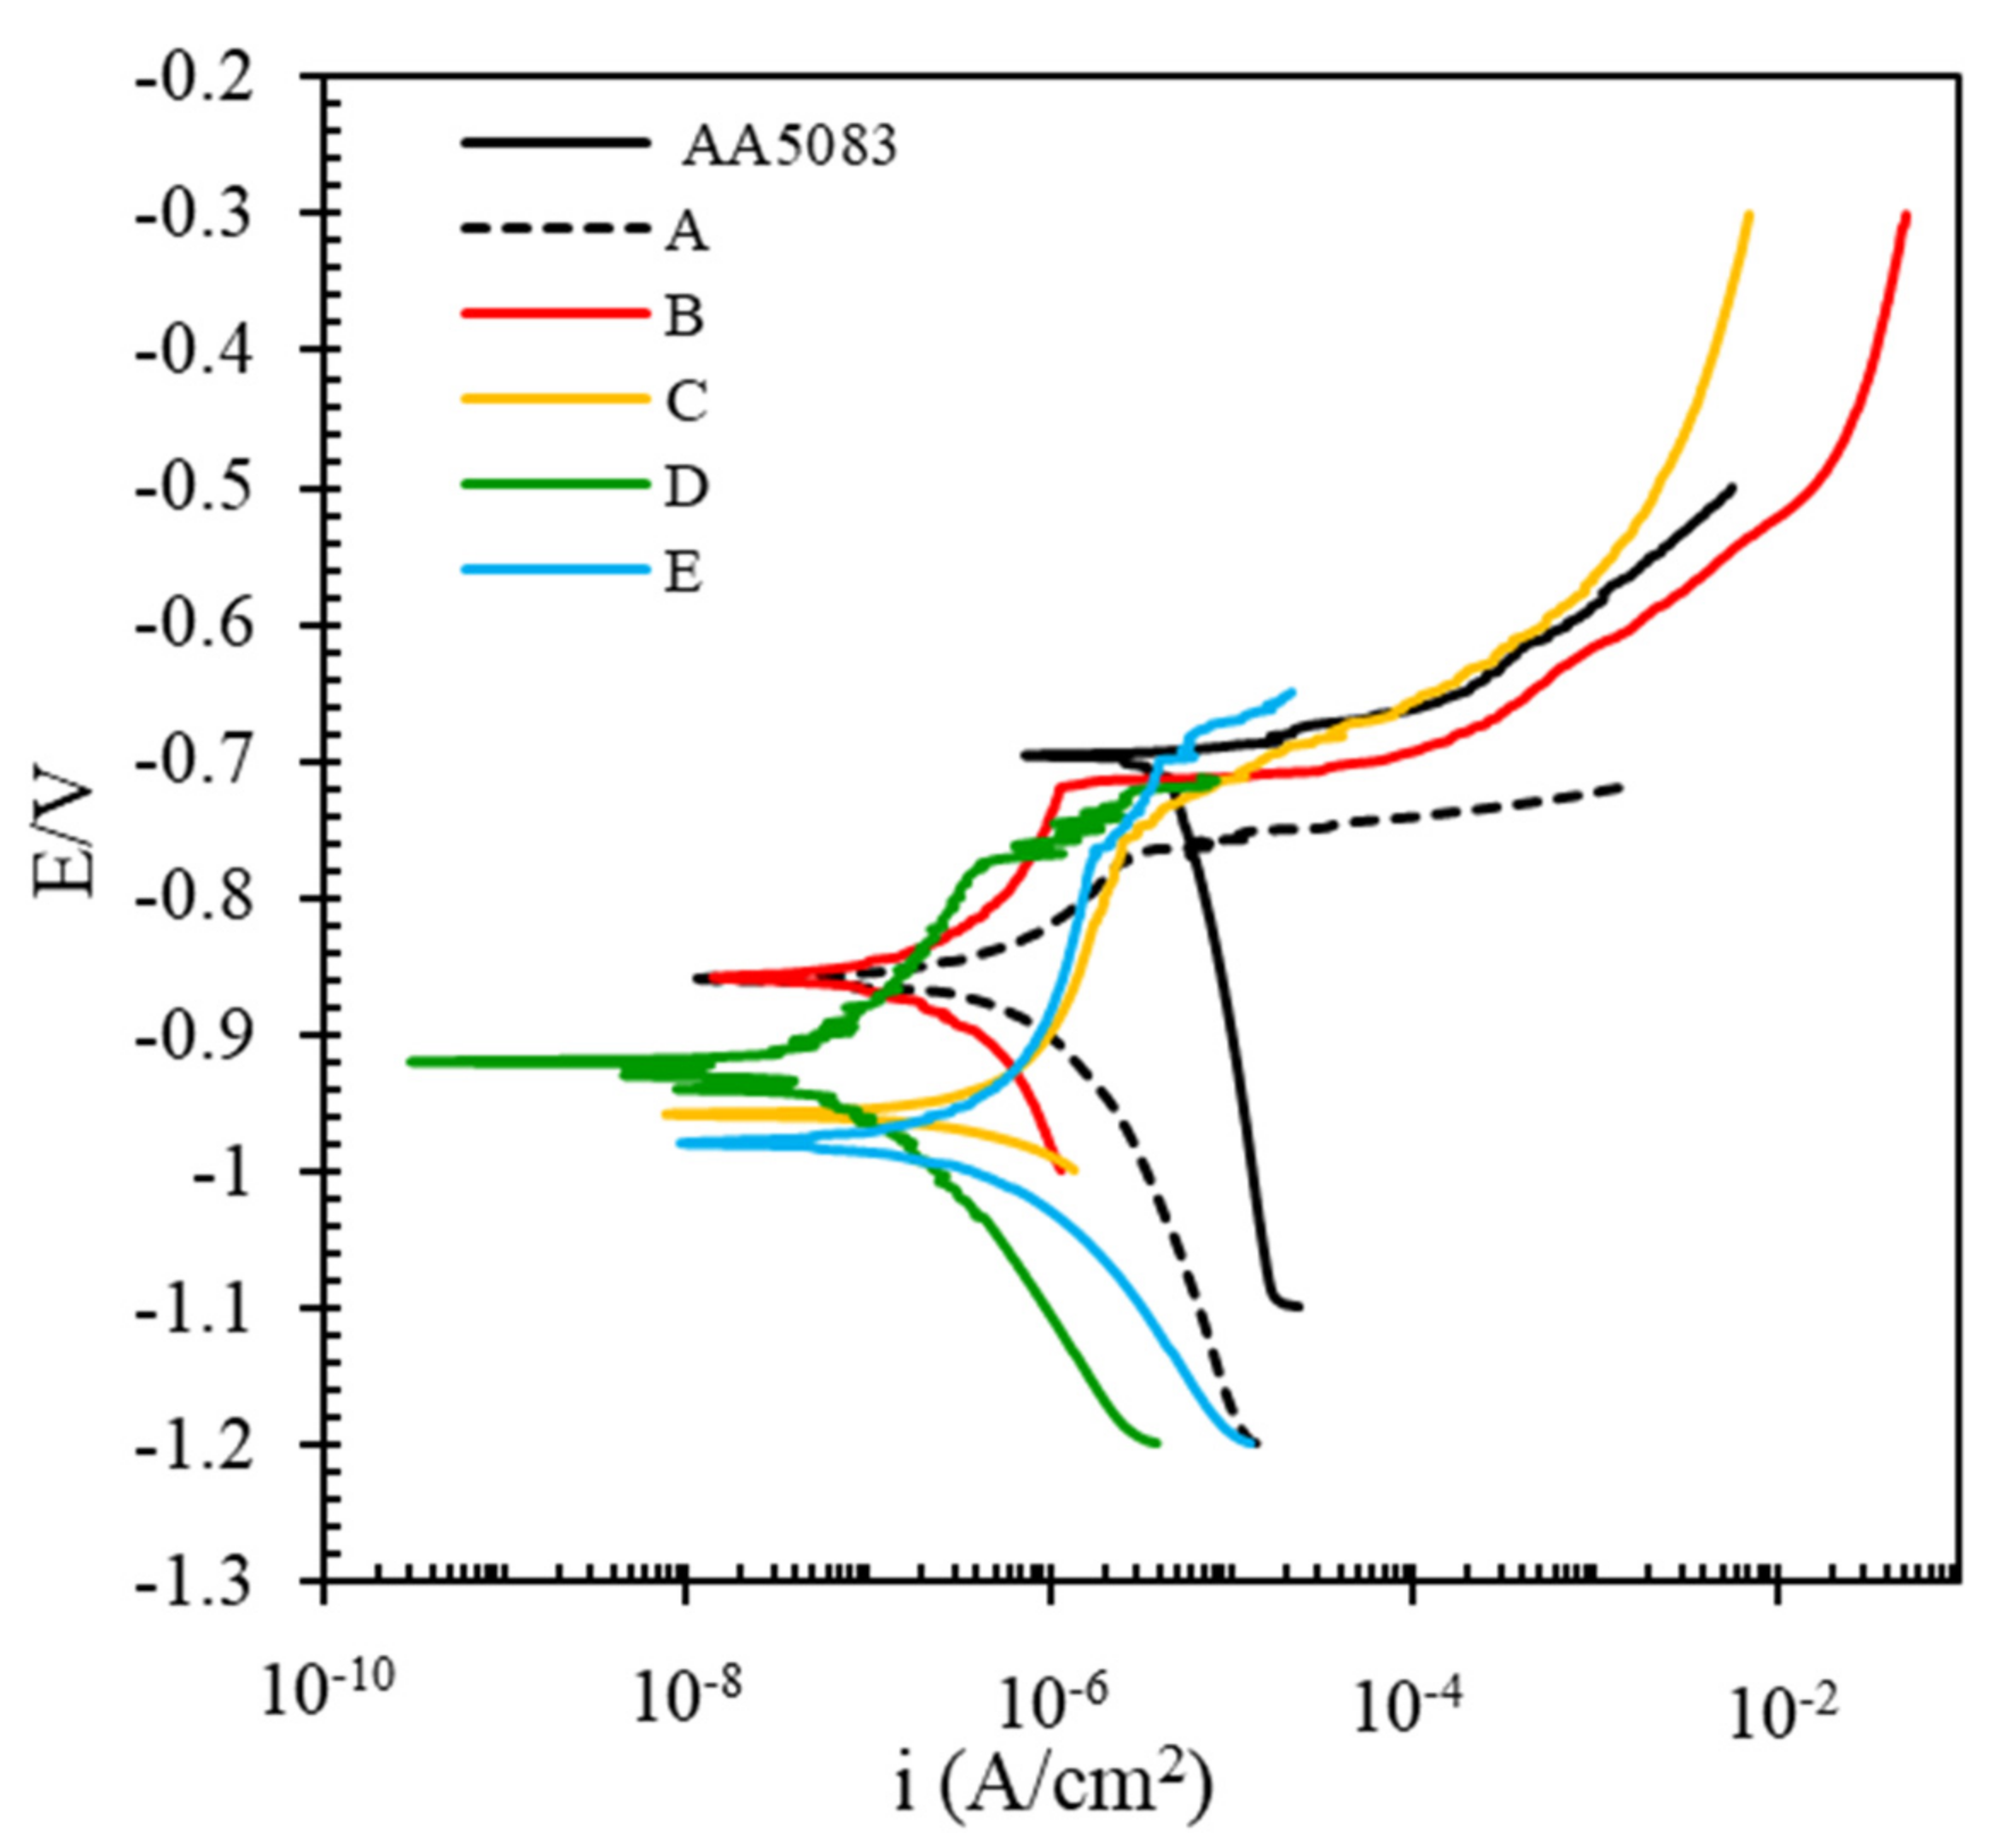
| Sample | Ecorr (V) | Icorr (A/cm2) | ba (V/dec) | -bc (V/dec) |
|---|---|---|---|---|
| bare AA5083 | −0.639 | 3.088 × 10⁻⁵ | 0.047 | 2.96 |
| A | −0.860 | 7.911 × 10⁻⁷ | 0.265 | 0.123 |
| B | −0.906 | 9.823 × 10⁻⁸ | 0.172 | 0.112 |
| C | −0.969 | 3.048 × 10⁻⁷ | 0.036 | 0.167 |
| D | −0.927 | 4.085 × 10⁻⁸ | 0.078 | 0.148 |
| E | −0.979 | 2.166 × 10⁻⁷ | 0.153 | 0.067 |
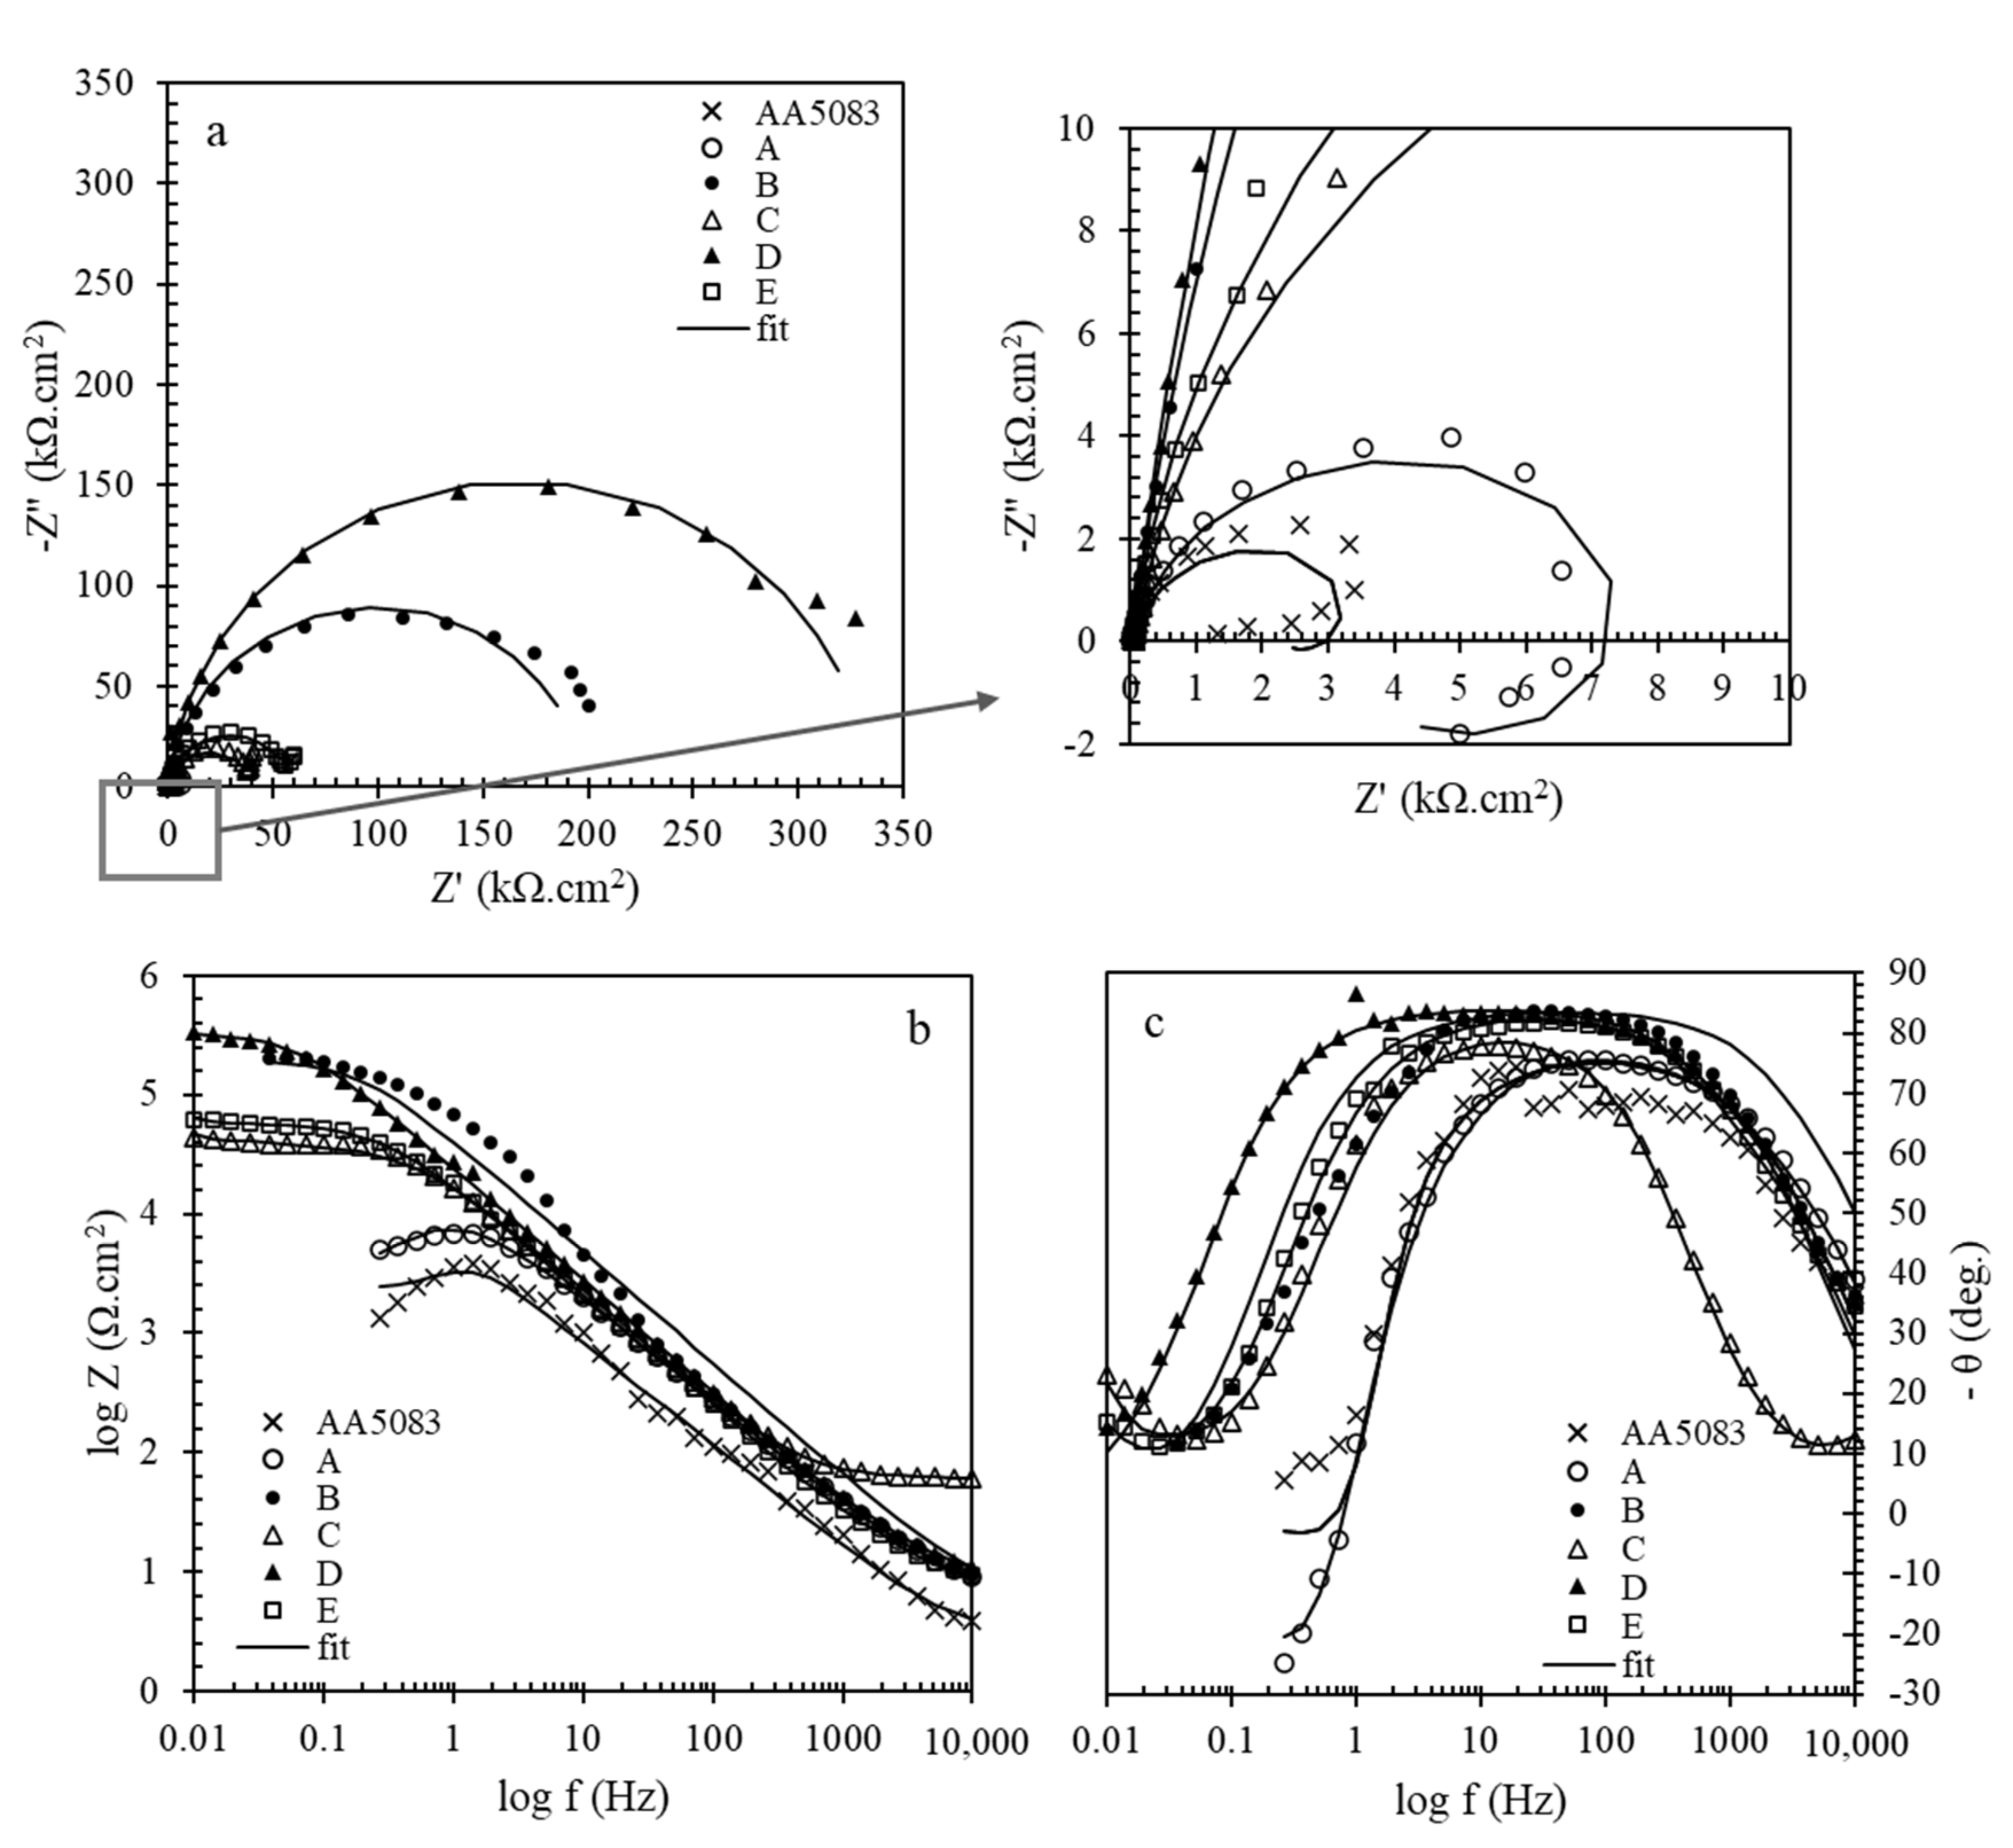
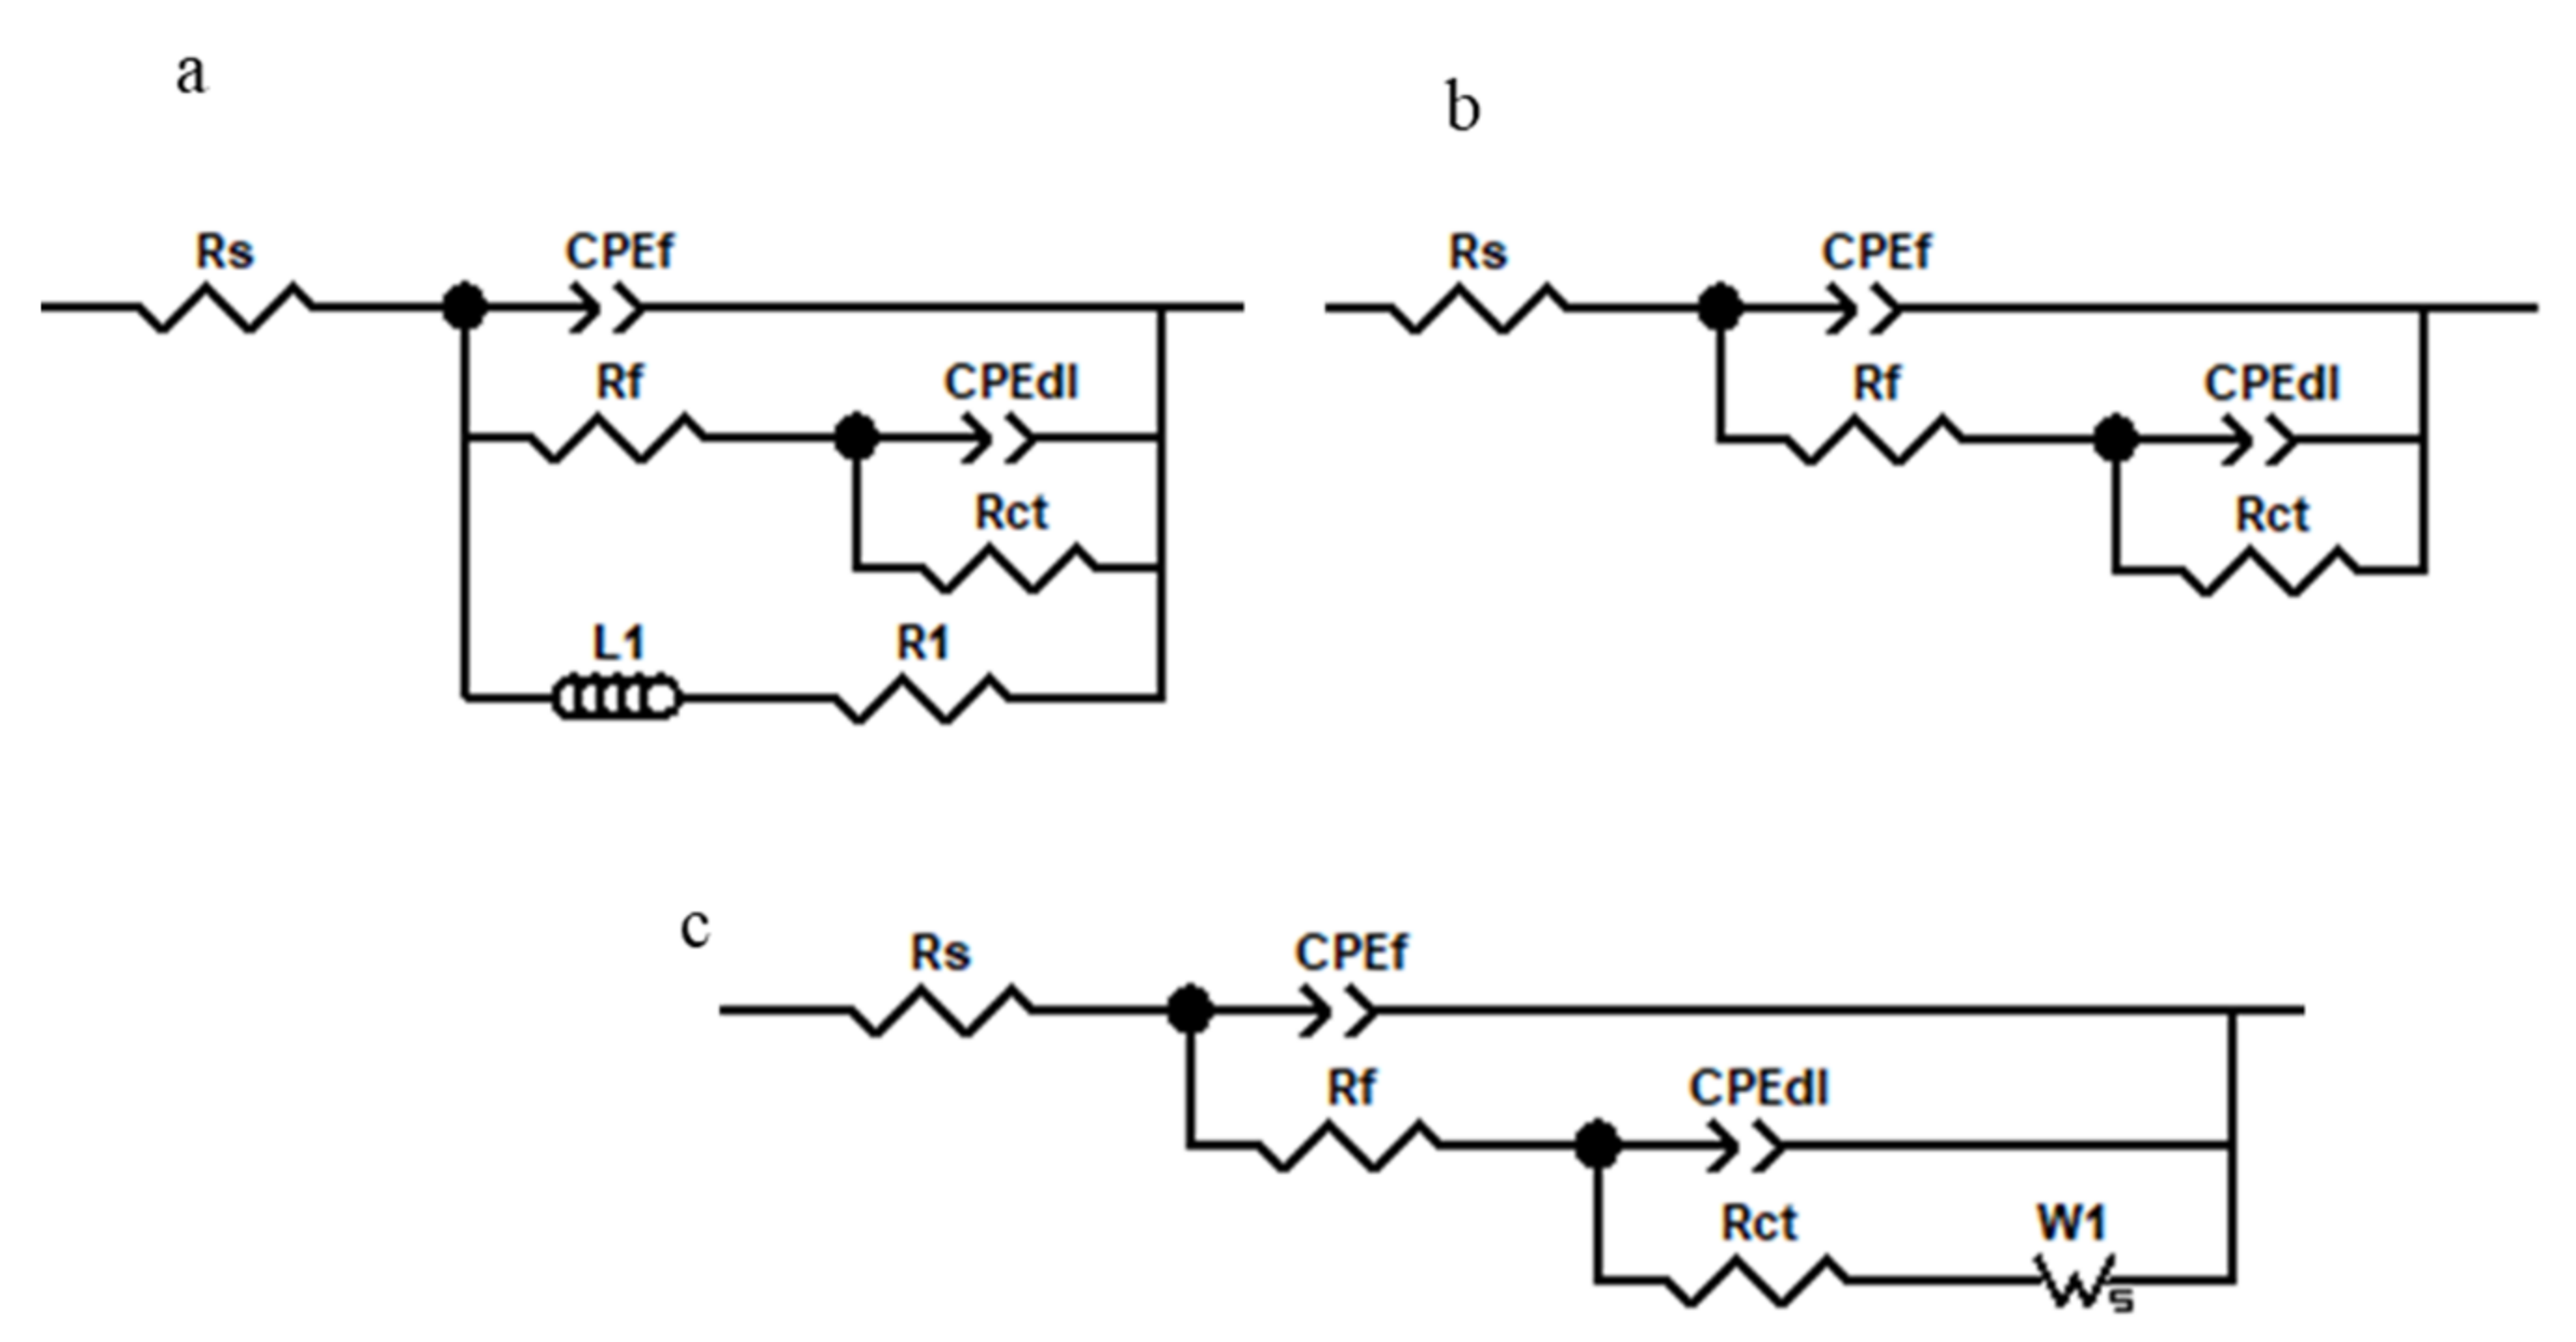
| Code of Samples | Rs (Ω·cm2) | Rf (Ω·cm2) | CPEf | Rct (Ω·cm2) | CPEdl | L1 (H·cm2) | R1 (Ω·cm2) | W1-R | W1-T | W1-P | ||
|---|---|---|---|---|---|---|---|---|---|---|---|---|
| n | Y0 (Ω−1·cm−2 sn) | n | Y0 (Ω−1·cm−2 sn) | |||||||||
| AA5083 | 2.9 | 44.0 | 0.86 | 3.32 × 10⁻⁵ | 5467.0 | 0.98 | 2.26 × 10⁻⁷ | 858.5 | 4271.0 | - | - | - |
| A | 5.5 | 58.7 | 0.93 | 3.96 × 10⁻⁶ | 8958.0 | 0.84 | 4.02 × 10⁻⁶ | 3517.0 | 5254.0 | - | - | - |
| B | 5.5 | 106.1 | 0.93 | 3.96 × 10⁻⁶ | 198,000.0 | 0.97 | 3.94 × 10⁻⁷ | - | - | - | - | - |
| C | 1.0 | 62.4 | 0.92 | 1.07 × 10⁻⁷ | 36,909.0 | 0.92 | 9.45 × 10⁻⁶ | - | - | 34,305.0 | 55.46 | 0.65 |
| D | 8.6 | 300.2 | 0.93 | 6.67 × 10⁻⁶ | 335,730.0 | 0.99 | 7.32 × 10⁻⁷ | - | - | - | - | - |
| E | 6.9 | 100.9 | 0.92 | 8.54 × 10⁻⁶ | 56,190.0 | 0.97 | 156 × 10−6 | - | - | 22,098.0 | 42.42 | 0.67 |
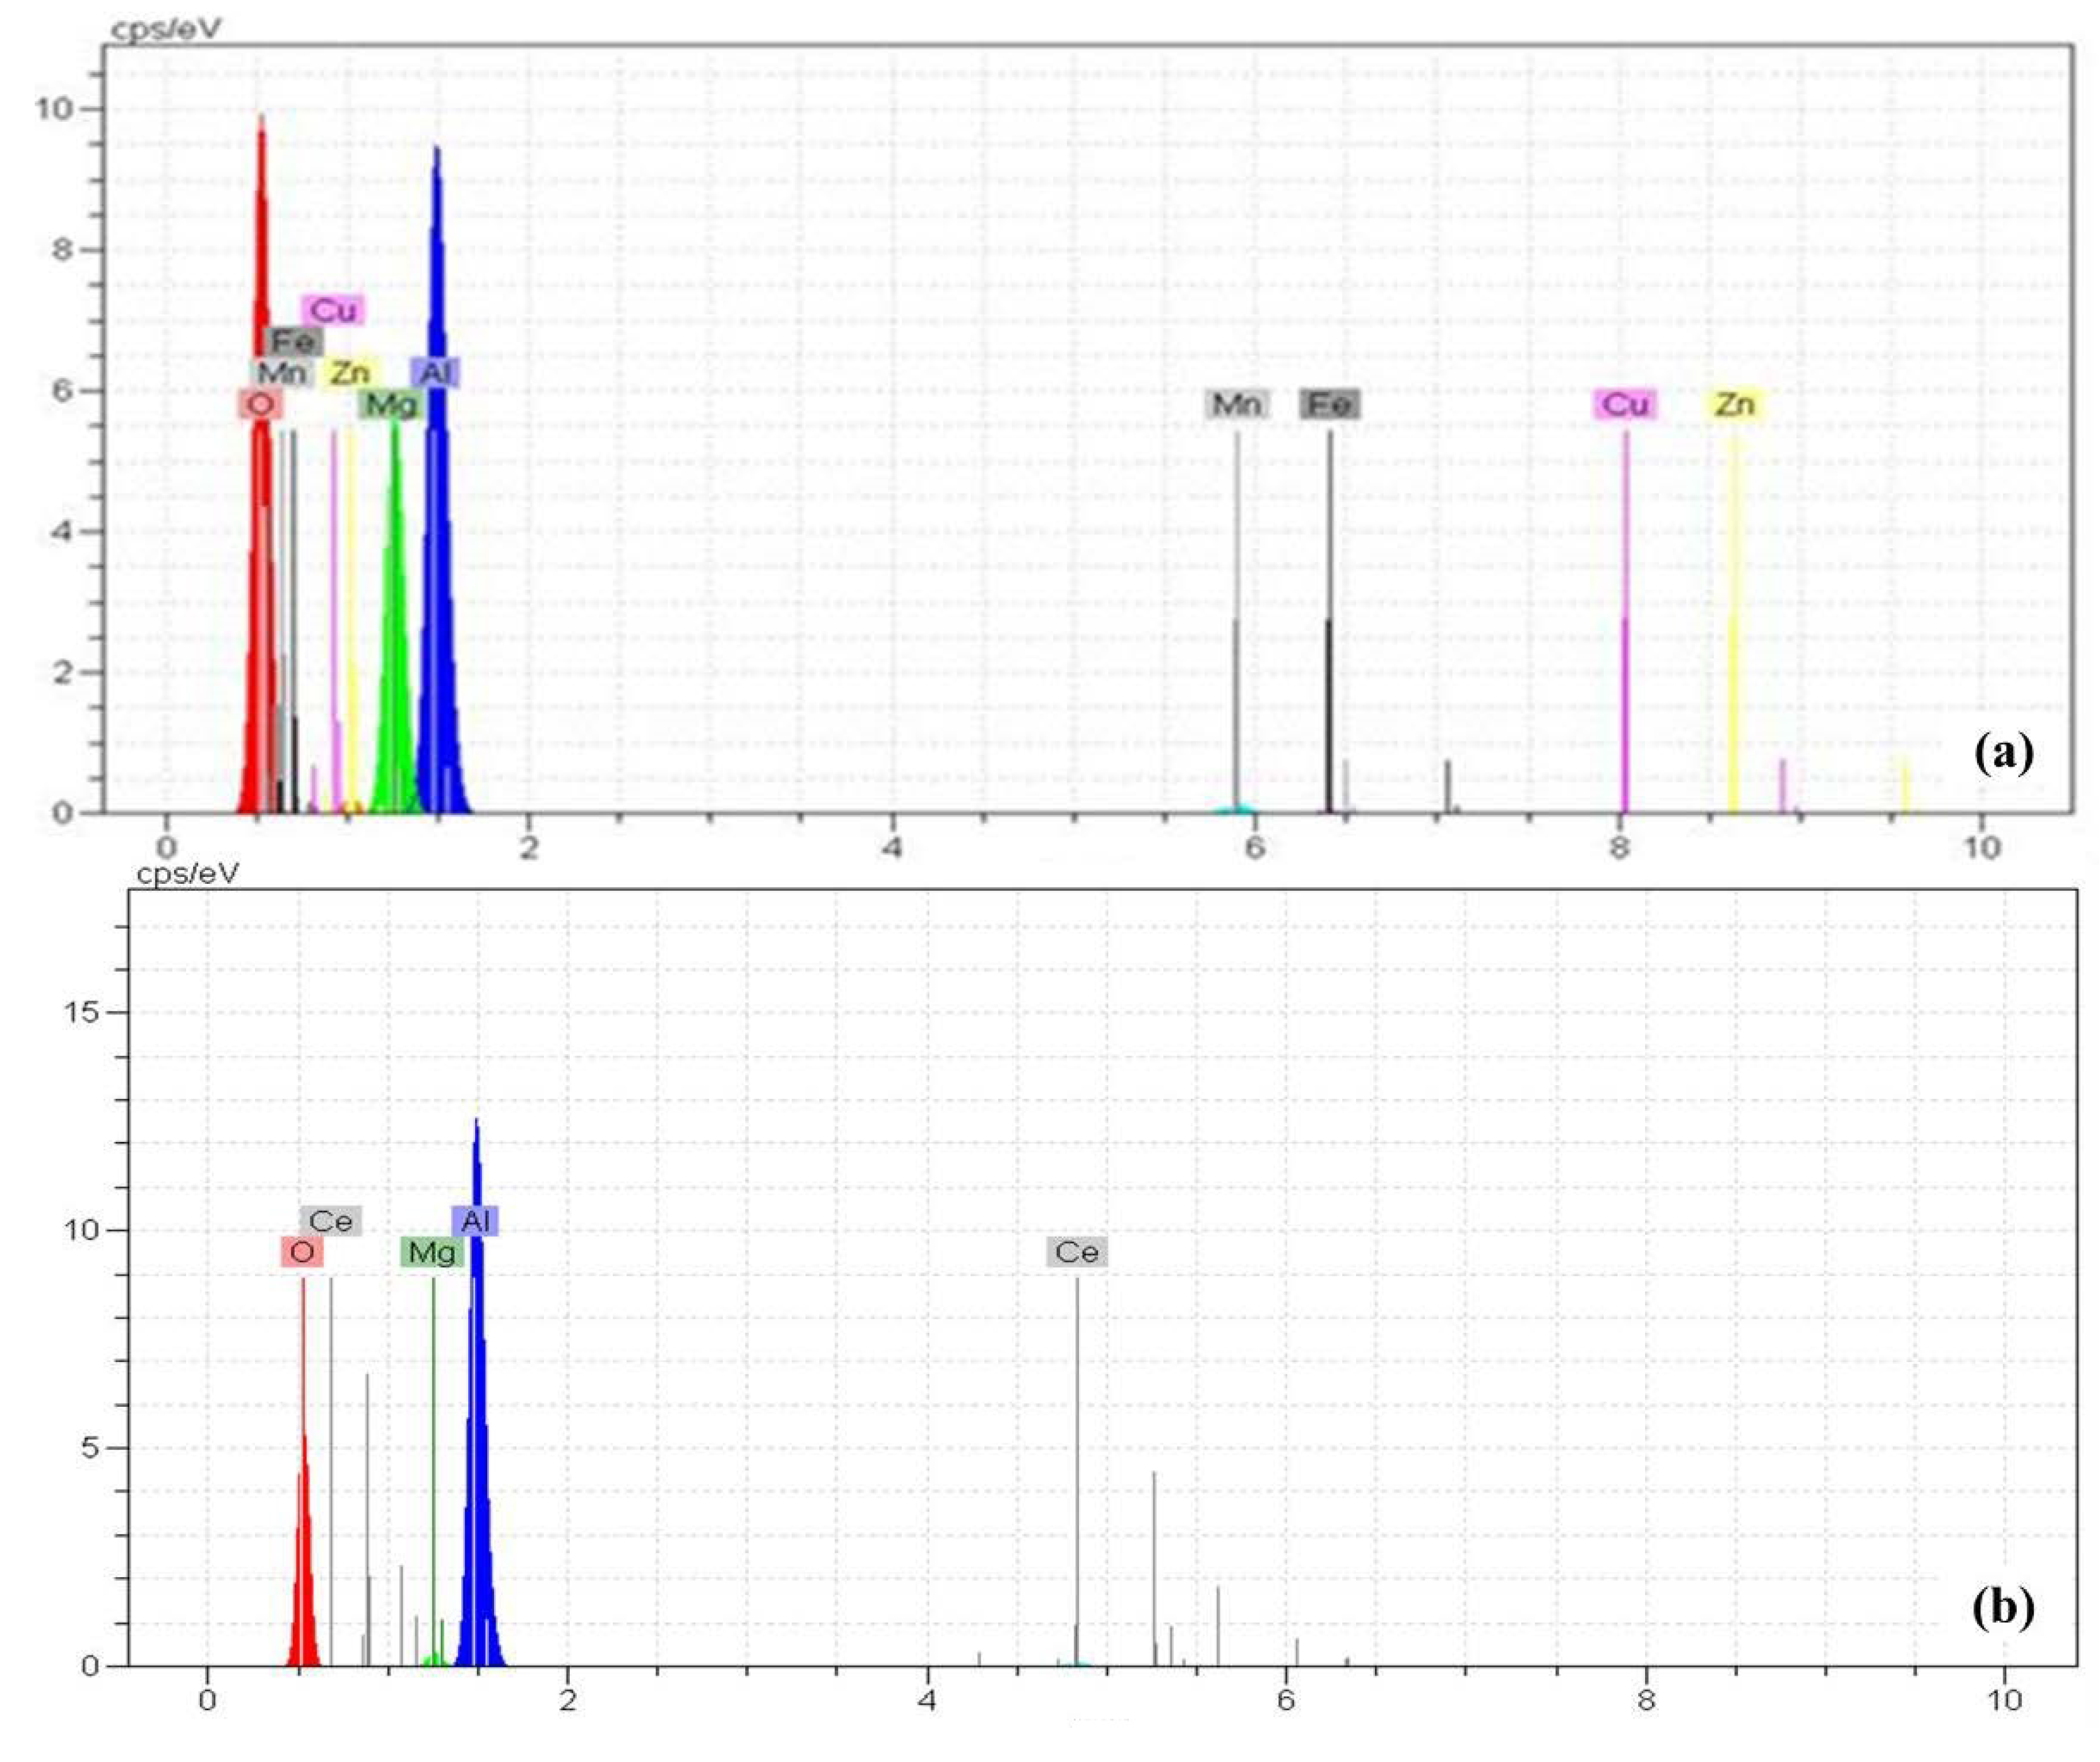
| Code of Sample | Al | Mg | Ce | Mn | Fe | Cu | Zn | O |
|---|---|---|---|---|---|---|---|---|
| AA5083 | 93.4 | 4.3 | - | 0.8 | 0.4 | 0.1 | 0.2 | 0.3 |
| A | 67.58 | 1.05 | 1.05 | - | - | - | - | 30.32 |
| B | 30.74 | 1.20 | 24.45 | - | - | - | - | 43.61 |
| C | 67.99 | 1.68 | 7.58 | - | - | - | - | 21.74 |
| D | 14.74 | - | 30.58 | - | - | - | - | 50.07 |
| E | 68.21 | 1.43 | 9.91 | - | - | - | - | 20.44 |
| Sample | Ecorr (V) | Icorr (A/cm2) | ba (V/dec) | -bc (V/dec) |
|---|---|---|---|---|
| AA5083 | −0.639 | 3.088 × 10⁻⁵ | 0.047 | 2.96 |
| A | −0.860 | 7.911 × 10⁻⁷ | 0.265 | 0.123 |
| D-1 min | −0.762 | 9.552 × 10⁻⁸ | 0.122 | 0.031 |
| D-5 min | −0.817 | 5.624 × 10⁻⁸ | 0.090 | 0.050 |
| D-10 min | −0.927 | 4.085 × 10⁻⁸ | 0.078 | 0.148 |
| D-20 min | −0.749 | 9.873 × 10⁻⁸ | 0.122 | 0.023 |
| Code of Samples | Rs (Ω·cm2) | Rf (Ω·cm2) | CPEf | Rct (Ω·cm2) | CPEdl | L1 (H·cm2) | R1 (Ω·cm2) | ||
|---|---|---|---|---|---|---|---|---|---|
| n | Y0 (Ω−1·cm−2 sn) | n | Y0 (Ω−1·cm−2 sn) | ||||||
| AA 5083 | 2.9 | 44.0 | 0.86 | 3.32 × 10⁻⁵ | 5467.0 | 0.98 | 2.26 × 10⁻⁷ | 858.5 | 4271.0 |
| A | 5.5 | 58.7 | 0.93 | 3.96 × 10⁻⁶ | 8958.0 | 0.84 | 4.02 × 10⁻⁶ | 3517.0 | 5254.0 |
| D-1 min | 13.2 | 154.9 | 0.92 | 5.17 × 10⁻⁶ | 153,200.0 | 0.91 | 3.11 × 10⁻⁶ | - | - |
| D-5 min | 6.3 | 200.0 | 0.94 | 6.38 × 10⁻⁶ | 224,520.0 | 0.97 | 4.05 × 10⁻⁷ | - | - |
| D-10 min | 8.6 | 300.2 | 0.93 | 6.67 × 10⁻⁶ | 335,730.0 | 0.99 | 7.32 × 10⁻⁷ | - | - |
| D-20 min | 6.3 | 100.0 | 0.96 | 5.80 ×1 0−6 | 120,390.0 | 0.96 | 7.27 × 10⁻⁶ | - | - |
| ANN Models | Training Algorithm | Symbol | MAE | MSE |
|---|---|---|---|---|
| ANN-1 | Resilient backpropagation | RP | 38.5 | 2604.6 |
| ANN-2 | BFGS quasi-Newton backpropagation | BFG | 58.4 | 4884.1 |
| ANN-3 | Scaled conjugate gradient | SCG | 37.1 | 2676.9 |
| ANN-4 | Levenberg–Marquardt backpropagation | LM | 14.1 | 1048.3 |
| ANN-5 | Gradient descent with momentum and adaptive LR | GDX | 51.7 | 4267.5 |
| ANN-6 | Conjugate gradient with Powell/Beale restarts | CGB | 37.1 | 2676.9 |
| Model | ANN | ANFIS | SVMR |
|---|---|---|---|
| Error | |||
| MSE | 1048.27 | 48.83 | 3220.58 |
| MAE | 14.10 | 3.49 | 38.55 |
| R2 | 0.90 | 0.99 | 0.69 |
| Item | Formula | Condition | ANN | ANFIS | SVMR | Item | Formula |
|---|---|---|---|---|---|---|---|
| 1 | R | 0.8 < R | 0.957 | 0.998 | 0.857 | 1 | R |
| 2 | k = | 0.85 < k < 1.15 | 1.042 | 0.998 | 0.862 | 2 | k = |
| 3 | k′ = | 0.85 < k′ < 1.15 | 0.932 | 1.001 | 1.097 | 3 | k′ = |
| 4 | = | m < 0.1 | 0.091 | 0.0047 | 0.098 | 4 | = |
| 5 | n = | n < 0.1 | 0.096 | 0.0046 | 0.099 | 5 | N = |
| 6 | Rm =× (1 − ) | 0.5 < Rm | 0.623 | 0.928 | 0.546 | 6 | Rm = × (1 − ) |
| Where | = 1 − , = k × ti | 1 | 0.994 | 0.999 | 0.771 | Where | = 1 −, = k × ti |
Publisher’s Note: MDPI stays neutral with regard to jurisdictional claims in published maps and institutional affiliations. |
© 2021 by the authors. Licensee MDPI, Basel, Switzerland. This article is an open access article distributed under the terms and conditions of the Creative Commons Attribution (CC BY) license (https://creativecommons.org/licenses/by/4.0/).
Share and Cite
Shishesaz, M.R.; Ghobadi, M.; Asadi, N.; Zarezadeh, A.; Saebnoori, E.; Amraei, H.; Schubert, J.; Chocholaty, O. Surface Pretreatments of AA5083 Aluminum Alloy with Enhanced Corrosion Protection for Cerium-Based Conversion Coatings Application: Combined Experimental and Computational Analysis. Molecules 2021, 26, 7413. https://doi.org/10.3390/molecules26247413
Shishesaz MR, Ghobadi M, Asadi N, Zarezadeh A, Saebnoori E, Amraei H, Schubert J, Chocholaty O. Surface Pretreatments of AA5083 Aluminum Alloy with Enhanced Corrosion Protection for Cerium-Based Conversion Coatings Application: Combined Experimental and Computational Analysis. Molecules. 2021; 26(24):7413. https://doi.org/10.3390/molecules26247413
Chicago/Turabian StyleShishesaz, Mohammad Reza, Moslem Ghobadi, Najmeh Asadi, Alireza Zarezadeh, Ehsan Saebnoori, Hamed Amraei, Jan Schubert, and Ondrej Chocholaty. 2021. "Surface Pretreatments of AA5083 Aluminum Alloy with Enhanced Corrosion Protection for Cerium-Based Conversion Coatings Application: Combined Experimental and Computational Analysis" Molecules 26, no. 24: 7413. https://doi.org/10.3390/molecules26247413
APA StyleShishesaz, M. R., Ghobadi, M., Asadi, N., Zarezadeh, A., Saebnoori, E., Amraei, H., Schubert, J., & Chocholaty, O. (2021). Surface Pretreatments of AA5083 Aluminum Alloy with Enhanced Corrosion Protection for Cerium-Based Conversion Coatings Application: Combined Experimental and Computational Analysis. Molecules, 26(24), 7413. https://doi.org/10.3390/molecules26247413