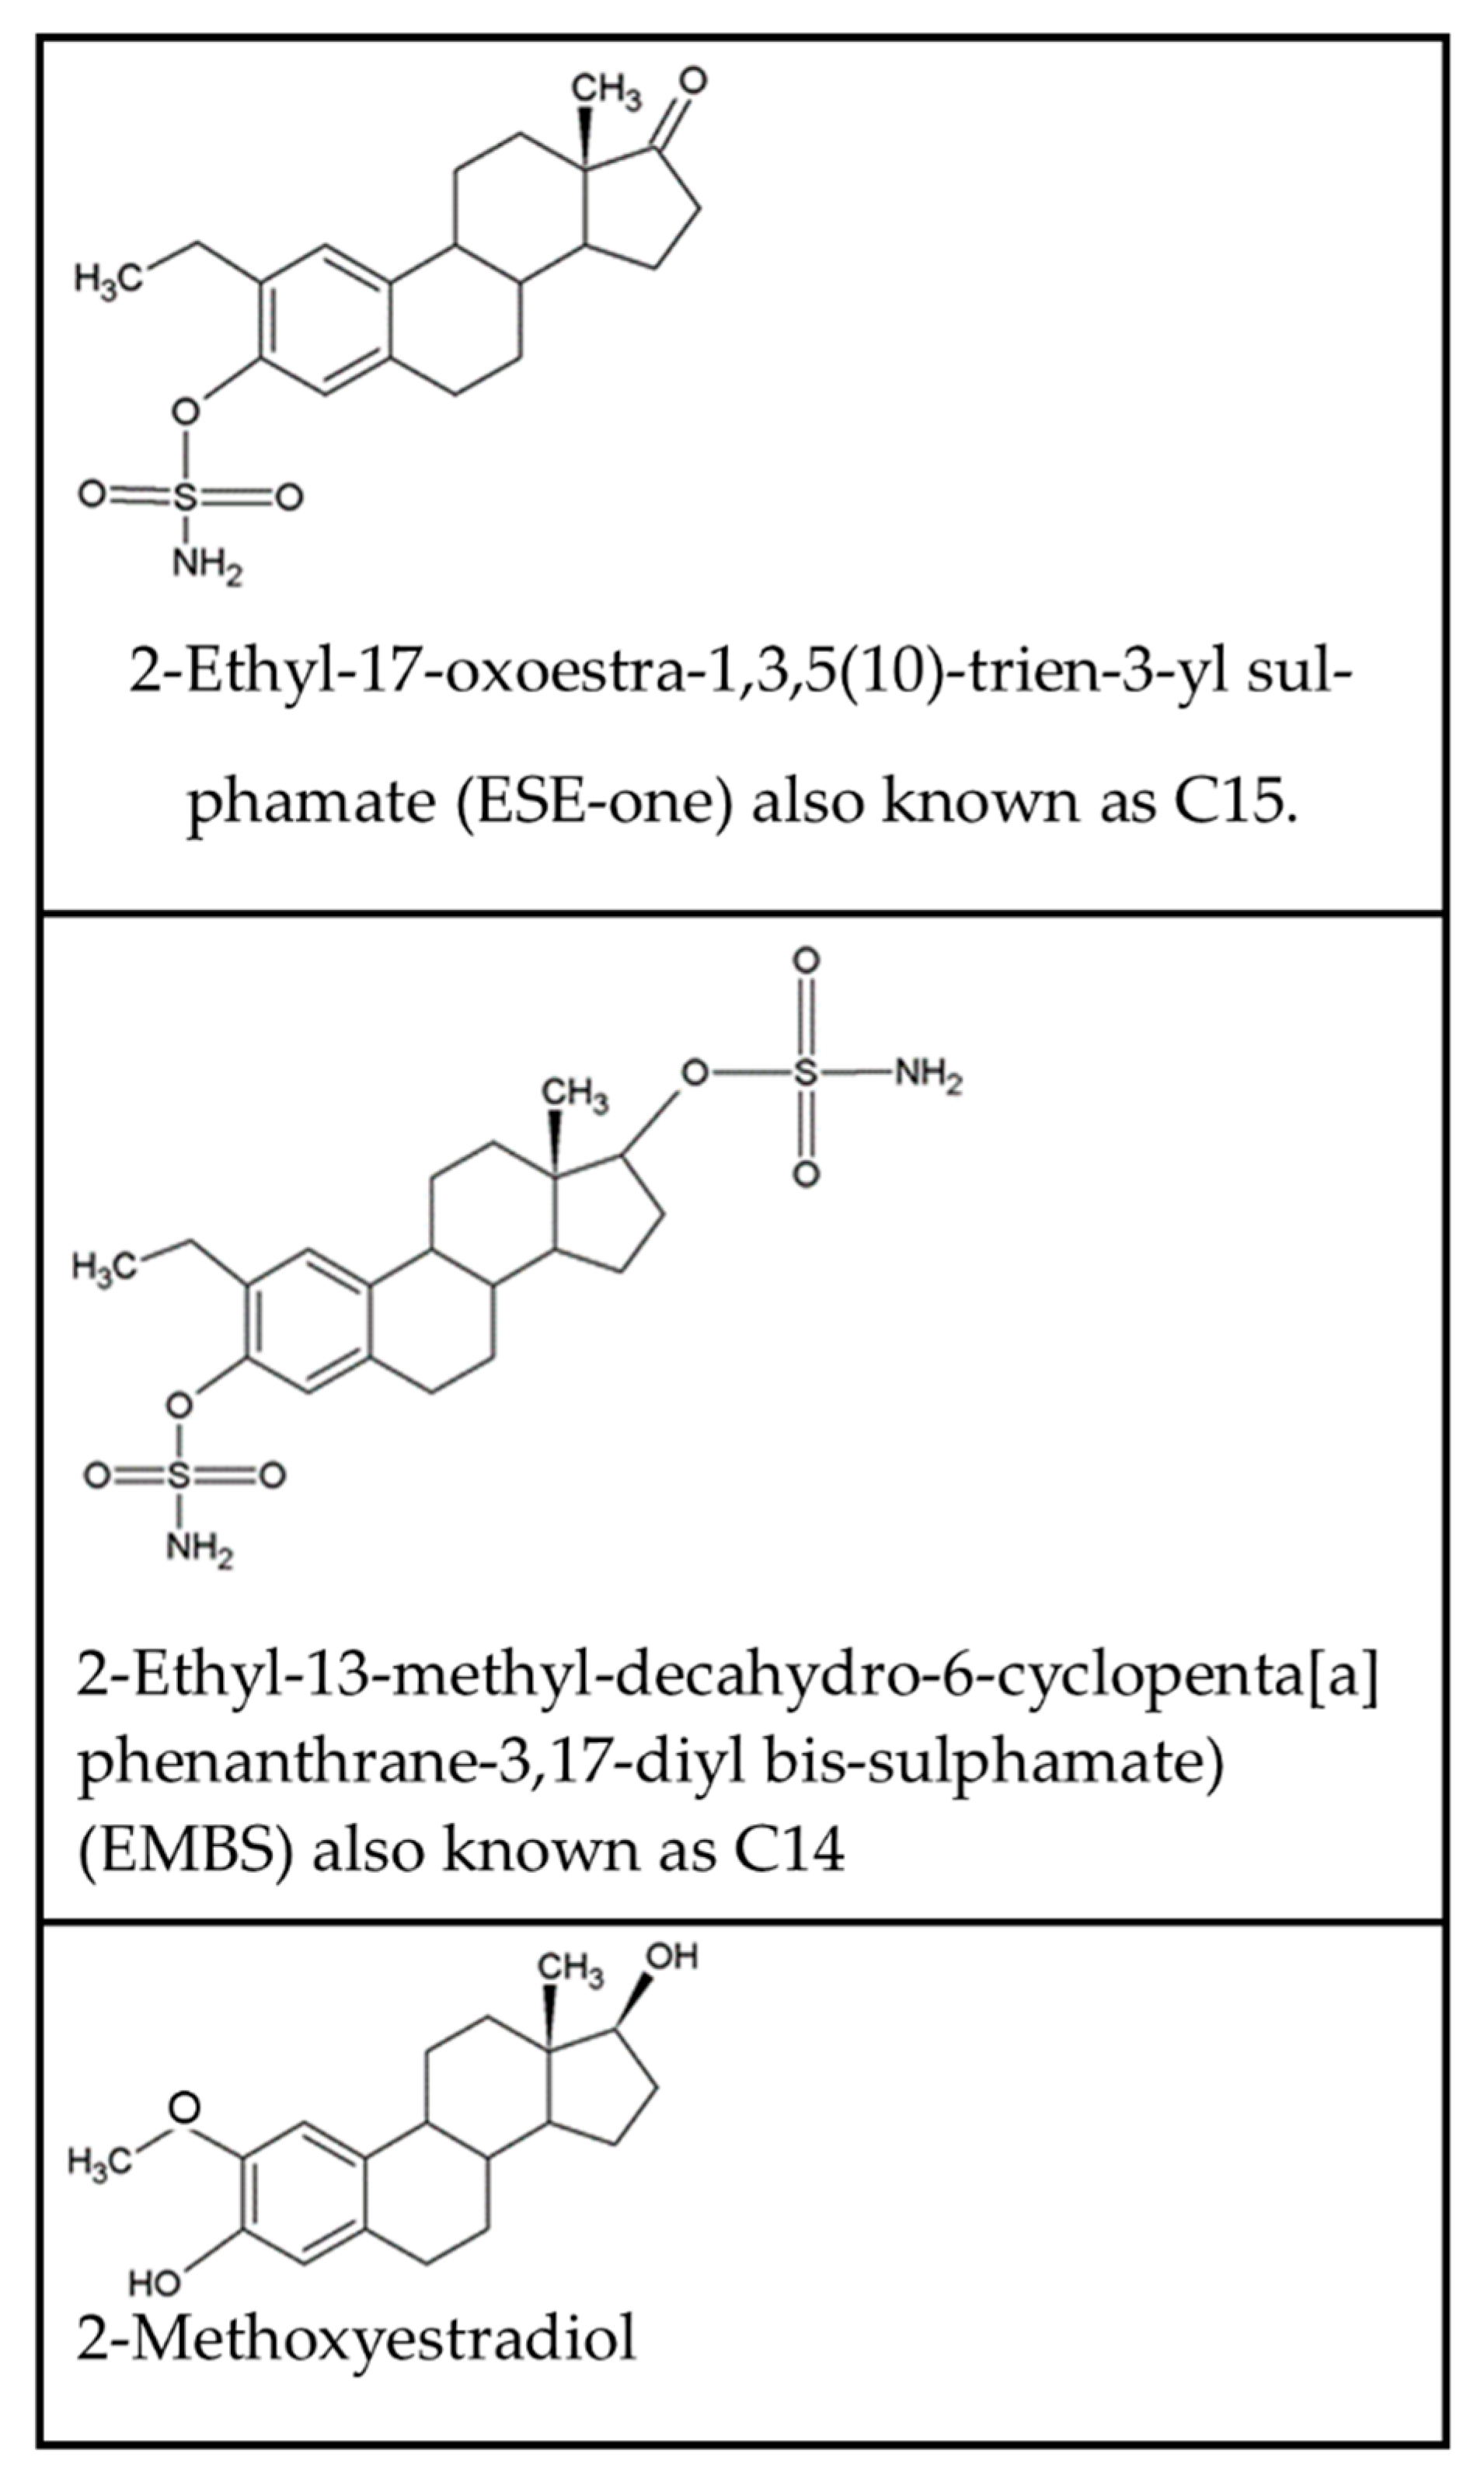
Figure 1.
Chemical structure of 2-ethyl-17-oxoestra-1,3,5(10)-trien-3-yl sulfamate (ESE-one), 2-ethyl-13-methyl-decahydro-6-cyclopenta[a]phenanthrane-3,17-diyl bis-sulfamate (EMBS) and 2-methoxyestradiol.
Figure 1.
Chemical structure of 2-ethyl-17-oxoestra-1,3,5(10)-trien-3-yl sulfamate (ESE-one), 2-ethyl-13-methyl-decahydro-6-cyclopenta[a]phenanthrane-3,17-diyl bis-sulfamate (EMBS) and 2-methoxyestradiol.
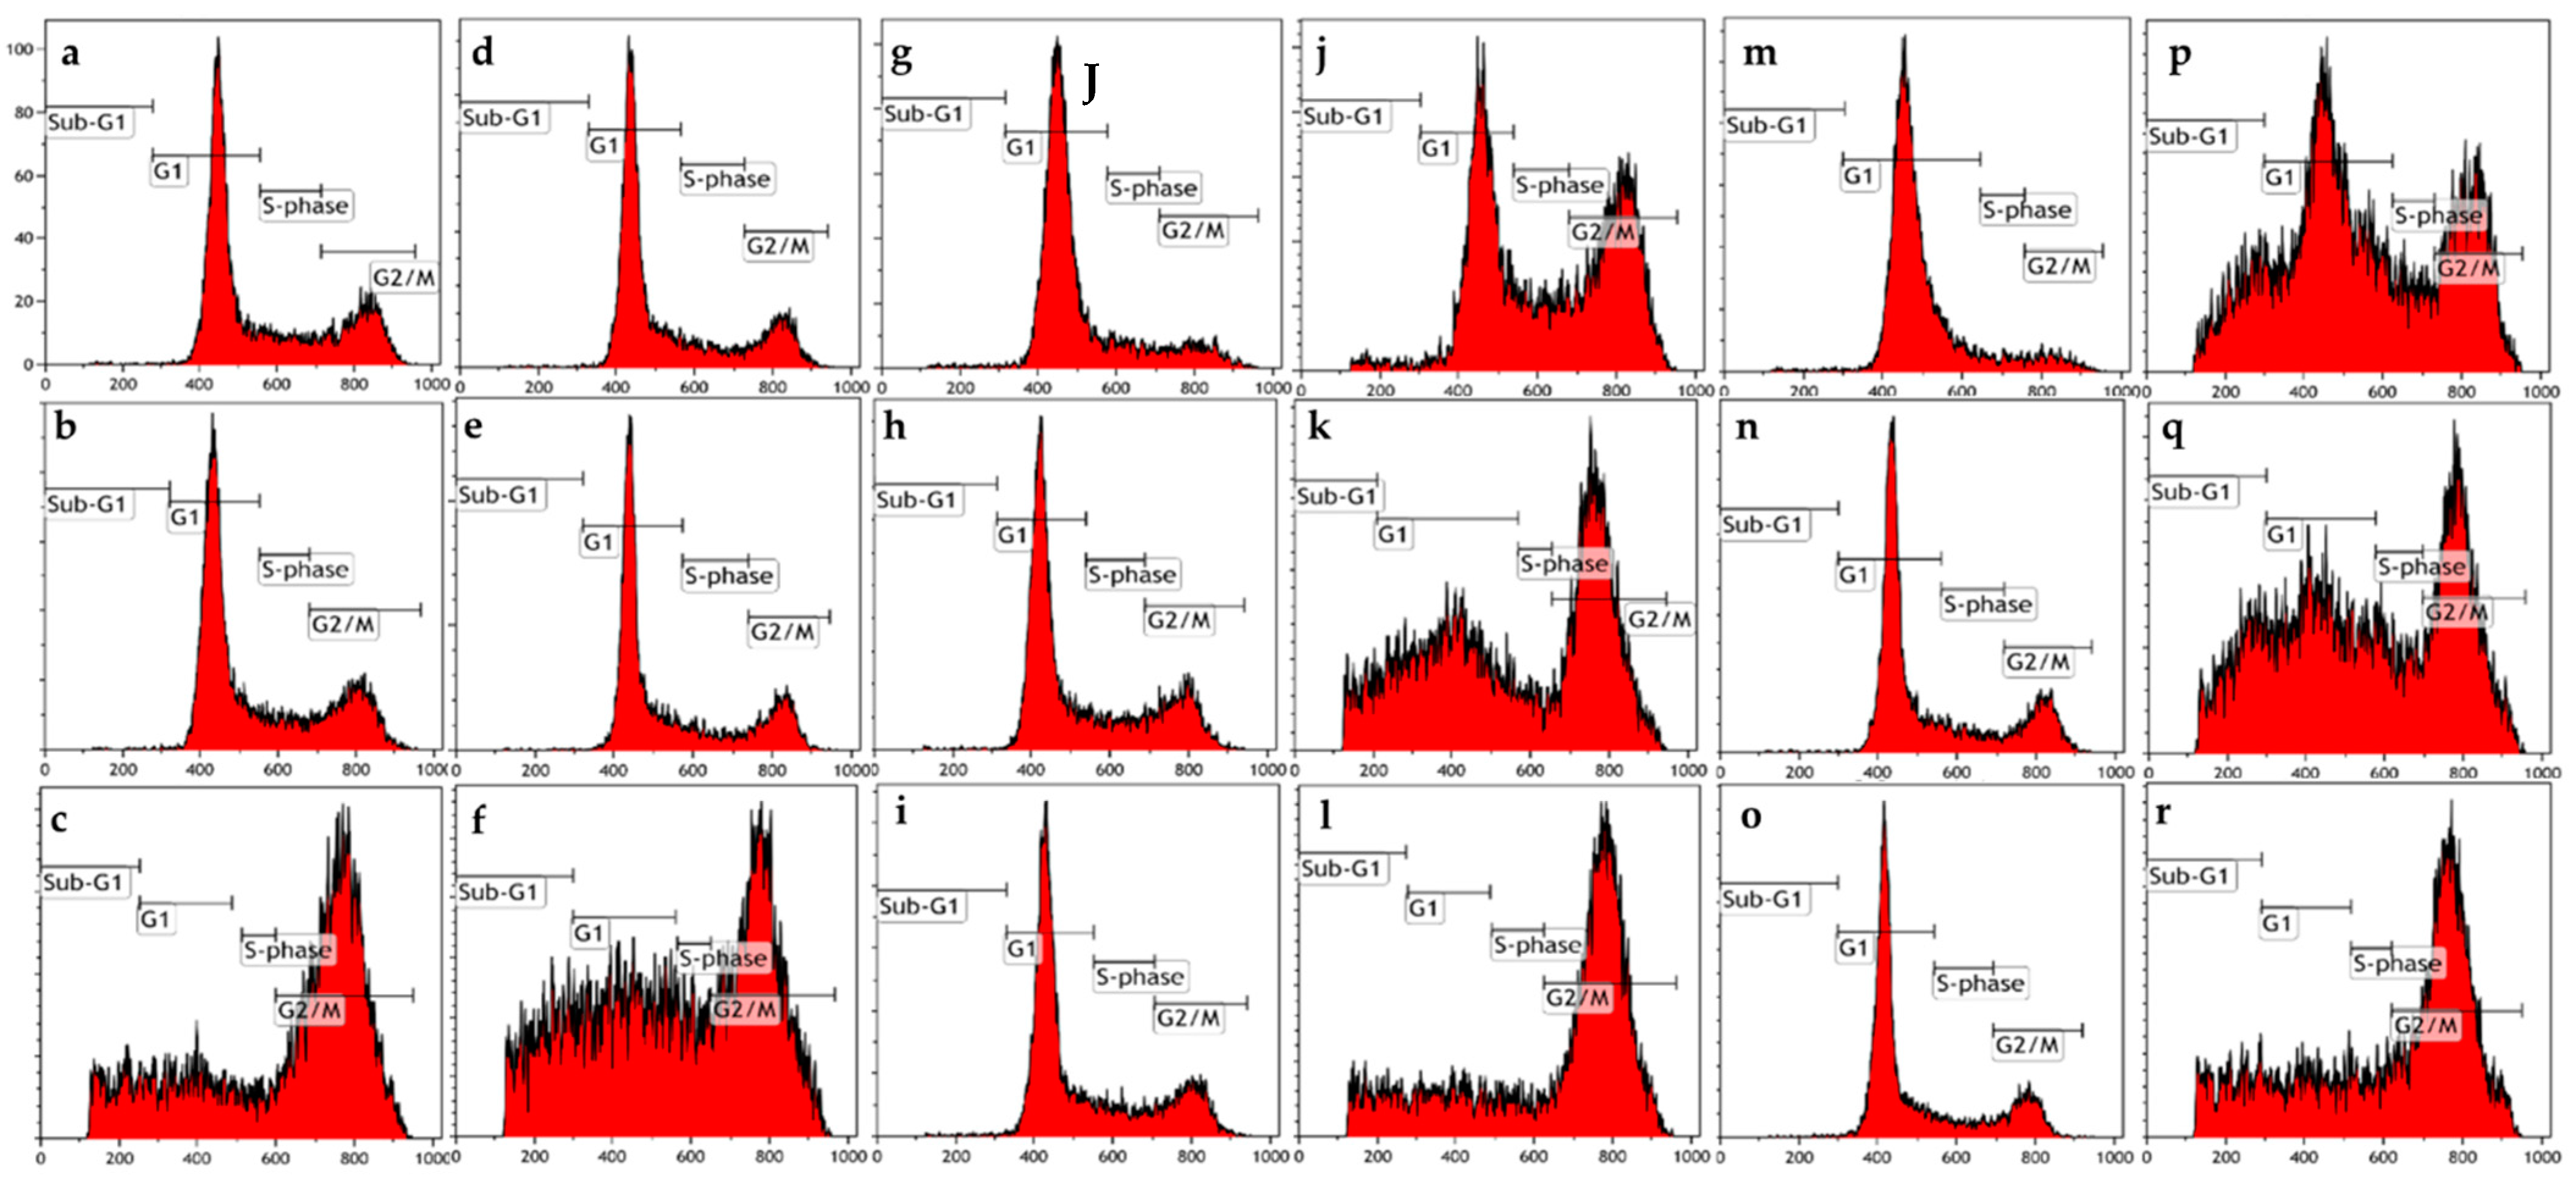
Figure 2.
Cell cycle progression graphs of MCF-7 and MDA-MB-231 cells exposed to ESE-one in the presence or absence of several scavengers of reactive oxygen species (tiron, trolox and DMTU) for 24 h. ESE-one exposure resulted in a G2/M block in both MCF-7 and MDA-MB-231 cells. Tiron and DMTU exposure significantly decreased the number of cells blocked in sub-G1 phase in MDA-MB-231 cells and tiron as well as trolox exposure significantly decreased the number of cells blocked in G2/M phase in both MCF-7 and MDA-MB-231 cells. (a) MCF-7 cells cultured in complete growth medium, (b) vehicle-treated MCF-7 cells, (c) MCF-7 cells exposed to ESE-one only, (d) MDA-MB-231 cells cultured in complete growth medium, (e) vehicle-treated MDA-MB-231 cells, (f) MDA-MB-231 cells exposed to ESE-one, (g) MCF-7 cells exposed to tiron only, (h) MCF-7 cells exposed to trolox only, (i) MCF-7 cells exposed to DMTU only, (j) MCF-7 cells coexposed to tiron and ESE-one, (k) MCF-7 cells coexposed to trolox and ESE-one, (l) MCF-7 cells coexposed to DMTU and ESE-one, (m) MDA-MB-231 cells coexposed to tiron only, (n) MDA-MB-231 cells exposed to trolox only, (o) MDA-MB-231 cells exposed to DMTU only, (p) MDA-MB-231 cells coexposed to tiron and ESE-one, (q) MDA-MB-231 cells coexposed to trolox and ESE-one, (r) MDA-MB-231 cells coexposed to DMTU and ESE-one.
![Molecules 26 00622 g002]()
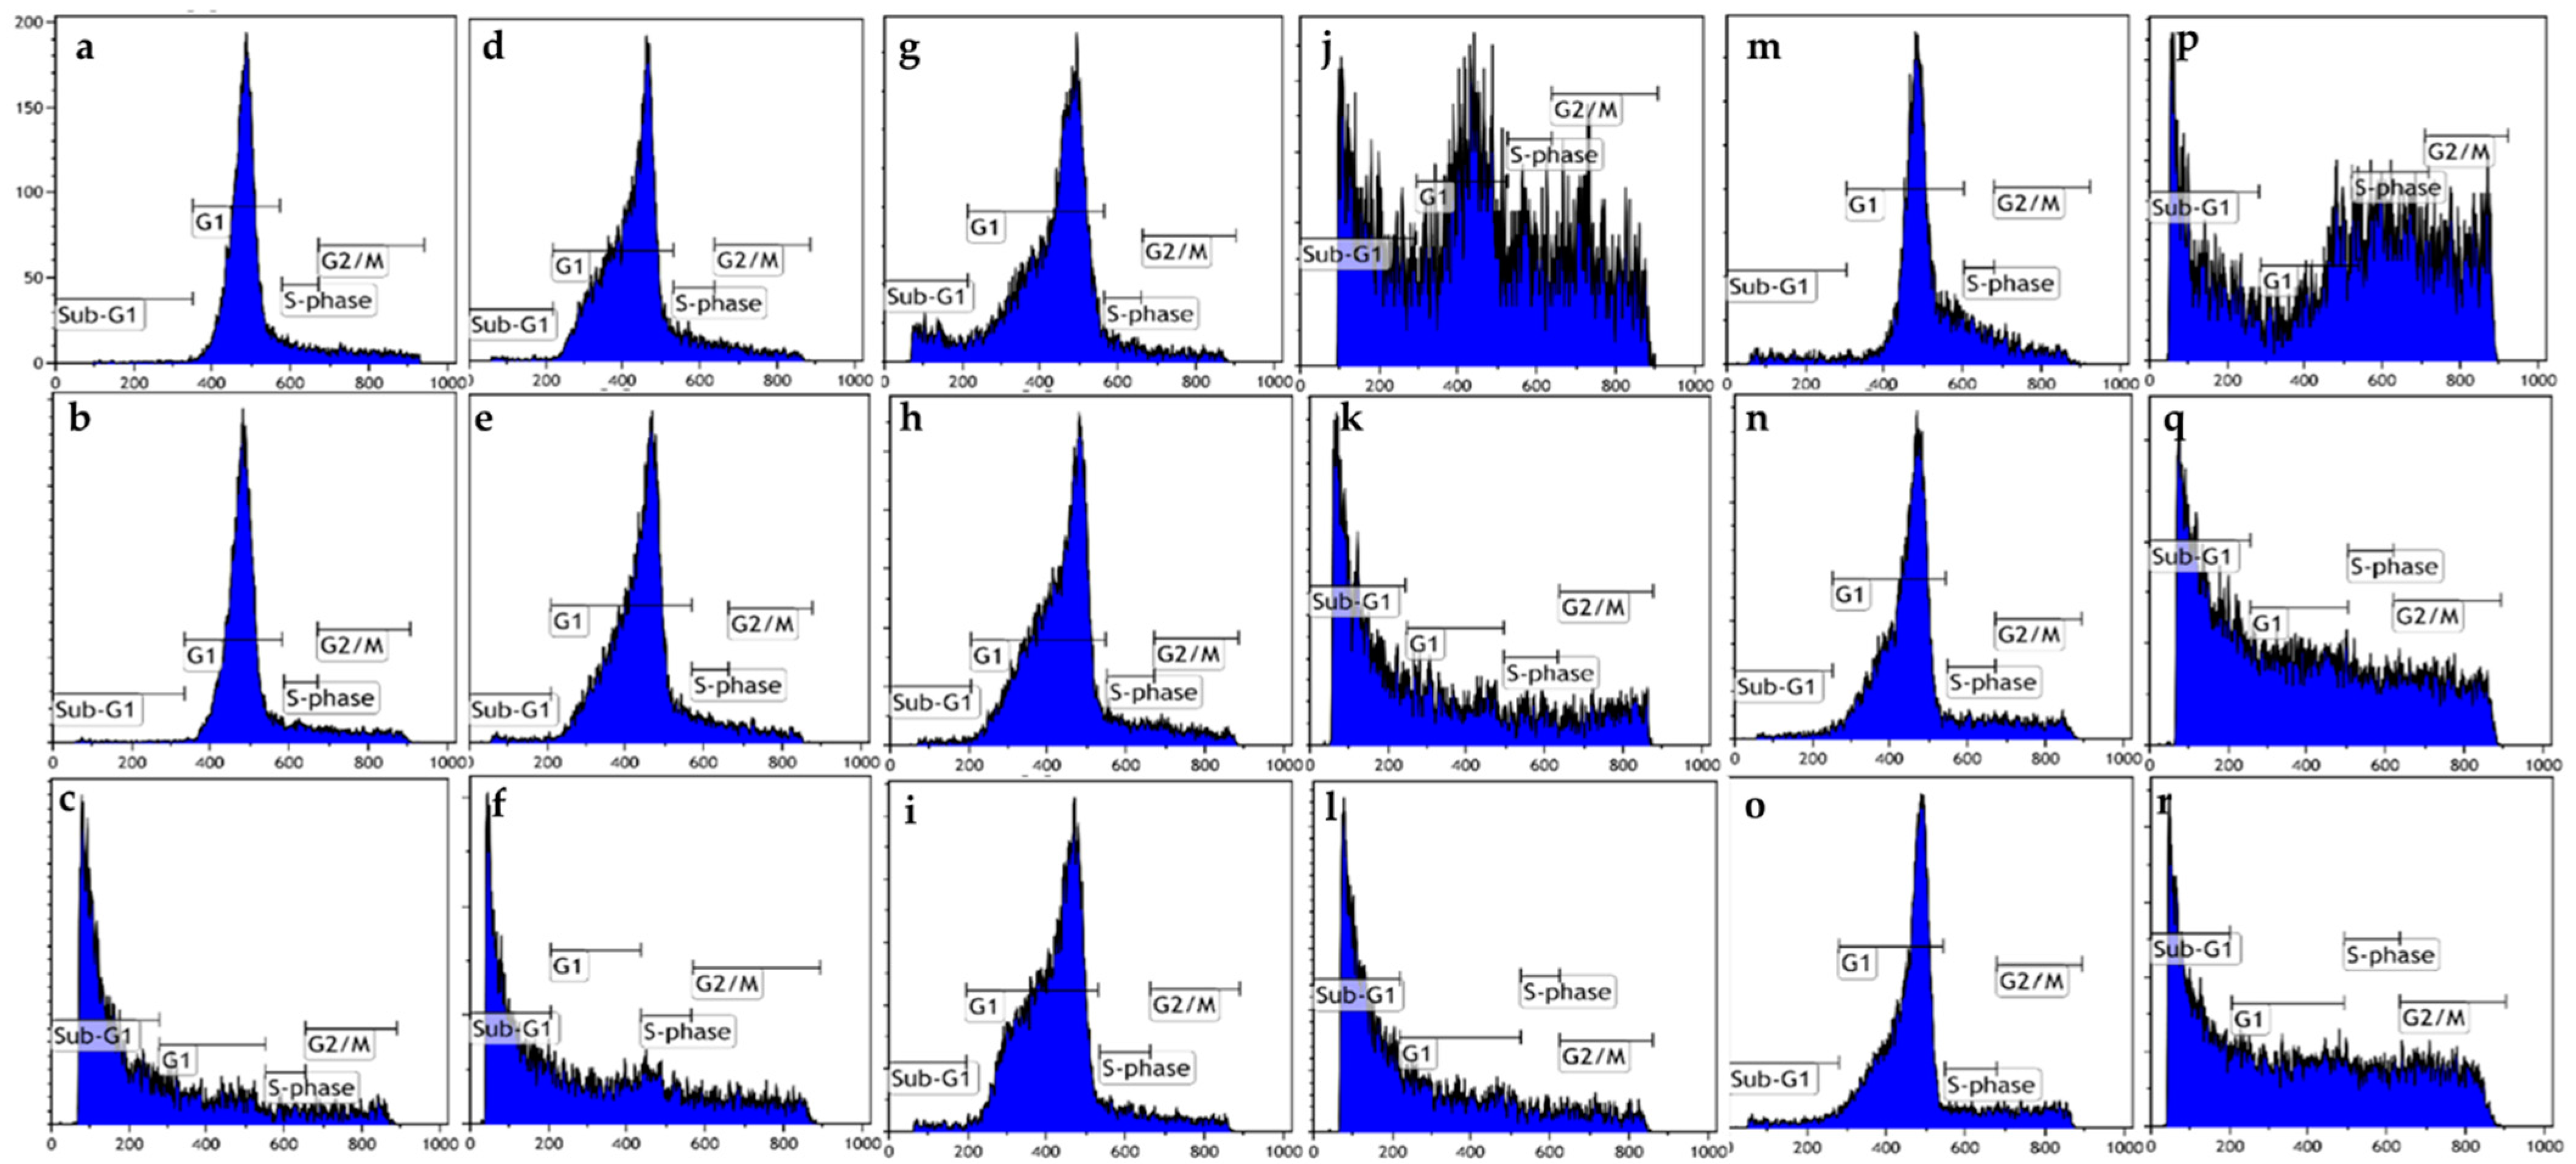
Figure 3.
Cell cycle progression graphs of MCF-7 and MDA-MB-231 cells exposed to ESE-one in the presence or absence of various scavengers of reactive oxygen species (tiron, trolox and DMTU) for 48 h. ESE-one exposure resulted in a significant increase in the percentage of cells occupying the sub-G1 phase in both MCF-7 and MDA-MB-231 cells. Tiron, trolox and DMTU exposure significantly decreased the number of cells occupying the sub-G1 phase in MCF-7 cells and tiron as well as DMTU exposure significantly decreased the number of cells present in the sub-G1 phase in MDA-MB-231 cells. Tiron, trolox and DMTU significantly decreased the number of cells in the G2/M phase in MDA-MB-231 cells and only tiron had a significant effect in MCF-7 cells. (a) MCF-7 cells cultured in complete growth medium, (b) vehicle-treated MCF-7 cells, (c) MCF-7 cells exposed to ESE-one only, (d) MDA-MB-231 cells cultured in complete growth medium, (e) vehicle-treated MDA-MB-231 cells, (f) MDA-MB-231 cells exposed to ESE-one, (g) MCF-7 cells exposed to tiron only, (h) MCF-7 cells exposed to trolox only, (i) MCF-7 cells exposed to DMTU only, (j) MCF-7 cells coexposed to tiron and ESE-one, (k) MCF-7 cells coexposed to trolox and ESE-one, (l) MCF-7 cells coexposed to DMTU and ESE-one, (m) MDA-MB-231 cells exposed to tiron only, (n) MDA-MB-231 cells exposed to trolox only, (o) MDA-MB-231 cells exposed to DMTU only, (p) MDA-MB-231 cells coexposed to tiron and ESE-one, (q) MDA-MB-231 cells coexposed to trolox and ESE-one, (r) MDA-MB-231 cells coexposed to DMTU and ESE-one.
![Molecules 26 00622 g003]()
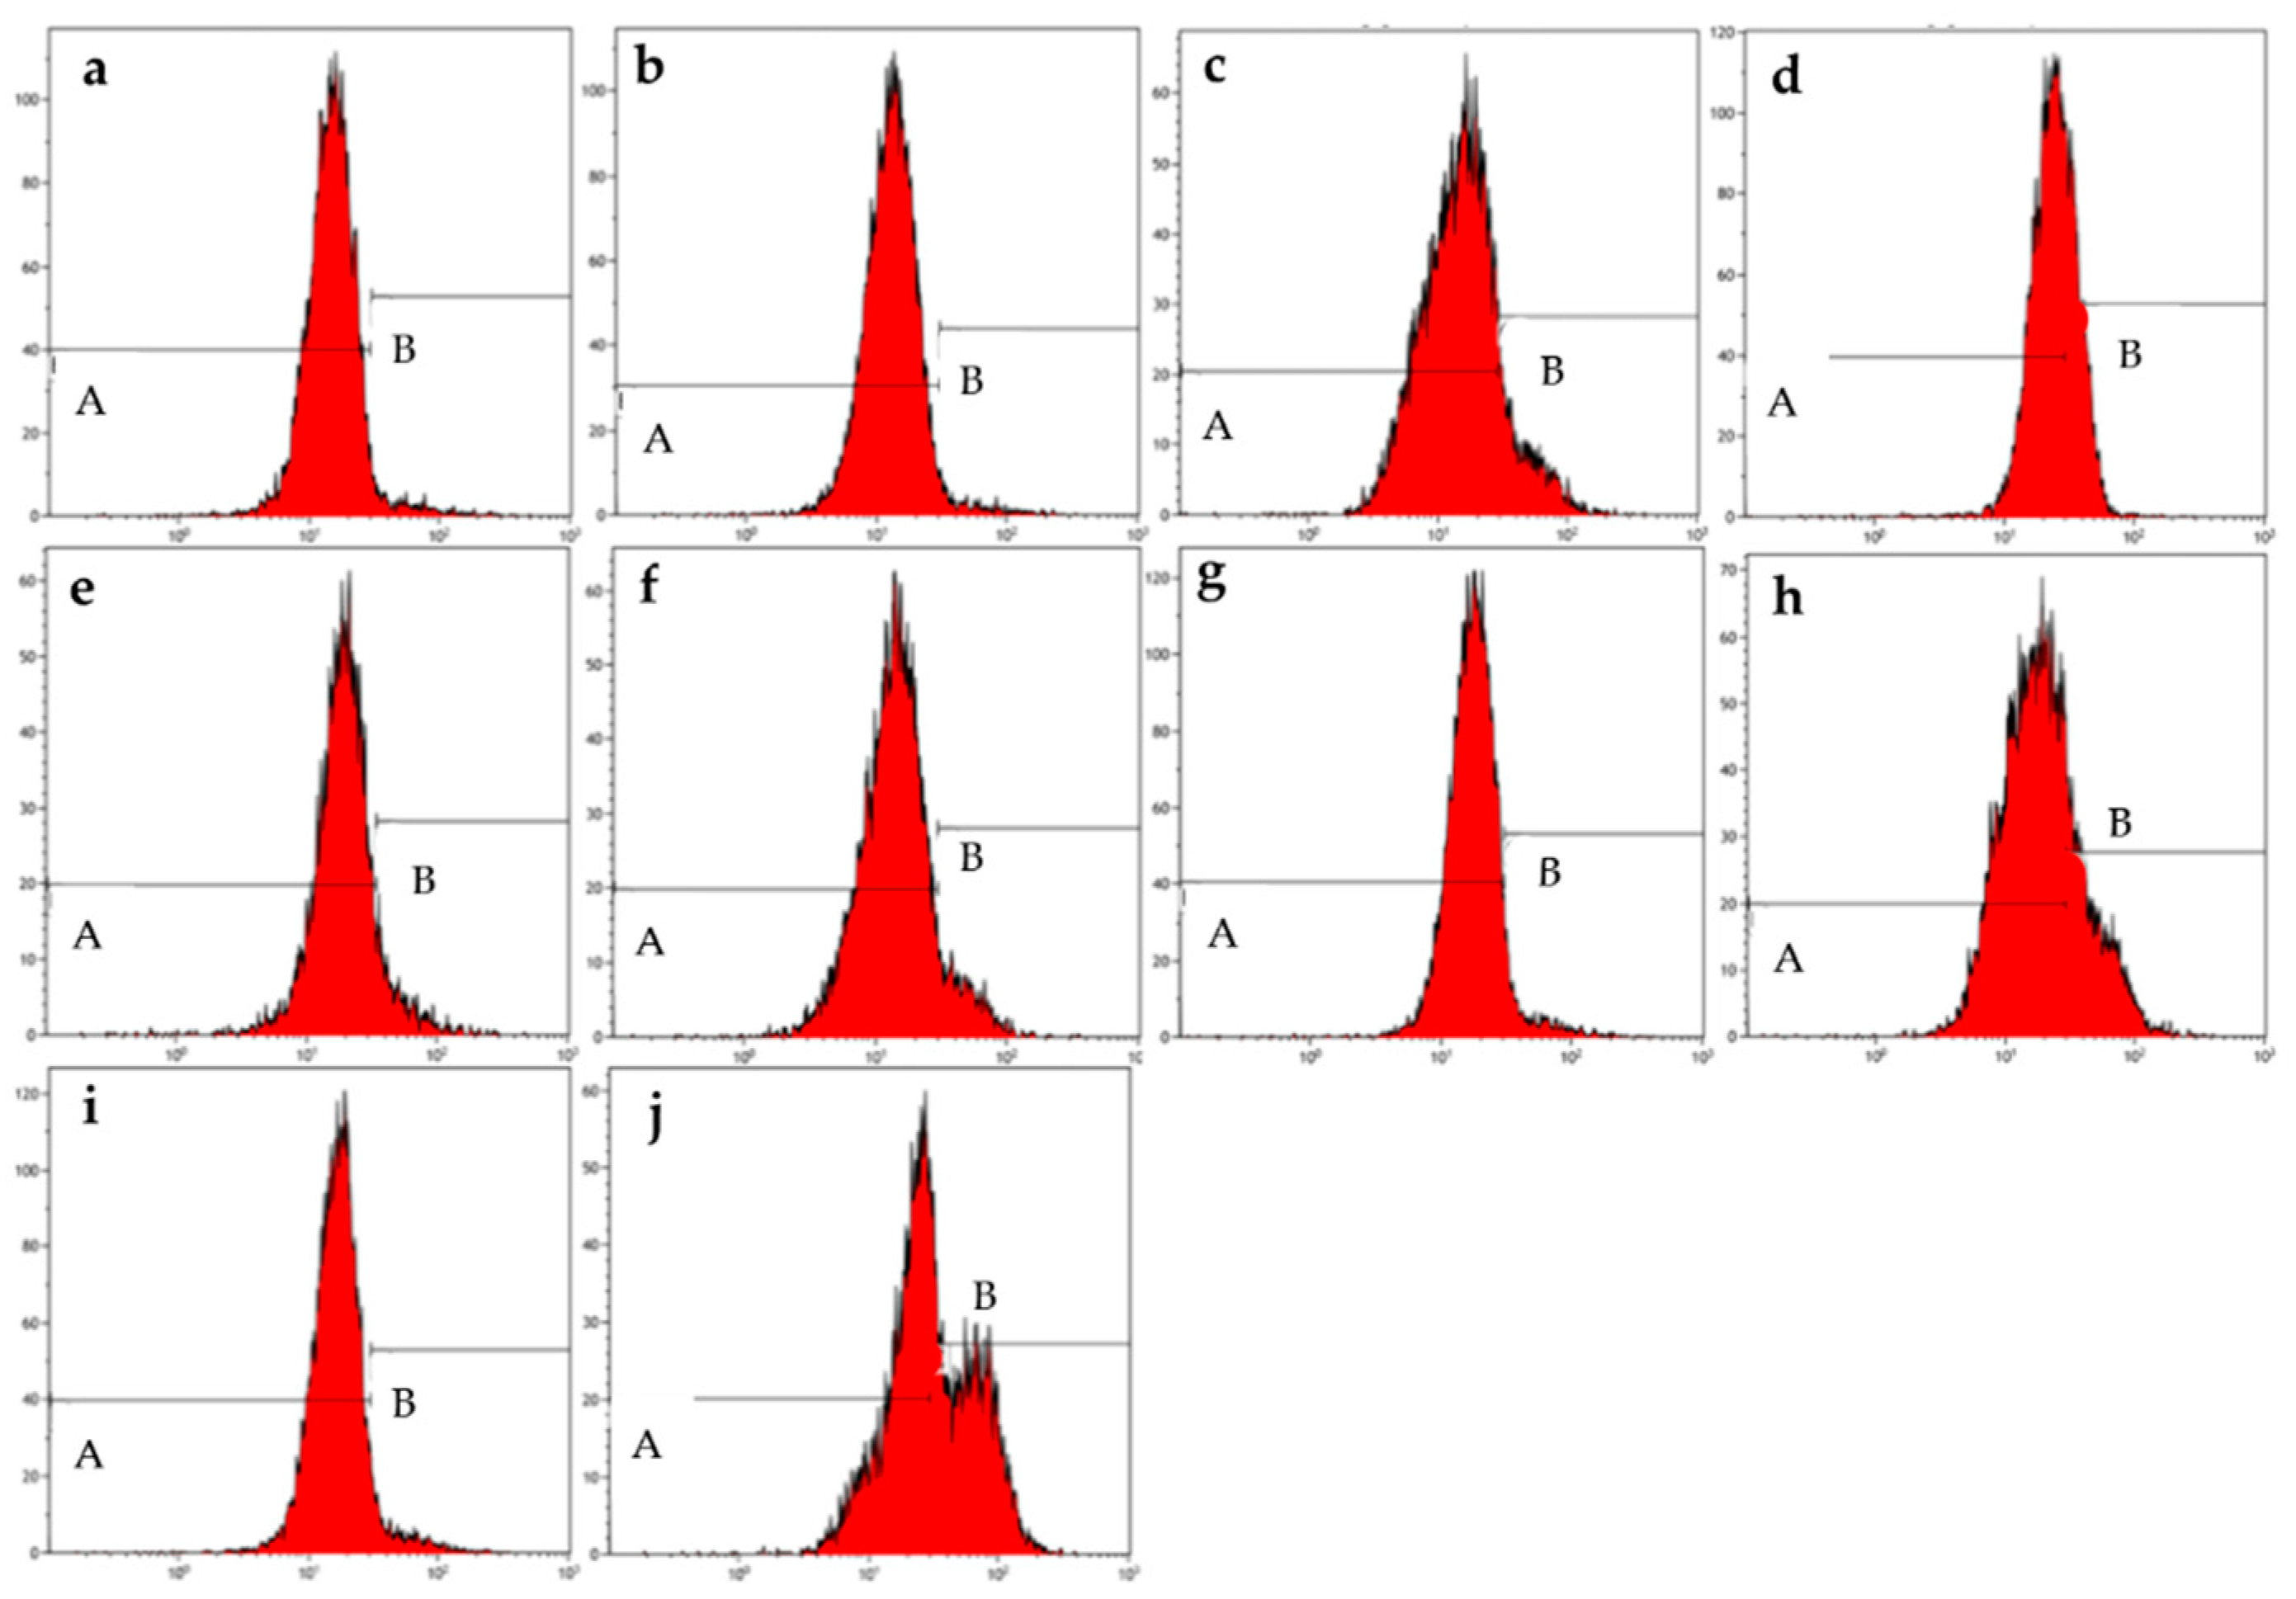
Figure 4.
Mitochondrial membrane graphs of MCF-7 cells treated with ESE-one in the presence or absence of several scavengers of reactive oxygen species (tiron, trolox and DMTU). ESE-one only exposure resulted in depolarization of the mitochondrial membrane potential in MCF-7 cells and tiron countered that effect significantly. A represents polarized cells and B represents depolarized cells. Trolox and DMTU did not have an opposing effect on the membrane depolarization exerted by ESE-one (A indicates polarized population and B indicates depolarized population). (a) Cells cultured in complete growth medium, (b) vehicle-treated cells, (c) cells exposed to ESE-one, (d) cells exposed to carbonyl cyanide 3-chlorophenylhydrazone (CCCP), (e) cells exposed to tiron only, (f) cells coexposed to tiron and ESE-one, (g) cells exposed to trolox only, (h) cells coexposed to trolox and ESE-one, (i) cells exposed to DMTU only, (j) cells coexposed to DMTU and ESE-one.
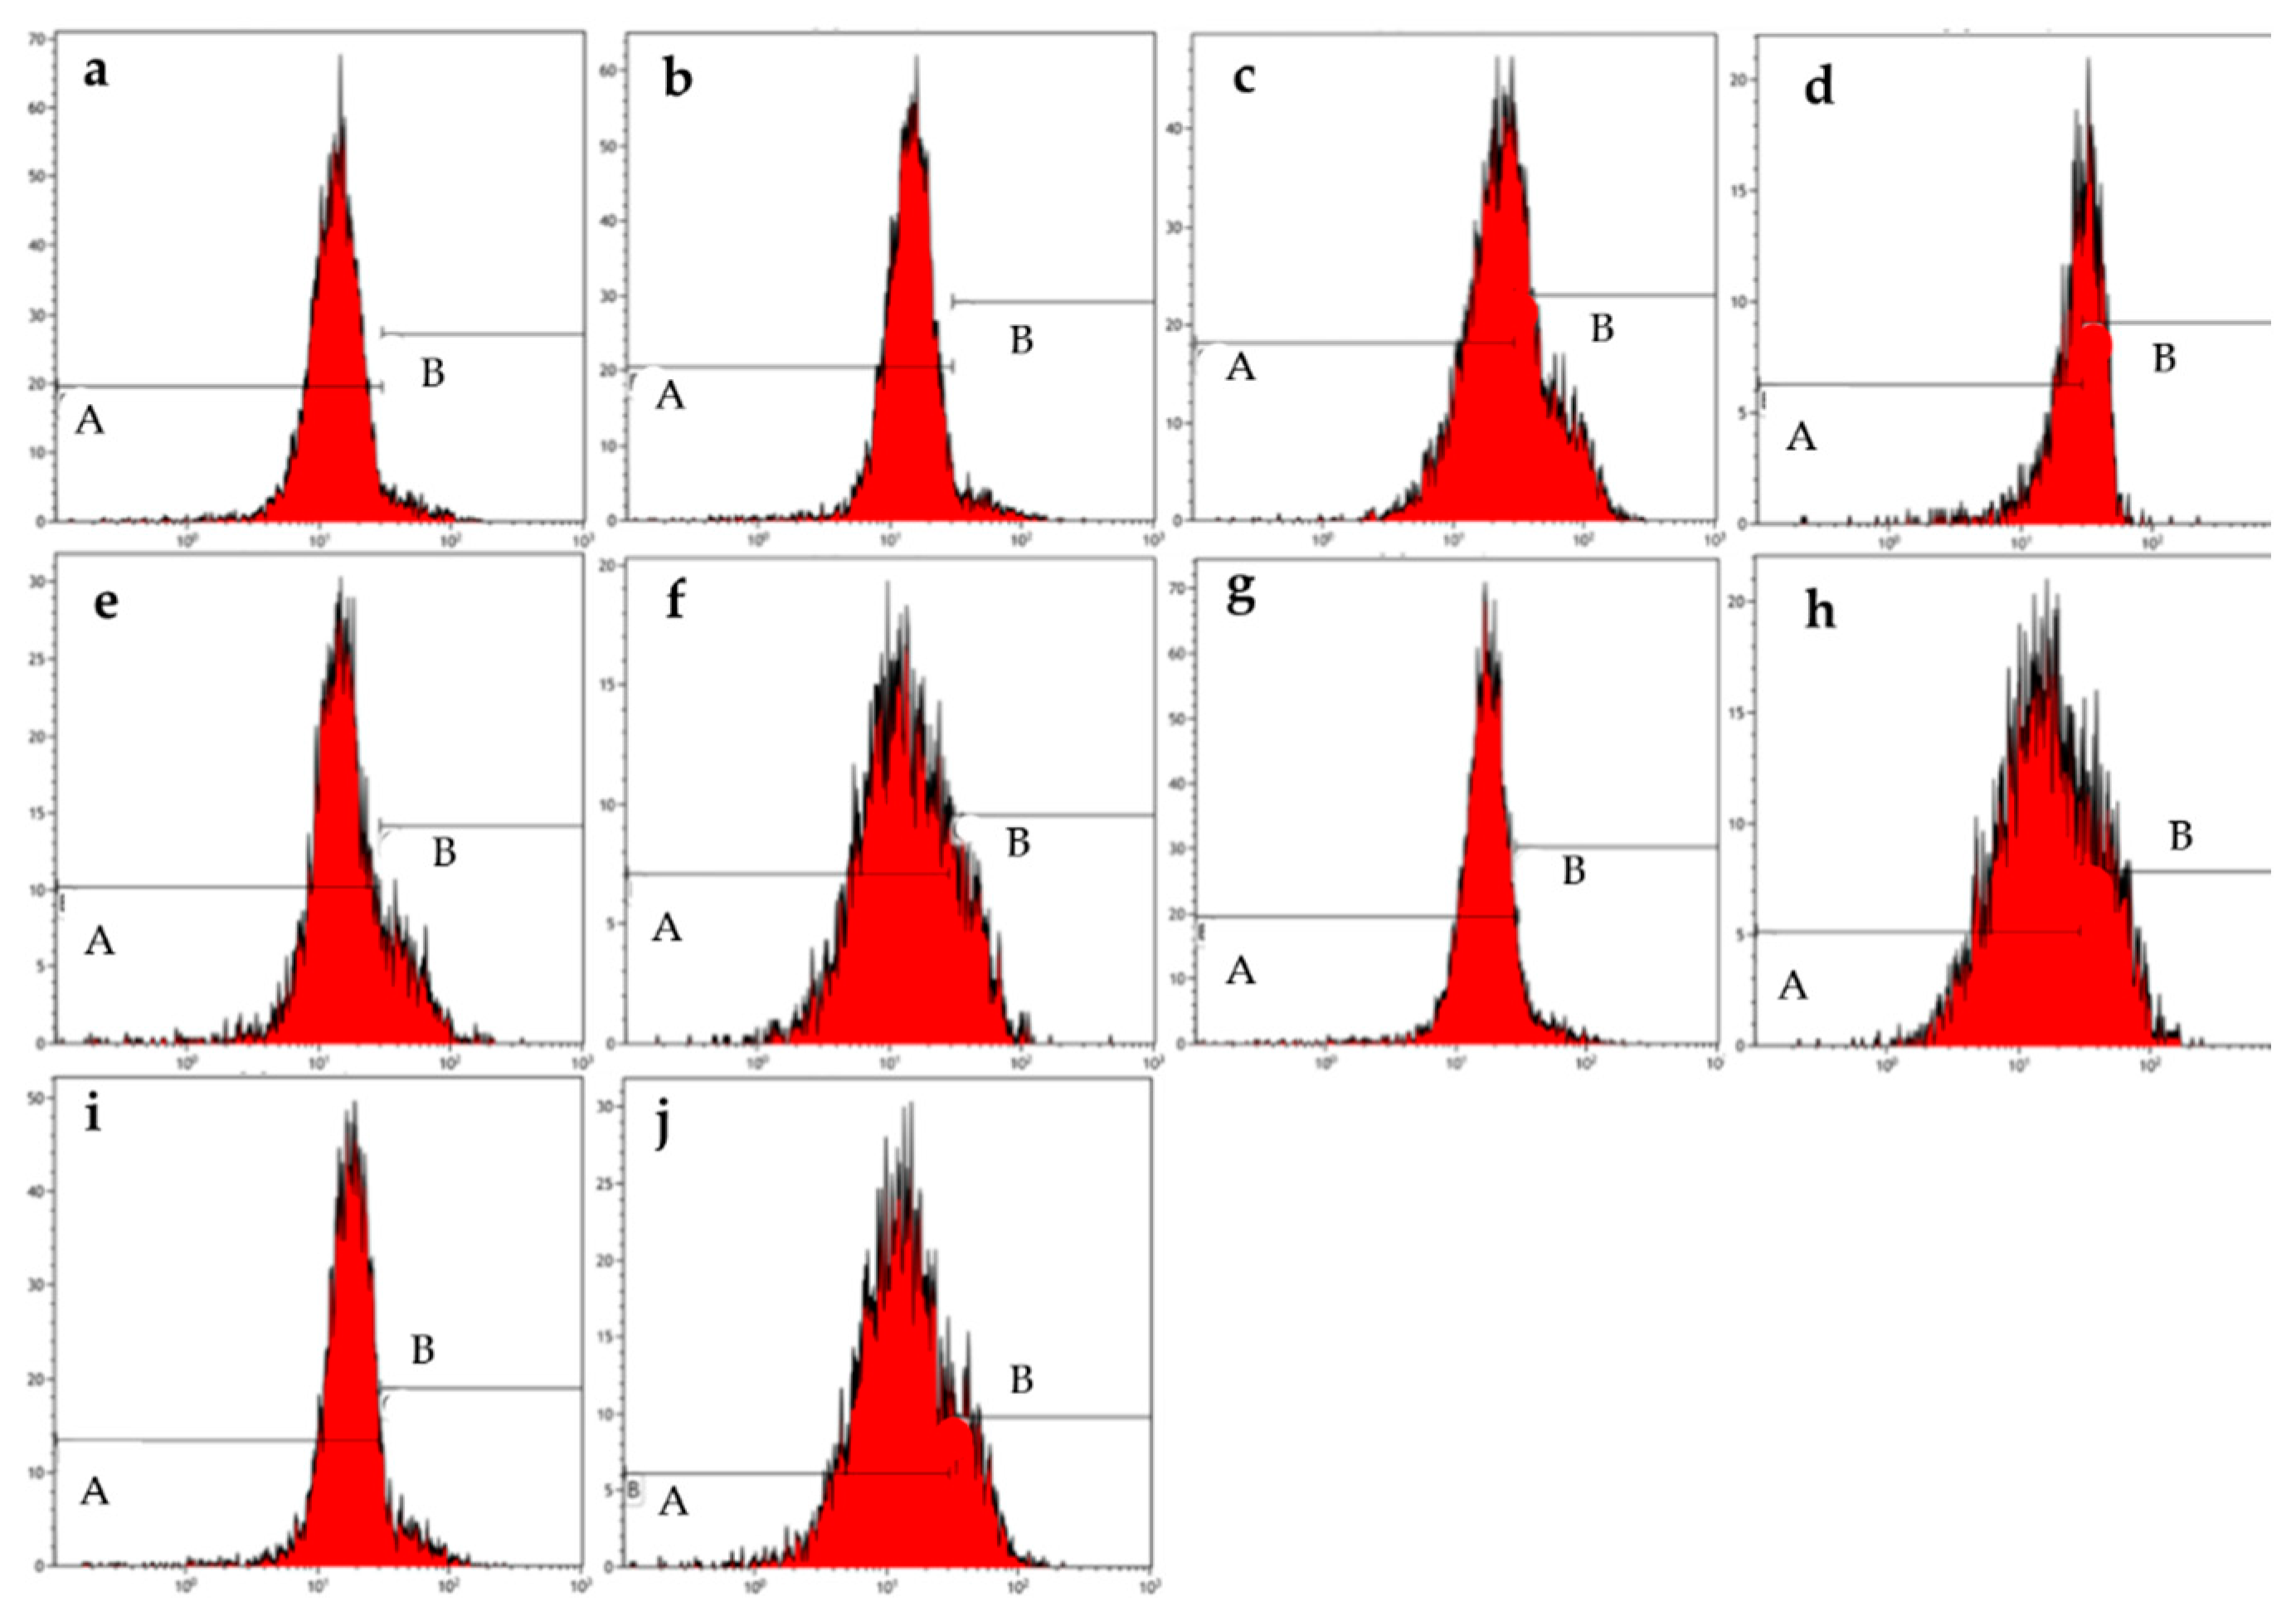
Figure 5.
Mitochondrial membrane graphs of MDA-MB-231 cells exposed to ESE-one in the presence or absence of several scavengers of reactive oxygen species (tiron, trolox and DMTU). ESE-one only exposure resulted in depolarization of the mitochondrial membrane potential in MDA-MB-231 cells and tiron exposure resulted in an insignificant decrease in membrane depolarization. A represents polarized cells and B represents depolarized cells. Trolox and DMTU did not have an opposing effect on the membrane depolarization exerted by ESE-one (A indicates polarized population and B indicates depolarized population). (a) Cells cultured in complete growth medium, (b) vehicle-treated cells, (c) cells exposed to ESE-one, (d) cells exposed to carbonyl cyanide 3-chlorophenylhydrazone (CCCP), (e) cells exposed to tiron only, (f) cells coexposed to tiron and ESE-one, (g) cells exposed to trolox only, (h) cells coexposed to trolox and ESE-one, (i) cells exposed to DMTU only, (j) cells coexposed to DMTU and ESE-one.
![Molecules 26 00622 g005]()
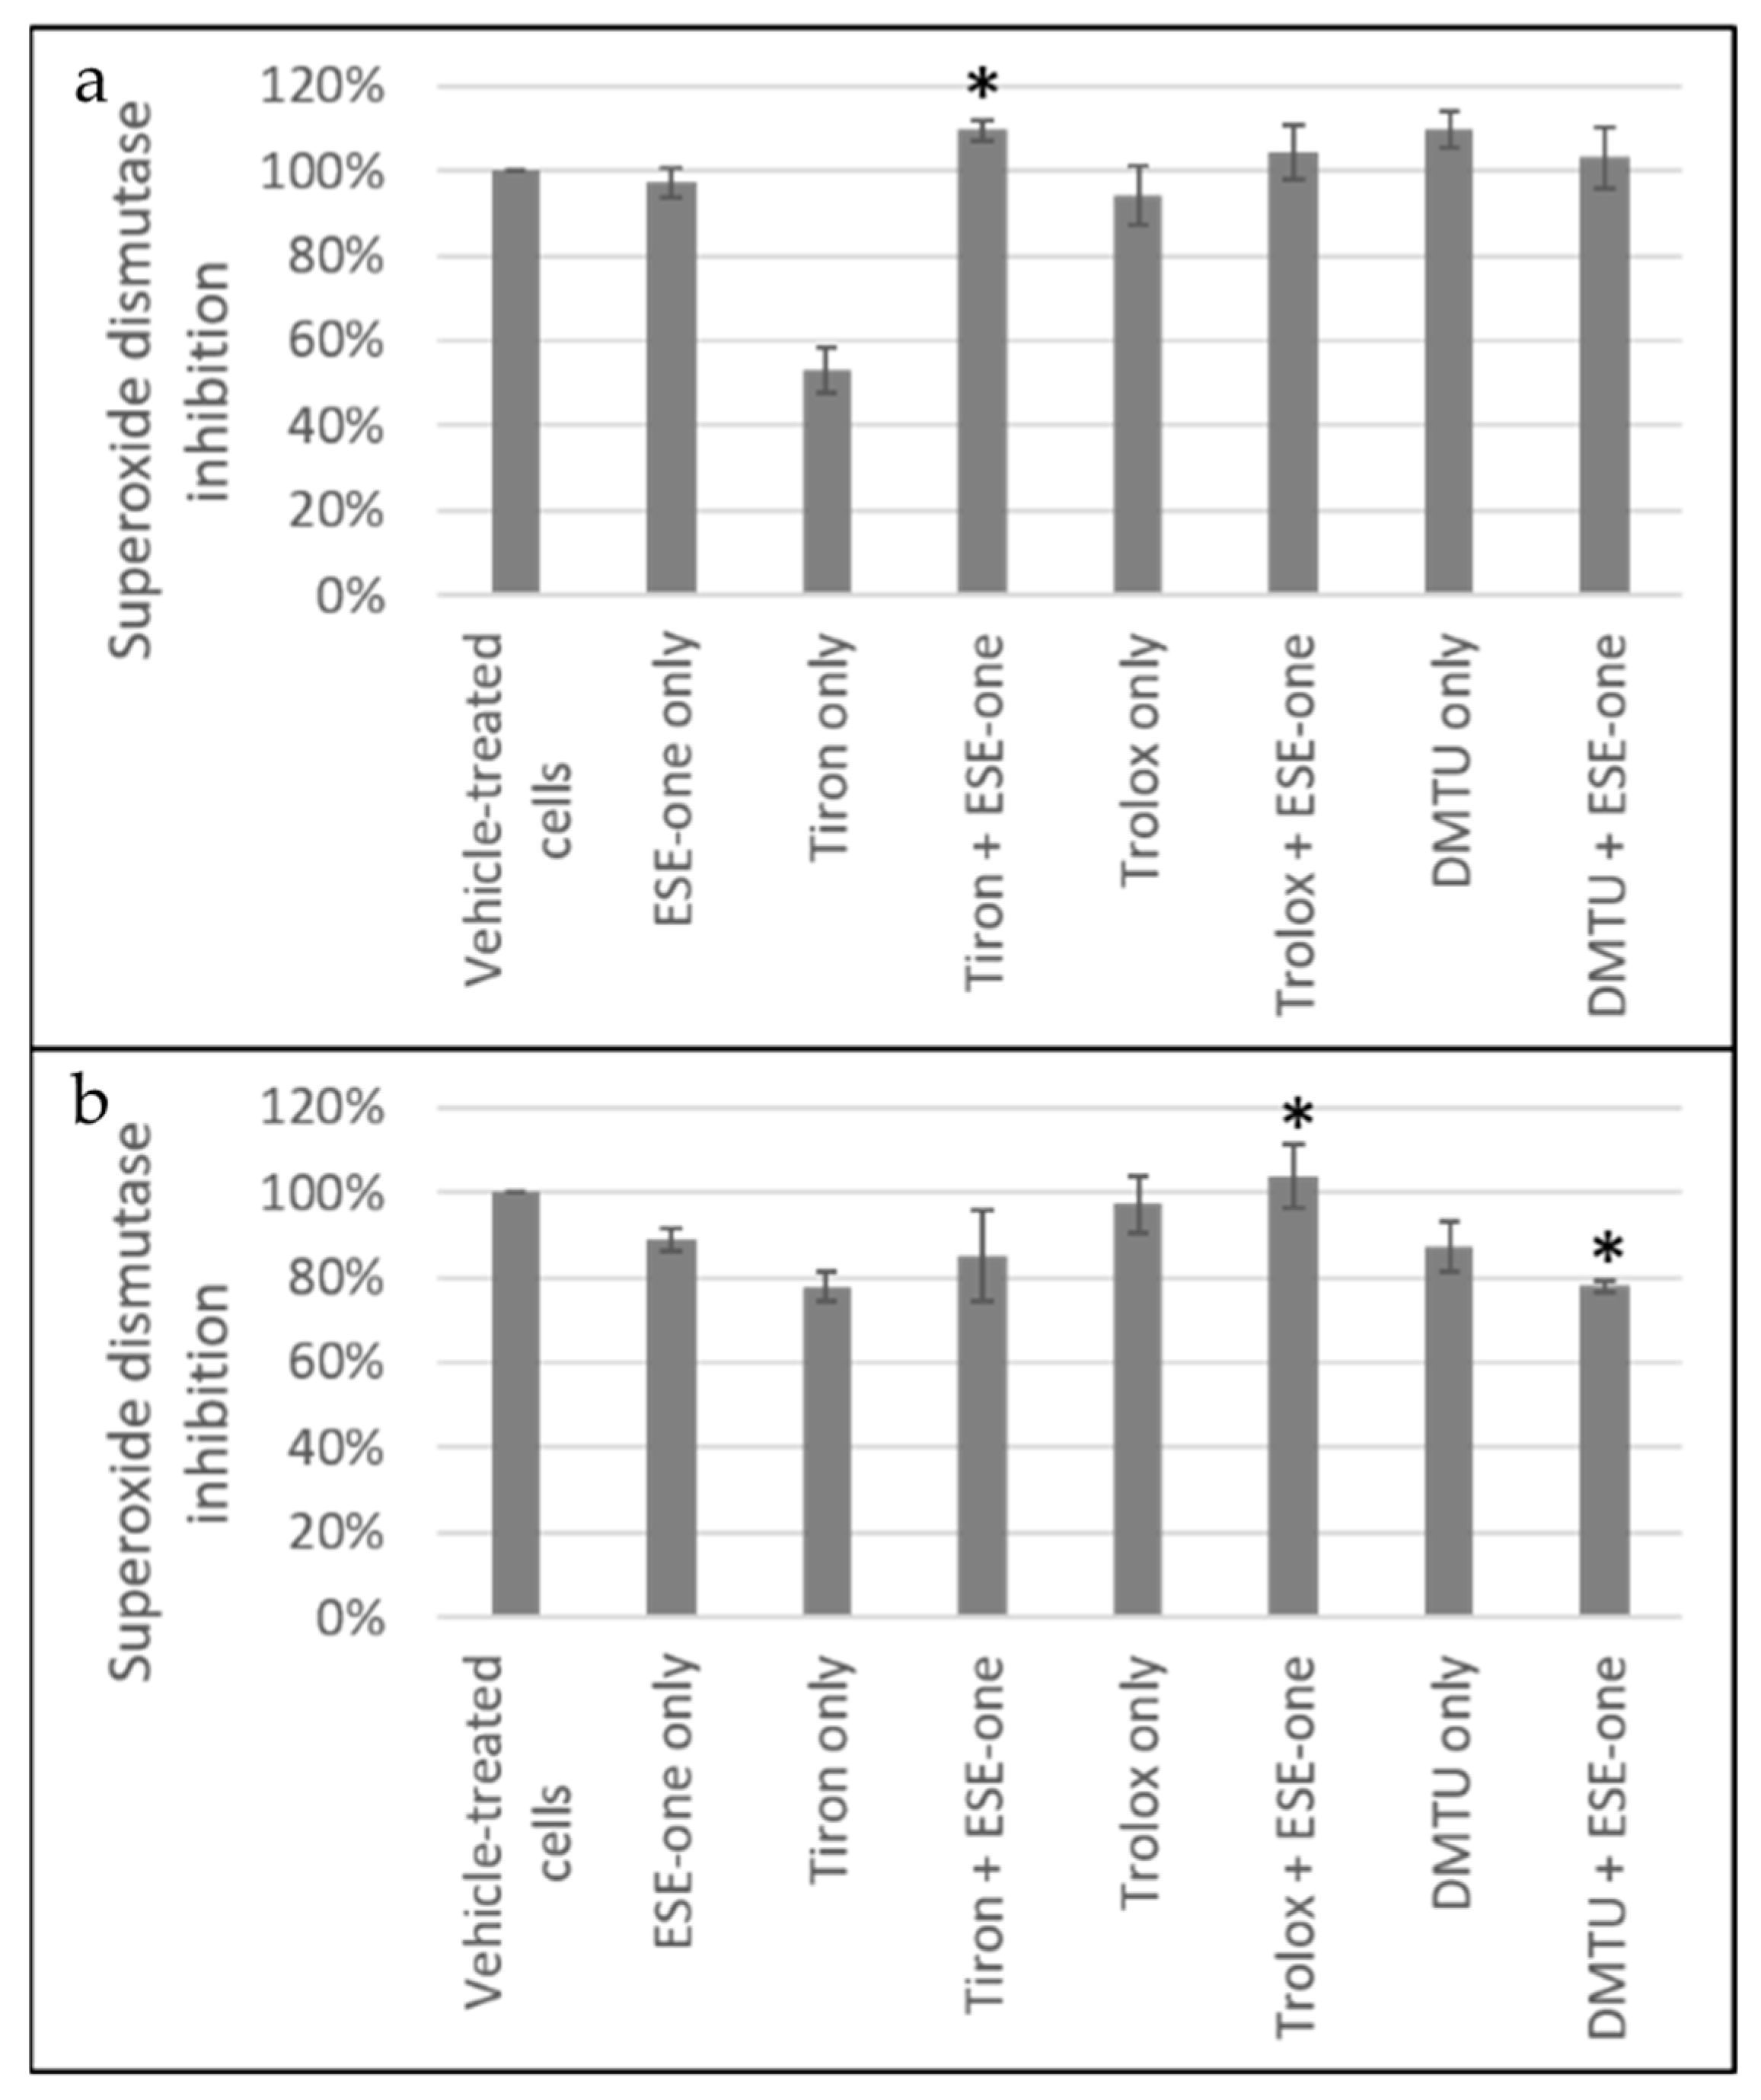
Figure 6.
SOD inhibition graphs of (a) MCF-7 and (b) MDA-MB-231 cells exposed to ESE-one in the presence or absence of scavengers of reactive oxygen species (tiron, trolox and DMTU). Tiron, trolox and DMTU coexposure with ESE-one resulted in an increased SOD inhibition percentage compared to ESE-one only exposure in MCF-7 cells suggesting that increased generation of reactive oxygen species due to ESE-one exposure is not required for the inhibition of SOD. In MDA-MB-231, DMTU demonstrated a decrease in SOD inhibition percentage suggesting that hydrogen peroxide affects the superoxide anion activity. (a) MCF-7, (b) MDA-MB-231. An asterisk (*) indicates p-value (p < 0.05) compared to ESE-one treated cells.
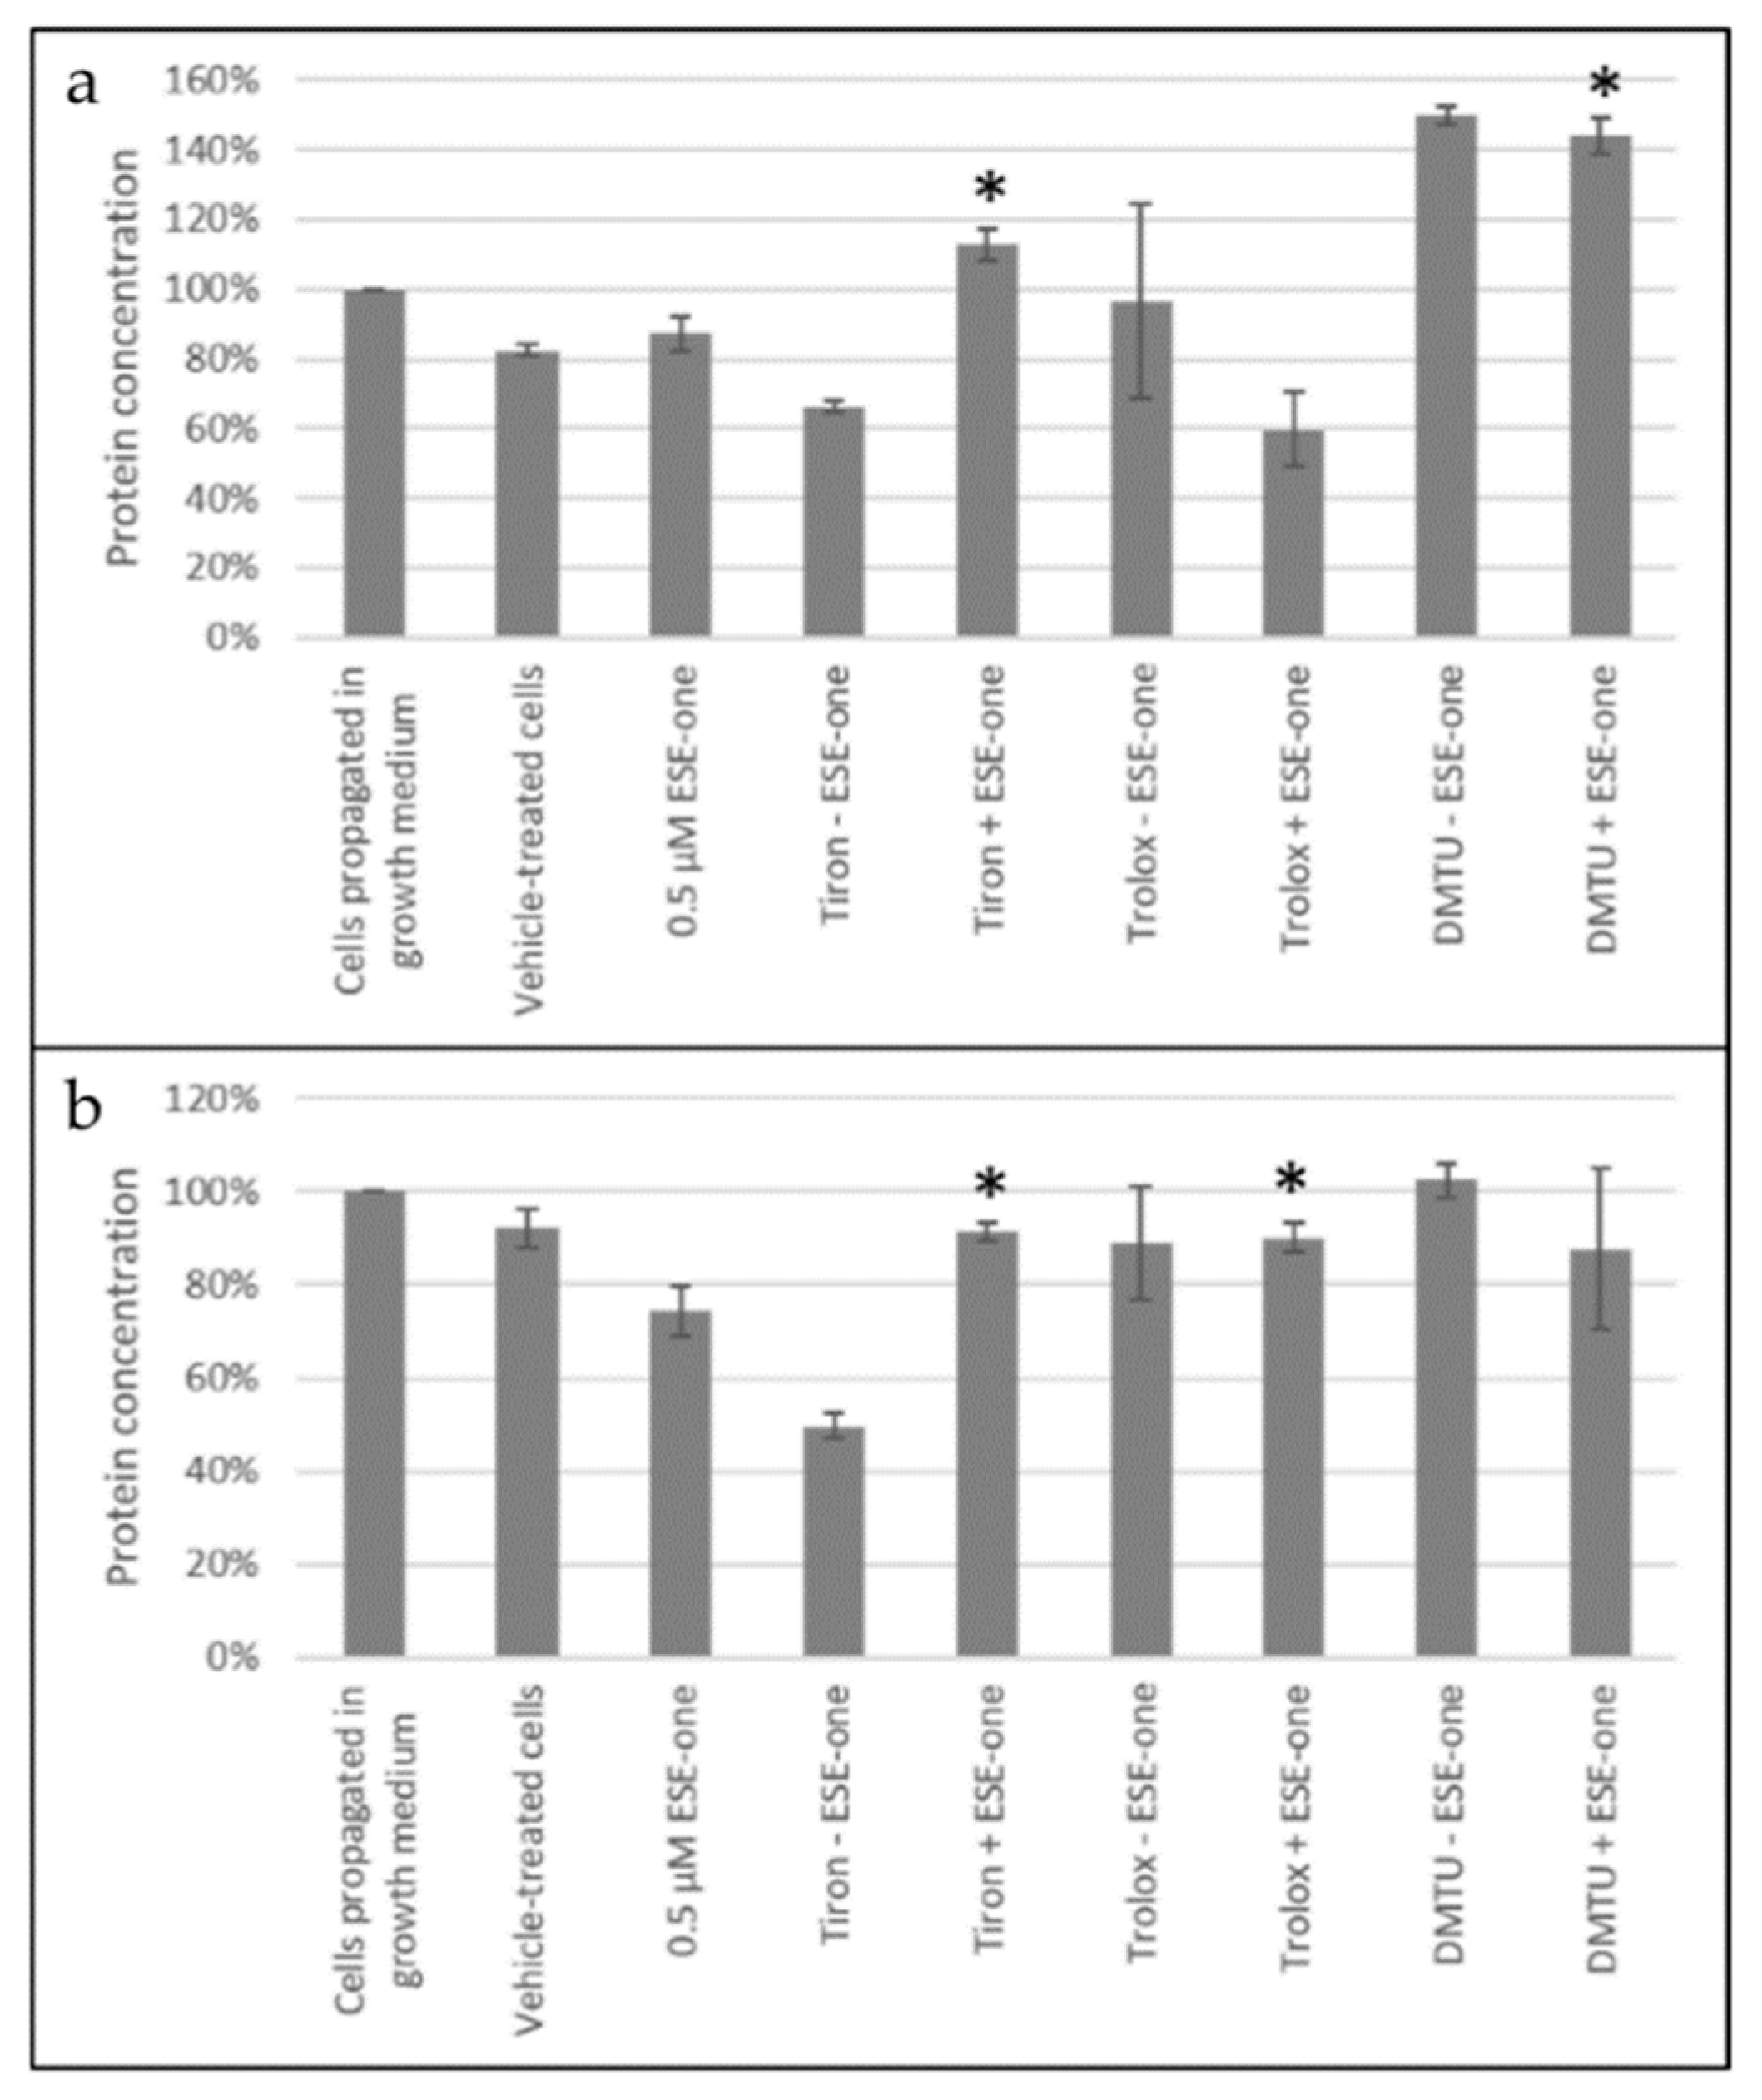
Figure 7.
Catalase activity graphs of MCF-7 and MDA-MB-231 cells exposed to ESE-one in the presence or absence of scavengers of reactive oxygen species (tiron, trolox and DMTU). Tiron and DMTU coexposure with ESE-one increased the catalase protein concentration significantly in MCF-7 cells and in MDA-MB-231 cells, tiron and trolox induced a significant increase in catalase protein concentration. (a) MCF-7, (b) MDA-MB-231. An asterisk (*) indicates p-value (p < 0.05) compared to ESE-one treated cells.
Table 1.
Percentage of MCF-7 cells occupying each cell cycle phase as determined by means of flow cytometry using propidium iodide after 24 h exposure. An asterisk (*) indicates p-value (p < 0.05) compared to ESE-one treated cells.
Table 1.
Percentage of MCF-7 cells occupying each cell cycle phase as determined by means of flow cytometry using propidium iodide after 24 h exposure. An asterisk (*) indicates p-value (p < 0.05) compared to ESE-one treated cells.
| MCF-7 24 h Exposure |
|---|
| | Sub-G1 | G1 | S-Phase | G2/M |
|---|
| Cells cultured in complete growth medium | 1.82 ± 0.16 | 68.98 ± 0.12 | 11.8 ± 1.79 | 18.19 ± 0.59 |
| Vehicle-treated cells | 1.68 ± 0.13 | 63.7 ± 2.46 | 11.59 ± 1.71 | 22.59 ± 0.14 |
| ESE-one only | 17.23 ± 2.65 | 23.83 ± 0.83 | 11.61 ± 0.96 | 47.82 ± 3.44 |
| Tiron − ESE-one | 2.45 ± 0.65 | 74.16 ± 2.83 | 8.62 ± 1.14 | 14.13 ± 1.97 |
| Tiron + ESE-one | 13.47 ± 2.5 | 50.52 ± 3.64 | 12.97 ± 3.27 | 16.94 ± 1.13 * |
| Trolox − ESE-one | 1.52 ± 0.40 | 62.83 ± 1.81 | 11.45 ± 1.23 | 24.44 ± 2.33 |
| Trolox + ESE-one | 23.68 ± 3.49 | 31.57 ± 3.30 | 13.13 ± 2.05 | 23.89 ± 3.84 * |
| DMTU − ESE-one | 3.42 ± 1.02 | 69.09 ± 1.85 | 11.11 ± 1.33 | 17.68 ± 1.24 |
| DMTU + ESE-one | 10.65 ± 1.42 | 28.61 ± 1.13 | 12.0 ± 0.69 | 49.11 ± 0.82 |
Table 2.
Percentage of MDA-MB-231 cells occupying each cell cycle phase as determined by means of flow cytometry using propidium iodide after 24 h exposure. An asterisk (*) indicates p-value (p < 0.05) compared to ESE-one treated cells.
Table 2.
Percentage of MDA-MB-231 cells occupying each cell cycle phase as determined by means of flow cytometry using propidium iodide after 24 h exposure. An asterisk (*) indicates p-value (p < 0.05) compared to ESE-one treated cells.
| MDA-MB-231 24 h Exposure |
|---|
| | Sub-G1 | G1 | S-Phase | G2/M |
|---|
| Cells cultured in complete growth medium | 0.50 ± 0.14 | 67.79 ± 0.23 | 11.45 ± 0.39 | 20.15 ± 0.52 |
| Vehicle-treated cells | 0.58 ± 0.11 | 68.10 ± 2.14 | 12.71 ± 2.20 | 18.51 ± 1.71 |
| ESE-one only | 25.72 ± 1.62 | 7.57 ± 1.33 | 8.18 ± 1.62 | 59.0. ± 4.62 |
| Tiron − ESE-one | 3.45 ± 0.88 | 71.57 ± 3.90 | 9.85 ± 1.45 | 13.42 ± 1.80 |
| Tiron + ESE-one | 15.21 ± 1.57 * | 28.25 ± 2.44 | 17.50 ± 2.19 | 41.99 ± 1.76 * |
| Trolox − ESE-one | 2.68 ± 0.87 | 71.76 ± 3.95 | 6.67 ± 0.87 | 22.13 ± 1.37 |
| Trolox + ESE-one | 27.48 ± 2.56 | 16.95 ± 1.29 | 6.94 ± 1.02 | 42.98 ± 1.69 * |
| DMTU − ESE-one | 3.07 ± 1.11 | 62.76 ± 2.96 | 11.23 ± 1.05 | 21.60 ± 0.55 |
| DMTU + ESE-one | 15.73 ± 2.18 * | 12.26 ± 0.81 | 8.35 ± 0.21 | 56.55 ± 4.21 |
Table 3.
Percentage of MCF-7 cells occupying each cell cycle phase as determined by means of flow cytometry using propidium iodide after 48 h exposure. An asterisk (*) indicates p-value (p < 0.05) compared to ESE-one treated cells.
Table 3.
Percentage of MCF-7 cells occupying each cell cycle phase as determined by means of flow cytometry using propidium iodide after 48 h exposure. An asterisk (*) indicates p-value (p < 0.05) compared to ESE-one treated cells.
| MCF-7 48 h Exposure |
|---|
| | Sub-G1 | G1 | S-Phase | G2/M |
|---|
| Cells cultured in complete growth medium | 1.31 ± 0.08 | 83.55 ± 2.14 | 5.68 ± 0.30 | 11.5 ± 1.68 |
| Vehicle-treated cells | 1.32 ± 0.11 | 84.69 ± 0.82 | 5.55 ± 0.67 | 8.73 ± 0.55 |
| ESE-one only | 65.30 ± 0.28 | 22.57 ± 0.86 | 4.18 ± 0.04 | 7.81 ± 0.59 |
| Tiron − ESE-one | 8.27 ± 0.11 | 83.77 ± 0.35 | 3.85 ± 0.42 | 3.58 ± 0.45 |
| Tiron + ESE-one | 28.27 ± 1.31 * | 34.77 ± 1.65 | 12.08 ± 1.27 | 23.52 ± 1.51 * |
| Trolox − ESE-one | 1.17 ± 0.01 | 67.94 ± 0.00 | 6.14 ± 0.52 | 20.76 ± 0.34 |
| Trolox + ESE-one | 54.80 ± 3.69 * | 23.03 ± 0.65 | 8.66 ± 0.42 | 14.39 ± 2.48 |
| DMTU − ESE-one | 1.77 ± 0.01 | 87.05 ± 0.40 | 7.15 ± 0.52 | 5.47 ± 1.18 |
| DMTU + ESE-one | 46.81 ± 0.84 * | 24.53 ± 0.98 | 5.63 ± 0.37 | 11.63 ± 1.97 |
Table 4.
Percentage of MDA-MB-231 cells occupying each cell cycle phase as determined by means of flow cytometry using propidium iodide after 48 h exposure. An asterisk (*) indicates p-value (p < 0.05) compared to ESE-one treated cells.
Table 4.
Percentage of MDA-MB-231 cells occupying each cell cycle phase as determined by means of flow cytometry using propidium iodide after 48 h exposure. An asterisk (*) indicates p-value (p < 0.05) compared to ESE-one treated cells.
| MDA-MB-231 48 h Exposure |
|---|
| | Sub-G1 | G1 | S-Phase | G2/M |
|---|
| Cells cultured in complete growth medium | 0.80 ± 0.16 | 78.09 ± 0.07 | 6.32 ± 0.19 | 13.09 ± 0.75 |
| Vehicle-treated cells | 1.28 ± 0.28 | 76.34 ± 4.69 | 6.65 ± 2.21 | 11.96 ± 1.3 |
| ESE-one only | 52.1 ± 8.36 | 23.82 ± 0.39 | 5.76 ± 1.04 | 11.76 ± 0.67 |
| Tiron − ESE-one | 4.12 ± 1.55 | 80.66 ± 4.18 | 4.61 ± 0.87 | 4.55 ± 0.71 |
| Tiron + ESE-one | 29.4 ± 2.59 * | 48.8 ± 8.24 | 5.92 ± 2.40 | 27.28 ± 5.71 * |
| Trolox − ESE-one | 2.15 ± 0.69 | 80.71 ± 1.40 | 7.19 ± 1.42 | 10.59 ± 1.42 |
| Trolox + ESE-one | 39.51 ± 0.35 * | 28.16 ± 0.22 | 10.28 ± 0.35 | 23.56 ± 3.16 |
| DMTU − ESE-one | 0.96 ± 0.08 | 79.96 ± 1.10 | 7.39 ± 1.92 | 13.13 ± 1.31 |
| DMTU + ESE-one | 32.48 ± 2.09 * | 30.86 ± 0.04 | 10.28 ± 2.89 | 20.61 ± 0.16 |
Table 5.
Percentage of MCF-7 cell polarity of the mitochondrial membrane potential as determined by means of flow cytometry. An asterisk (*) indicates p-value (p < 0.05) compared to ESE-one treated cells.
Table 5.
Percentage of MCF-7 cell polarity of the mitochondrial membrane potential as determined by means of flow cytometry. An asterisk (*) indicates p-value (p < 0.05) compared to ESE-one treated cells.
| MCF-7 Cells |
|---|
| | Polarized | Depolarized |
|---|
| Cells cultured in complete growth medium | 97.2 ± 1.7 | 2.6 ± 1.5 |
| Vehicle-treated cells | 97.8 ± 1.1 | 2.2 ± 1.1 |
| ESE-one only | 85.4 ± 0.2 | 14.6 ± 0.2 |
| CCCP | 67.0 ± 1.2 * | 33.0 ± 1.2 * |
| Tiron − ESE-one | 93.7 ± 1.0 | 6.0 ± 1.0 |
| Tiron + ESE-one | 90.6 ± 1.0 * | 9.3 ± 1.0 * |
| Trolox − ESE-one | 96.6 ± 1.0 | 3.3 ± 1.0 |
| Trolox + ESE-one | 80.7 ± 6.1 | 19.3 ± 6.1 |
| DMTU − ESE-one | 97.6 ± 1.2 | 2.4 ± 1.2 |
| DMTU + ESE-one | 84.2 ± 4.0 | 15.8 ± 4.1 |
Table 6.
Percentage of MDA-MB-231 cell polarity of the mitochondrial membrane potential as determined by means of flow cytometry. An asterisk (*) indicates p-value (p < 0.05) compared to ESE-one treated cells.
Table 6.
Percentage of MDA-MB-231 cell polarity of the mitochondrial membrane potential as determined by means of flow cytometry. An asterisk (*) indicates p-value (p < 0.05) compared to ESE-one treated cells.
| MDA-MB-231 Cells |
|---|
| | Polarized | Depolarized |
|---|
| Cells cultured in complete growth medium | 96.7 ± 2.3 | 2.9 ± 1.9 |
| Vehicle-treated cells | 96.0 ± 1.7 | 3.8 ± 1.8 |
| ESE-one only | 75.8 ± 8.0 | 24.1 ± 8.1 |
| CCCP | 64.4 ± 16.8 | 35.6 ± 16.5 |
| Tiron − ESE-one | 97.1 ± 2.4 | 2.8 ± 2.5 |
| Tiron + ESE-one | 78.0 ± 3.4 | 21.6 ± 3.9 |
| Trolox − ESE-one | 93.7 ± 2.2 | 6.7 ± 3.1 |
| Trolox + ESE-one | 71.1 ± 4.5 | 28.8 ± 4.5 |
| DMTU − ESE-one | 71.6 ± 3.5 | 8.0 ± 3.2 |
| DMTU + ESE-one | 58.5 ± 1.3 * | 41.4 ± 1.5 * |


