
Characterisation of Engineered Nanomaterials in Nano-Enabled Products Exhibiting Priority Environmental Exposure


Abstract
:1. Introduction
2. Materials and Methods
2.1. Selection of NEPs
2.1.1. Characterisation of ENMs
2.1.2. Pre-Treatment of NEPs’ Samples
Sample Pre-Treatment for SUN1–5, LB1
Sample Pre-Treatment for CA1–2
Sample Pre-Treatment for CM1
Sample Pre-Treatment for SAN3, and SK1
2.1.3. Elemental Quantification of NEPs
2.1.4. Data Analysis
3. Results and Discussion
3.1. Characterisation of ENMs in NEPs
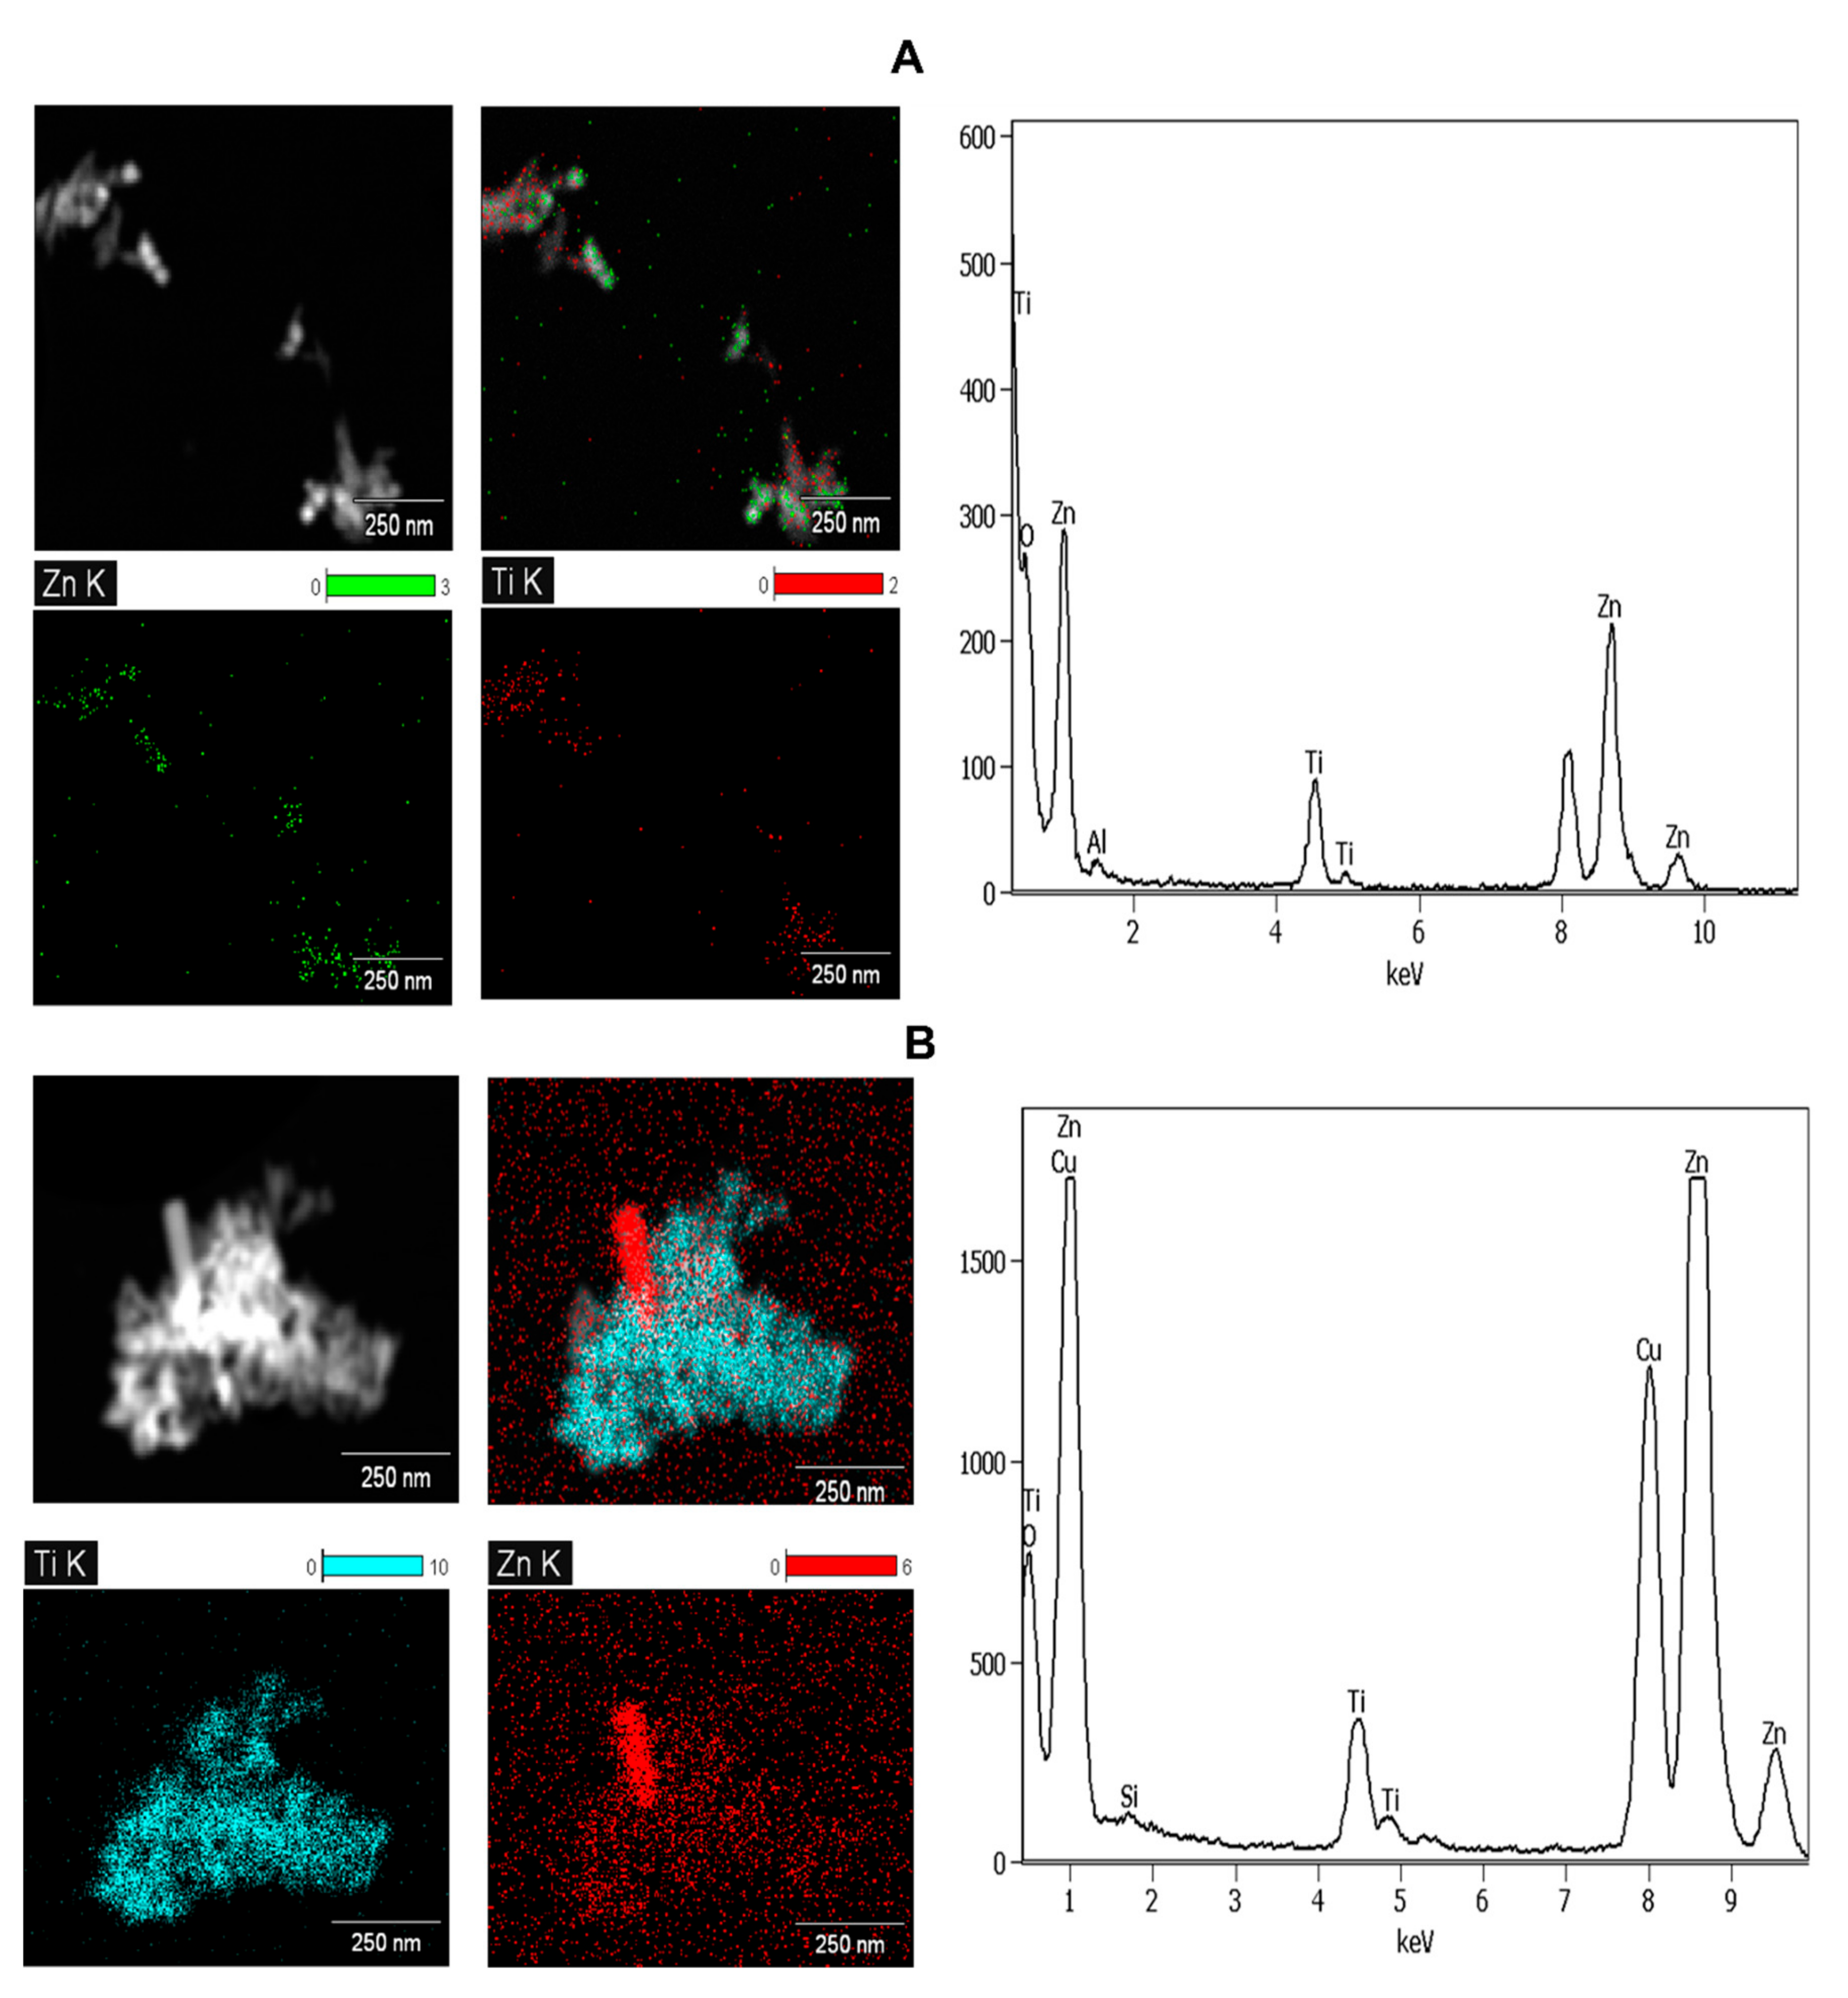
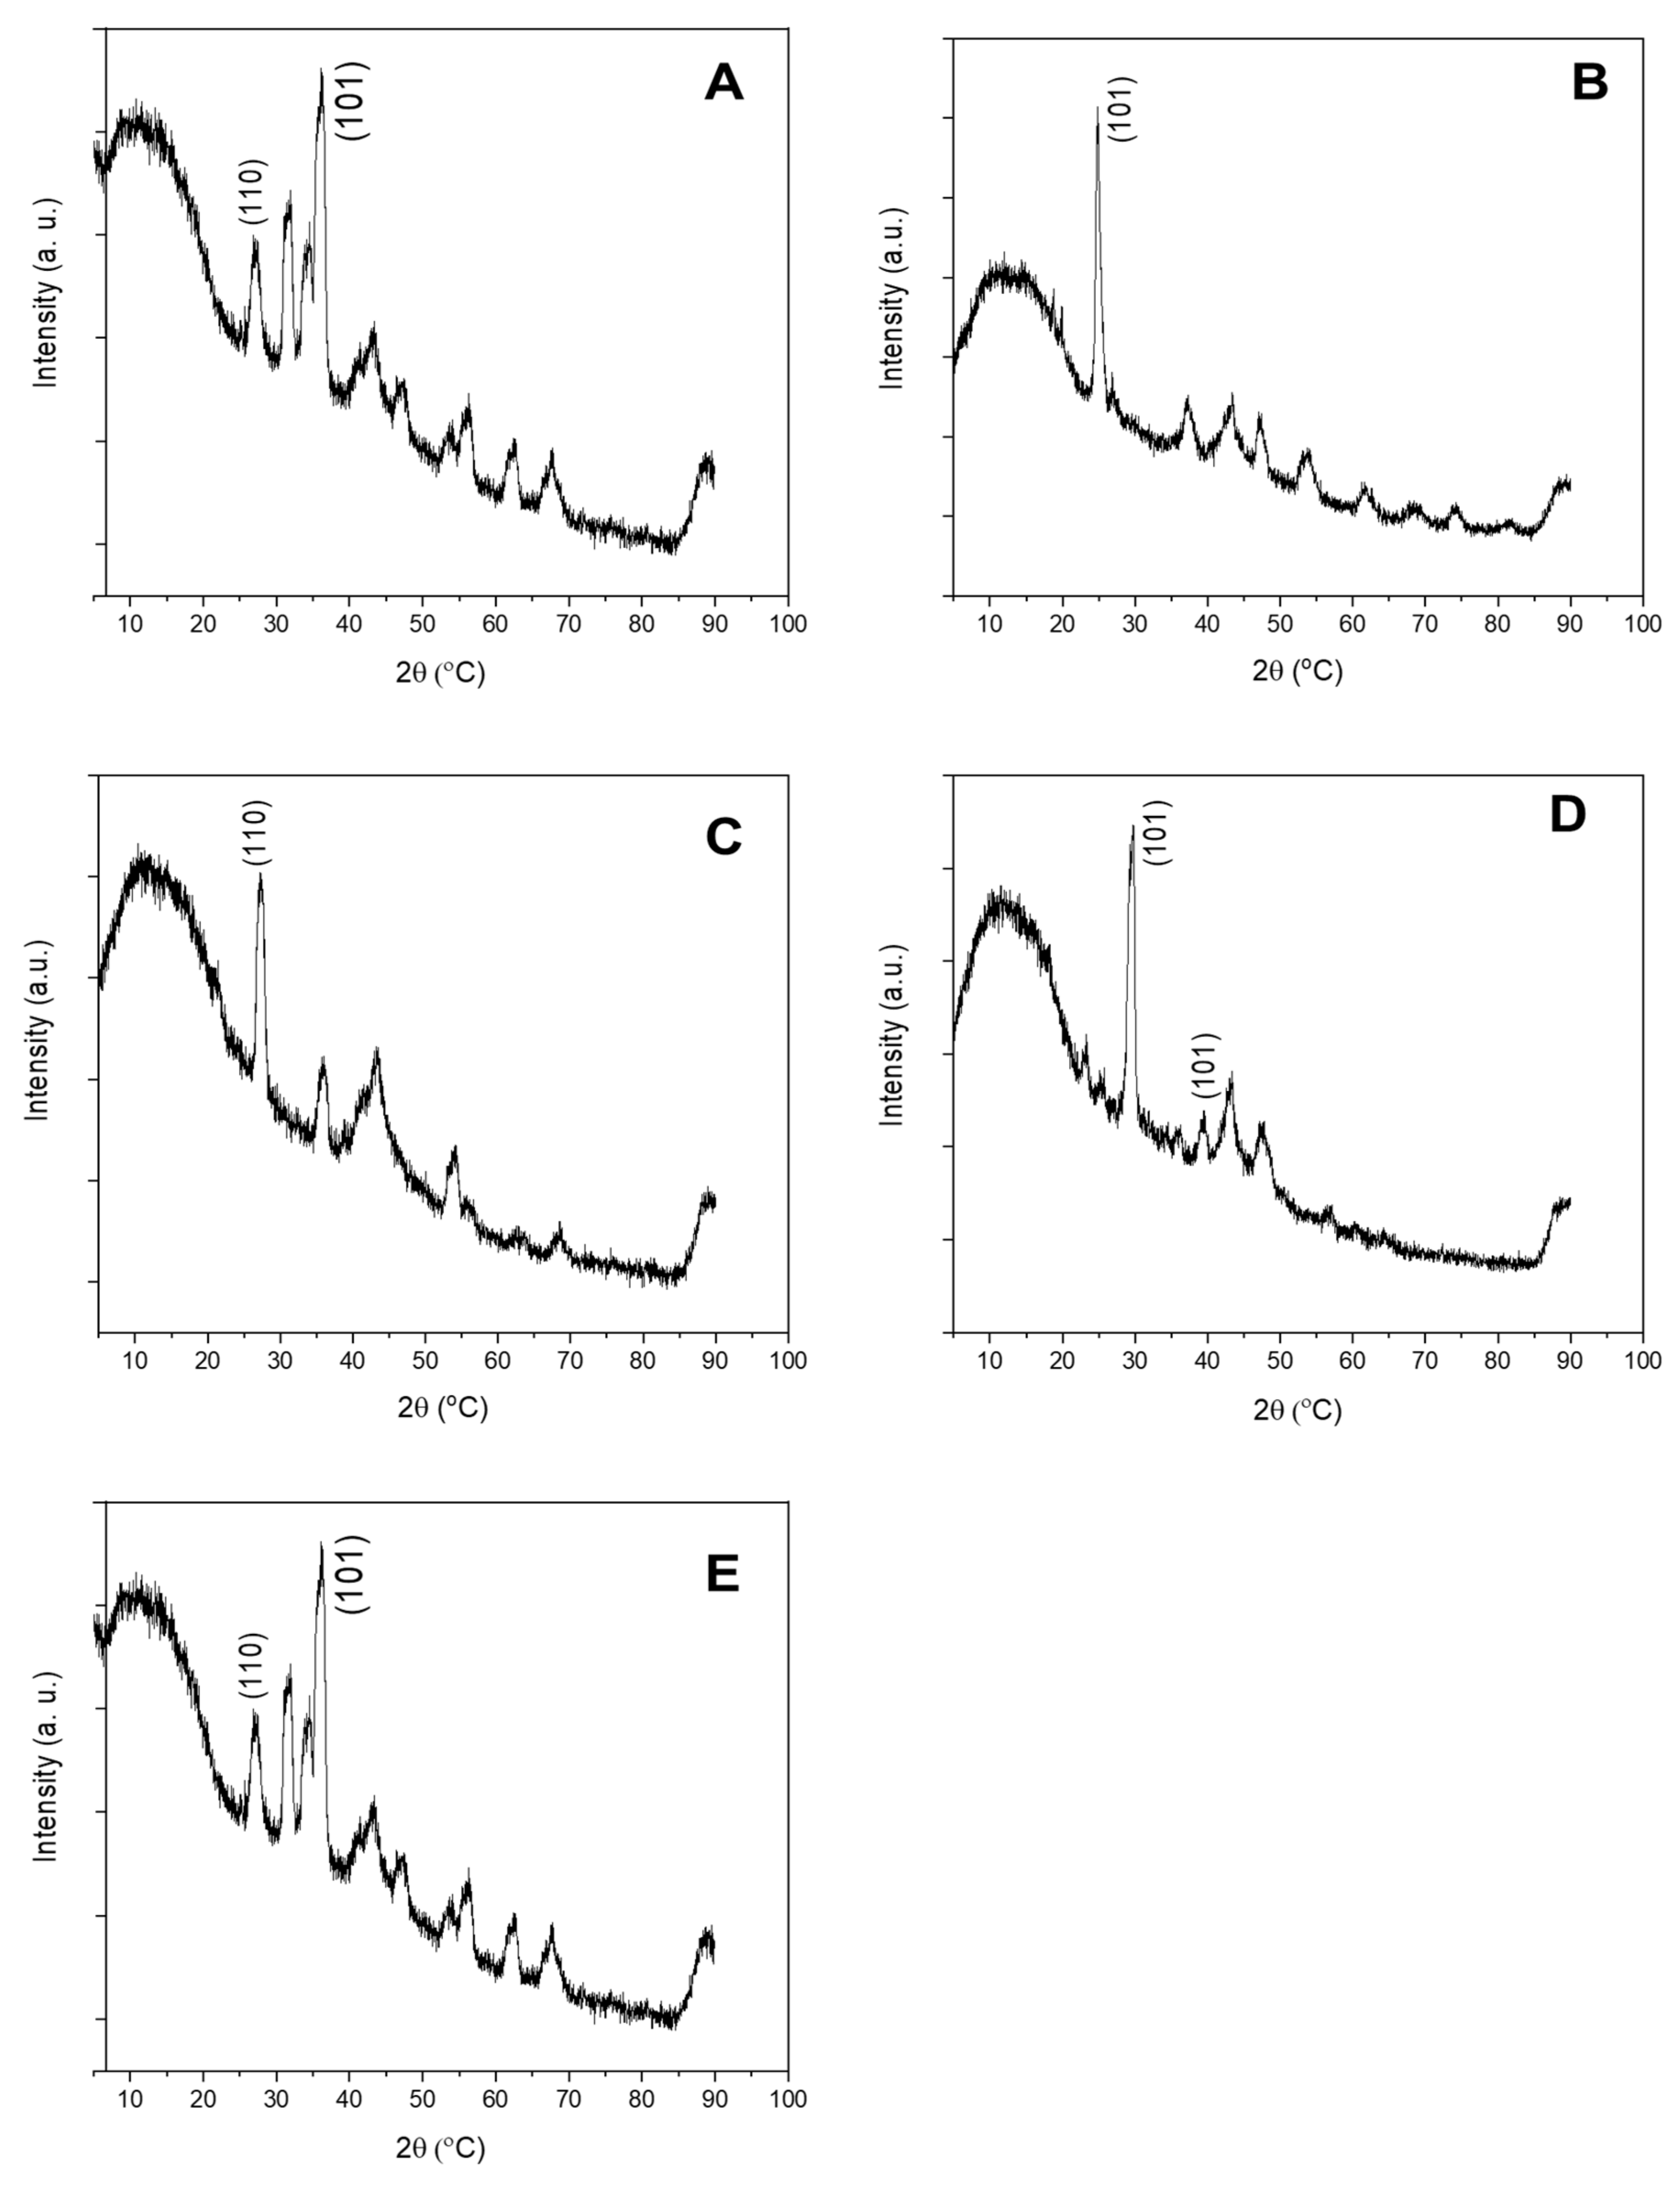
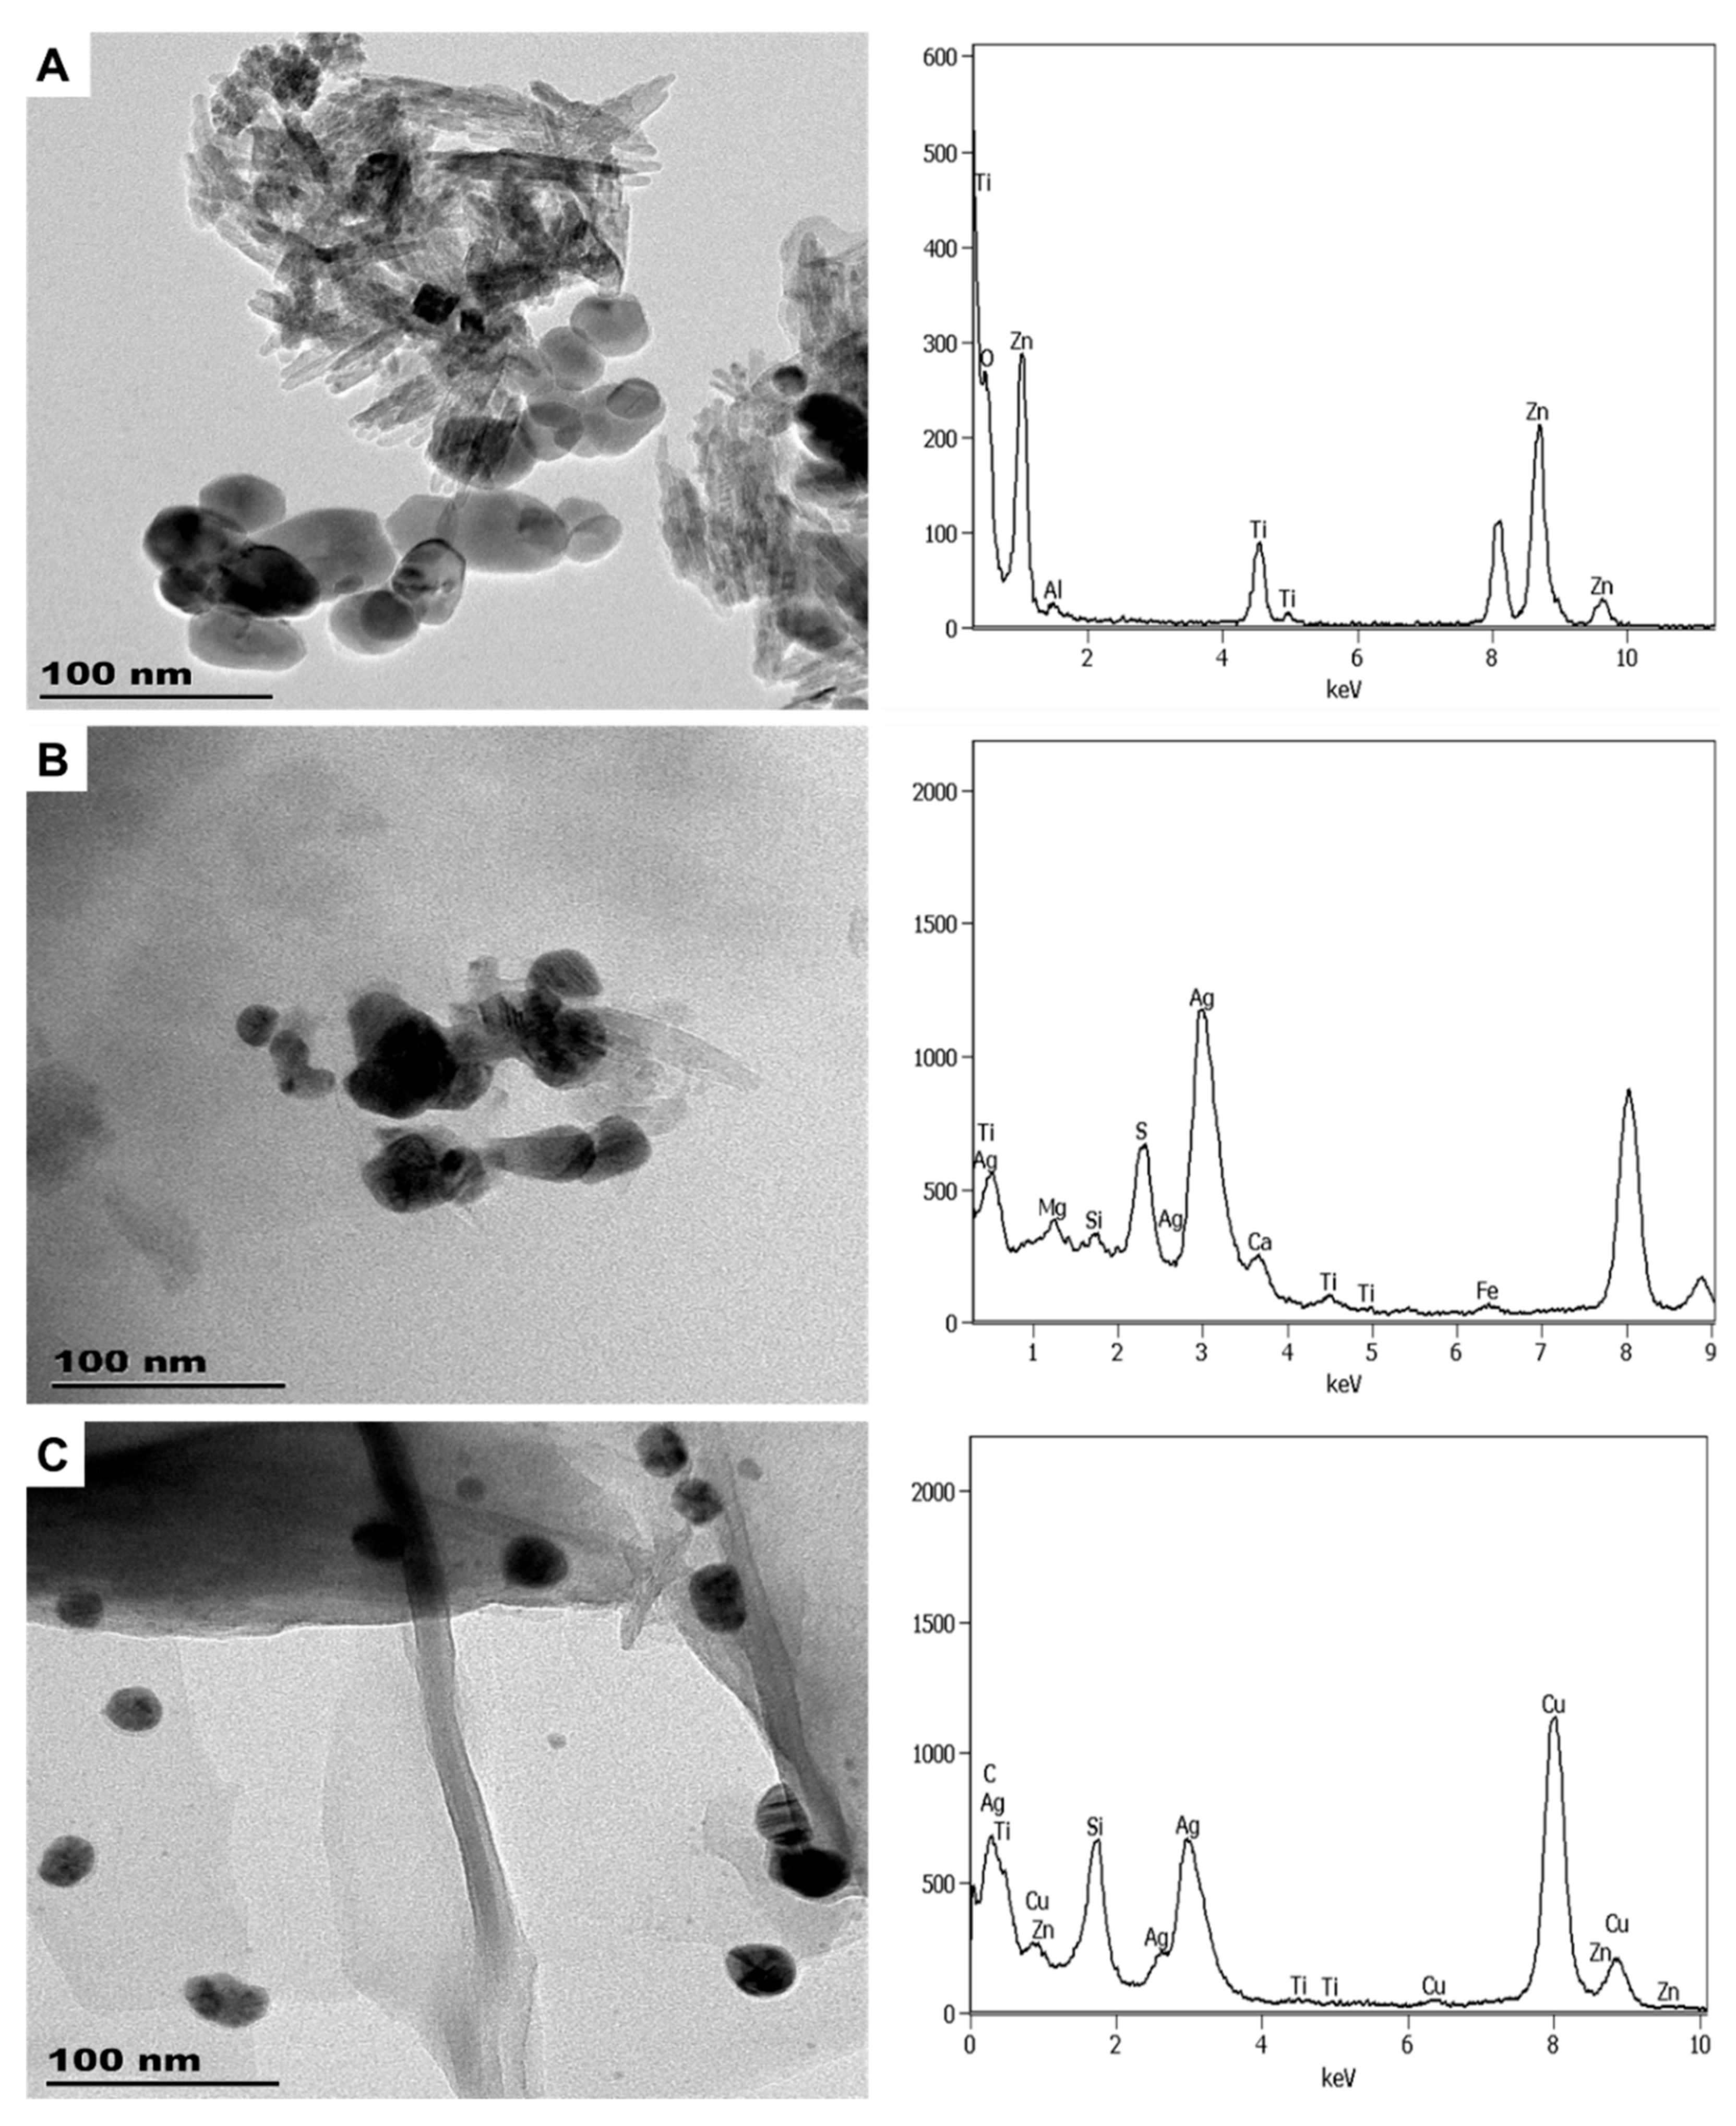
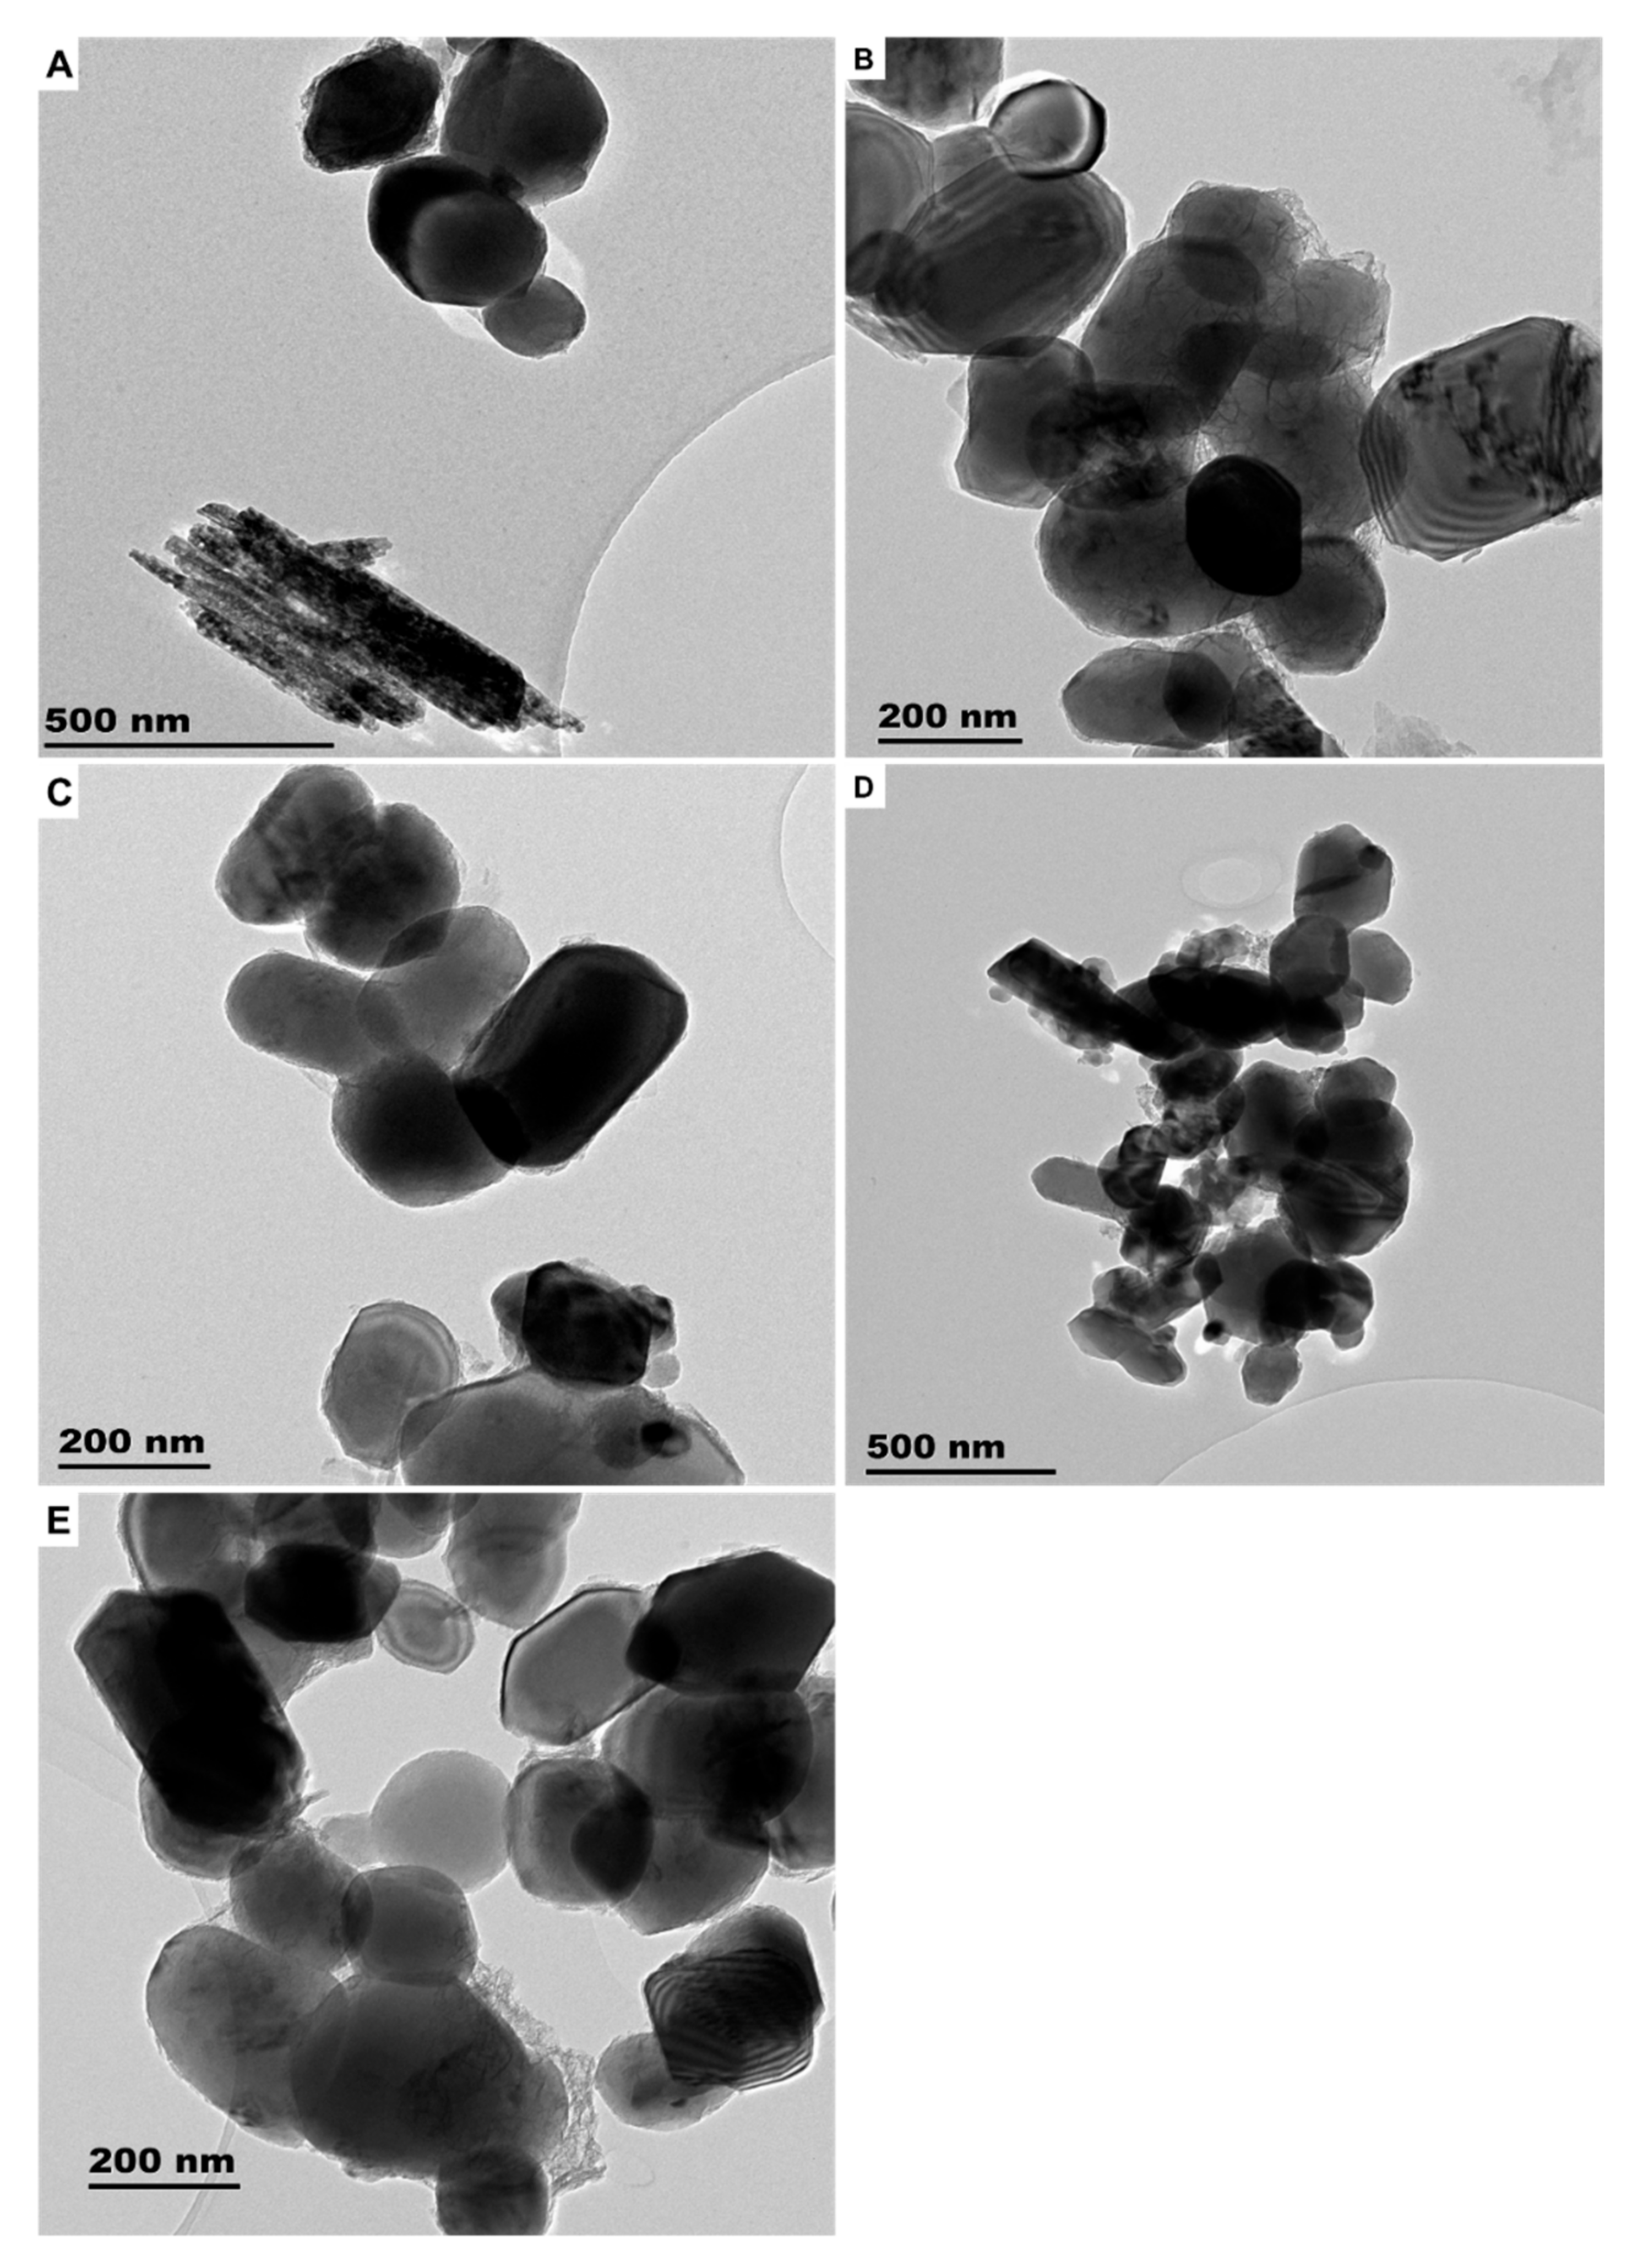
3.1.1. Sunscreens
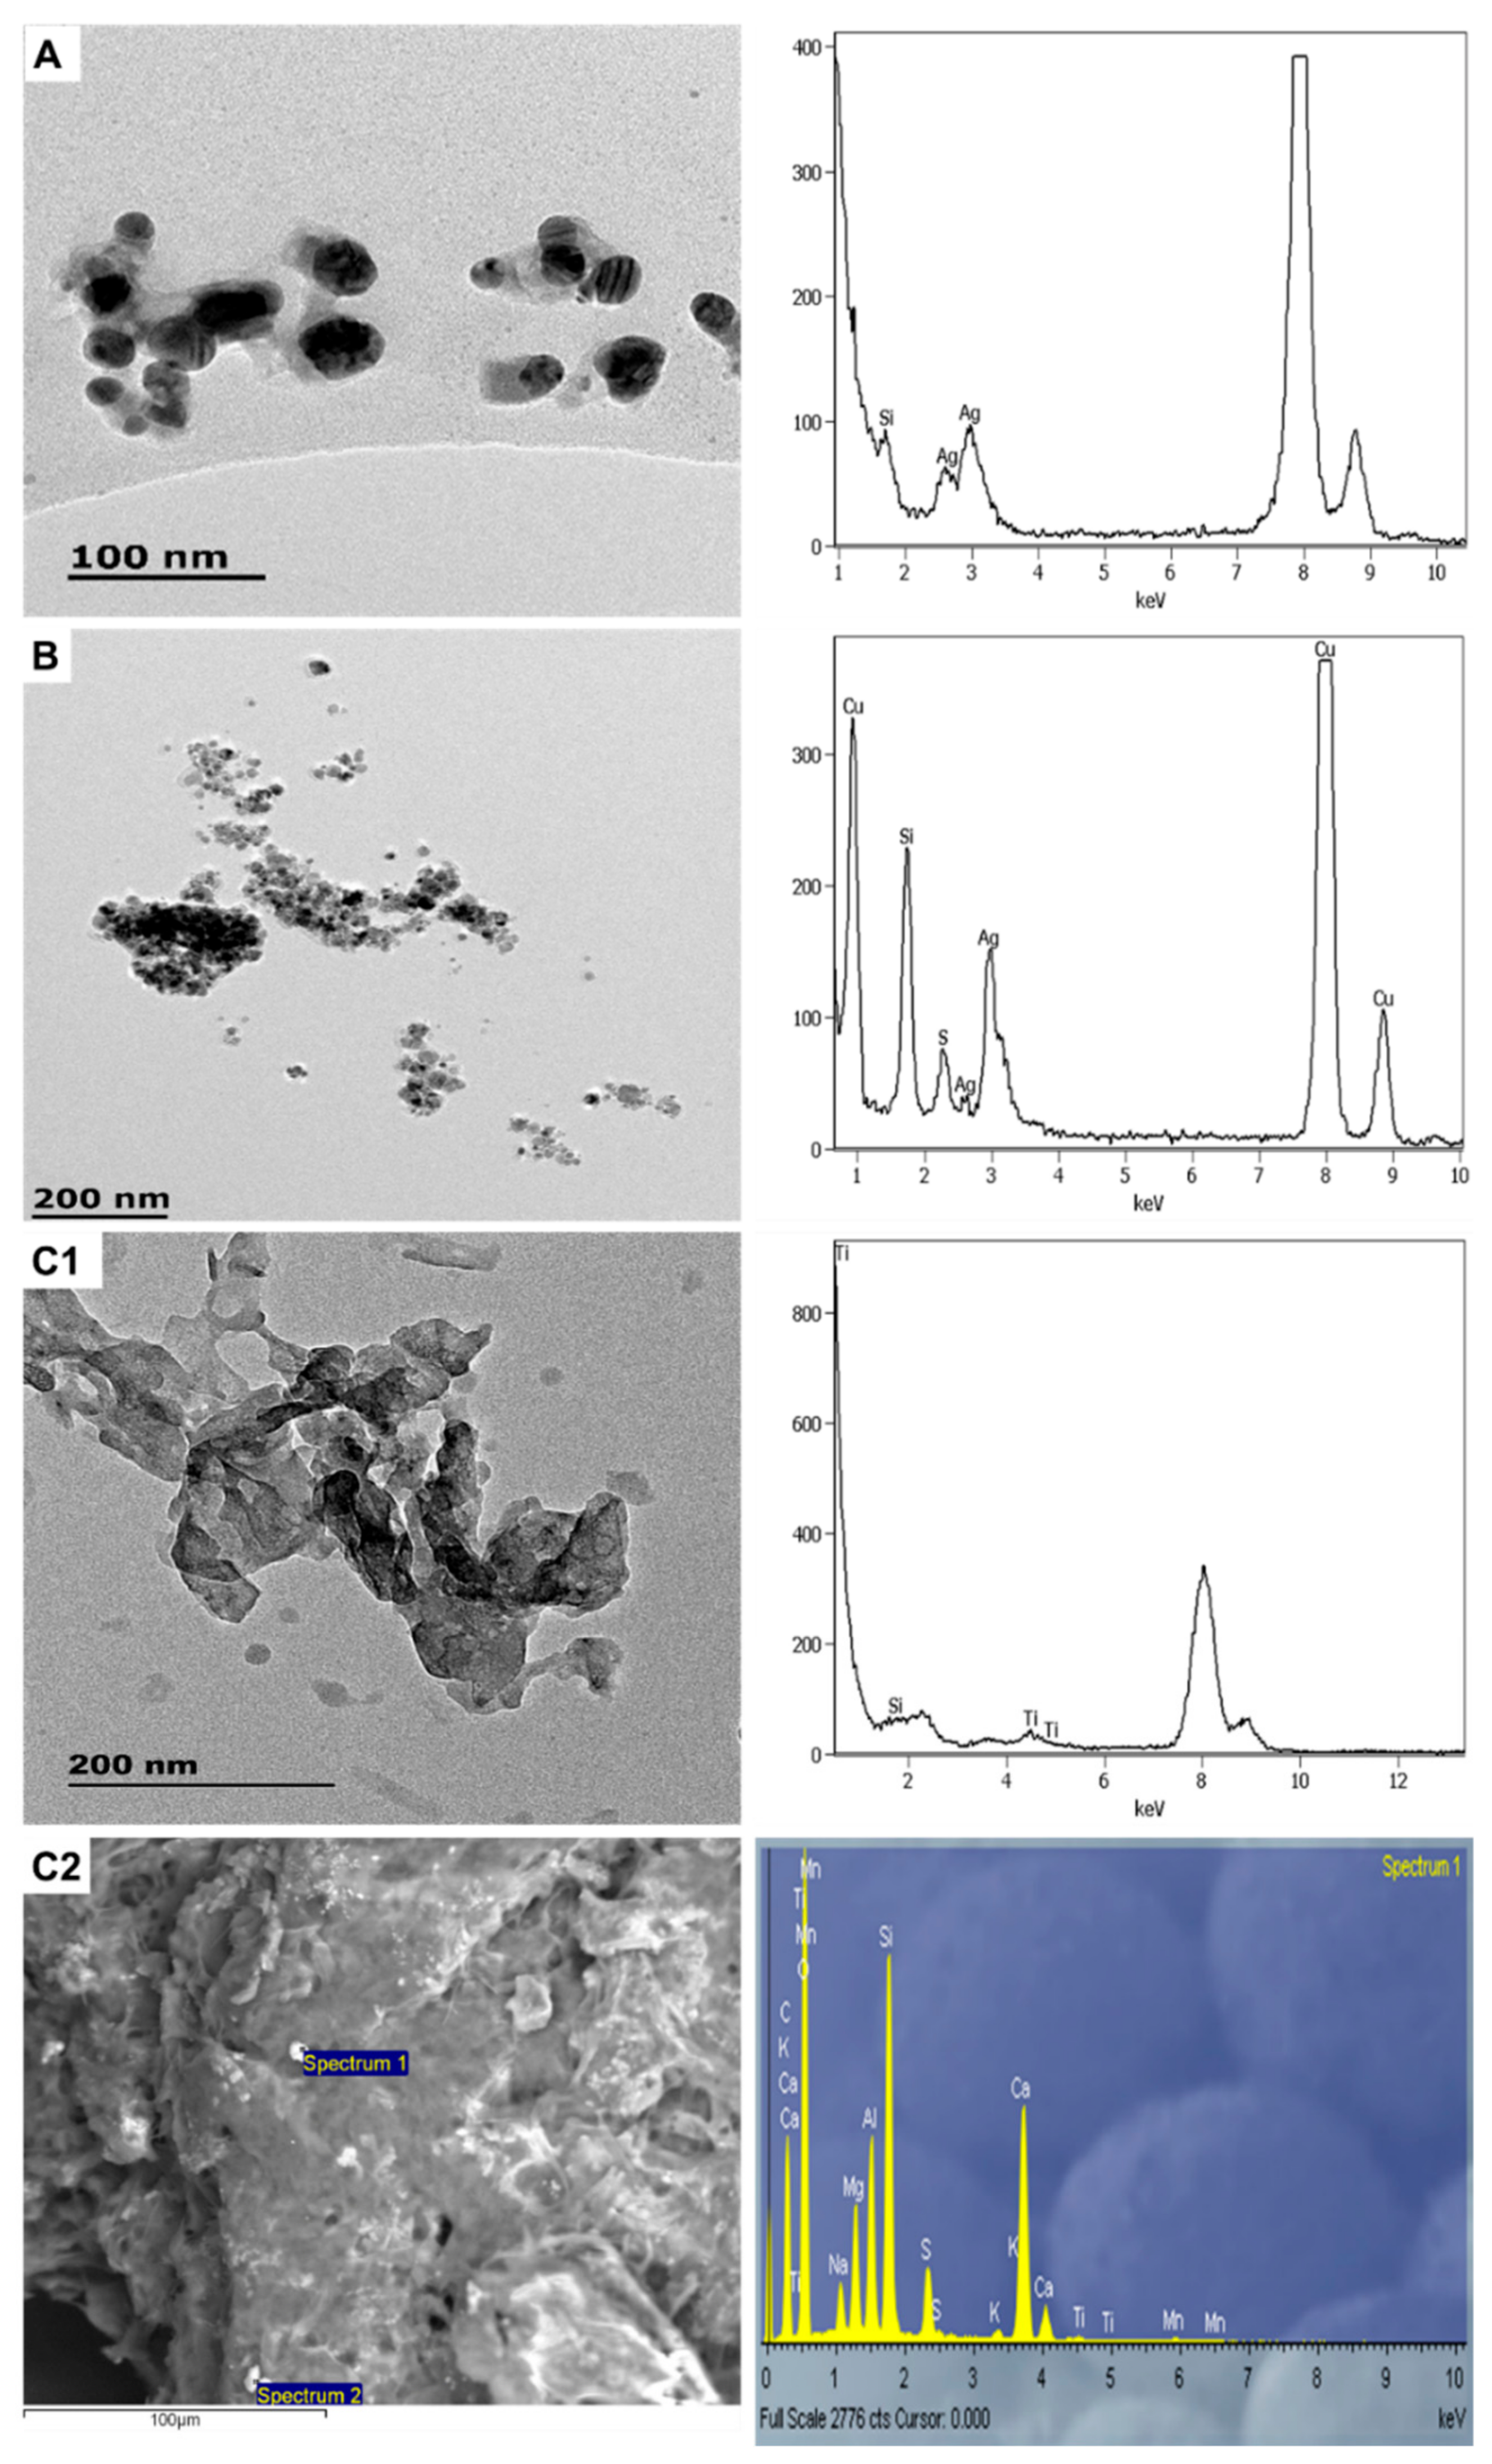
3.1.2. Personal Care Products
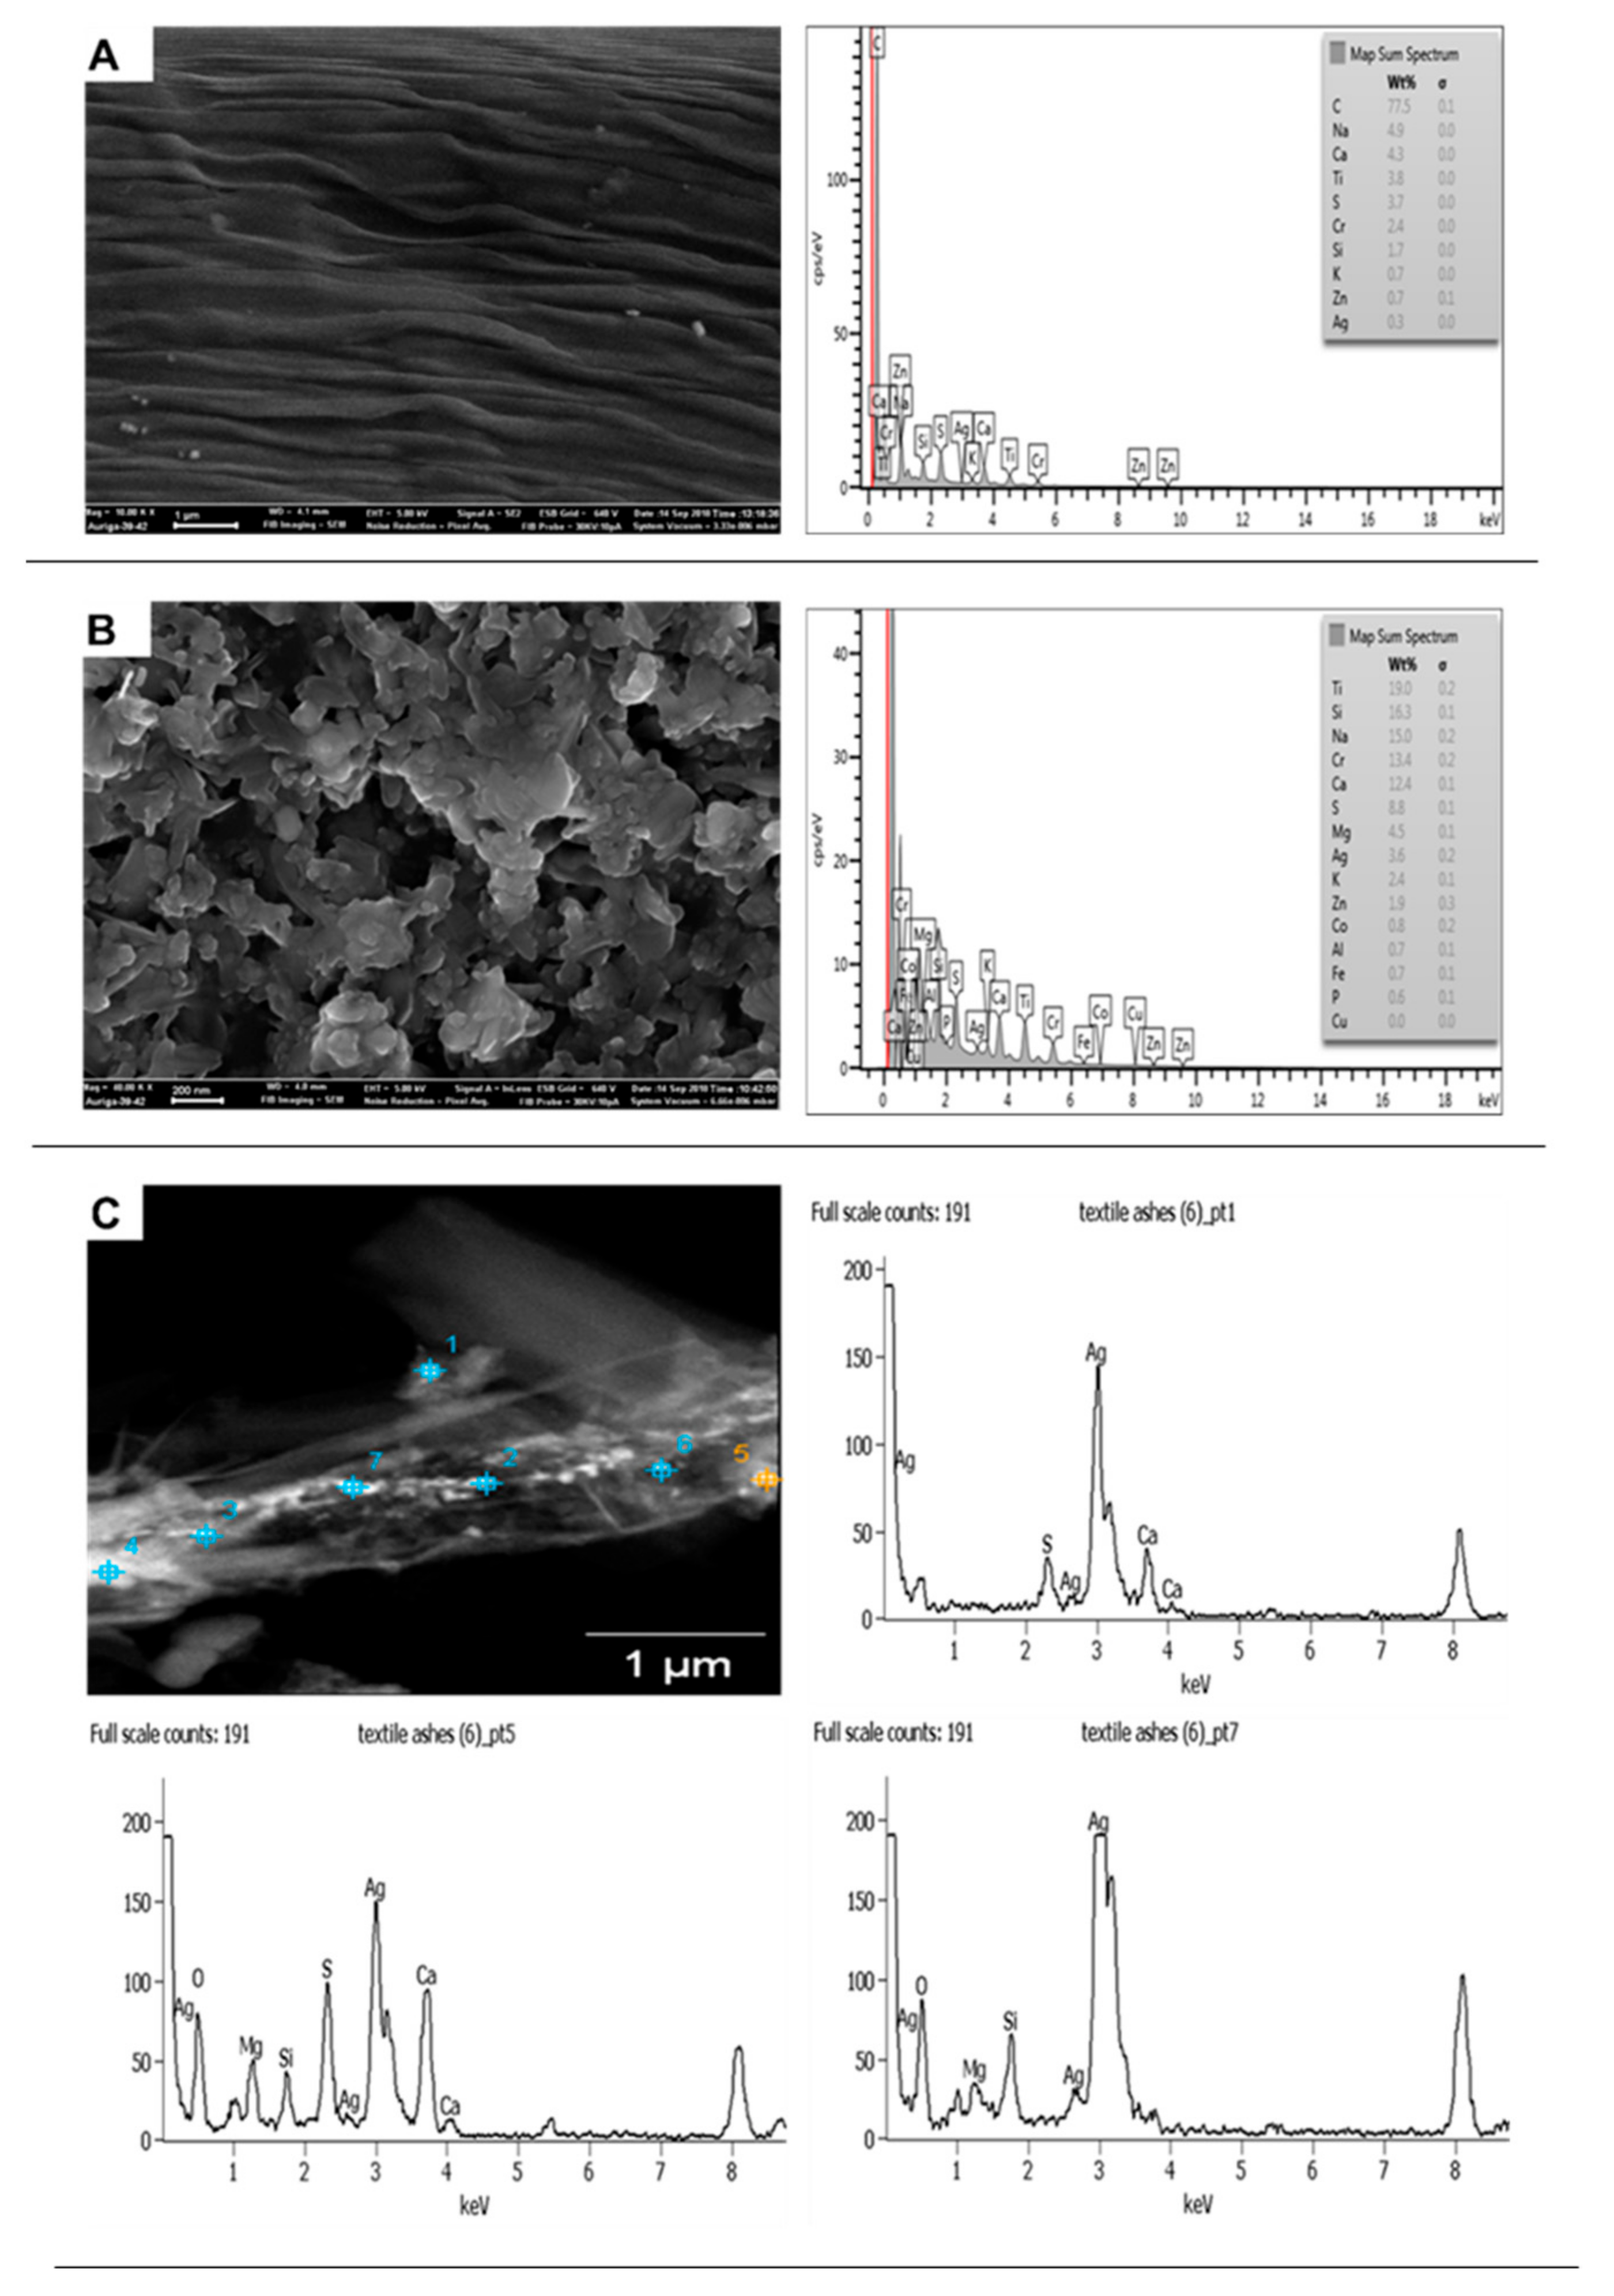
3.1.3. Socks
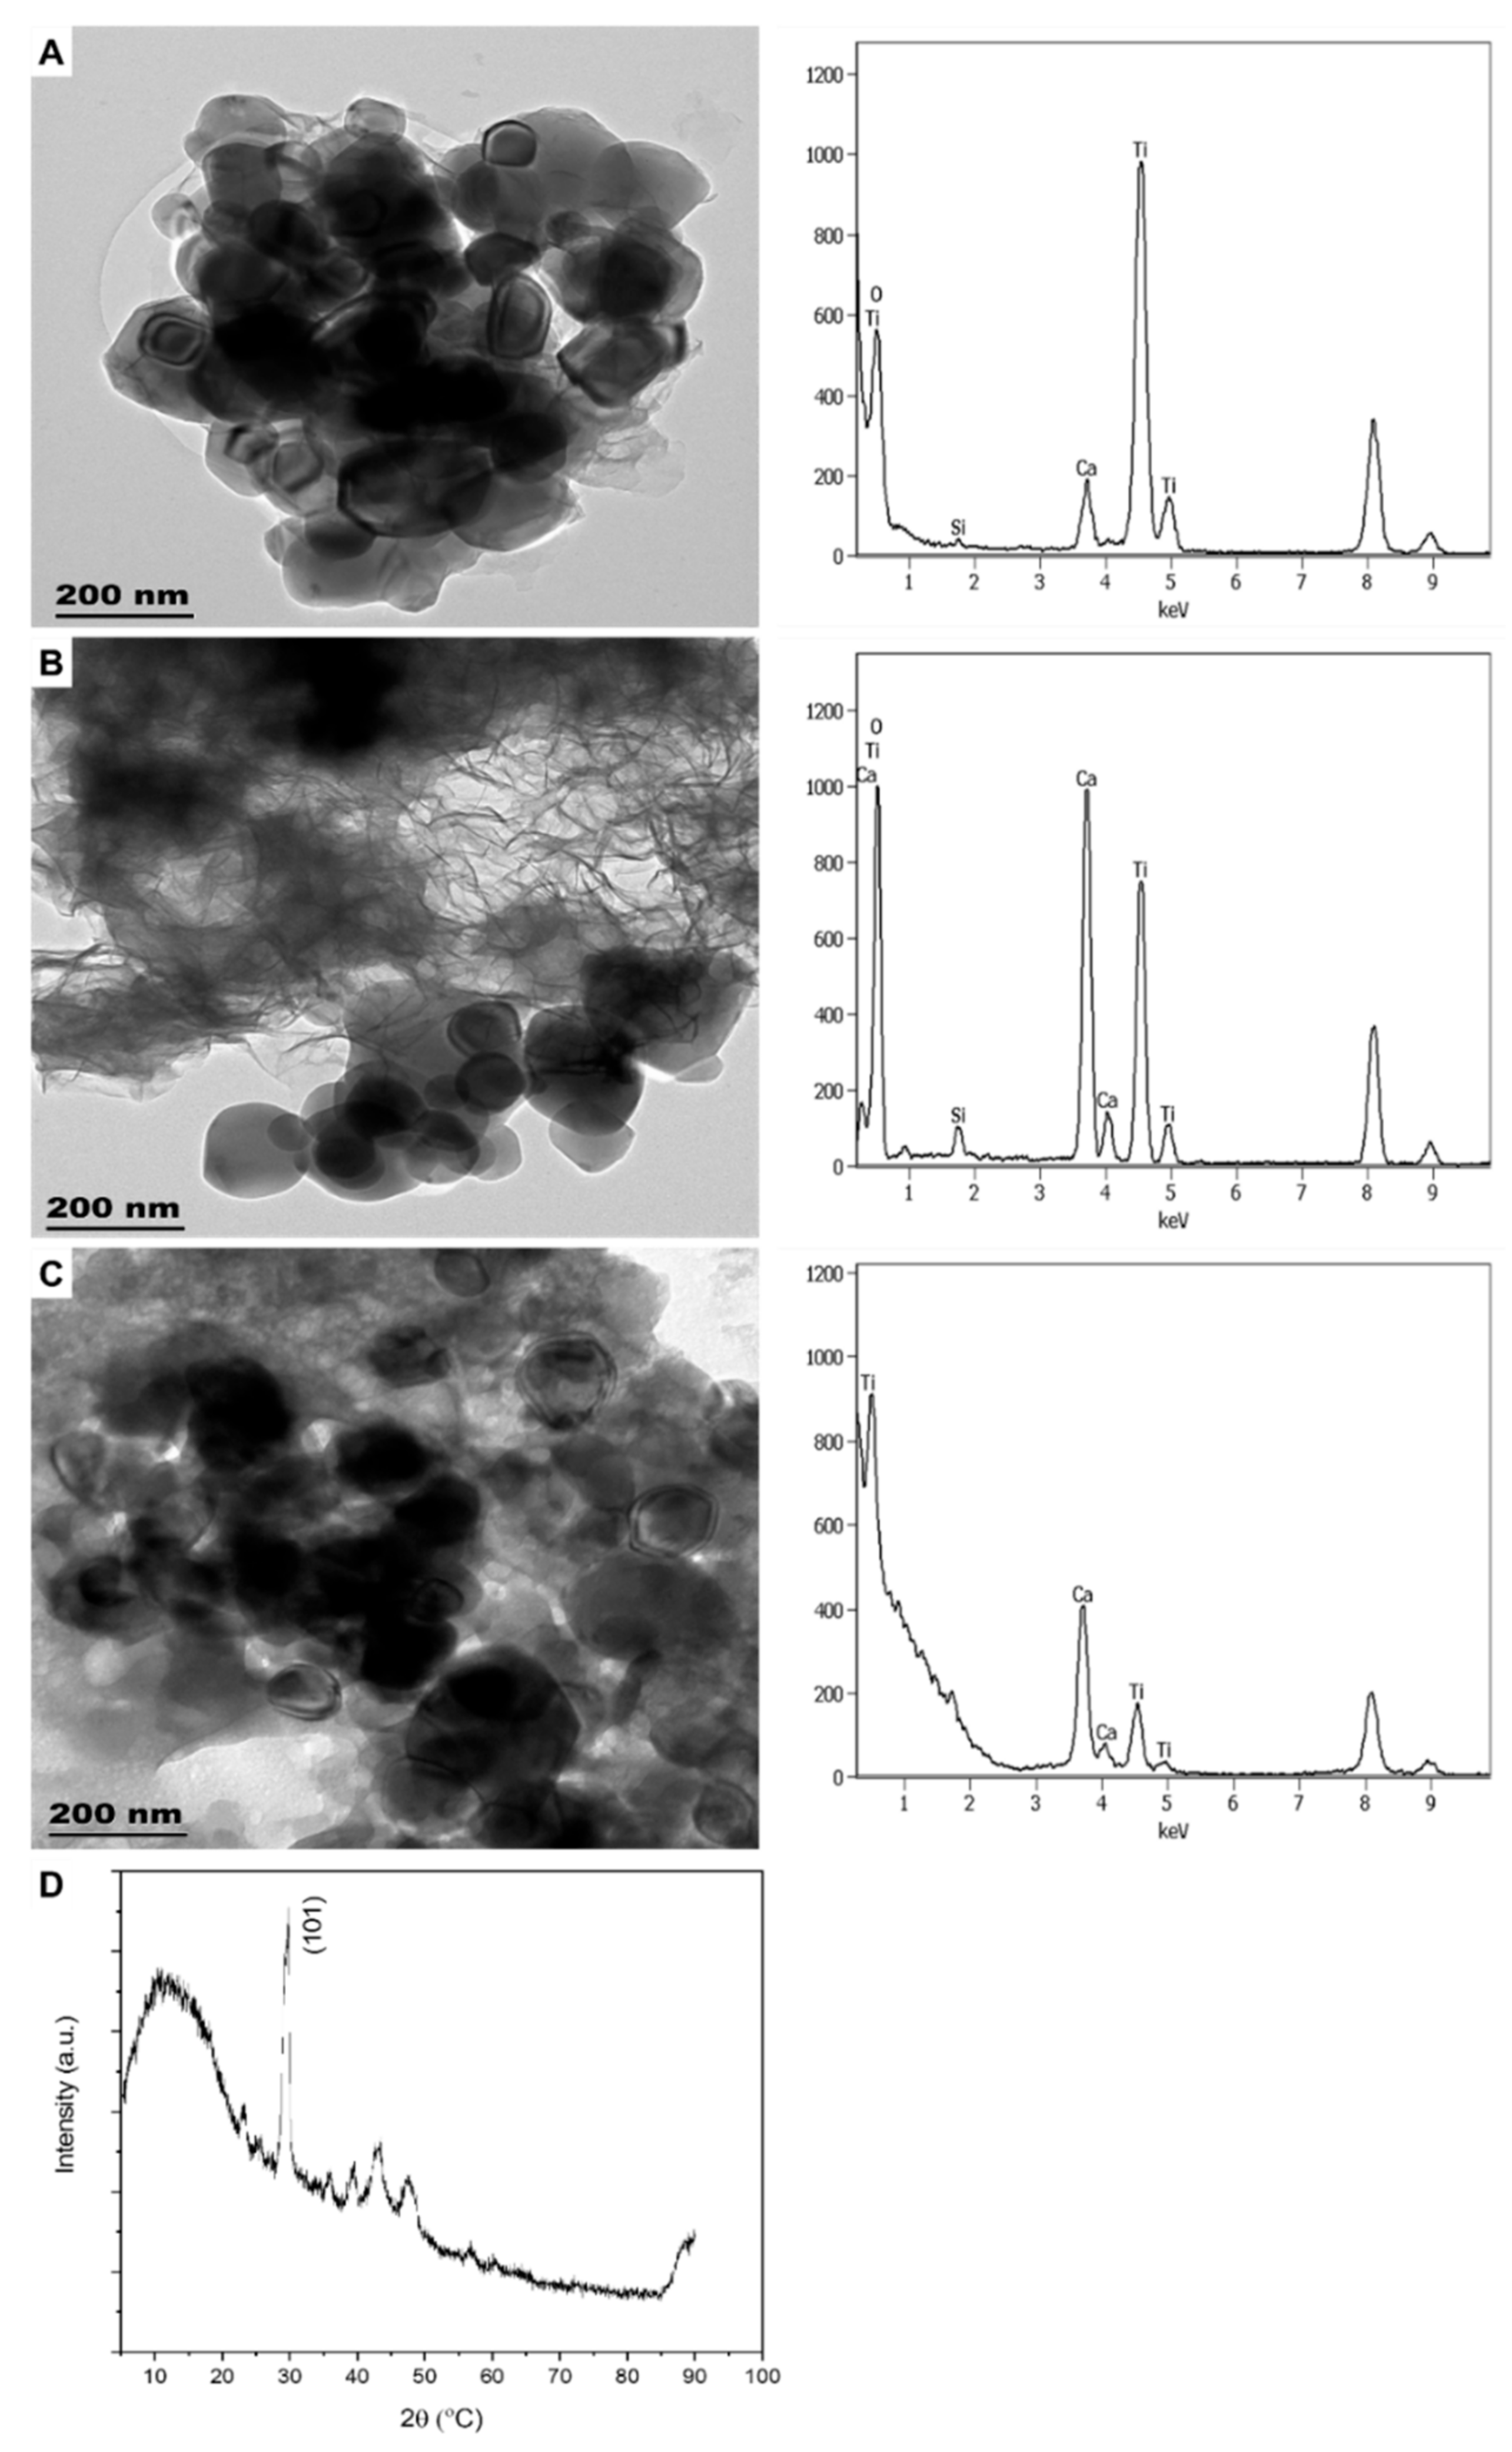
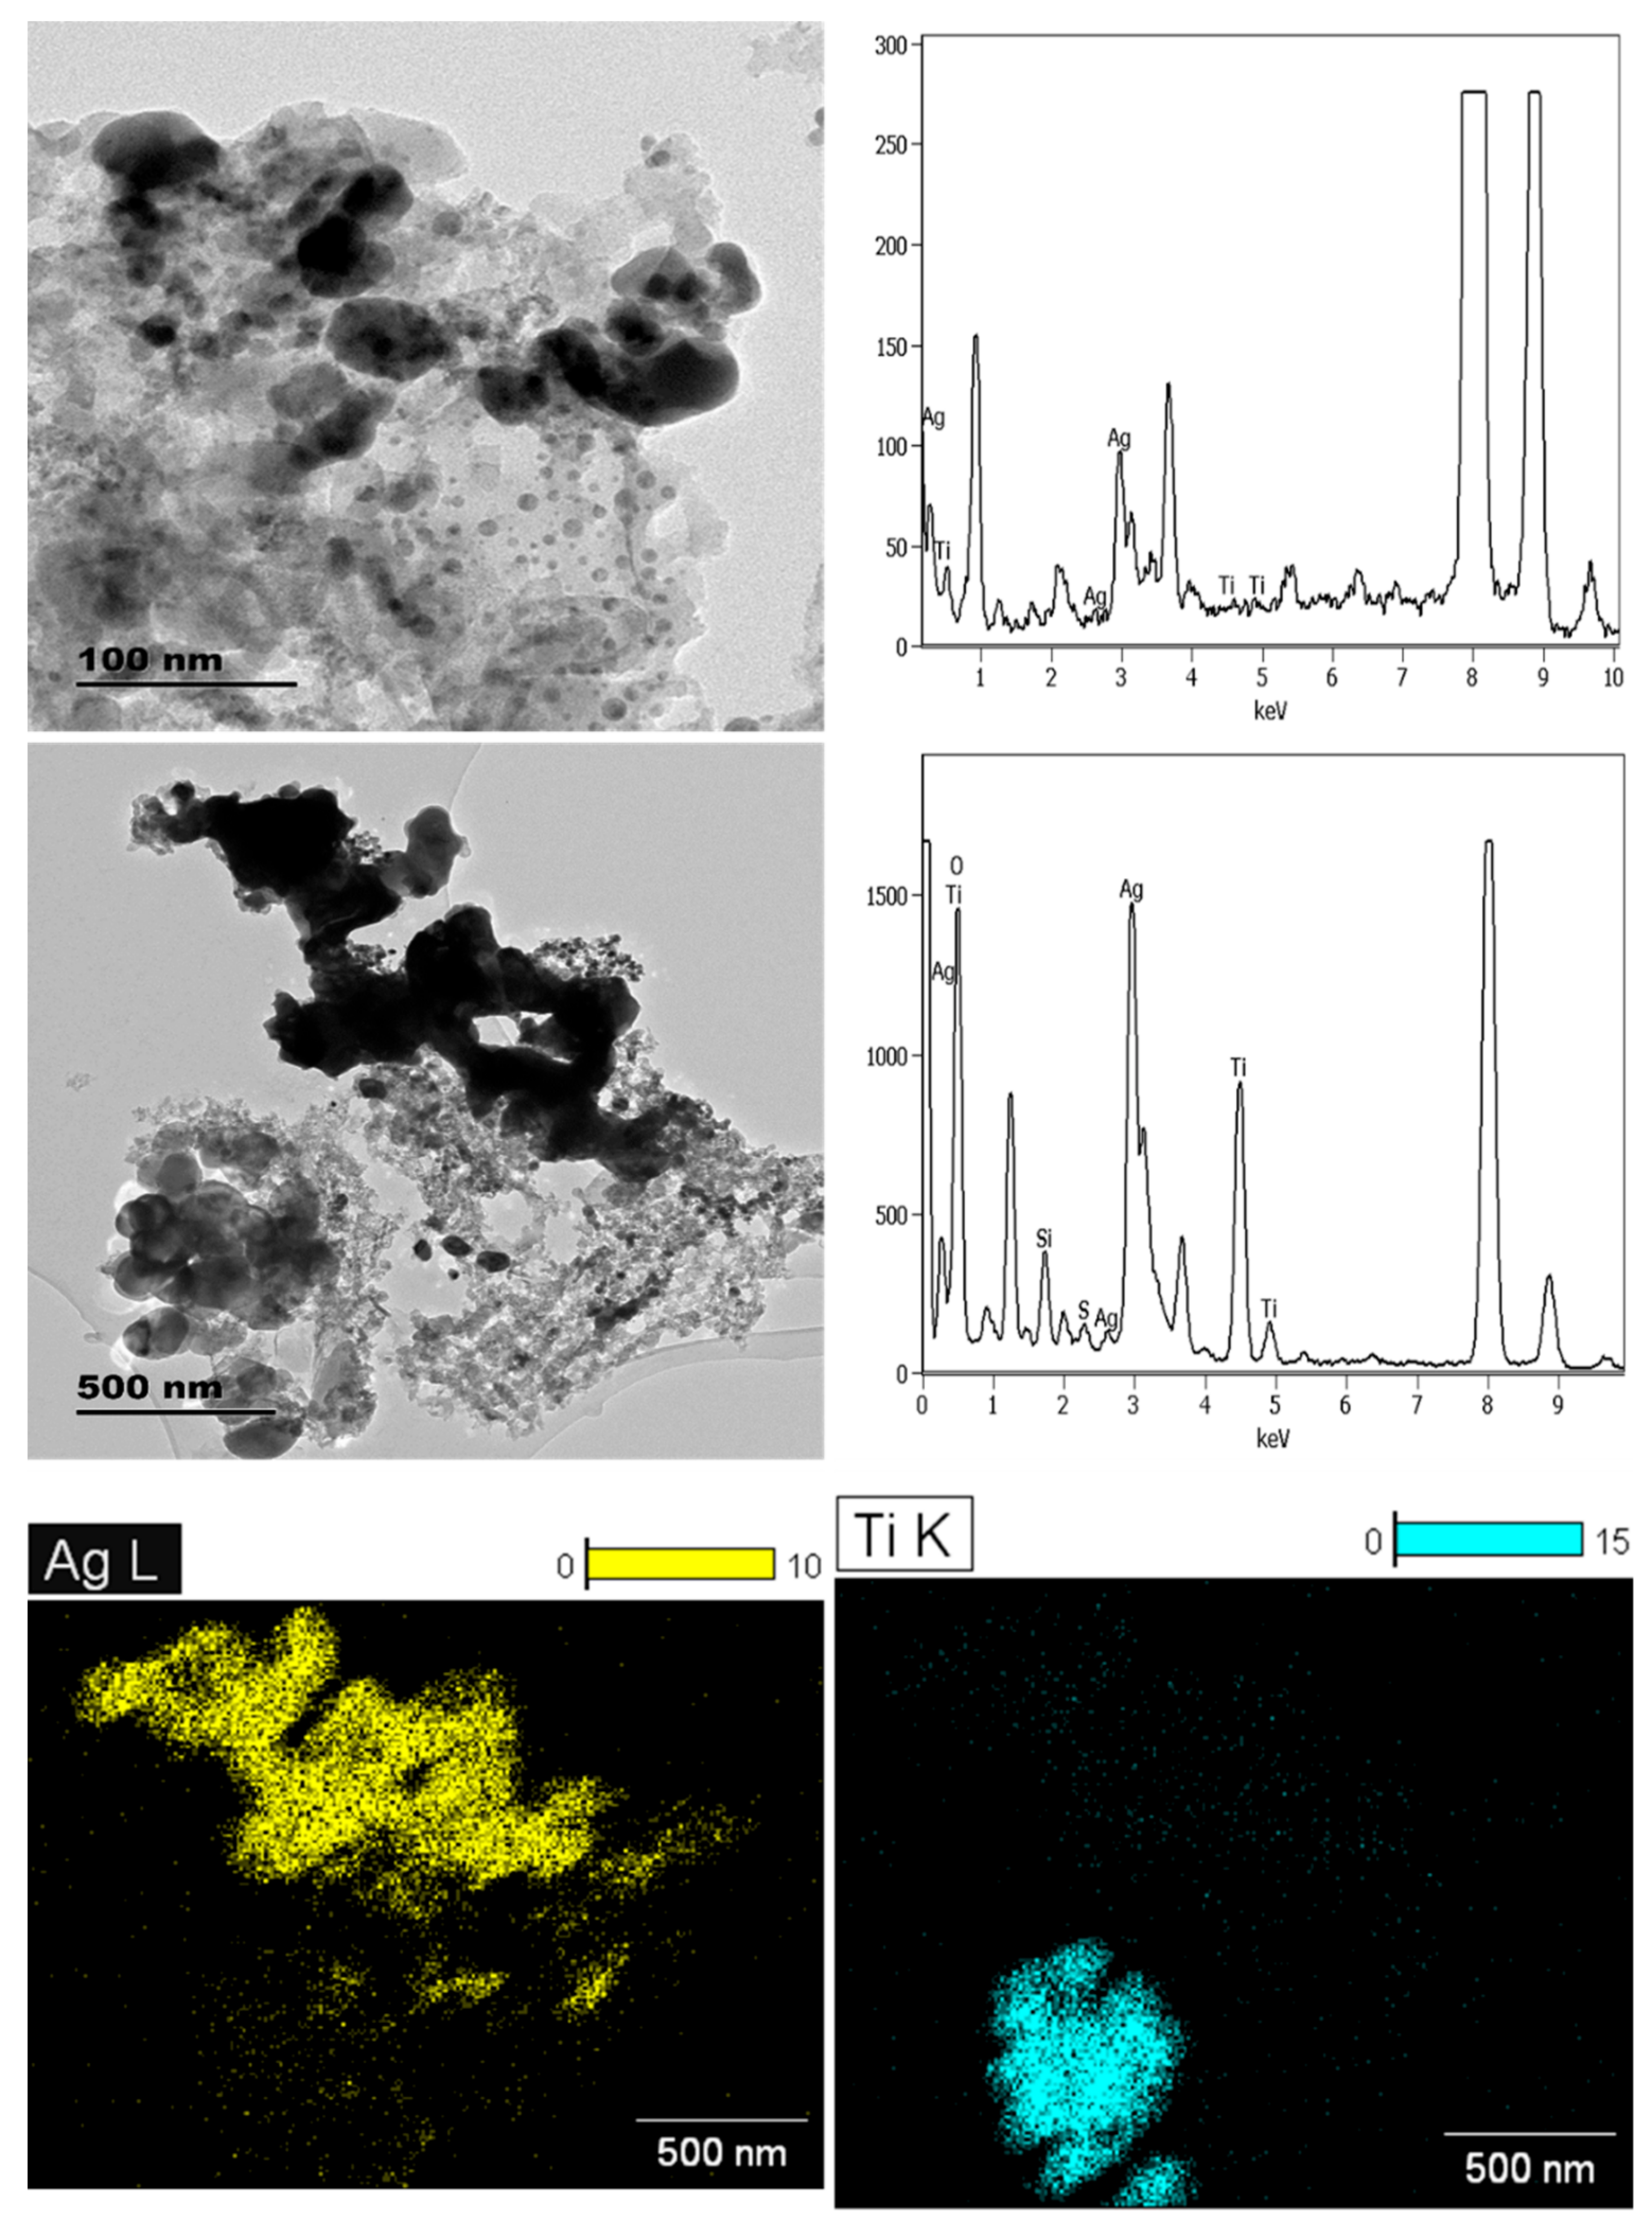
3.1.4. Paints
3.2. Elemental Quantification of ENMs in NEPs
4. Concluding Remarks
Supplementary Materials
Author Contributions
Funding
Institutional Review Board Statement
Informed Consent Statement
Data Availability Statement
Conflicts of Interest
Sample Availability
References
- Philippe, A.; Košík, J.; Welle, A.; Guignier, J.M.; Clemens, O.; Schaumann, G.E. Extraction and characterization methods for titanium dioxide nanoparticles from commercialized sunscreens. Environ. Sci. Nano 2018, 5, 191–202. [Google Scholar] [CrossRef]
- Benítez-Martínez, S.; López-Lorente, Á.I.; Valcárcel, M. Determination of TiO2 nanoparticles in sunscreen using N-doped graphene quantum dots as a fluorescent probe. Microchim. Acta 2016, 183, 781–789. [Google Scholar] [CrossRef]
- Nthwane, Y.B.; Tancu, Y.; Maity, A.; Thwala, M. Characterisation of titanium oxide nanomaterials in sunscreens obtained by extraction and release exposure scenarios. SN Appl. Sci. 2019, 1, 312. [Google Scholar] [CrossRef] [Green Version]
- Bairi, V.G.; Lim, J.-H.; Fong, A.; Linder, S.W. Size characterization of metal oxide nanoparticles in commercial sunscreen products. J. Nanopart. Res. 2017, 19, 256. [Google Scholar] [CrossRef]
- Benn, T.; Westerhoff, P. Nanoparticle Silver Released into Water from Commercially Available Sock Fabrics. Environ. Sci. Technol. 2008, 42, 4133–4139. [Google Scholar] [CrossRef] [PubMed]
- CEM. MARS Microwave Digestion—Sample Preparation Using Microwave Digestion. Available online: http://cem.com/microwave-digestion (accessed on 16 July 2018).
- Silva, F.L.; Duarte, T.A.; Melo, L.S.; Ribeiro, L.P.; Gouveia, S.T.; Lopes, G.S.; Matos, W.O. Development of a wet digestion method for paints for the determination of metals and metalloids using inductively coupled plasma optical emission spectrometry. Talanta 2016, 146, 188–194. [Google Scholar] [CrossRef] [PubMed]
- De La Calle, I.; Menta, M.; Séby, F. Current trends and challenges in sample preparation for metallic nanoparticles analysis in daily products and environmental samples: A review. Spectrochim. Acta Part B At. Spectrosc. 2016, 125, 66–96. [Google Scholar] [CrossRef]
- Virkutyte, J.; Al-Abed, S.R.; Dionysiou, D.D. Depletion of the protective aluminum hydroxide coating in TiO2-based sunscreens by swimming pool water ingredients. Chem. Eng. J. 2012, 191, 95–103. [Google Scholar] [CrossRef]
- Al-Abed, S.R.; Virkutyte, J.; Ortenzio, J.N.R.; McCarrick, R.M.; Degn, L.L.; Zucker, R.; Coates, N.H.; Childs, K.; Ma, H.; Diamond, S.; et al. Environmental aging alters Al(OH)3 coating of TiO2 nanoparticles enhancing their photocatalytic and phototoxic activities. Environ. Sci. Nano 2016, 3, 593–601. [Google Scholar] [CrossRef] [Green Version]
- Auffan, M.; Pedeutour, M.; Rose, J.; Masion, A.; Ziarelli, F.; Borschneck, D.; Chanéac, C.; Botta, C.; Chaurand, P.; Labille, J.; et al. Structural Degradation at the Surface of a TiO2-Based Nanomaterial Used in Cosmetics. Environ. Sci. Technol. 2010, 44, 2689–2694. [Google Scholar] [CrossRef]
- Labille, J.; Feng, J.; Botta, C.; Borschneck, D.; Sammut, M.; Cabie, M.; Auffan, M.; Rose, J.; Bottero, J.-Y. Aging of TiO2 nanocomposites used in sunscreen. Dispersion and fate of the degradation products in aqueous environment. Environ. Pollut. 2010, 158, 3482–3489. [Google Scholar] [CrossRef] [PubMed]
- Lewicka, Z.A.; Benedetto, A.F.; Benoit, D.N.; Yu, W.W.; Fortner, J.D.; Colvin, V.L. The structure, composition, and dimensions of TiO2 and ZnO nanomaterials in commercial sunscreens. J. Nanopart. Res. 2011, 13, 3607–3617. [Google Scholar] [CrossRef]
- Jeon, S.-K.; Kim, E.-J.; Lee, J.; Lee, S. Potential risks of TiO2 and ZnO nanoparticles released from sunscreens into outdoor swimming pools. J. Hazard. Mater. 2016, 317, 312–318. [Google Scholar] [CrossRef] [PubMed]
- Dan, Y.; Shi, H.; Stephan, C.; Liang, X. Rapid analysis of titanium dioxide nanoparticles in sunscreens using single particle inductively coupled plasma–mass spectrometry. Microchem. J. 2015, 122, 119–126. [Google Scholar] [CrossRef]
- Lorenz, C.; Tiede, K.; Tear, S.; Boxall, A.; Von Goetz, N.; Hungerbühler, K. Imaging and Characterization of Engineered Nanoparticles in Sunscreens by Electron Microscopy, under Wet and Dry Conditions. Int. J. Occup. Environ. Health 2010, 16, 406–428. [Google Scholar] [CrossRef] [PubMed]
- Sysoltseva, M.; Winterhalter, R.; Wochnik, A.S.; Scheu, C.; Fromme, H. Electron microscopic investigation and elemental analysis of titanium dioxide in sun lotion. Int. J. Cosmet. Sci. 2017, 39, 292–300. [Google Scholar] [CrossRef]
- Hanigan, D.; Truong, L.; Schoepf, J.; Nosaka, T.; Mulchandani, A.; Tanguay, R.L.; Westerhoff, P. Trade-offs in ecosystem impacts from nanomaterial versus organic chemical ultraviolet filters in sunscreens. Water Res. 2018, 139, 281–290. [Google Scholar] [CrossRef]
- Moeta, P.J.; Wesley-Smith, J.; Maity, A.; Thwala, M. Nano-enabled products in South Africa and the assessment of environmental exposure potential for engineered nanomaterials. SN Appl. Sci. 2019, 1, 577. [Google Scholar] [CrossRef] [Green Version]
- Tyner, K.M.; Wokovich, A.M.; Doub, W.H.; Buhse, L.; Sung, L.-P.; Watson, S.S.; Sadrieh, N. Comparing methods for detecting and characterizing metal oxide nanoparticles in unmodified commercial sunscreens. Nanomedicine 2009, 4, 145–159. [Google Scholar] [CrossRef]
- Lu, P.-J.; Huang, S.-C.; Chen, Y.-P.; Chiueh, L.-C.; Shih, D.Y.-C. Analysis of titanium dioxide and zinc oxide nanoparticles in cosmetics. J. Food Drug Anal. 2015, 23, 587–594. [Google Scholar] [CrossRef] [Green Version]
- Sharma, S.; Sharma, R.K.; Gaur, K.; Torres, J.F.C.; Loza-Rosas, S.A.; Torres, A.; Saxena, M.; Julin, M.; Tinoco, A.D. Fueling a Hot Debate on the Application of TiO2 Nanoparticles in Sunscreen. Materials 2019, 12, 2317. [Google Scholar] [CrossRef] [PubMed] [Green Version]
- Pulvin, S.; Tanvir, S.; Anderson, W.A. Toxicity Associated with the Photo Catalytic and Photo Stable Forms of Titanium Dioxide Nanoparticles Used in Sunscreen. MOJ Toxicol. 2015, 1, 78–94. [Google Scholar] [CrossRef] [Green Version]
- Mitrano, D.M.; Motellier, S.; Clavaguera, S.; Nowack, B. Review of nanomaterial aging and transformations through the life cycle of nano-enhanced products. Environ. Int. 2015, 77, 132–147. [Google Scholar] [CrossRef] [PubMed] [Green Version]
- Pulit-Prociak, J.; Chwastowski, J.; Kucharski, A.; Banach, M. Functionalization of textiles with silver and zinc oxide nanoparticles. Appl. Surf. Sci. 2016, 385, 543–553. [Google Scholar] [CrossRef]
- Buşilă, M.; Musat, V.; Textor, T.; Mahltig, B. Synthesis and characterization of antimicrobial textile finishing based on Ag:ZnO nanoparticles/chitosan biocomposites. RSC Adv. 2015, 5, 21562–21571. [Google Scholar] [CrossRef]
- Zhang, G.; Liu, Y.; Gao, X.; Chen, Y. Synthesis of silver nanoparticles and antibacterial property of silk fabrics treated by silver nanoparticles. Nanoscale Res. Lett. 2014, 9, 216. [Google Scholar] [CrossRef] [Green Version]
- Zhang, D.; Toh, G.W.; Lin, H.; Chen, Y. In situ synthesis of silver nanoparticles on silk fabric with PNP for antibacterial finishing. J. Mater. Sci. 2012, 47, 5721–5728. [Google Scholar] [CrossRef]
- Zhang, F.; Wu, X.; Chen, Y.; Lin, H. Application of silver nanoparticles to cotton fabric as an antibacterial textile finish. Fibers Polym. 2009, 10, 496–501. [Google Scholar] [CrossRef] [Green Version]
- Lorenz, C.; Windler, L.; Von Goetz, N.; Lehmann, R.P.; Schuppler, M.; Hungerbühler, K.; Heuberger, M.; Nowack, B. Characterization of silver release from commercially available functional (nano)textiles. Chemosphere 2012, 89, 817–824. [Google Scholar] [CrossRef]
- Al-Kattan, A.; Wichser, A.; Zuin, S.; Arroyo, Y.; Golanski, L.; Ulrich, A.; Nowack, B. Behavior of TiO2 Released from Nano-TiO2-Containing Paint and Comparison to Pristine Nano-TiO2. Environ. Sci. Technol. 2014, 48, 6710–6718. [Google Scholar] [CrossRef]
- Al-Kattan, A.; Wichser, A.; Vonbank, R.; Brunner, S.; Ulrich, A.; Zuin, S.; Nowack, B. Release of TiO2 from paints containing pigment-TiO2 or nano-TiO2 by weathering. Environ. Sci. Process. Impacts 2013, 15, 2186. [Google Scholar] [CrossRef] [PubMed] [Green Version]
- Samontha, A.; Shiowatana, J.; Siripinyanond, A. Particle size characterization of titanium dioxide in sunscreen products using sedimentation field-flow fractionation–inductively coupled plasma–mass spectrometry. Anal. Bioanal. Chem. 2011, 399, 973–978. [Google Scholar] [CrossRef] [PubMed]
- Contado, C.; Pagnoni, A. TiO2 in Commercial Sunscreen Lotion: Flow Field-Flow Fractionation and ICP-AES Together for Size Analysis. Anal. Chem. 2008, 80, 7594–7608. [Google Scholar] [CrossRef] [PubMed]
- Foltête, A.-S.; Masfaraud, J.-F.; Bigorgne, E.; Nahmani, J.; Chaurand, P.; Botta, C.; Labille, J.; Rose, J.; Férard, J.-F.; Cotelle, S. Environmental impact of sunscreen nanomaterials: Ecotoxicity and genotoxicity of altered TiO2 nanocomposites on Vicia faba. Environ. Pollut. 2011, 159, 2515–2522. [Google Scholar] [CrossRef] [PubMed]
- Cascio, C.; Geiss, O.; Franchini, F.; Ojea-Jiménez, I.; Rossi, F.; Gilliland, D.; Calzolai, L. Detection, quantification and derivation of number size distribution of silver nanoparticles in antimicrobial consumer products. J. Anal. At. Spectrom. 2015, 30, 1255–1265. [Google Scholar] [CrossRef] [Green Version]
- Wasukan, N.; Srisung, S.; Kulthong, K.; Boonrungsiman, S.; Maniratanachote, R. Determination of silver in personal care nanoproducts and effects on dermal exposure. J. Nanopart. Res. 2015, 17, 1–11. [Google Scholar] [CrossRef]
- De Leersnyder, I.; Rijckaert, H.; De Gelder, L.; Van Driessche, I.; Vermeir, P. High Variability in Silver Particle Characteristics, Silver Concentrations, and Production Batches of Commercially Available Products Indicates the Need for a More Rigorous Approach. Nanomaterials 2020, 10, 1394. [Google Scholar] [CrossRef]
- Mackevica, A.; Olsson, M.E.; Hansen, S.F. Quantitative characterization of TiO2 nanoparticle release from textiles by conventional and single particle ICP-MS. J. Nanopart. Res. 2018, 20, 6. [Google Scholar] [CrossRef]
- Windler, L.; Lorenz, C.; Von Goetz, N.; Hungerbühler, K.; Amberg, M.; Heuberger, M.; Nowack, B. Release of Titanium Dioxide from Textiles during Washing. Environ. Sci. Technol. 2012, 46, 8181–8188. [Google Scholar] [CrossRef]
- Bentlin, F.R.S.; Pozebon, D.; Mello, P.A.; Flores, É.M.M. Determination of trace elements in paints by direct sampling graphite furnace atomic absorption spectrometry. Anal. Chim. Acta 2007, 602, 23–31. [Google Scholar] [CrossRef]
- De La Calle, I.; Menta, M.; Klein, M.; Séby, F. Screening of TiO2 and Au nanoparticles in cosmetics and determination of elemental impurities by multiple techniques (DLS, SP-ICP-MS, ICP-MS and ICP-OES). Talanta 2017, 171, 291–306. [Google Scholar] [CrossRef] [PubMed]
- Bocca, B.; Caimi, S.; Senofonte, O.; Alimonti, A.; Petrucci, F. ICP-MS based methods to characterize nanoparticles of TiO2 and ZnO in sunscreens with focus on regulatory and safety issues. Sci. Total Environ. 2018, 630, 922–930. [Google Scholar] [CrossRef] [PubMed]
- Mozhayeva, D.; Engelhard, C. A critical review of single particle inductively coupled plasma mass spectrometry—A step towards an ideal method for nanomaterial characterization. J. Anal. At. Spectrom. 2020, 35, 1740–1783. [Google Scholar] [CrossRef] [Green Version]
- Flores, K.; Turley, R.S.; Valdes, C.; Ye, Y.; Cantu, J.; Hernandez-Viezcas, J.A.; Parsons, J.G.; Gardea-Torresdey, J.L. Environmental applications and recent innovations in single particle inductively coupled plasma mass spectrometry (SP-ICP-MS). Appl. Spectrosc. Rev. 2019, 1–26. [Google Scholar] [CrossRef]
- Mitrano, D.M.; Lombi, E.; DaSilva, Y.A.R.; Nowack, B. Unraveling the Complexity in the Aging of Nanoenhanced Textiles: A Comprehensive Sequential Study on the Effects of Sunlight and Washing on Silver Nanoparticles. Environ. Sci. Technol. 2016, 50, 5790–5799. [Google Scholar] [CrossRef]
- Laborda, F.; Jiménez-Lamana, J.; Bolea, E.; Castillo, J.R. Selective identification, characterization and determination of dissolved silver(i) and silver nanoparticles based on single particle detection by inductively coupled plasma mass spectrometry. J. Anal. At. Spectrom. 2011, 26, 1362–1371. [Google Scholar] [CrossRef]
- Mitrano, D.M.; Lesher, E.K.; Bednar, A.; Monserud, J.; Higgins, C.P.; Ranville, J.F. Detecting nanoparticulate silver using single-particle inductively coupled plasma-mass spectrometry. Environ. Toxicol. Chem. 2012, 31, 115–121. [Google Scholar] [CrossRef]
- Bustos, A.R.M.; Petersen, E.J.; Possolo, A.; Winchester, M.R. Post hoc Interlaboratory Comparison of Single Particle ICP-MS Size Measurements of NIST Gold Nanoparticle Reference Materials. Anal. Chem. 2015, 87, 8809–8817. [Google Scholar] [CrossRef]
- Laborda, F.; Bolea, E.; Jiménez-Lamana, J. Single Particle Inductively Coupled Plasma Mass Spectrometry: A Powerful Tool for Nanoanalysis. Anal. Chem. 2014, 86, 2270–2278. [Google Scholar] [CrossRef]
- Liu, J.; Murphy, K.E.; Winchester, M.R.; Hackley, V.A. Overcoming challenges in single particle inductively coupled plasma mass spectrometry measurement of silver nanoparticles. Anal. Bioanal. Chem. 2017, 409, 6027–6039. [Google Scholar] [CrossRef]


| Sample | Product Type | ENMs Type (Labelled/Suspected b) | ENMs Location | Ingredient Description/NEPs Functionality Declaration |
|---|---|---|---|---|
| SUN1 | Sunscreen | TiO2 + ZnO | Suspended in liquid | Reflective sun protection (UVA/ UVB) |
| SUN2 | Sunscreen | TiO2 | Suspended in liquid | UVA/UVB immediate protection |
| SUN3 | Sunscreen | TiO2 | Suspended in liquid | UVA/UVB immediate protection |
| SUN4 | Sunscreen | TiO2 | Suspended in liquid | UVA/UVB immediate protection |
| SUN5 a | Sunscreen | TiO2 + ZnO b | Suspended in liquid | Advanced sun protection |
| LB1 | Lip balm | TiO2 + ZnO | Suspended in liquid | Reflective sun protection (UVA/ UVB) |
| CA1 a | Body cream | Ag b | Suspended in liquid | Ionic colloidal silver, antibacterial |
| CA2 a | Body cream | Ag b | Suspended in liquid | Ionic colloidal silver, anti-inflammatory |
| CM1 | Cream activator | SiO2 | Suspended in liquid | Nano |
| SAN1 a | Sanitiser | Ag b | Suspended in liquid | Ionic colloidal silver, antibacterial |
| SAN2 a | Sanitiser | Ag b | Suspended in liquid | Colloidal silver |
| SAN3 a | Sanitiser | Ag b | Suspended in liquid | Antibacterial |
| PA1 a | Paint | Ag, TiO2, ZnO, SiO2 b | Suspended in liquid | Nanotechnology |
| PA2 a | Paint | Ag, TiO2, ZnO, SiO2 b | Suspended in liquid | Nanotechnology |
| PA3 a | Paint | Ag, TiO2, ZnO, SiO2 b | Suspended in liquid | Antibacterial |
| PA4 a | Paint | Ag, TiO2, ZnO, SiO2 b | Suspended in liquid | New technology |
| PA5 a | Paint | Ag, TiO2, ZnO, SiO2 b | Suspended in liquid | Advanced technology |
| SK1 | Socks | AgCl | Surface bound | Nano, antibacterial |
| Sample | Target Analyte | Claimed Concentration (%) | Concentration (%) |
|---|---|---|---|
| SUN1 | Zn | not listed | 4.31 ± 0.86 b |
| Ti | not listed | 1.72 ± 0.41 b | |
| SUN2 | Ti | not listed | 0.945 ± 0.06 b |
| SUN3 | Ti | not listed | 1.62 ± 0.08 b |
| SUN4 | Ti | not listed | 2.10 ± 0.06 b |
| SUN5 | Zn | not listed | 6.84 ± 0.56 b |
| Ti | not listed | 2.60 ± 0.32 b | |
| LB1 | Zn | not listed | 3.40 ± 0.04 b |
| Ti | not listed | 1.41 ± 0.35 b | |
| CA1 | Ag | 1.80 × 10⁻³ a | 8.25 × 10⁻⁴ ± 3.54 × 10⁻⁵ b |
| Ti | not listed | 2.31 × 10⁻⁴ ± 8.8 × 10⁻⁶ b | |
| CA2 | Ag | 1.80 × 10⁻³ a | 1.46x10⁻³ ± 1.7 × 10⁻⁵ b |
| CM1 | Ti | Not listed | 0.949 ± 0.04 b |
| SAN1 | Ag | 1.80 × 10⁻³ a | 11.3 × 10⁻³ ± 3.18 × 10⁻⁵ c |
| SAN2 | Ag | 1.80 × 10⁻³ a | 8.13 × 10⁻⁴ ± 3.0 × 10⁻⁵ c |
| PA1 | Ti | not listed | 2.09 ± 0.24 b |
| PA2 | Ti | not listed | 2.79 ± 0.55 b |
| PA3 | Ti | not listed | 2.76 ± 0.43 b |
| PA4 | Ti | not listed | 0.22 ± 0.02 b |
| PA5 | Ti | not listed | 1.67 ± 0.23 b |
| SK1 | Ag | 2.00 b | 0.181 ± 0.004 b |
| Ti | not listed | 1.31 ± 0.07 b |
Publisher’s Note: MDPI stays neutral with regard to jurisdictional claims in published maps and institutional affiliations. |
© 2020 by the authors. Licensee MDPI, Basel, Switzerland. This article is an open access article distributed under the terms and conditions of the Creative Commons Attribution (CC BY) license (http://creativecommons.org/licenses/by/4.0/).
Share and Cite
Lehutso, R.F.; Tancu, Y.; Maity, A.; Thwala, M. Characterisation of Engineered Nanomaterials in Nano-Enabled Products Exhibiting Priority Environmental Exposure. Molecules 2021, 26, 1370. https://doi.org/10.3390/molecules26051370
Lehutso RF, Tancu Y, Maity A, Thwala M. Characterisation of Engineered Nanomaterials in Nano-Enabled Products Exhibiting Priority Environmental Exposure. Molecules. 2021; 26(5):1370. https://doi.org/10.3390/molecules26051370
Chicago/Turabian StyleLehutso, Raisibe Florence, Yolanda Tancu, Arjun Maity, and Melusi Thwala. 2021. "Characterisation of Engineered Nanomaterials in Nano-Enabled Products Exhibiting Priority Environmental Exposure" Molecules 26, no. 5: 1370. https://doi.org/10.3390/molecules26051370