
In Vitro Study of the Fibrinolytic Activity via Single Chain Urokinase-Type Plasminogen Activator and Molecular Docking of FGFC1

 ,
,
Abstract
:1. Introduction
2. Results
2.1. Fibrinolytic Characterization of FGFC1
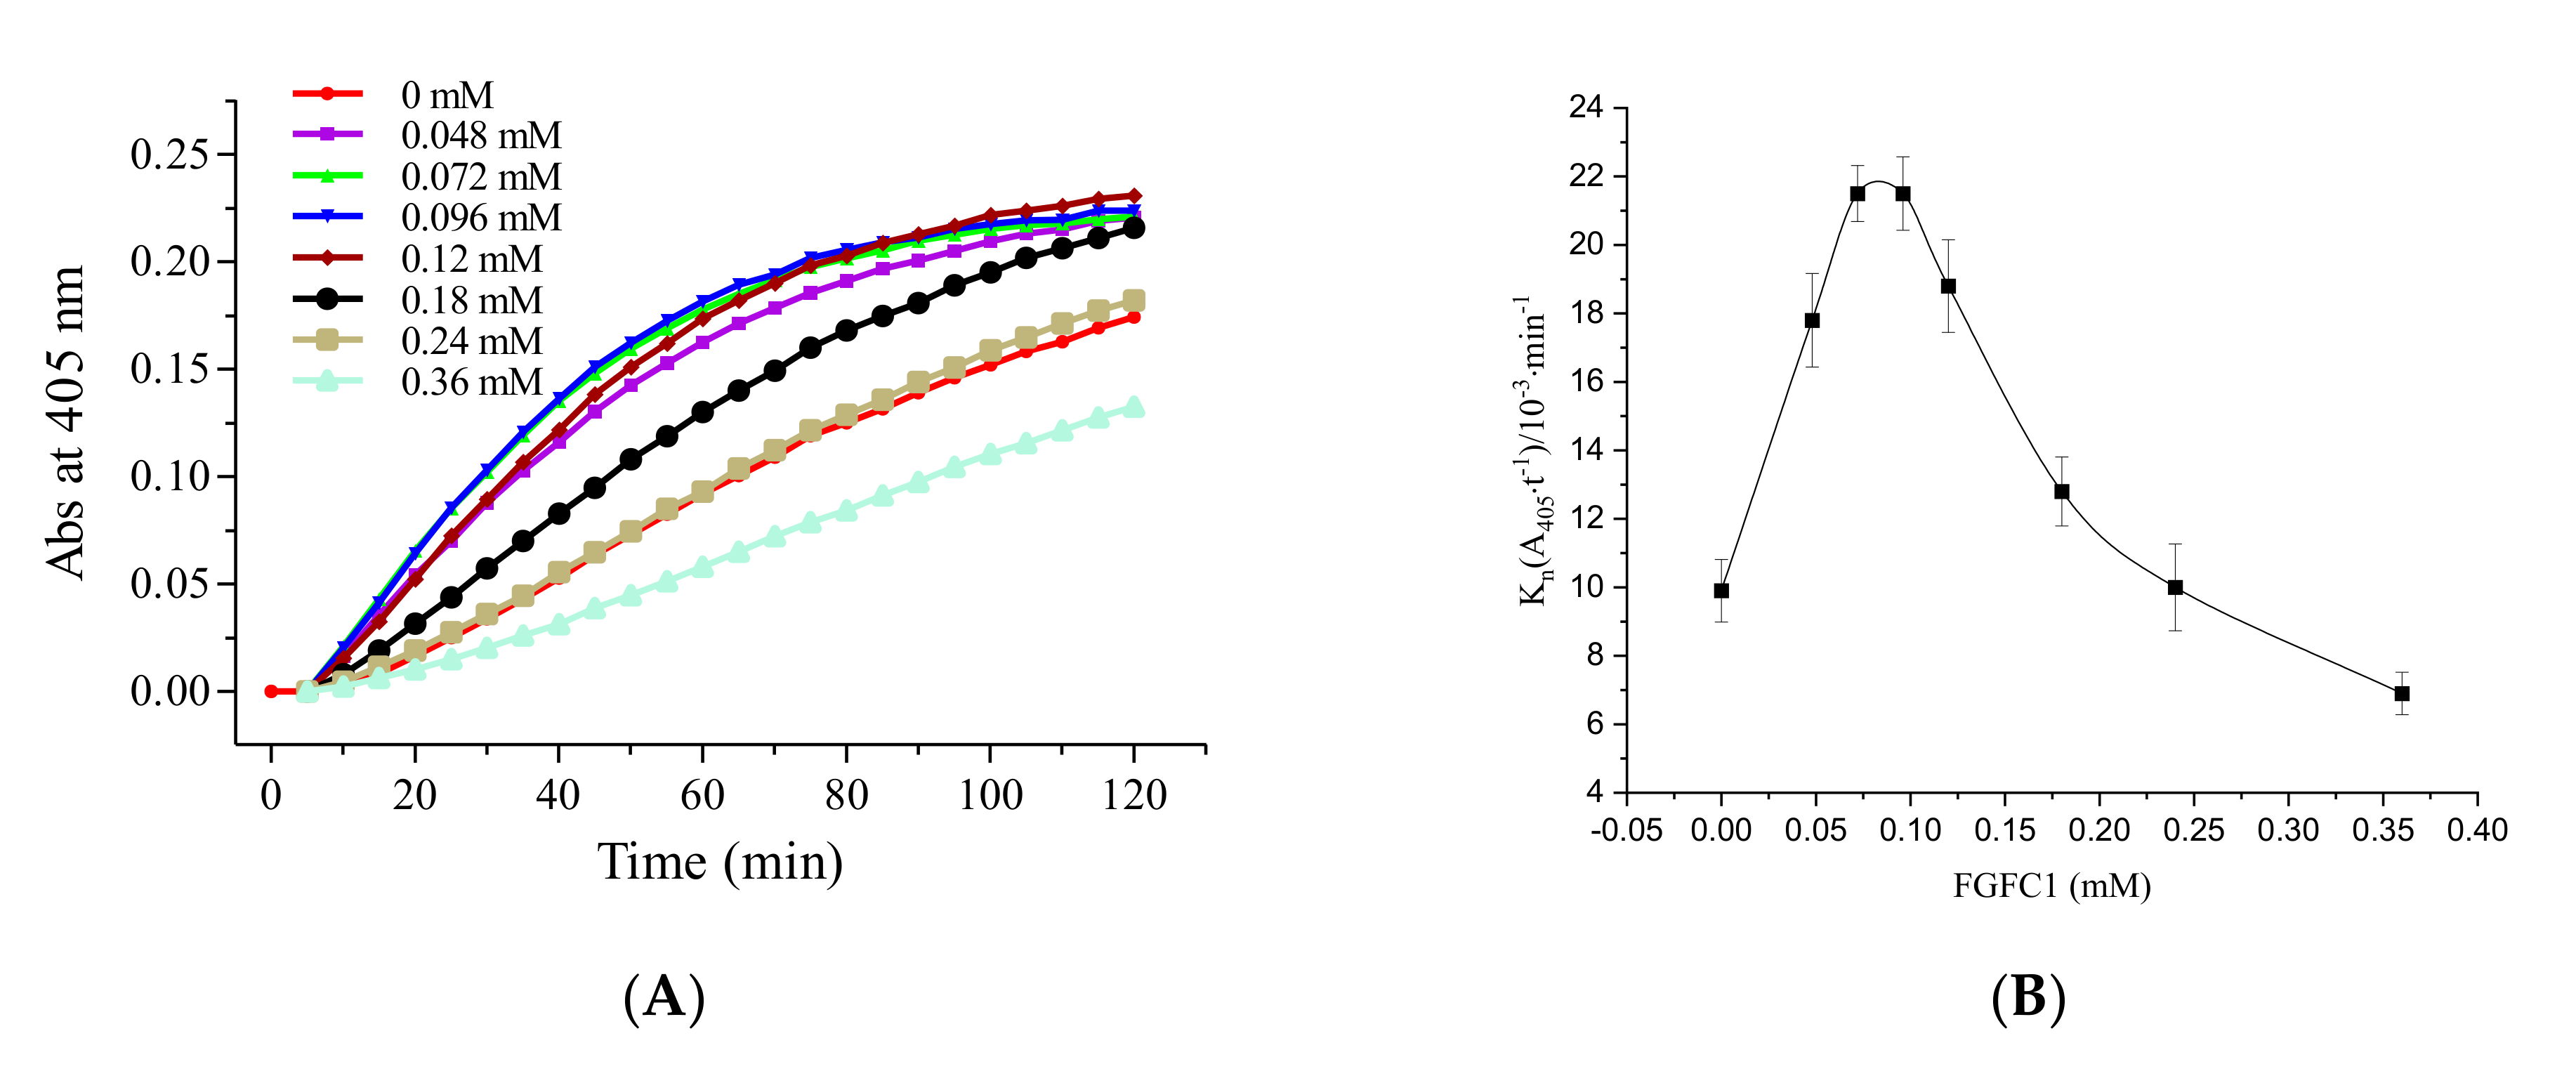
2.1.1. The Role of Pro-uPA in the Fibrinolytic Activity of FGFC1
2.1.2. The Role of Glu-Plasminogen in the Fibrinolytic Activity of FGFC1
2.1.3. The Fibrinolytic Characterization of FGFC1 Mediated by Pro-uPA and Glu-Plasminogen
2.1.4. The Fibrinolytic Characterization of FGFC1 Mediated by Pro-uPA and Lys-Plasminogen
2.2. Binding Sites and Mode of Binding between FGFC1 and Plasminogen
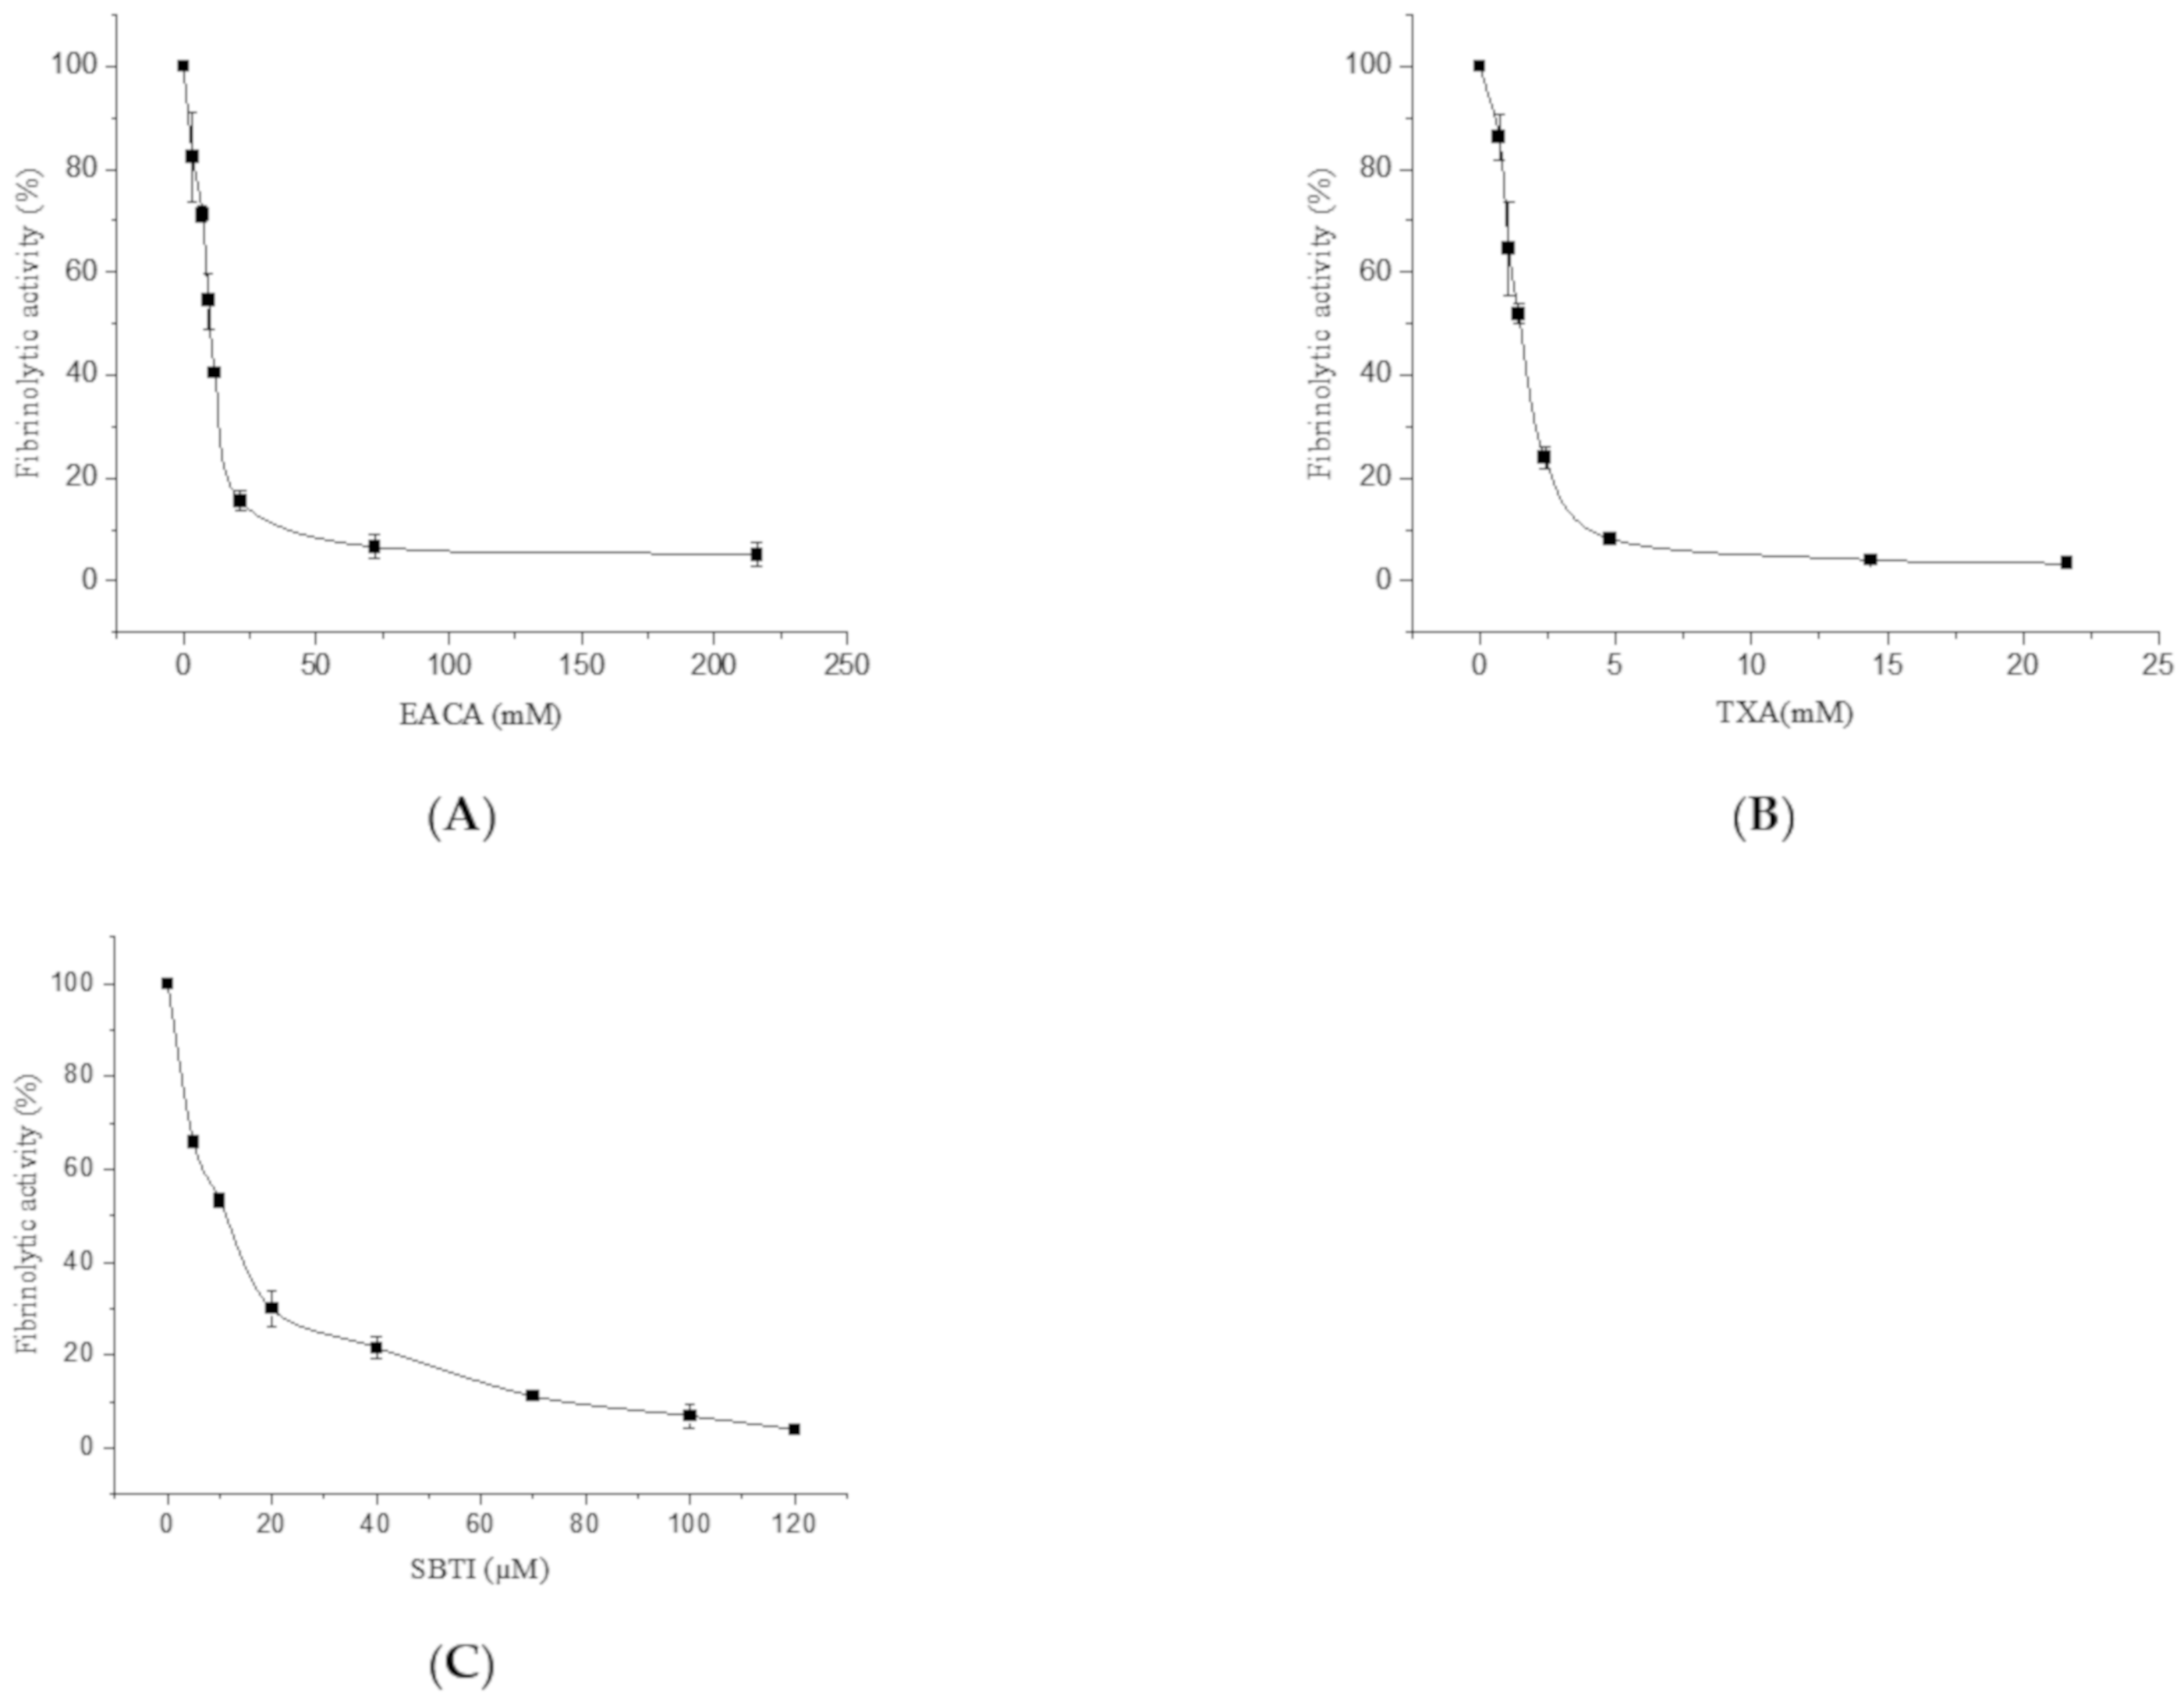
2.2.1. The Effect of EACA, TXA, and Soybean Trypsin Inhibitor (SBTI) on the Fibrinolytic Activity of FGFC1
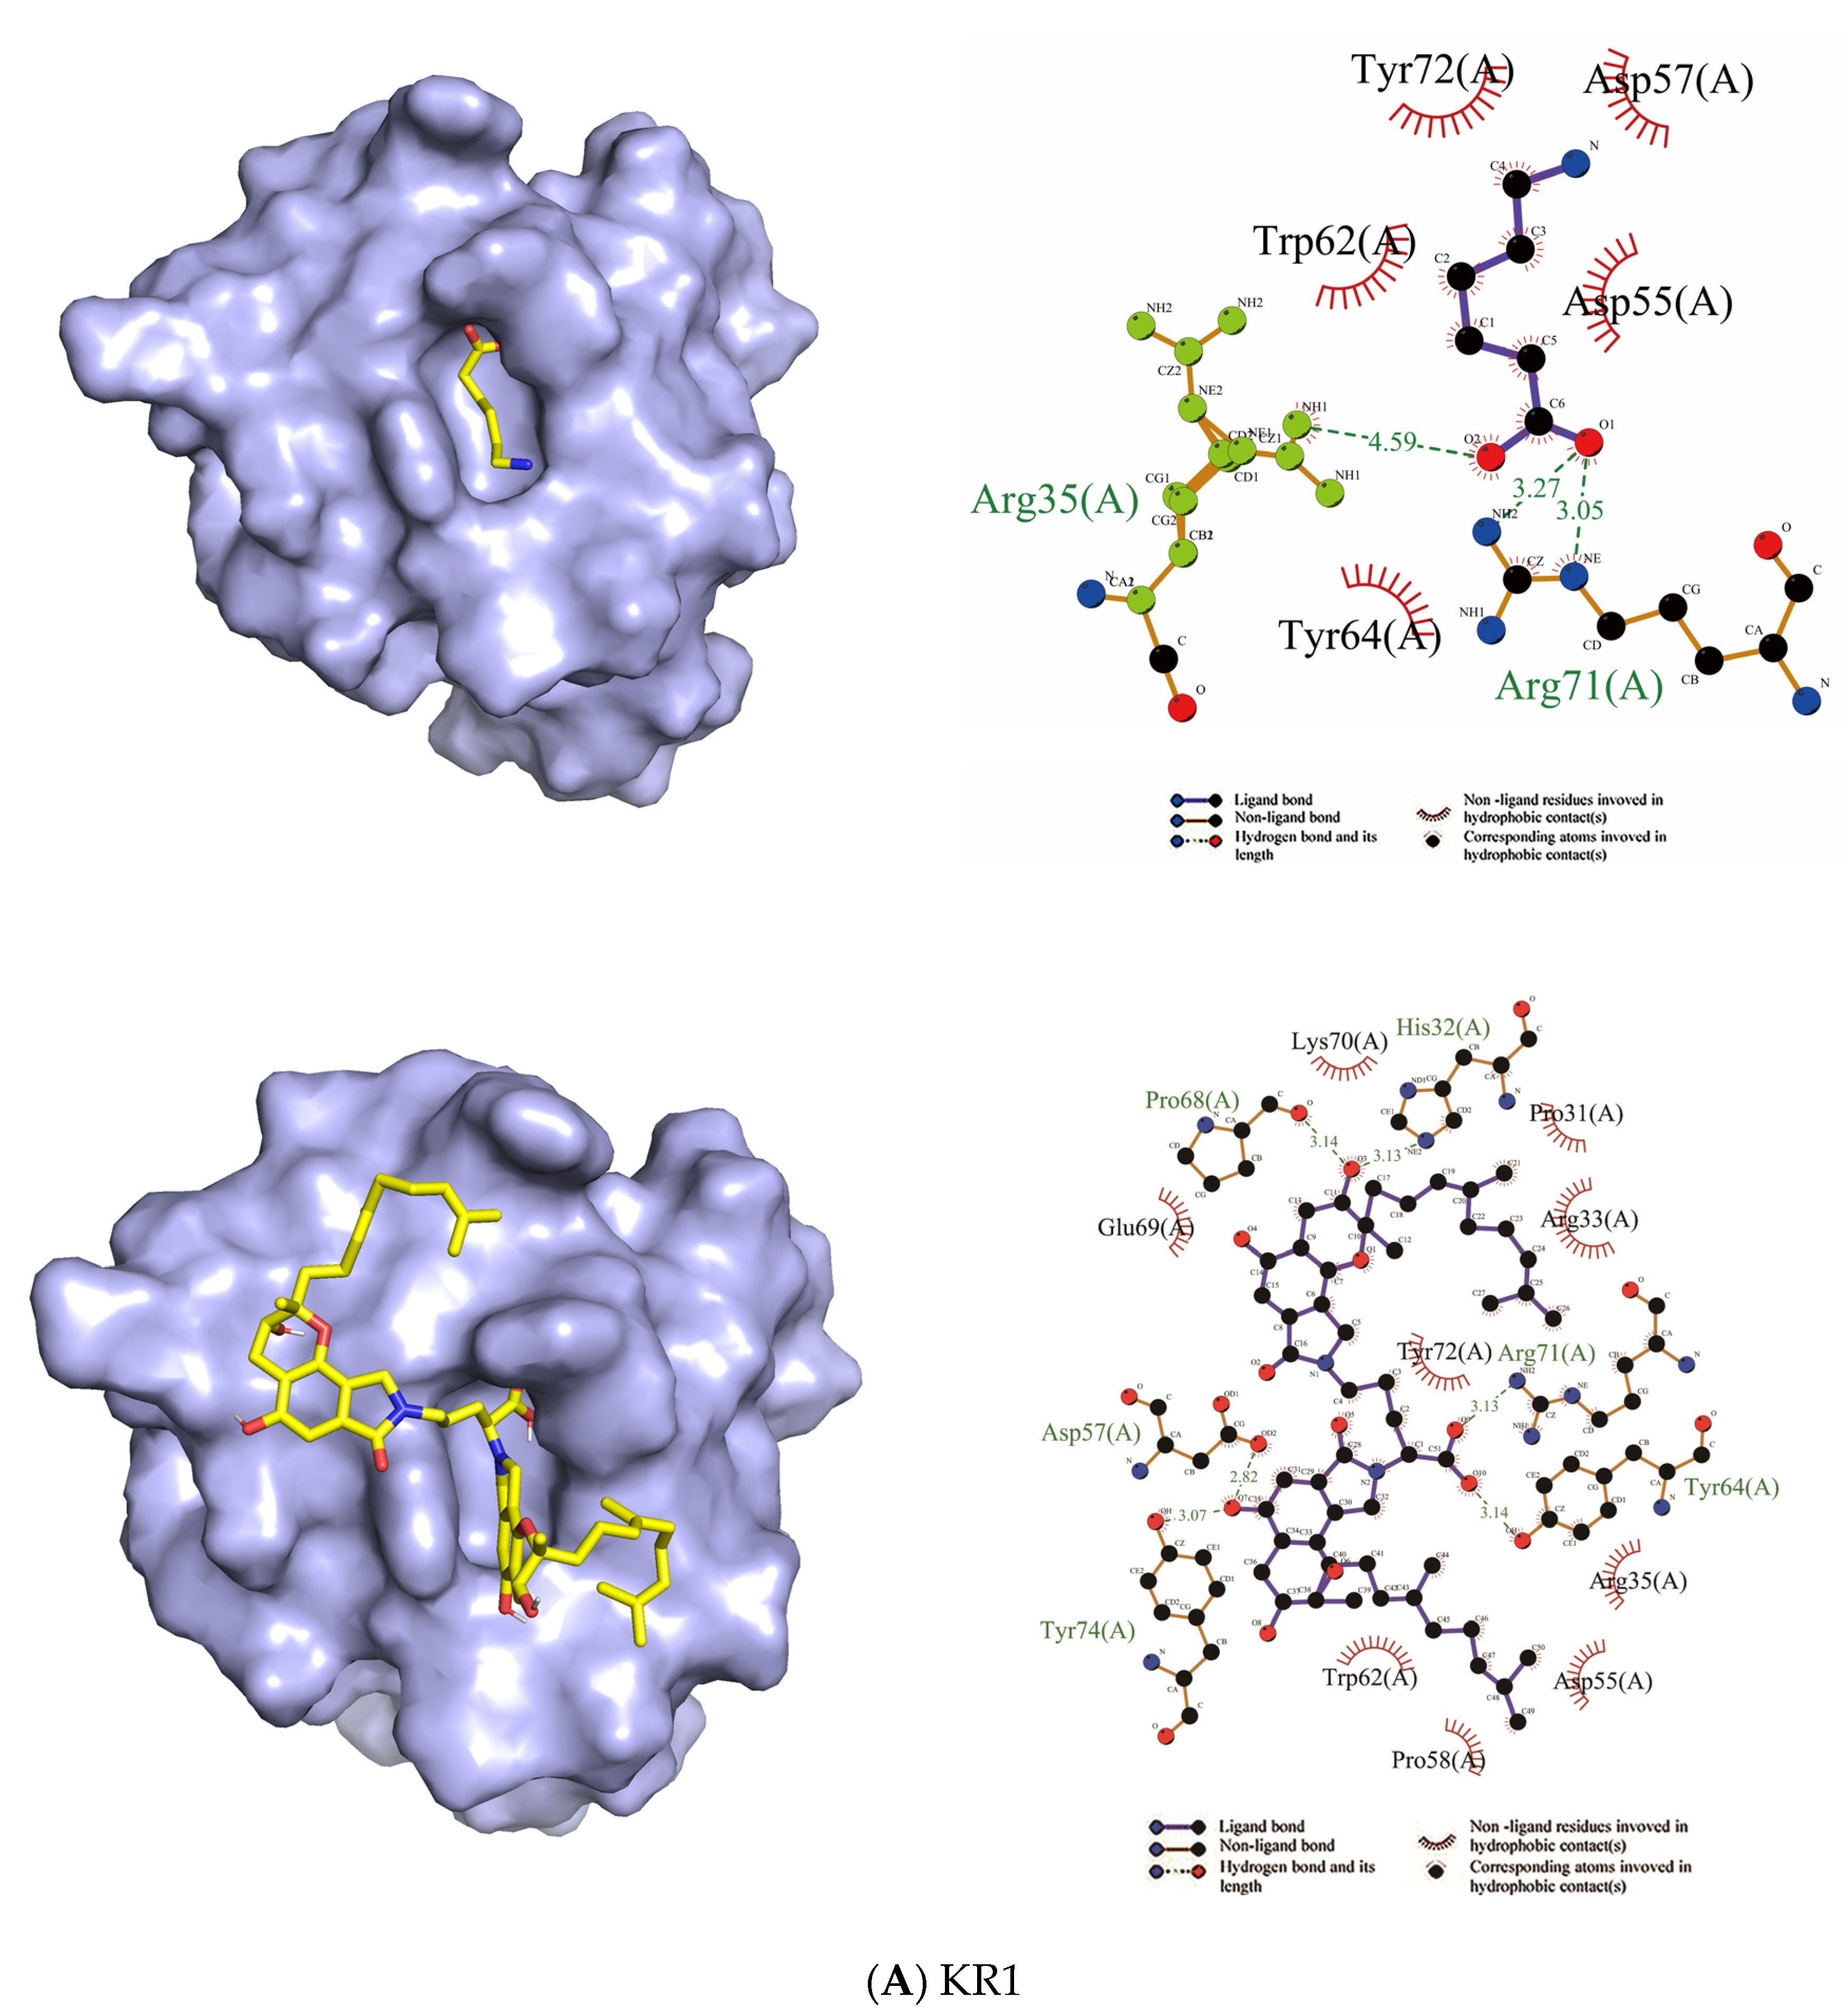
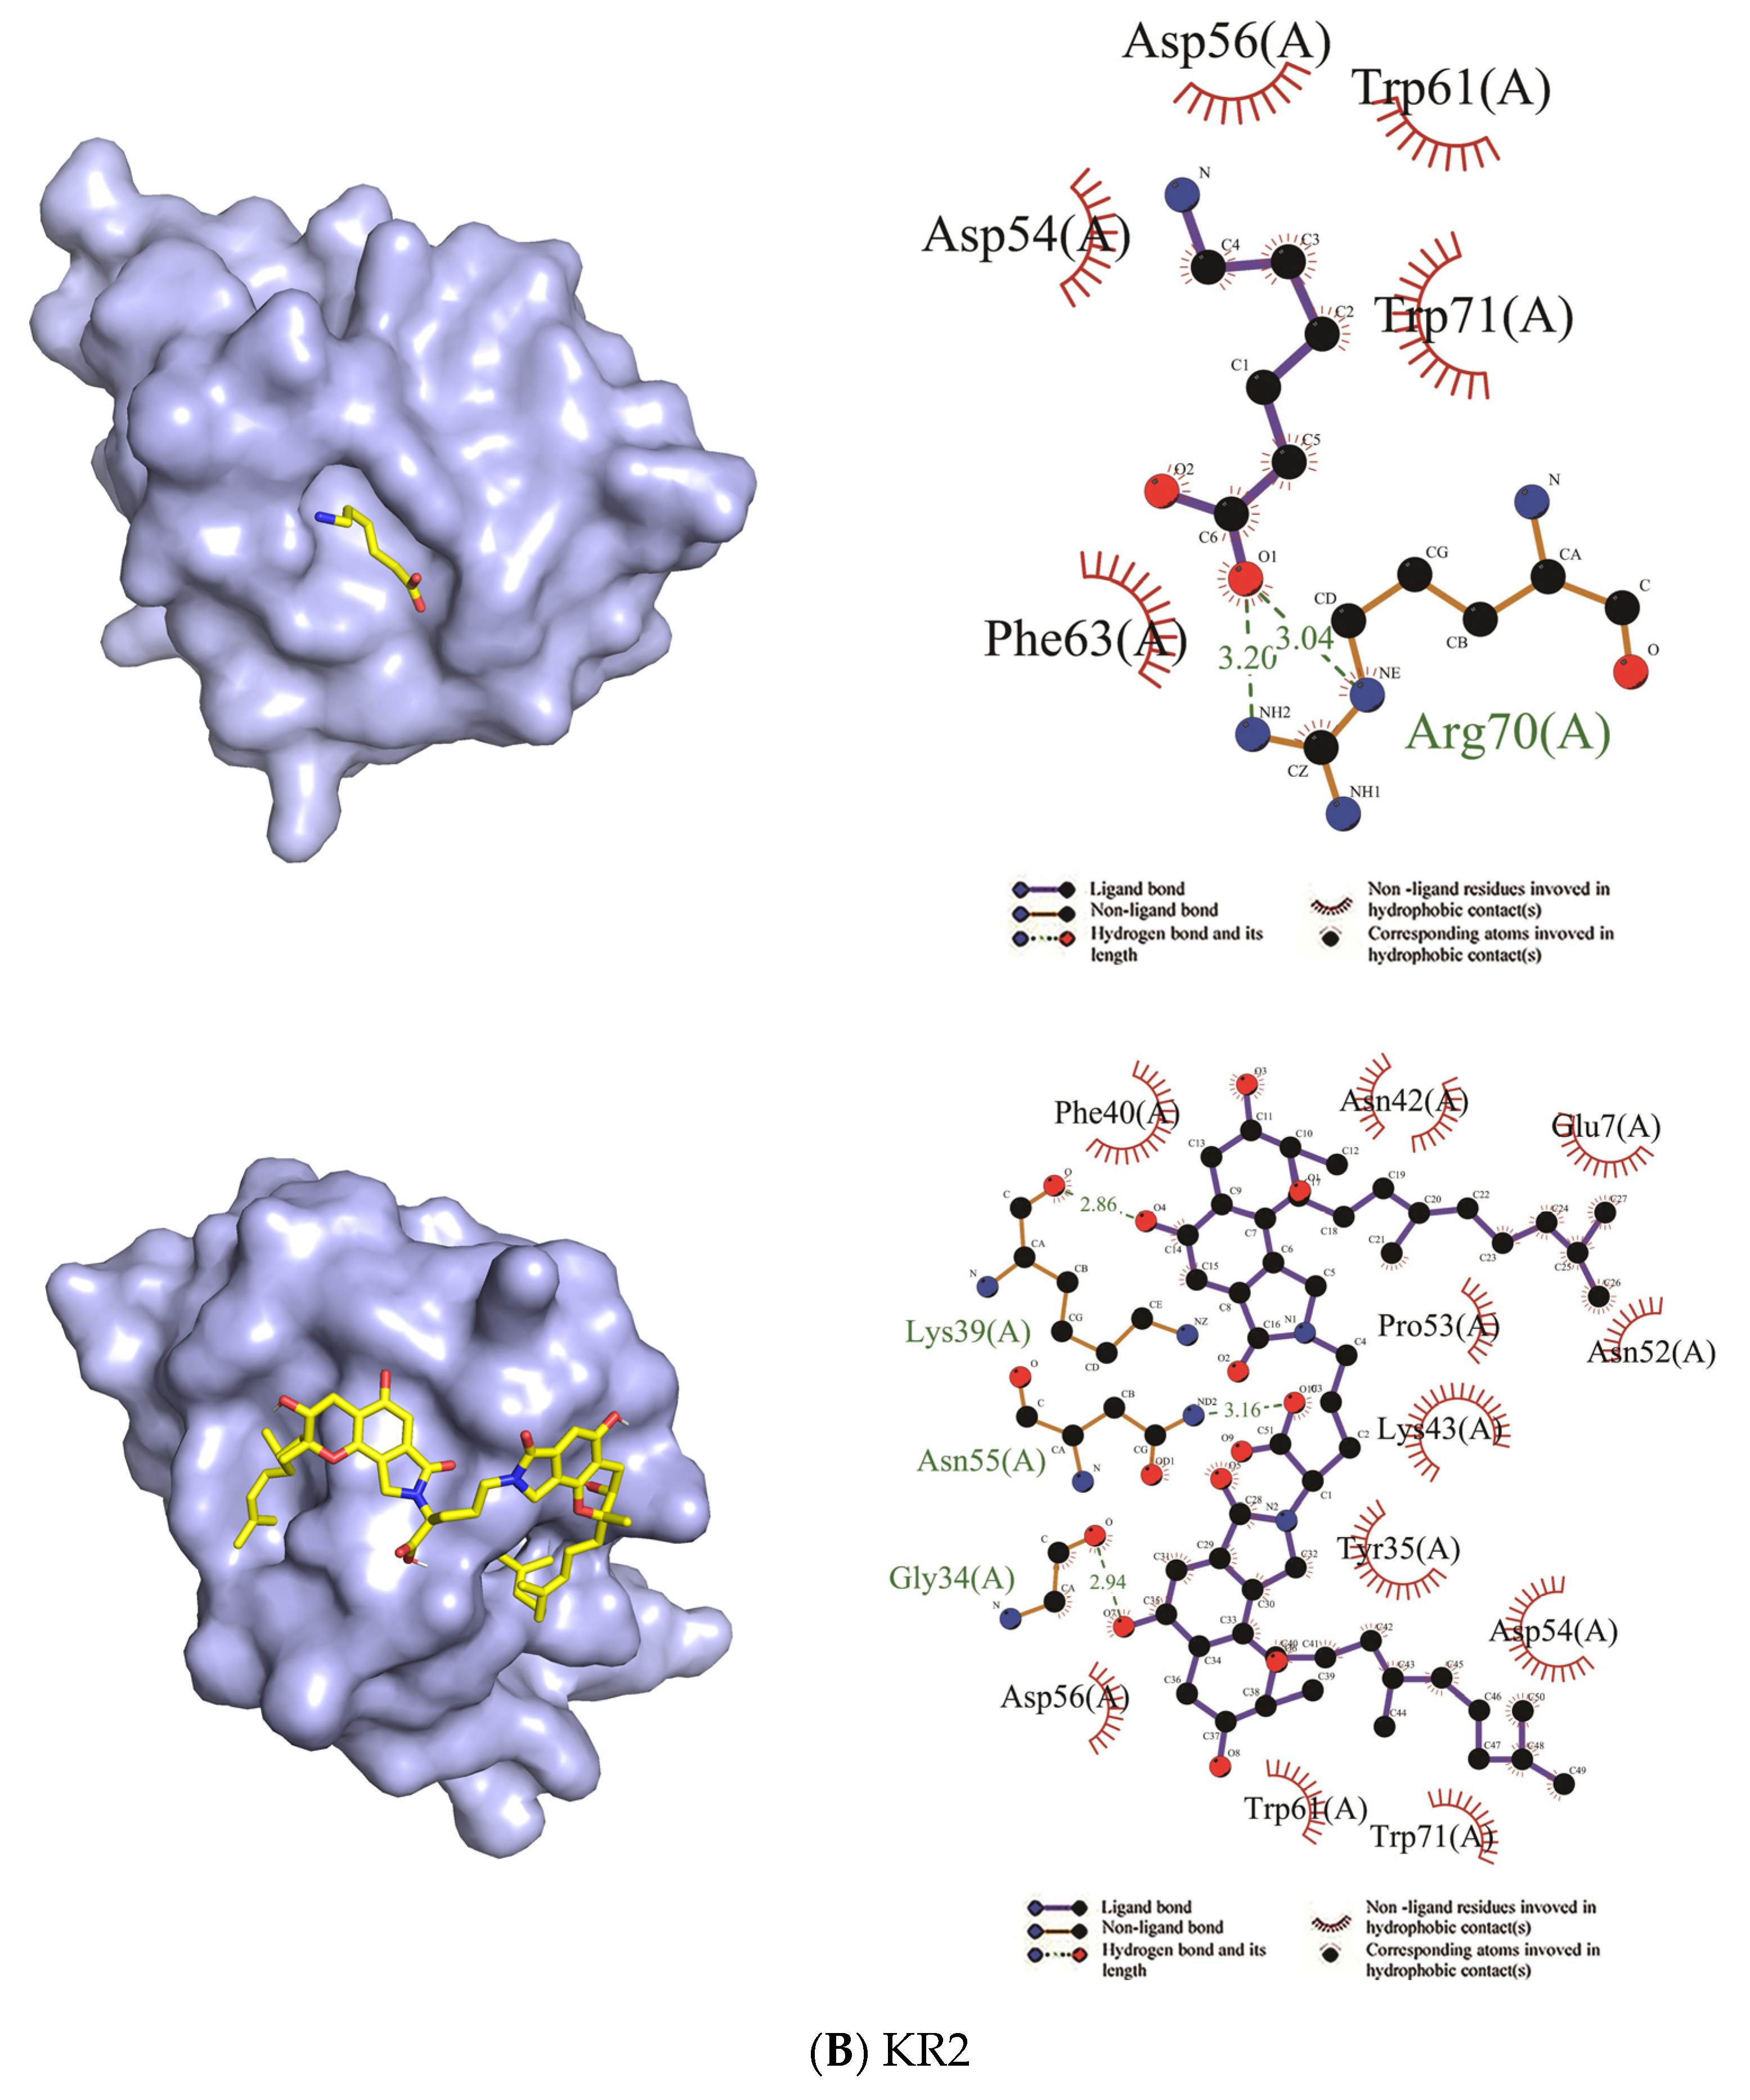
2.2.2. Docking
3. Discussion
4. Materials and Methods
4.1. Materials
4.2. Fibrinolytic Characterization of FGFC1
- (Reaction 1): plasminogen activated to plasmin by pro-uPA;
- (Reaction 2): pro-uPA activated to uPA by plasmin;
- (Reaction 3): substrate S-2444 hydrolyzed by uPA.

4.2.1. The Role of Pro-uPA in the Fibrinolytic Activity of FGFC1
4.2.2. The Role of Glu-Plasminogen in the Fibrinolytic Activity of FGFC1
4.2.3. The FGFC1 Fibrinolytic Characterization by Pro-uPA and Glu-/Lys-Plasminogen
4.3. The Binding Sites and Binding Mode between FGFC1 and Plasminogen
4.3.1. The Effect of EACA, TXA, and SBTI on the Fibrinolytic Activity of FGFC1
4.3.2. Docking
- Step 1. Ligand Pretreatment
- Step 2. Receptor Pretreatment
- Step 3. Preparation of Docking Parameters
- Step 4. Running Molecular Docking and Output Results
- Step 5. Analysis of Docking Results for EACA and FGFC1 to KR1–KR5
Author Contributions
Funding
Institutional Review Board Statement
Informed Consent Statement
Data Availability Statement
Acknowledgments
Conflicts of Interest
Sample Availability
References
- Storti, R.V.; Szwast, A.E. Molecular cloning and characterization of Drosophila genes and their expression during embryonic development and in primary muscle cell cultures. Dev. Biol. 1982, 90, 272–283. [Google Scholar] [CrossRef]
- Schleuning, W.-D.; Kruithof, E.K.O. A comparative study of amyloid-beta (1-42) as a cofactor for plasminogen activation by vampire bat plasminogen activator and recombinant human tissue-type plasminogen activator. Thromb. Haemost. 2004, 92, 559–567. [Google Scholar] [CrossRef] [PubMed]
- Chapin, J.C.; Hajjar, K.A. Fibrinolysis and the control of blood coagulation. Blood Rev. 2015, 29, 17–24. [Google Scholar] [CrossRef] [PubMed] [Green Version]
- Okafor, O.N.; Gorog, D.A. Endogenous Fibrinolysis: An Important Mediator of Thrombus Formation and Cardiovascular Risk. J. Am. Coll. Cardiol. 2015, 65, 1683–1699. [Google Scholar] [CrossRef] [Green Version]
- Lijnen, H. Elements of the fibrinolytic system. Ann. N. Y. Acad. Sci. 2006, 936, 226–236. [Google Scholar] [CrossRef] [PubMed]
- Schuster, V.; Hügle, B.; Tefs, K. Plasminogen deficiency. J. Thromb. Haemost. 2007, 5, 2315–2322. [Google Scholar] [CrossRef]
- Facchinetti, R. The rise of the To-infinitive. Engl. Stud. 2007, 88, 492–494. [Google Scholar] [CrossRef]
- Xue, Y.; Bodin, C.; Olsson, K. Crystal structure of the native plasminogen reveals an activation-resistant compact conformation. J. Thromb. Haemost. 2012, 10, 1385–1396. [Google Scholar] [CrossRef]
- Law, R.H.P.; Abu-Ssaydeh, D.; Whisstock, J.C. New insights into the structure and function of the plasminogen/plasmin system. Curr. Opin. Struct. Biol. 2013, 23, 836–841. [Google Scholar] [CrossRef]
- Hoylaerts, M.; Rijken, D.C.; Lijnen, H.R.; Collen, D. Kinetics of Plasminogen Activation by Tissue Plasminogen Activator-Role of Fibrin. Oral Present. 1981, 46, 162. [Google Scholar] [CrossRef]
- Lucas, M.A.; Fretto, L.J.; Mckee, P.A. The binding of human plasminogen to fibrin and fibrinogen. J. Biol. Chem. 1983, 258, 4249–4256. [Google Scholar] [CrossRef]
- Rijken, D.C.; Lijnen, H.R. New insights into the molecular mechanisms of the fibrinolytic system. J. Thromb. Haemost. 2009, 7, 4–13. [Google Scholar] [CrossRef]
- Law, R.H.; Caradoc Davies, T.T.; Cowieson, N.; Horvath, A.J.; Quek, A.J.; Encarnacao, J.A.; Steer, D.; Cowan, A.; Zhang, Q.; Lu, B.G.; et al. The X-ray Crystal Structure of Full-Length Human Plasminogen. Cell Rep. 2012, 1, 185–190. [Google Scholar] [CrossRef] [Green Version]
- Ponting, C.P.; Marshall, J.M.; Cederholm-Williams, S.A. Plasminogen: A structural review. Blood Coagul. Fibrinolysis 1992, 3, 605–614. [Google Scholar] [CrossRef] [PubMed]
- McCormack, P.L. Tranexamic acid: A review of its use in the treatment of hyperfibrinolysis. Drugs 2012, 72, 585–617. [Google Scholar] [CrossRef] [PubMed]
- Kim, P.Y.; Tieu, L.D.; Stafford, A.R.; Fredenburgh, J.C.; Weitz, J.I. A high affinity interaction of plasminogen with fibrin is not essential for efficient activation by tissue-type plasminogen activator. J. Biol. Chem. 2012, 287, 4652–4661. [Google Scholar] [CrossRef] [PubMed] [Green Version]
- Miles, L.A.; Castellino, F.J.; Gong, Y. Critical Role for Conversion of Glu-Plasminogen to Lys-Plasminogen for Optimal Stimulation of Plasminogen Activation on Cell Surfaces. Trends Cardiovasc. Med. 2003, 13, 21–30. [Google Scholar] [CrossRef]
- Hasumi, K.; Yamamichi, S.; Harada, T. Small-molecule modulators of zymogen activation in the fibrinolytic and coagulation systems. FEBS J. 2010, 277, 3675–3687. [Google Scholar] [CrossRef]
- Su, T.; Wu, W.; Yan, T.; Zhang, C.; Zhu, Q.; Bao, B. Pharmacokinetics and tissue distribution of a novel marine fibrinolytic compound in Wistar rat following intravenous administrations. J. Chromatogr. B Anal. Technol. Biomed. Life Sci. 2013, 942–943, 77–82. [Google Scholar] [CrossRef]
- Yan, T.; Wu, W.; Su, T.; Chen, J.; Zhu, Q.; Zhang, C.; Wang, X.; Bao, B. Effects of a novel marine natural product: Pyrano indolone alkaloid fibrinolytic compound on thrombolysis and hemorrhagic activities in vitro and in vivo. Arch. Pharmacal Res. 2014, 38, 1530–1540. [Google Scholar] [CrossRef]
- Wang, G.; Wu, W.; Zhu, Q.; Fu, S.; Wang, X.; Hong, S.; Guo, R.; Bao, B. Identification and Fibrinolytic Evaluation of an Isoindolone Derivative Isolated from a Rare Marine FungusStachybotrys longisporaFG216. Chin. J. Chem. 2015, 33, 1089–1095. [Google Scholar] [CrossRef]
- Shao-Tong, H.; Wen-Hui, W.U.; Yu, Z.; Ting, Y.; Yin, Z.; Bin, B. Effect of indolone compound from marine microbial sources on conformation characteristics of fibrinolytic activity factors. Chin. J. Mar. Drugs 2015. [Google Scholar] [CrossRef]
- Guo, R.; Duan, D.; Hong, S.; Zhou, Y.; Wang, F.; Wang, S.; Wu, W.; Bao, B. A Marine Fibrinolytic Compound FGFC1 Stimulating Enzymatic Kinetic Parameters of a Reciprocal Activation System Based on a Single Chain Urokinase-Type Plasminogen Activator and Plasminogen. Process. Biochem. 2018, 68, 190–196. [Google Scholar] [CrossRef]
- Takayasu, R.; Hasumi, K.; Shinohara, C.; Endo, A. Enhancement of fibrin binding and activation of plasminogen by staplabin through induction of a conformational change in plasminogen. FEBS Lett. 1997, 418, 58–62. [Google Scholar] [CrossRef] [Green Version]
- Vieira, M.L.; Vasconcellos, S.A.; Gonҫales, A.P.; De Morais, Z.M.; Nascimento, A.L.T.O. Plasminogen Acquisition and Activation at the Surface of Leptospira Species Lead to Fibronectin Degradation. Infect. Immun. 2009, 77, 4092–4101. [Google Scholar] [CrossRef] [PubMed] [Green Version]
- Santos, J.V.; Pereira, P.R.; Fernandes, L.G.; Siqueira, G.H.; De Souza, G.O.; Filho, A.S.; Vasconcellos, S.A.; Heinemann, M.B.; Chapola, E.G.; Nascimento, A.L. Binding of human plasminogen by the lipoprotein LipL46 of Leptospira interrogans. Mol. Cell. Probes 2017, 37, 12–21. [Google Scholar] [CrossRef]
- Trott, O.; Olson, A.J. AutoDock Vina: Improving the speed and accuracy of docking with a new scoring function, efficient optimization, and multithreading. J. Comput. Chem. 2010, 31, 455–461. [Google Scholar] [CrossRef] [Green Version]
- Tanchuk, V.Y.; Tanin, V.O.; Vovk, A.I.; Poda, G. A New, Improved Hybrid Scoring Function for Molecular Docking and Scoring Based on AutoDock and AutoDock Vina. Chem. Biol. Drug Des. 2016, 87, 618–625. [Google Scholar] [CrossRef]
- Zajíček, J.; Chang, Y.; Castellino, F.J. The effects of ligand binding on the backbone dynamics of the kringle 1 domain of human plasminogen. J. Mol. Biol. 2000, 301, 333–347. [Google Scholar] [CrossRef]
- Marti, D.N.; Schaller, J.; Llinás, M. Solution structure and dynamics of the plasminogen kringle 2-AMCHA complex: 31-helix in homologous domains. Biochemistry 1999, 38, 15741–15755. [Google Scholar] [CrossRef]
- Wu, T.P.; Padmanabhan, K.; Tulinsky, A.; Mulichak, A.M. The refined structure of the epsilon-aminocaproic acid complex of human plasminogen kringle 4. Biochemistry 1991, 30, 10589–10594. [Google Scholar] [CrossRef] [PubMed]
- Battistel, M.D.; Grishaev, A.; An, S.S.A.; Castellino, F.J.; Llinás, M. Solution structure and functional characterization of human plasminogen kringle 5. Biochemistry 2009, 48, 10208–10219. [Google Scholar] [CrossRef] [PubMed]
- Dejouvencel, T.; Doeuvre, L.; Lacroix, R.; Plawinski, L.; Dignat-George, F.; Lijnen, H.R.; Anglés-Cano, E. Fibrinolytic cross-talk: A new mechanism for plasmin formation. Blood 2010, 115, 2048–2056. [Google Scholar] [CrossRef] [Green Version]
- Wright, H.T. The structural puzzle of how serpin serine proteinase inhibitors work. BioEssays 1996, 18, 453–464. [Google Scholar] [CrossRef] [PubMed]
- Sun, Z.; Chen, Y.-H.; Wang, P.; Zhang, J.; Gurewich, V.; Zhang, P.; Liu, J.-N. The blockage of the high-affinity lysine binding sites of plasminogen by EACA significantly inhibits prourokinase-induced plasminogen activation. Biochim. Biophys. Acta 2002, 1596, 182–192. [Google Scholar] [CrossRef]
- Yin, Y.; Fu, Q.; Wu, W.; Cai, M.; Zhou, X.; Zhang, Y. Producing Novel Fibrinolytic Isoindolinone Derivatives in Marine Fungus Stachybotrys longispora FG216 by the Rational Supply of Amino Compounds According to Its Biosynthesis Pathway. Mar. Drugs 2017, 15, 214. [Google Scholar] [CrossRef] [PubMed]


| FGFC1 | FGFC1 + EACA | FGFC1 + TXA | FGFC1 + SBTI | ||||
|---|---|---|---|---|---|---|---|
| Concentration (mM) | Fibrinolytic Activity (%) | Concentration of EACA (mM) | Fibrinolytic Activity (%) | Concentration of TXA (mM) | Fibrinolytic Activity (%) | Concentration of SBTI (mM) | Fibrinolytic Activity (%) |
| 0 | 100 | 0 | 100 | 0 | 100 | 0 | 100 |
| 0.048 | 139.36 ± 4.6 | 3.6 | 82.35 ± 8.7 | 0.72 | 86.19 ± 4.5 | 5 | 65.83 ± 1.2 |
| 0.072 | 210.64 ± 4.3 | 7.2 | 71.32 ± 1.5 | 1.08 | 64.55 ± 8.9 | 10 | 53.24 ± 1.5 |
| 0.096 | 218.09 ± 6.8 | 9.6 | 54.41 ± 5.4 | 1.44 | 51.87 ± 1.9 | 20 | 29.86 ± 3.9 |
| 0.12 | 207.45 ± 5.8 | 12 | 40.44 ± 0.1 | 2.4 | 23.88 ± 2.1 | 40 | 21.58 ± 2.3 |
| 0.18 | 134.04 ± 4.5 | 21.6 | 15.44 ± 1.9 | 4.8 | 8.21 ± 0.5 | 70 | 11.15 ± 0.6 |
| 0.24 | 98.94 ± 4.1 | 72 | 6.62 ± 2.3 | 14.4 | 4.10 ± 0.6 | 100 | 6.83 ± 2.6 |
| 0.36 | 74.47 ± 3.4 | 216 | 5.15 ± 2.5 | 21.6 | 3.36 ± 0.9 | 120 | 3.96 ± 0.5 |
| Domain | EACA | FGFC1 | ||
|---|---|---|---|---|
| Residues in Hydrophobic Interactions | Residues in Hydrophilic Interactions | Residues in Hydrophobic Interactions | Residues in Hydrophilic Interactions | |
| KR1 | Asp55, Asp57, Tyr64, Tyr72, Trp62 | Arg71, Arg35 | Pro58, Pro31, Trp62, Asp55, Arg35, Arg33, Tyr72, Lys70, Glu69 | His32, Arg71, Tyr64, Tyr74, Pro68, Asp57 |
| KR2 | Asp54, Asp56, Trp61, Trp71, Phe63 | Arg70 | Trp71, Asp54, Tyr35, Lys43, Pro53, Asn52, Glu7, Asn42, Phe40, Asp56, Trp61 | Lys39, Asn55, Gly34 |
| KR3 | Arg36, His33, His64, Trp72, Trp62 | Arg71, Lys57 | Asp81, Leu2, Val17, Lys76, Tyr74, Cys75, Glu73, Trp72, Ala60, Arg59, Thr5 | Ser79, Gly4, Ile 77 |
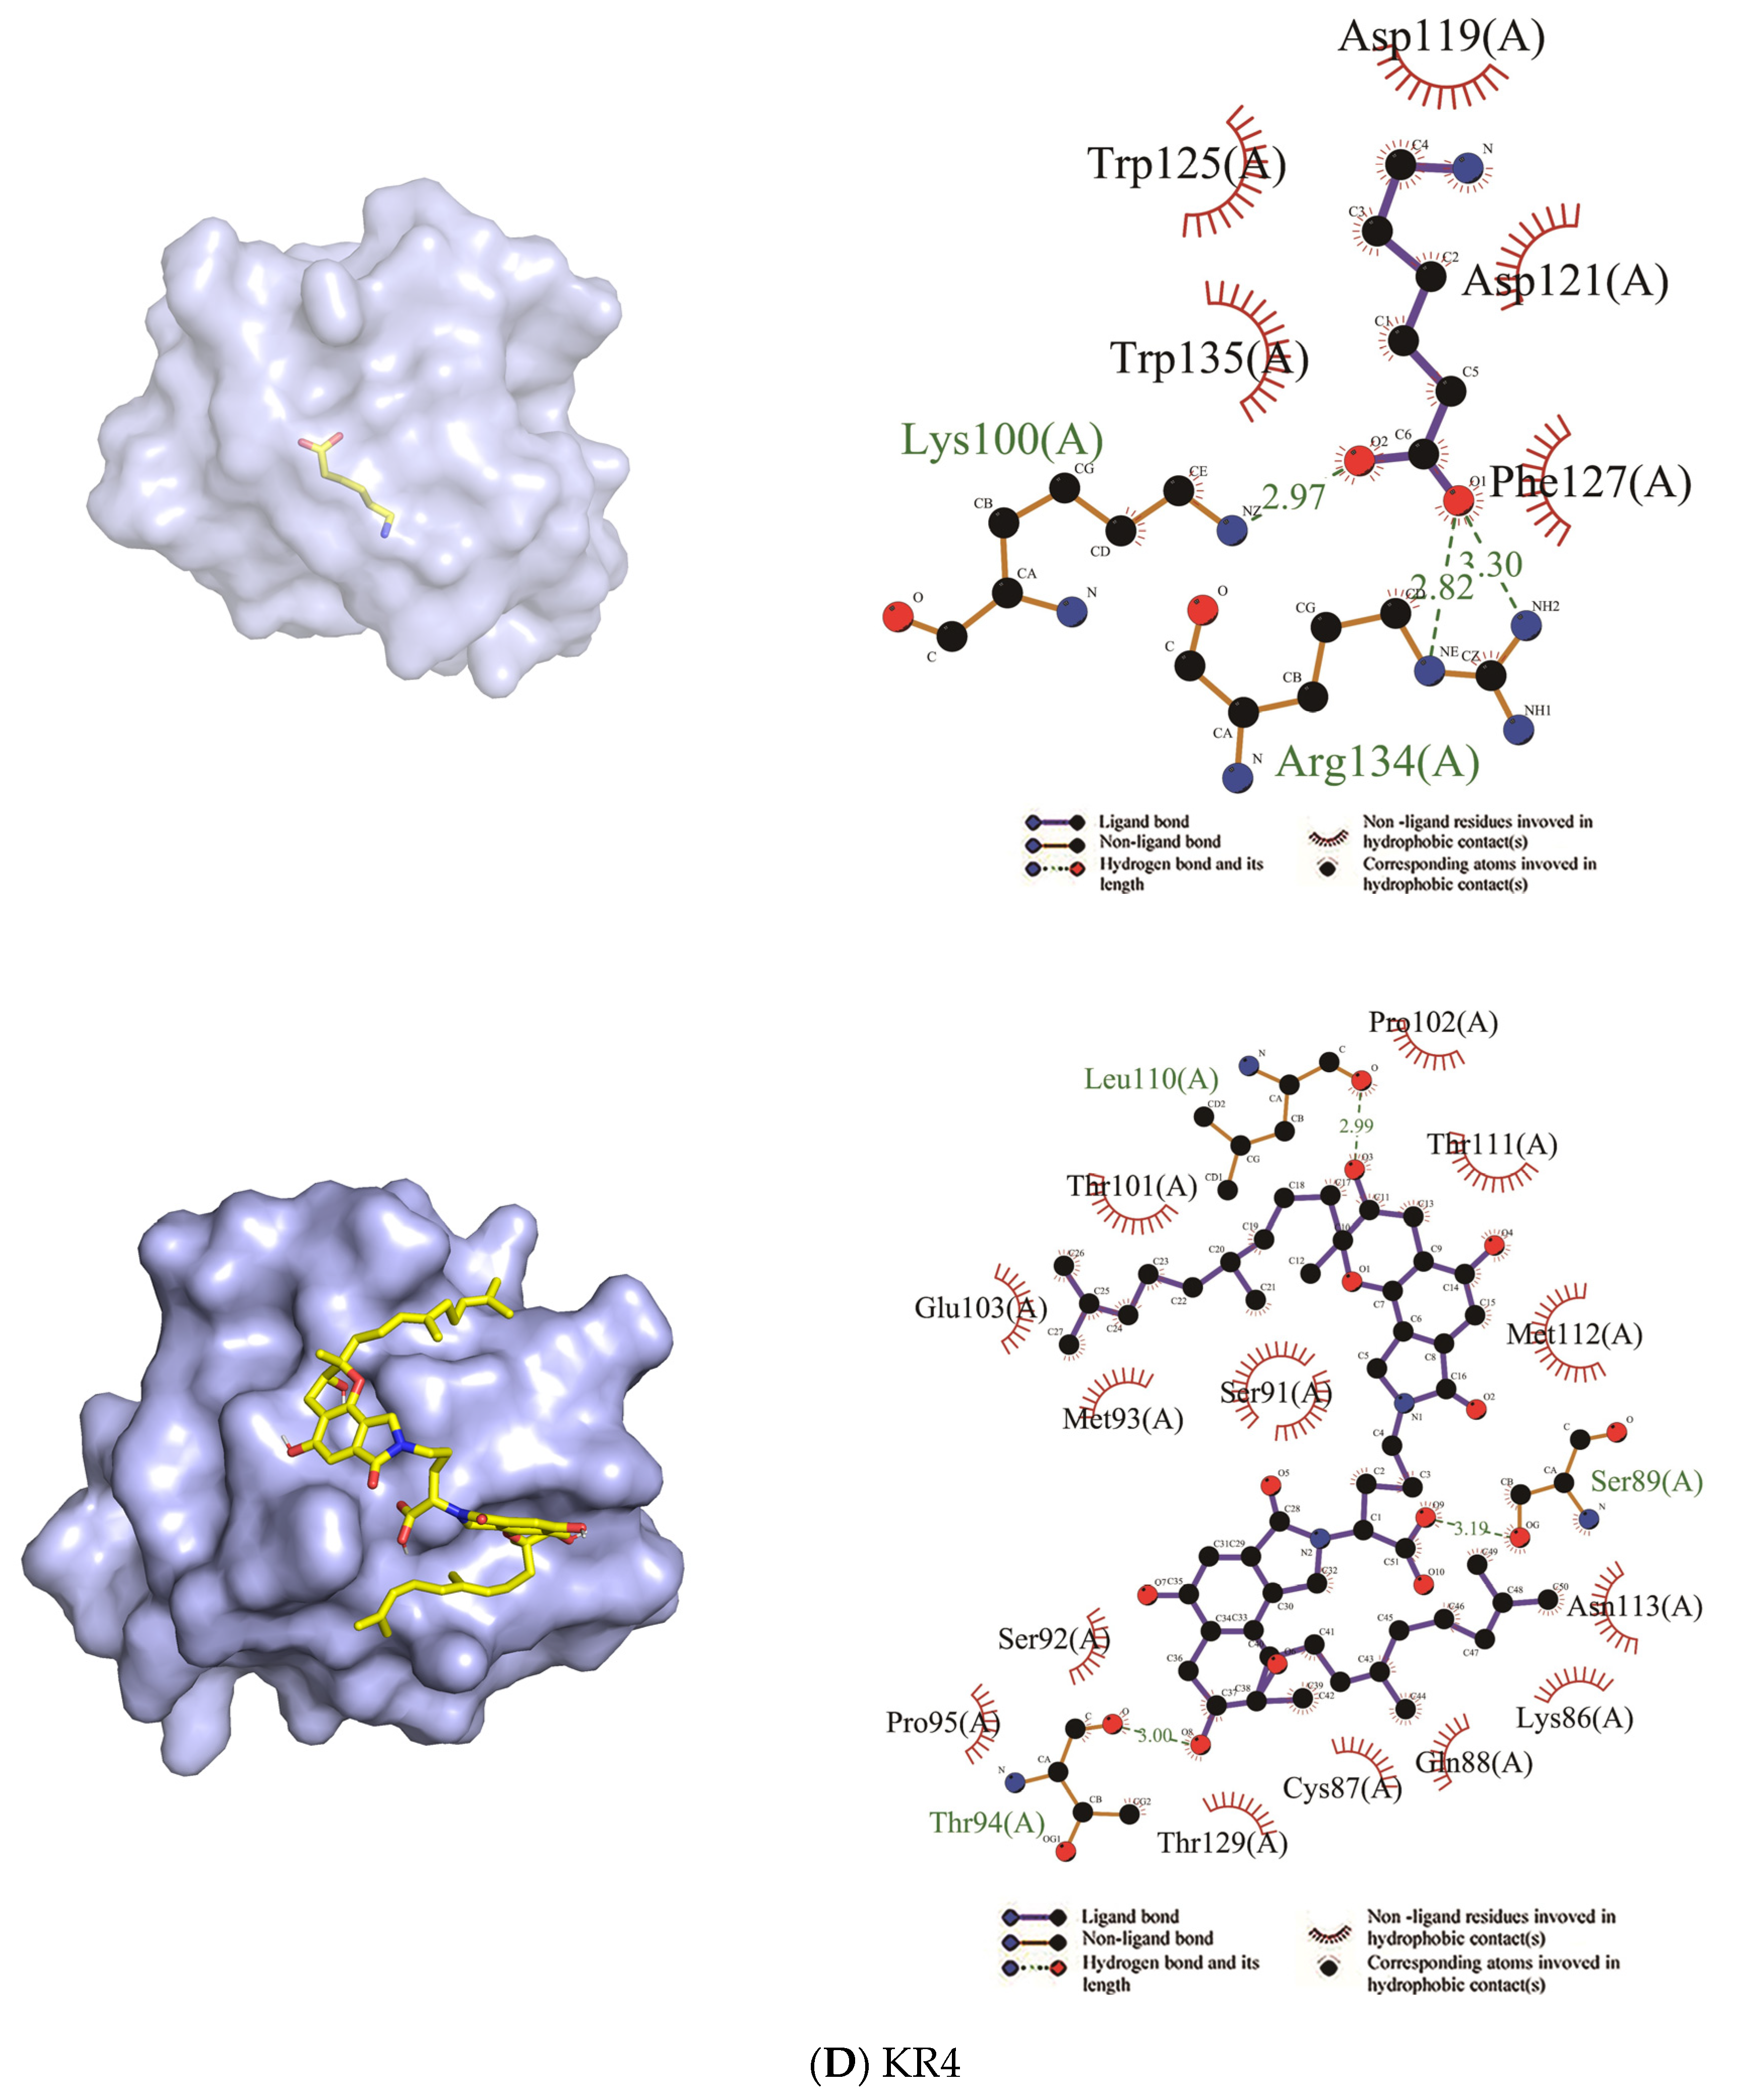
| KR4 | Trp125, Trp135, Asp119, Asp121, Phe127 | Lys100, Arg134 | Ser92, Ser91, Pro95, Thr129, Cys87, Lys86, Asn113, Glu103, Met112, Met93, Gln88, Thr111, Thr101, Pro102 | Thr94, Ser89, Leu110 |
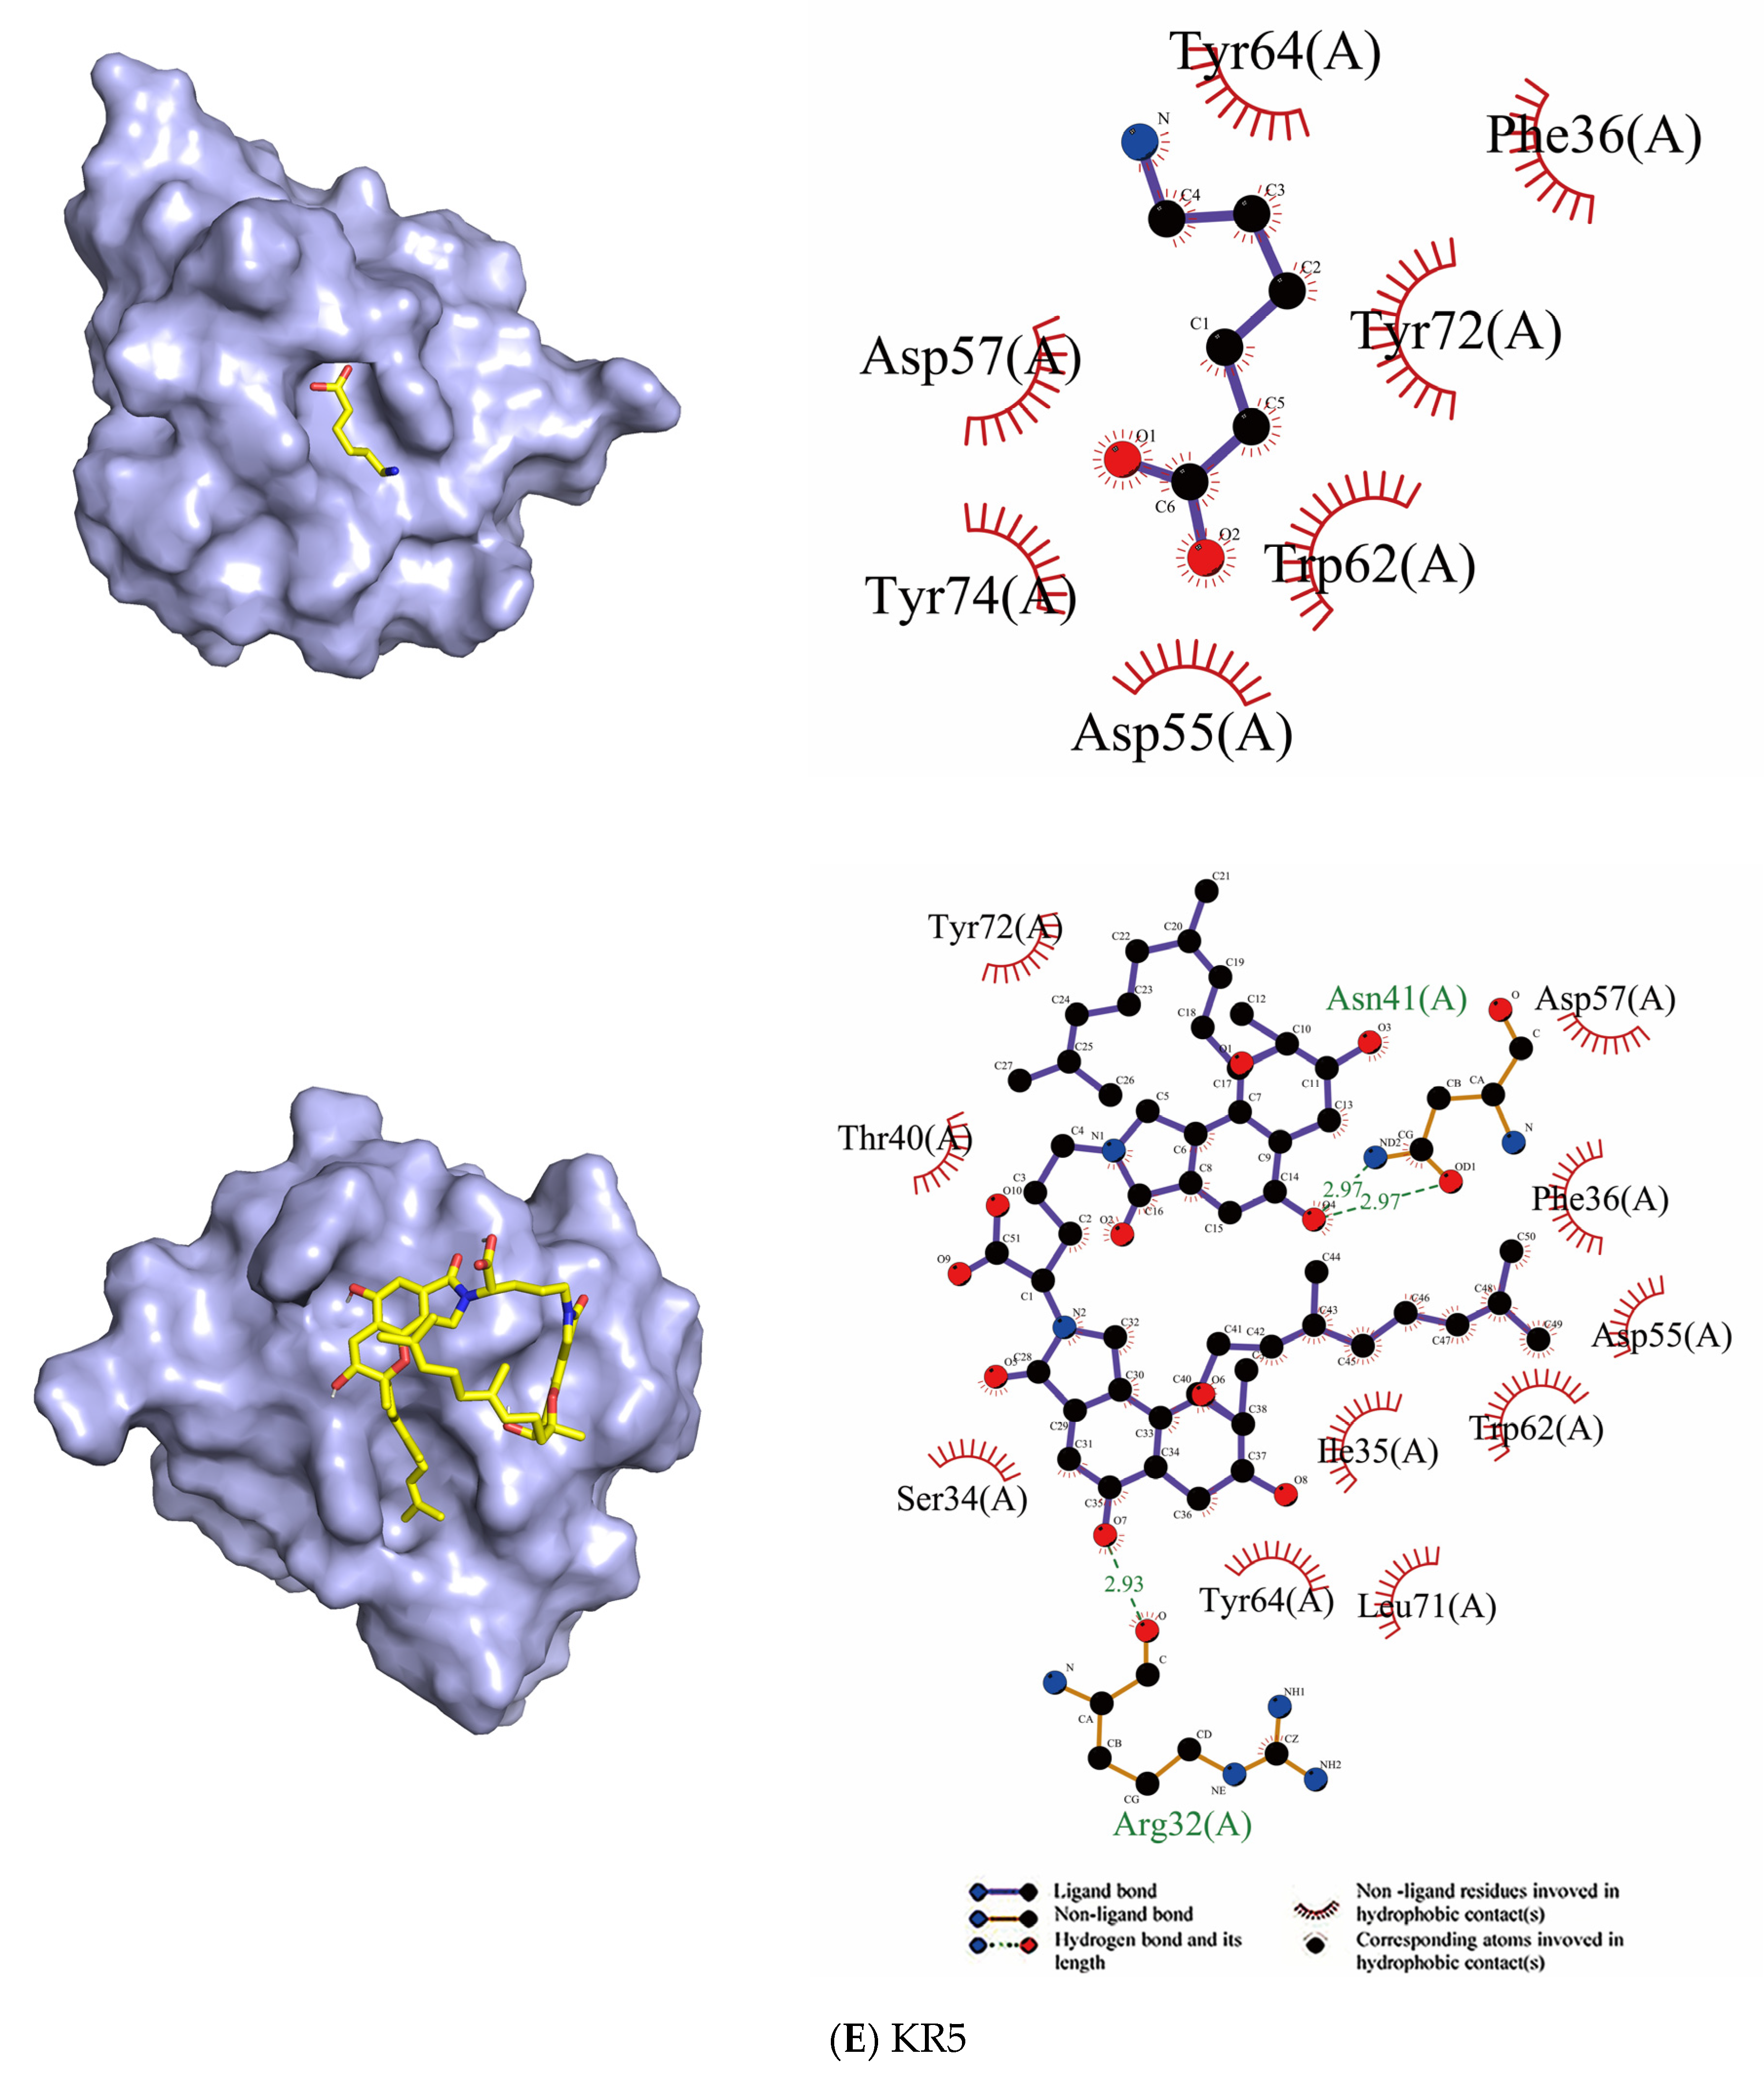
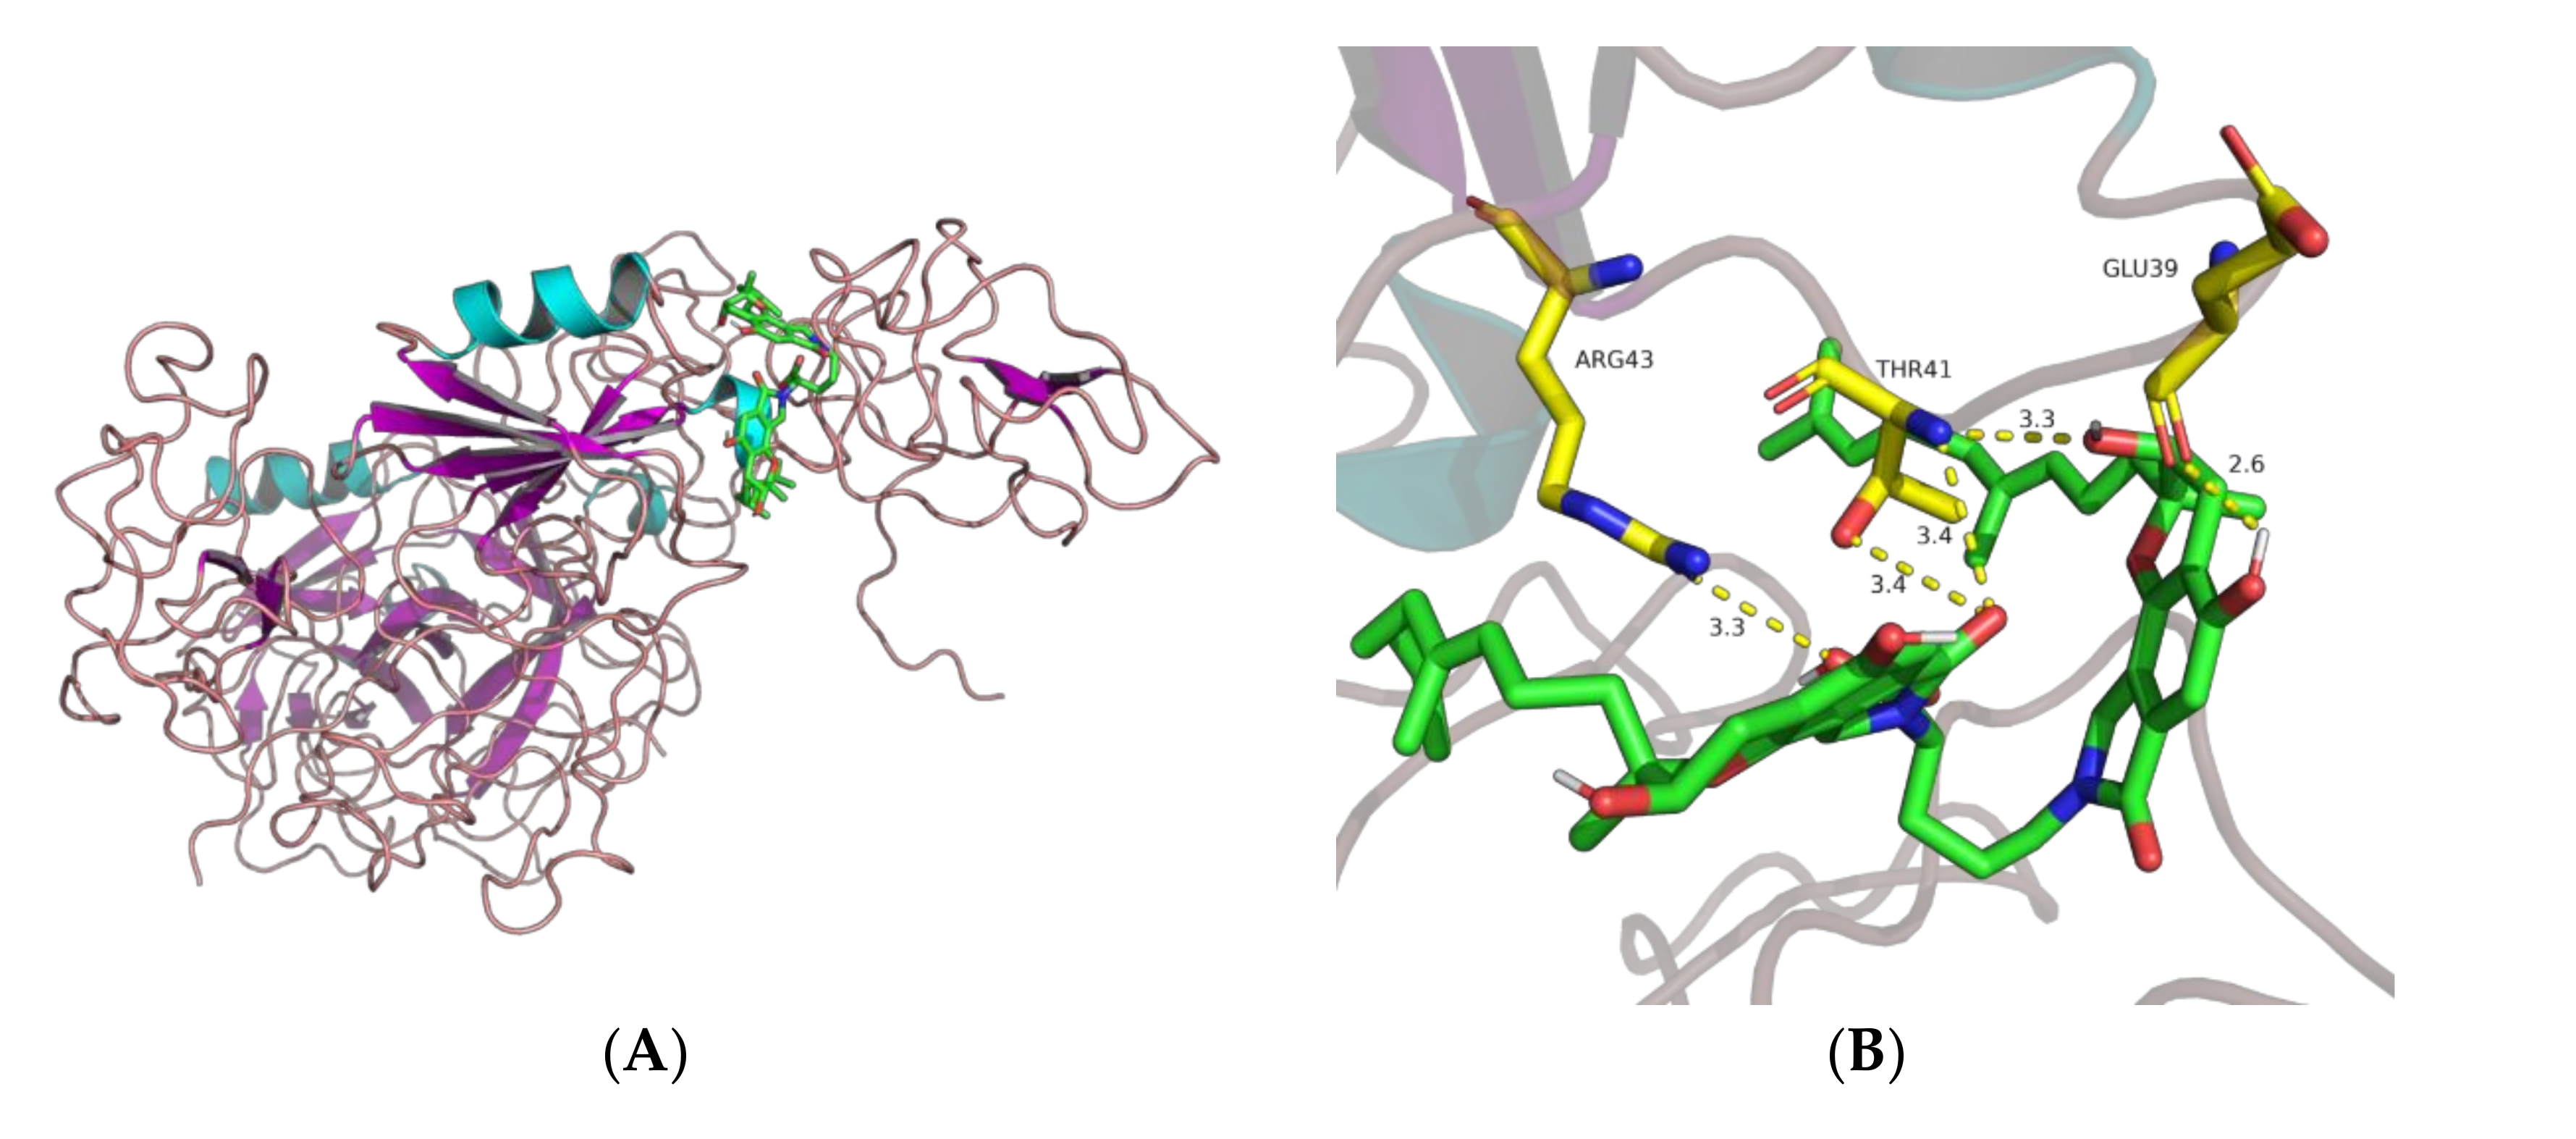
| KR5 | Tyr72, Tyr74, Tyr64, Asp55, Asp57, Trp62, Phe36 | - | Asp57, Asp55, Tyr64, Tyr72, Leu71, Ile35, Trp62, Phe36, Thr40, Ser34 | Asn41, Arg32 |
| Ligand | Receptor | Binding Affinity (kcal/mol) |
|---|---|---|
| EACA | KR1 | −5.2 |
| EACA | KR2 | −4.3 |
| EACA | KR3 | −3.7 |
| EACA | KR4 | −4.5 |
| EACA | KR5 | −4.3 |
| FGFC1 | KR1 | −7.4 |
| FGFC1 | KR2 | −9.0 |
| FGFC1 | KR3 | −6.3 |
| FGFC1 | KR4 | −8.3 |
| FGFC1 | KR5 | −6.7 |
Publisher’s Note: MDPI stays neutral with regard to jurisdictional claims in published maps and institutional affiliations. |
© 2021 by the authors. Licensee MDPI, Basel, Switzerland. This article is an open access article distributed under the terms and conditions of the Creative Commons Attribution (CC BY) license (http://creativecommons.org/licenses/by/4.0/).
Share and Cite
Gao, C.; Shen, Q.; Tang, P.; Cao, Y.; Lin, H.; Li, B.; Sun, P.; Bao, B.; Wu, W. In Vitro Study of the Fibrinolytic Activity via Single Chain Urokinase-Type Plasminogen Activator and Molecular Docking of FGFC1. Molecules 2021, 26, 1816. https://doi.org/10.3390/molecules26071816
Gao C, Shen Q, Tang P, Cao Y, Lin H, Li B, Sun P, Bao B, Wu W. In Vitro Study of the Fibrinolytic Activity via Single Chain Urokinase-Type Plasminogen Activator and Molecular Docking of FGFC1. Molecules. 2021; 26(7):1816. https://doi.org/10.3390/molecules26071816
Chicago/Turabian StyleGao, Chunli, Quan Shen, Pengjie Tang, Yuling Cao, Houwen Lin, Bailin Li, Peng Sun, Bin Bao, and Wenhui Wu. 2021. "In Vitro Study of the Fibrinolytic Activity via Single Chain Urokinase-Type Plasminogen Activator and Molecular Docking of FGFC1" Molecules 26, no. 7: 1816. https://doi.org/10.3390/molecules26071816