
Optical Characterization of Ciprofloxacin Photolytic Degradation by UV-Pulsed Laser Radiation


Abstract
:1. Introduction
2. Results
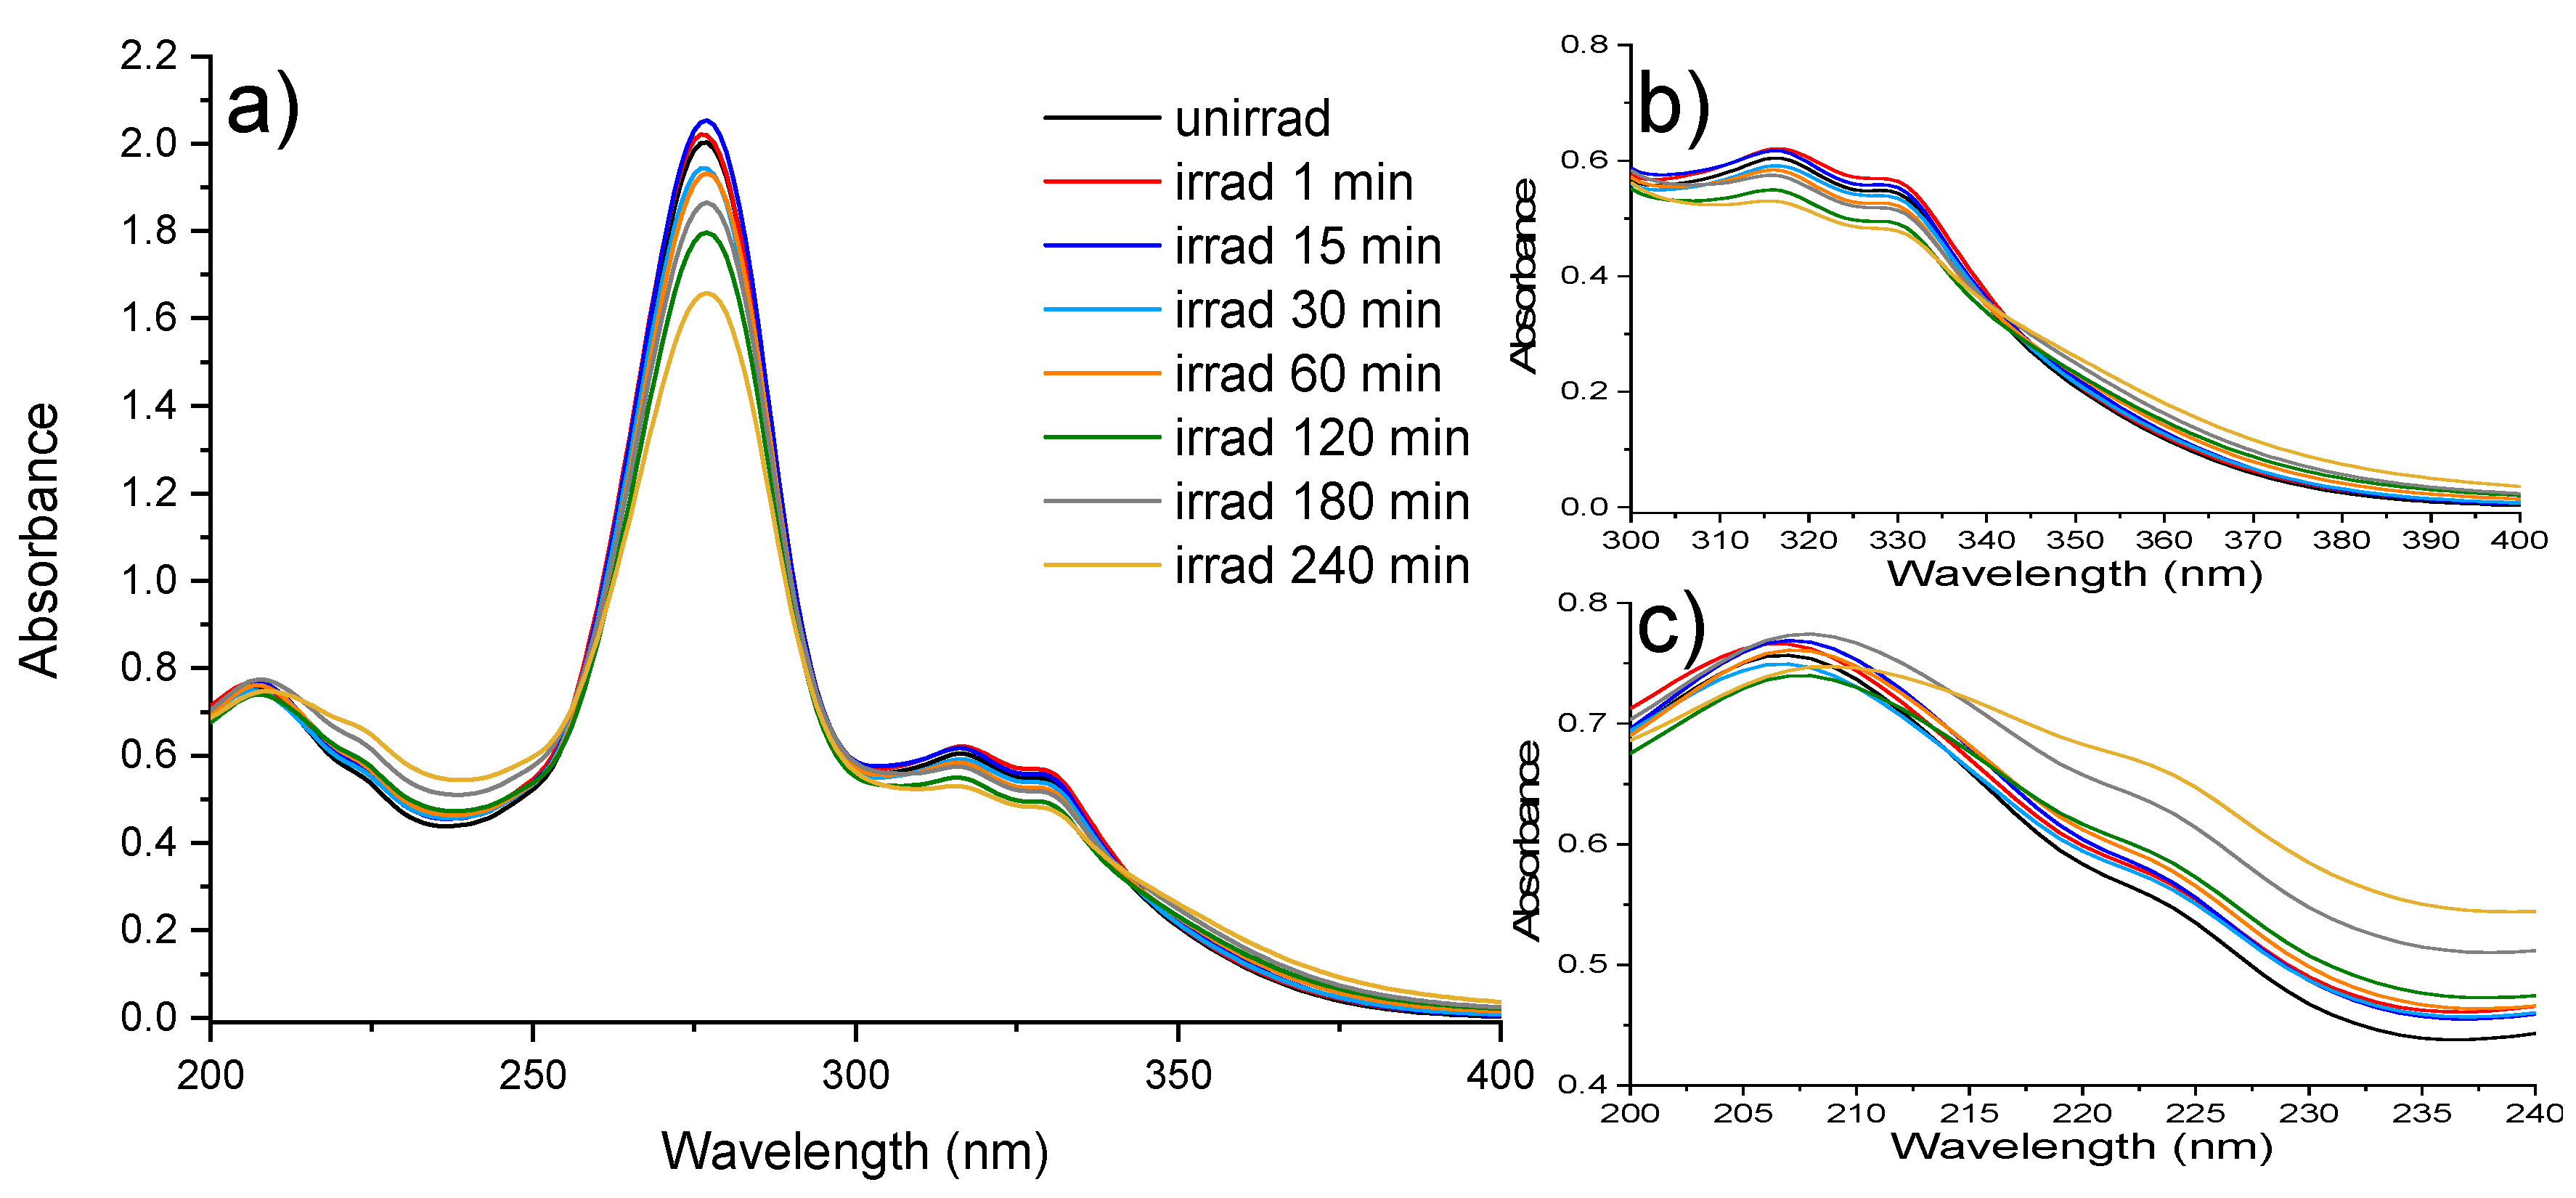
2.1. UV-Vis Absorption Spectroscopy
2.2. PH Assay
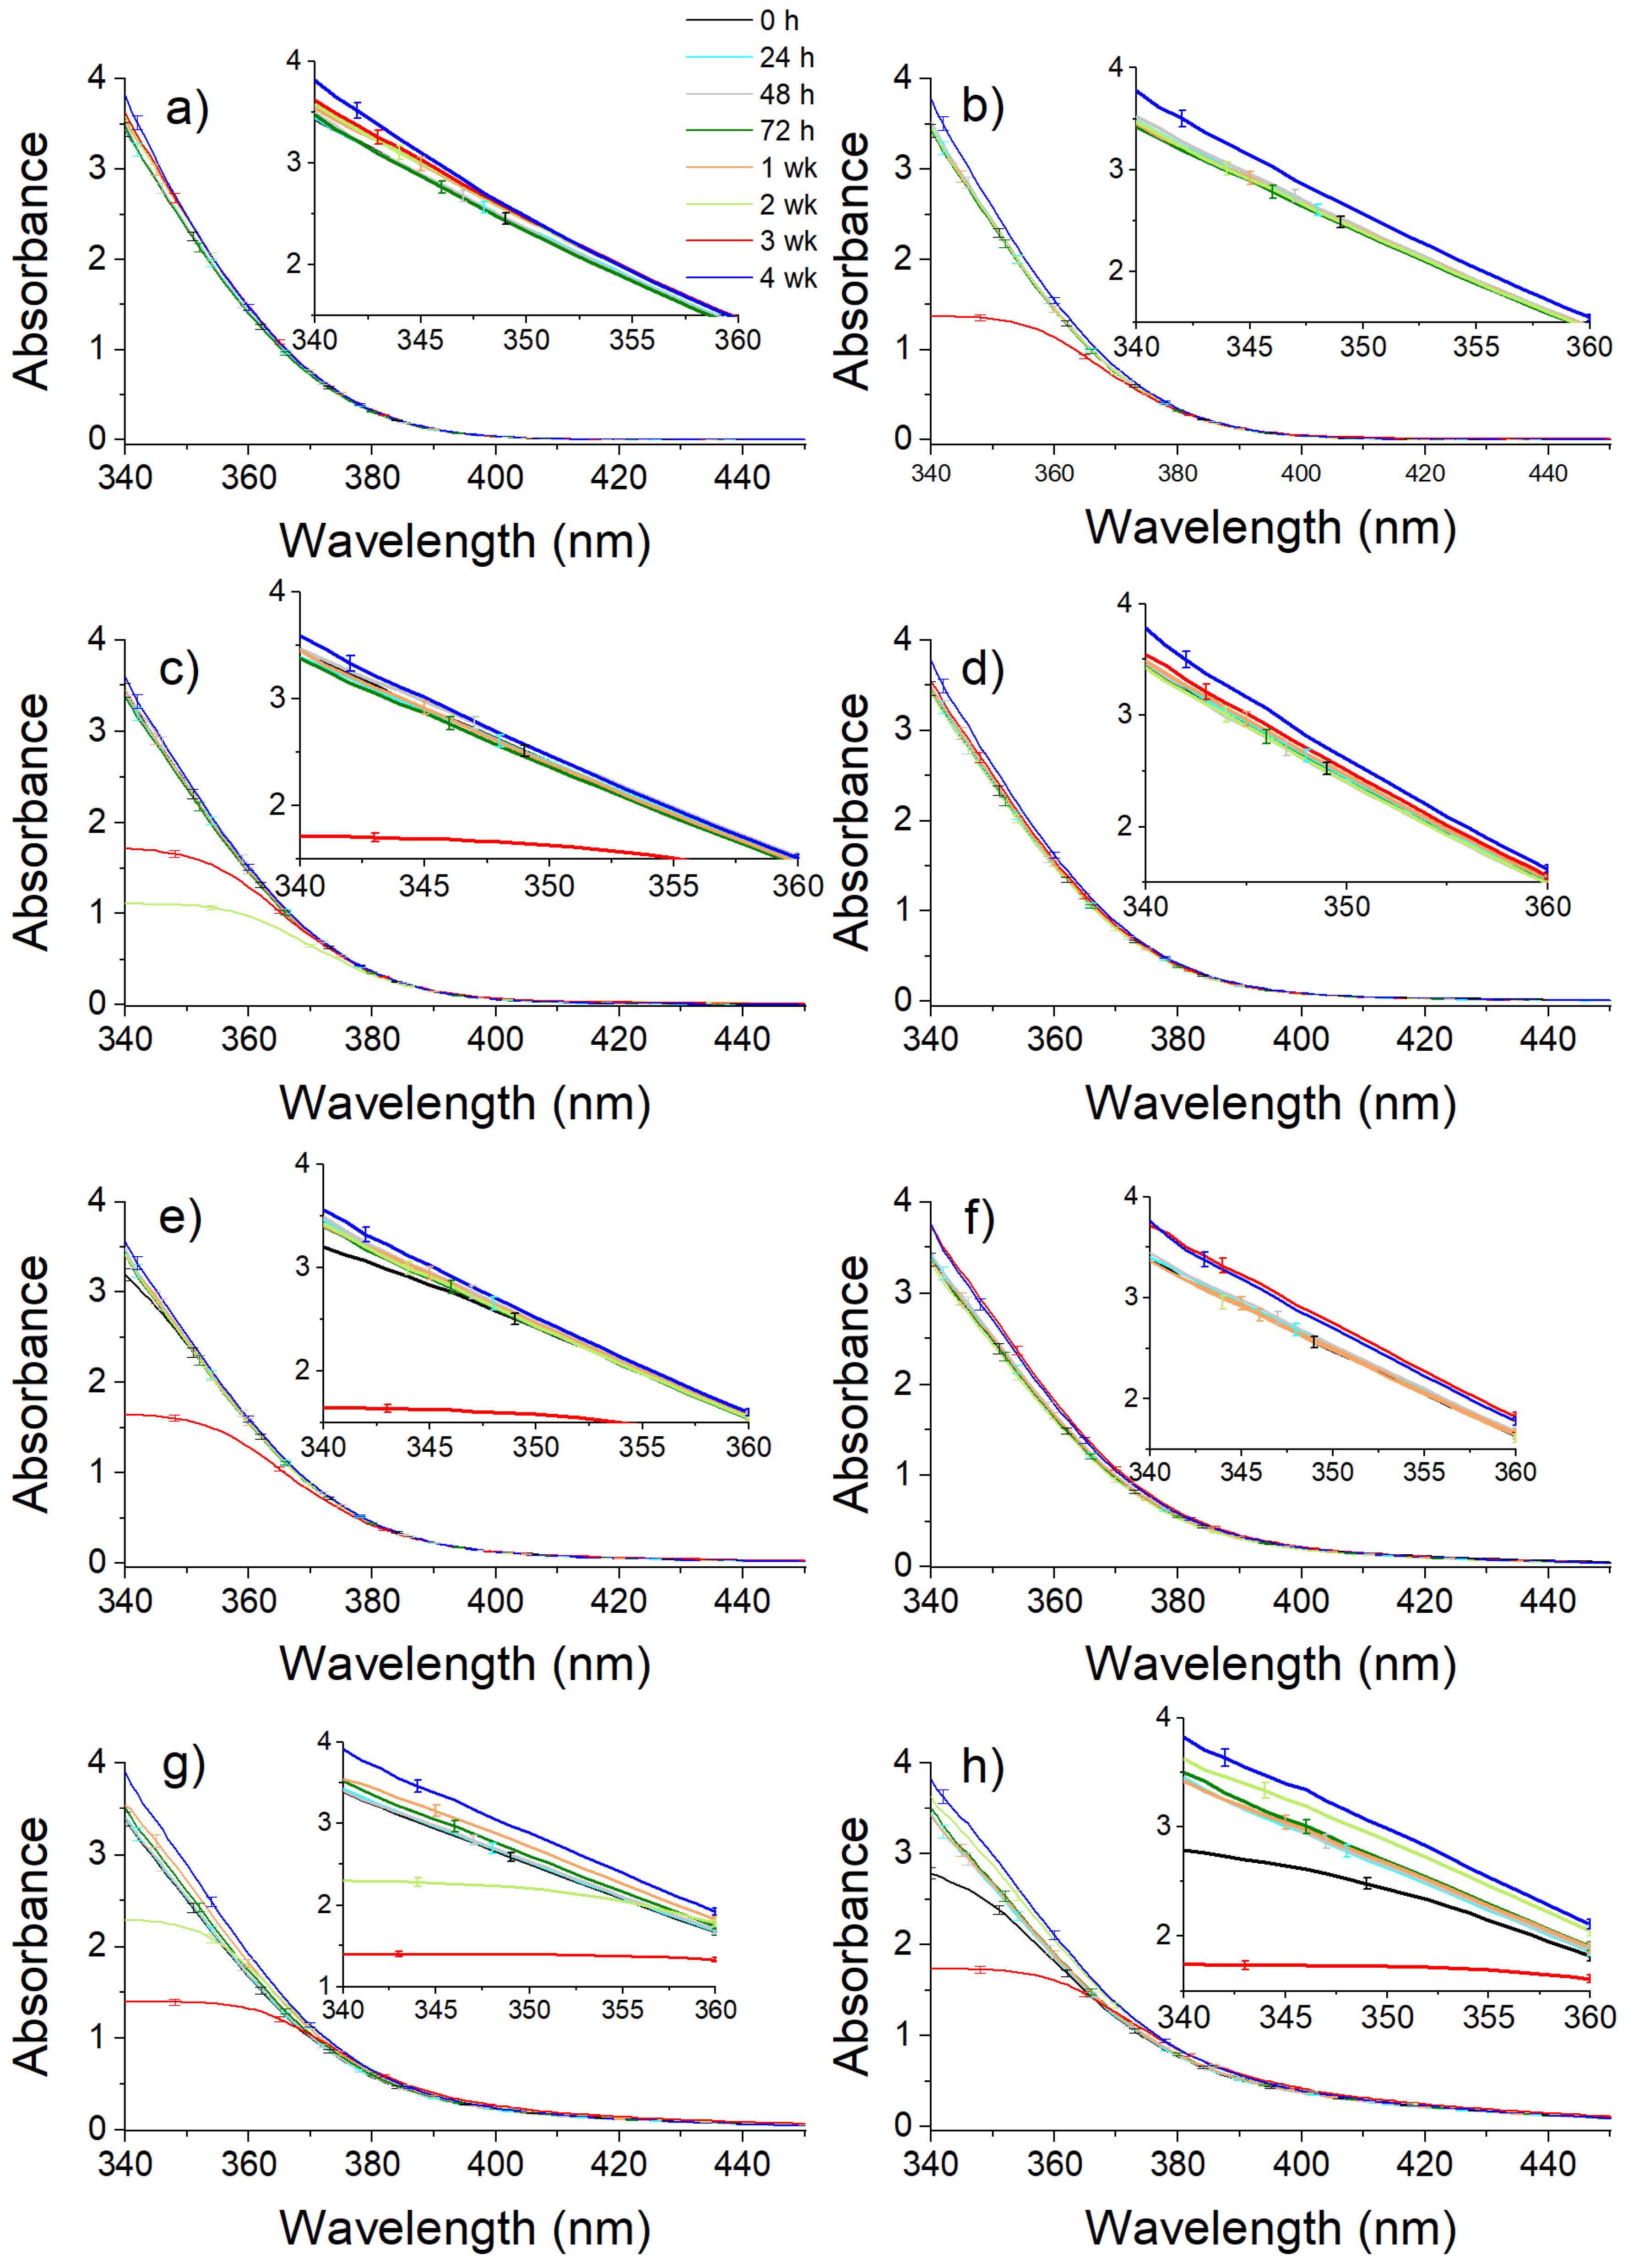
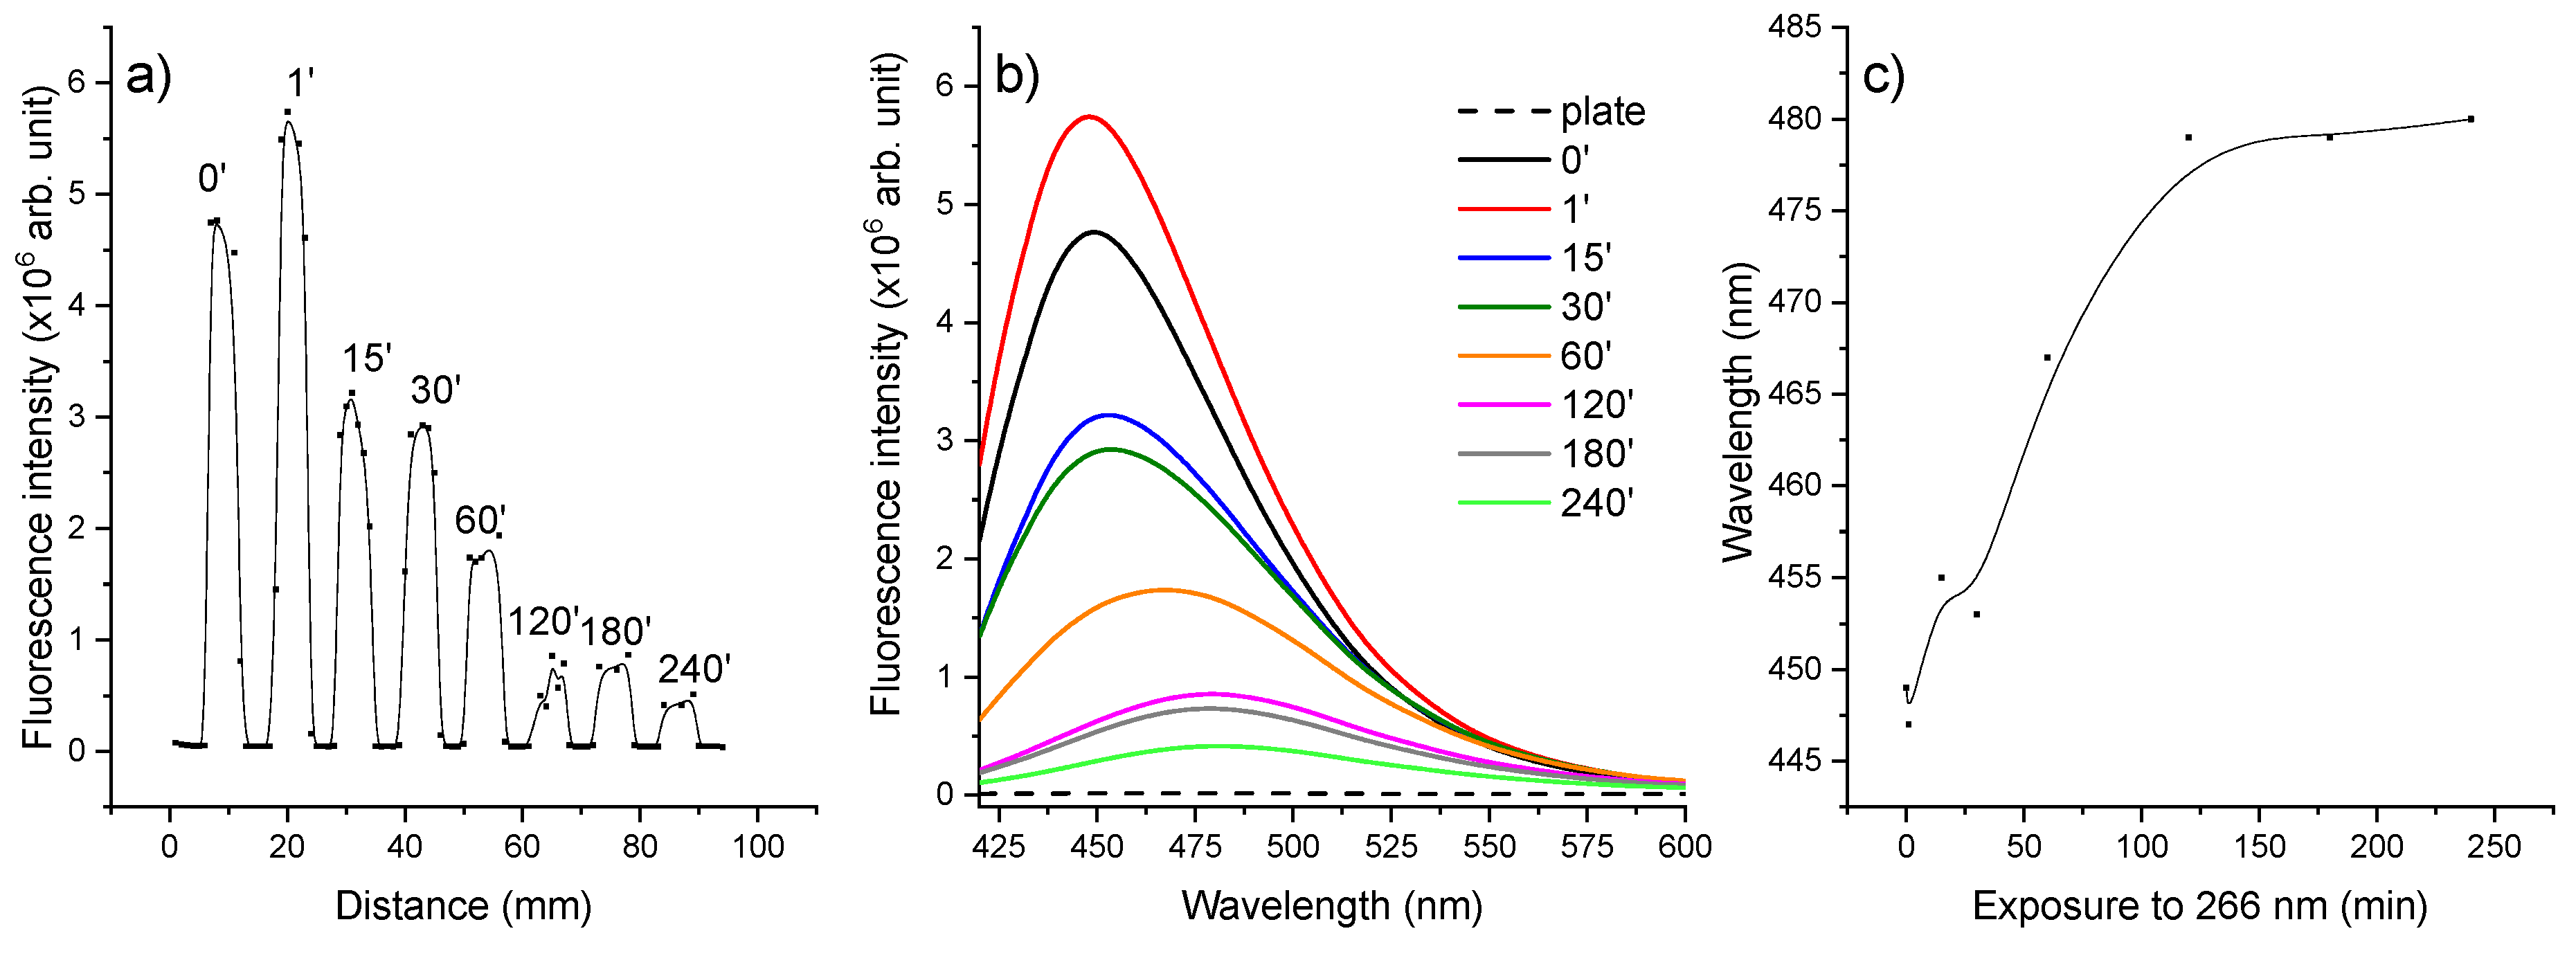
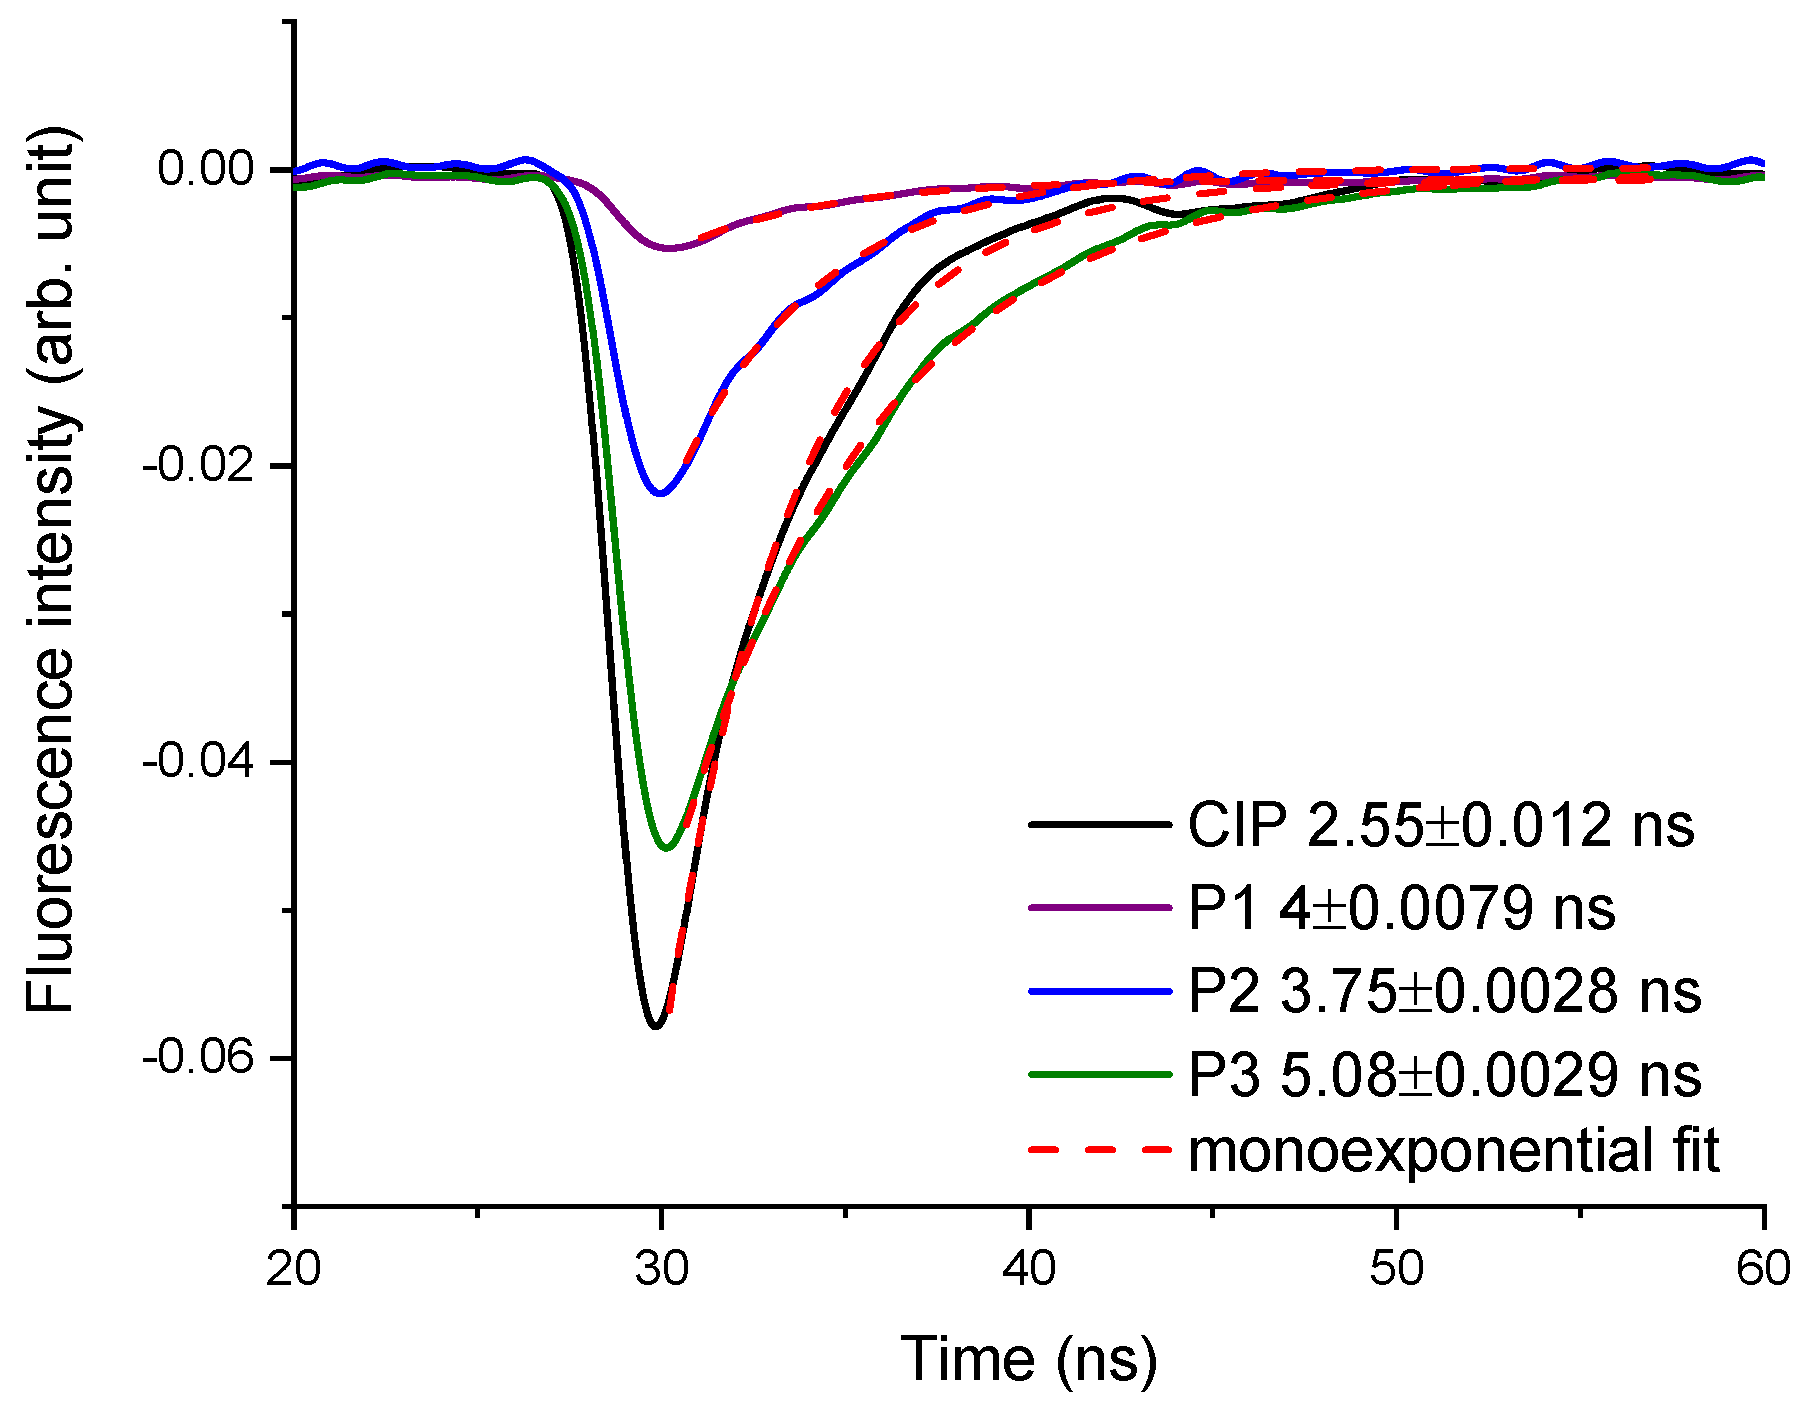
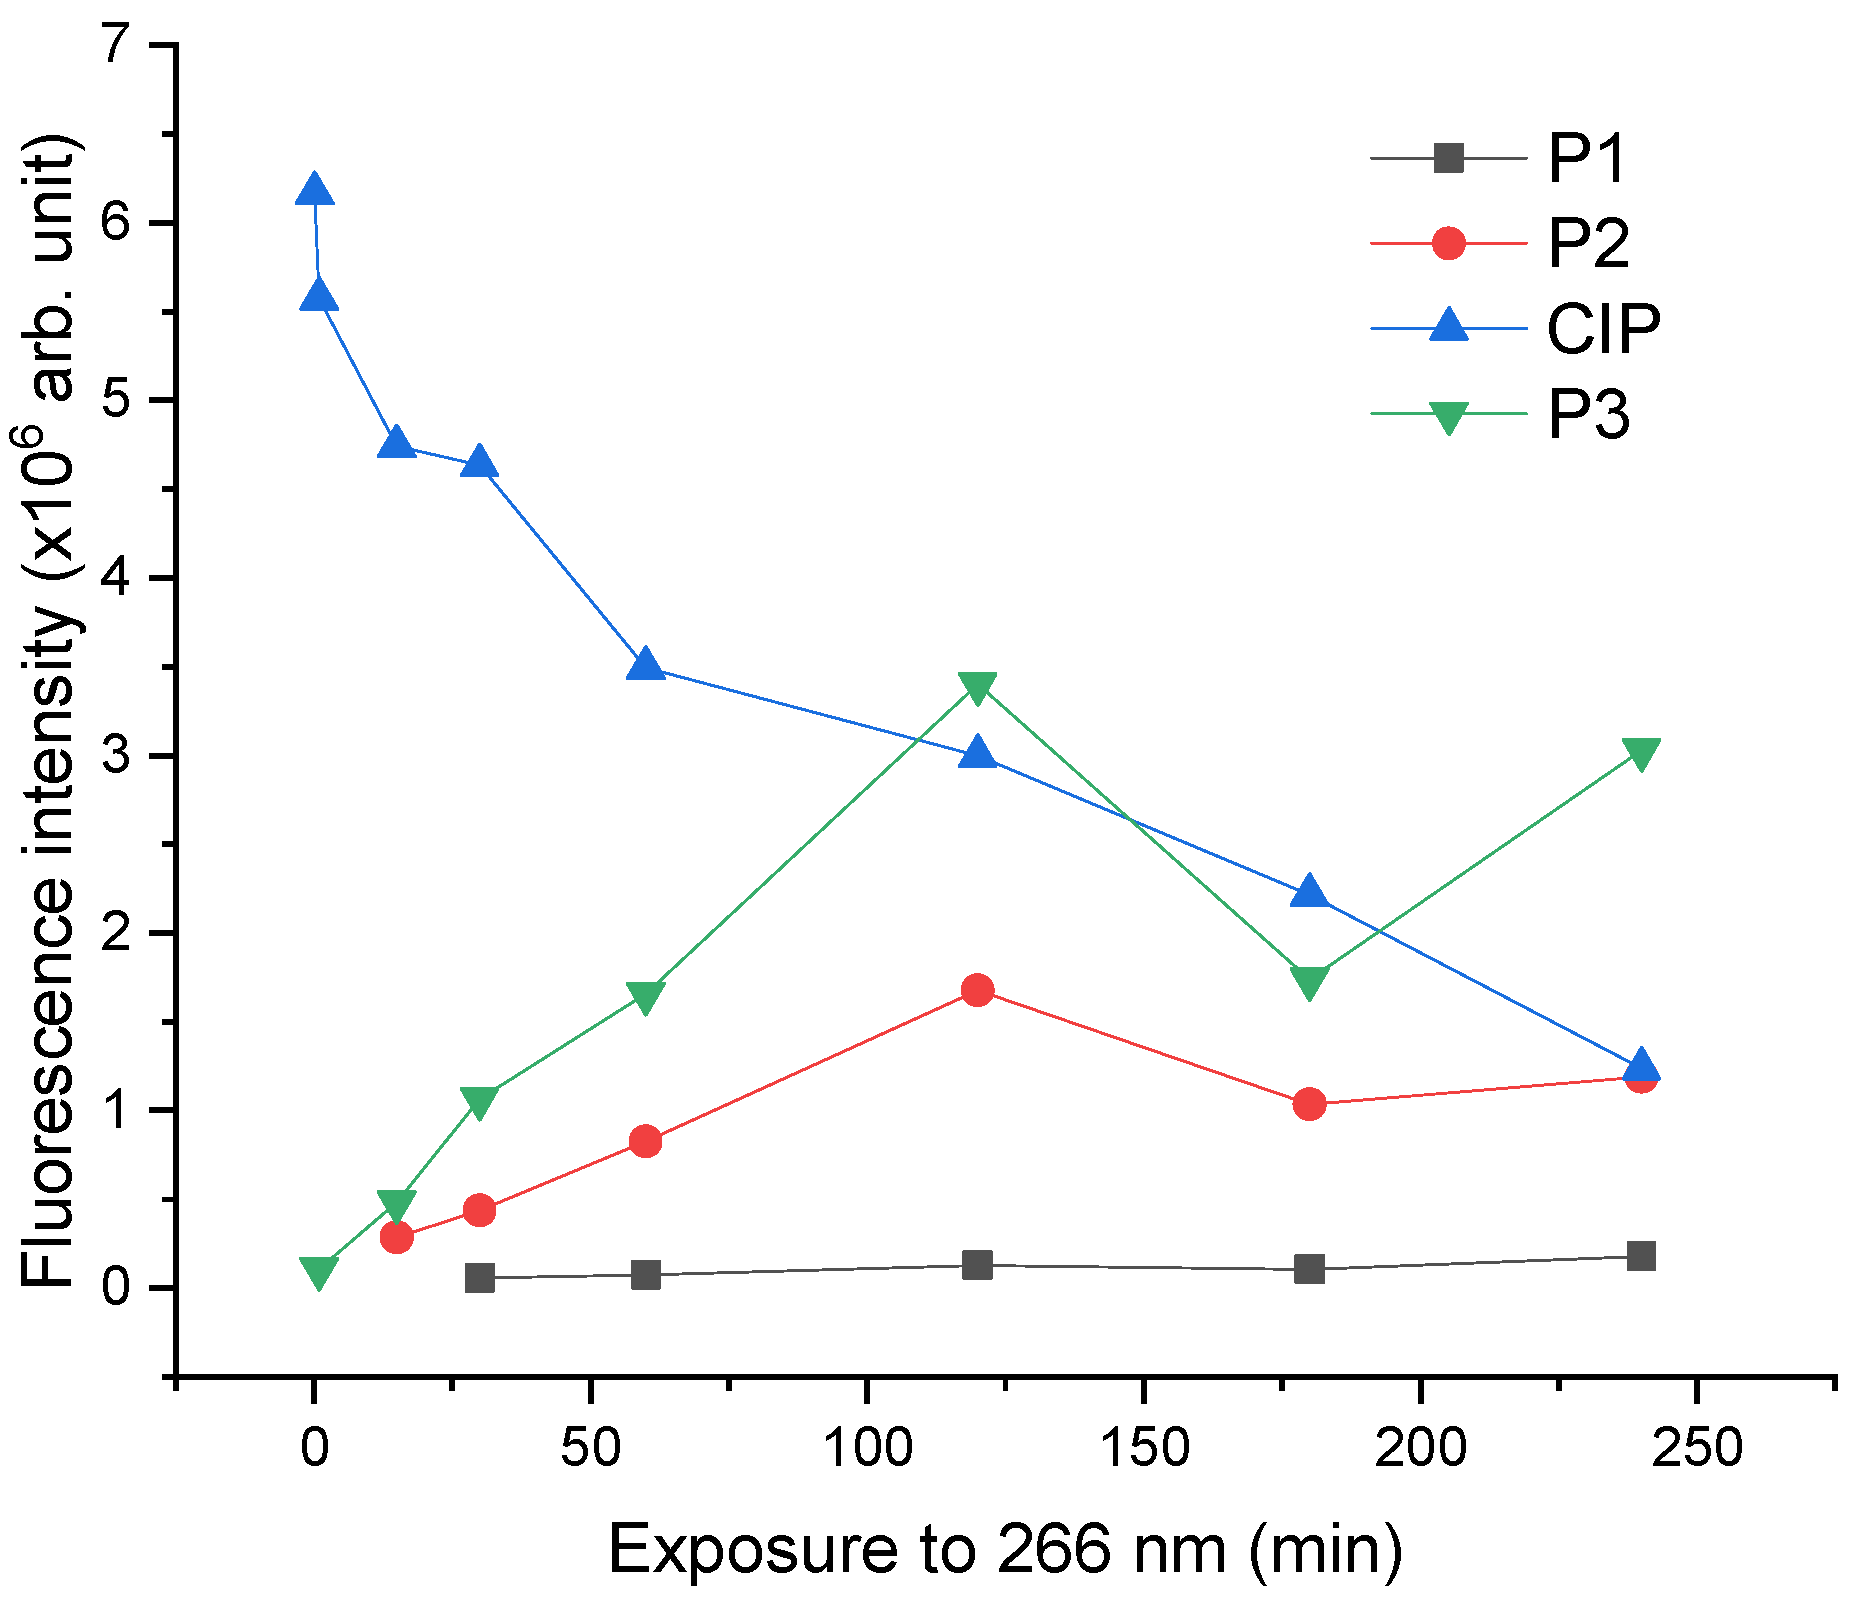
2.3. Laser-Induced Fluorescence Assay
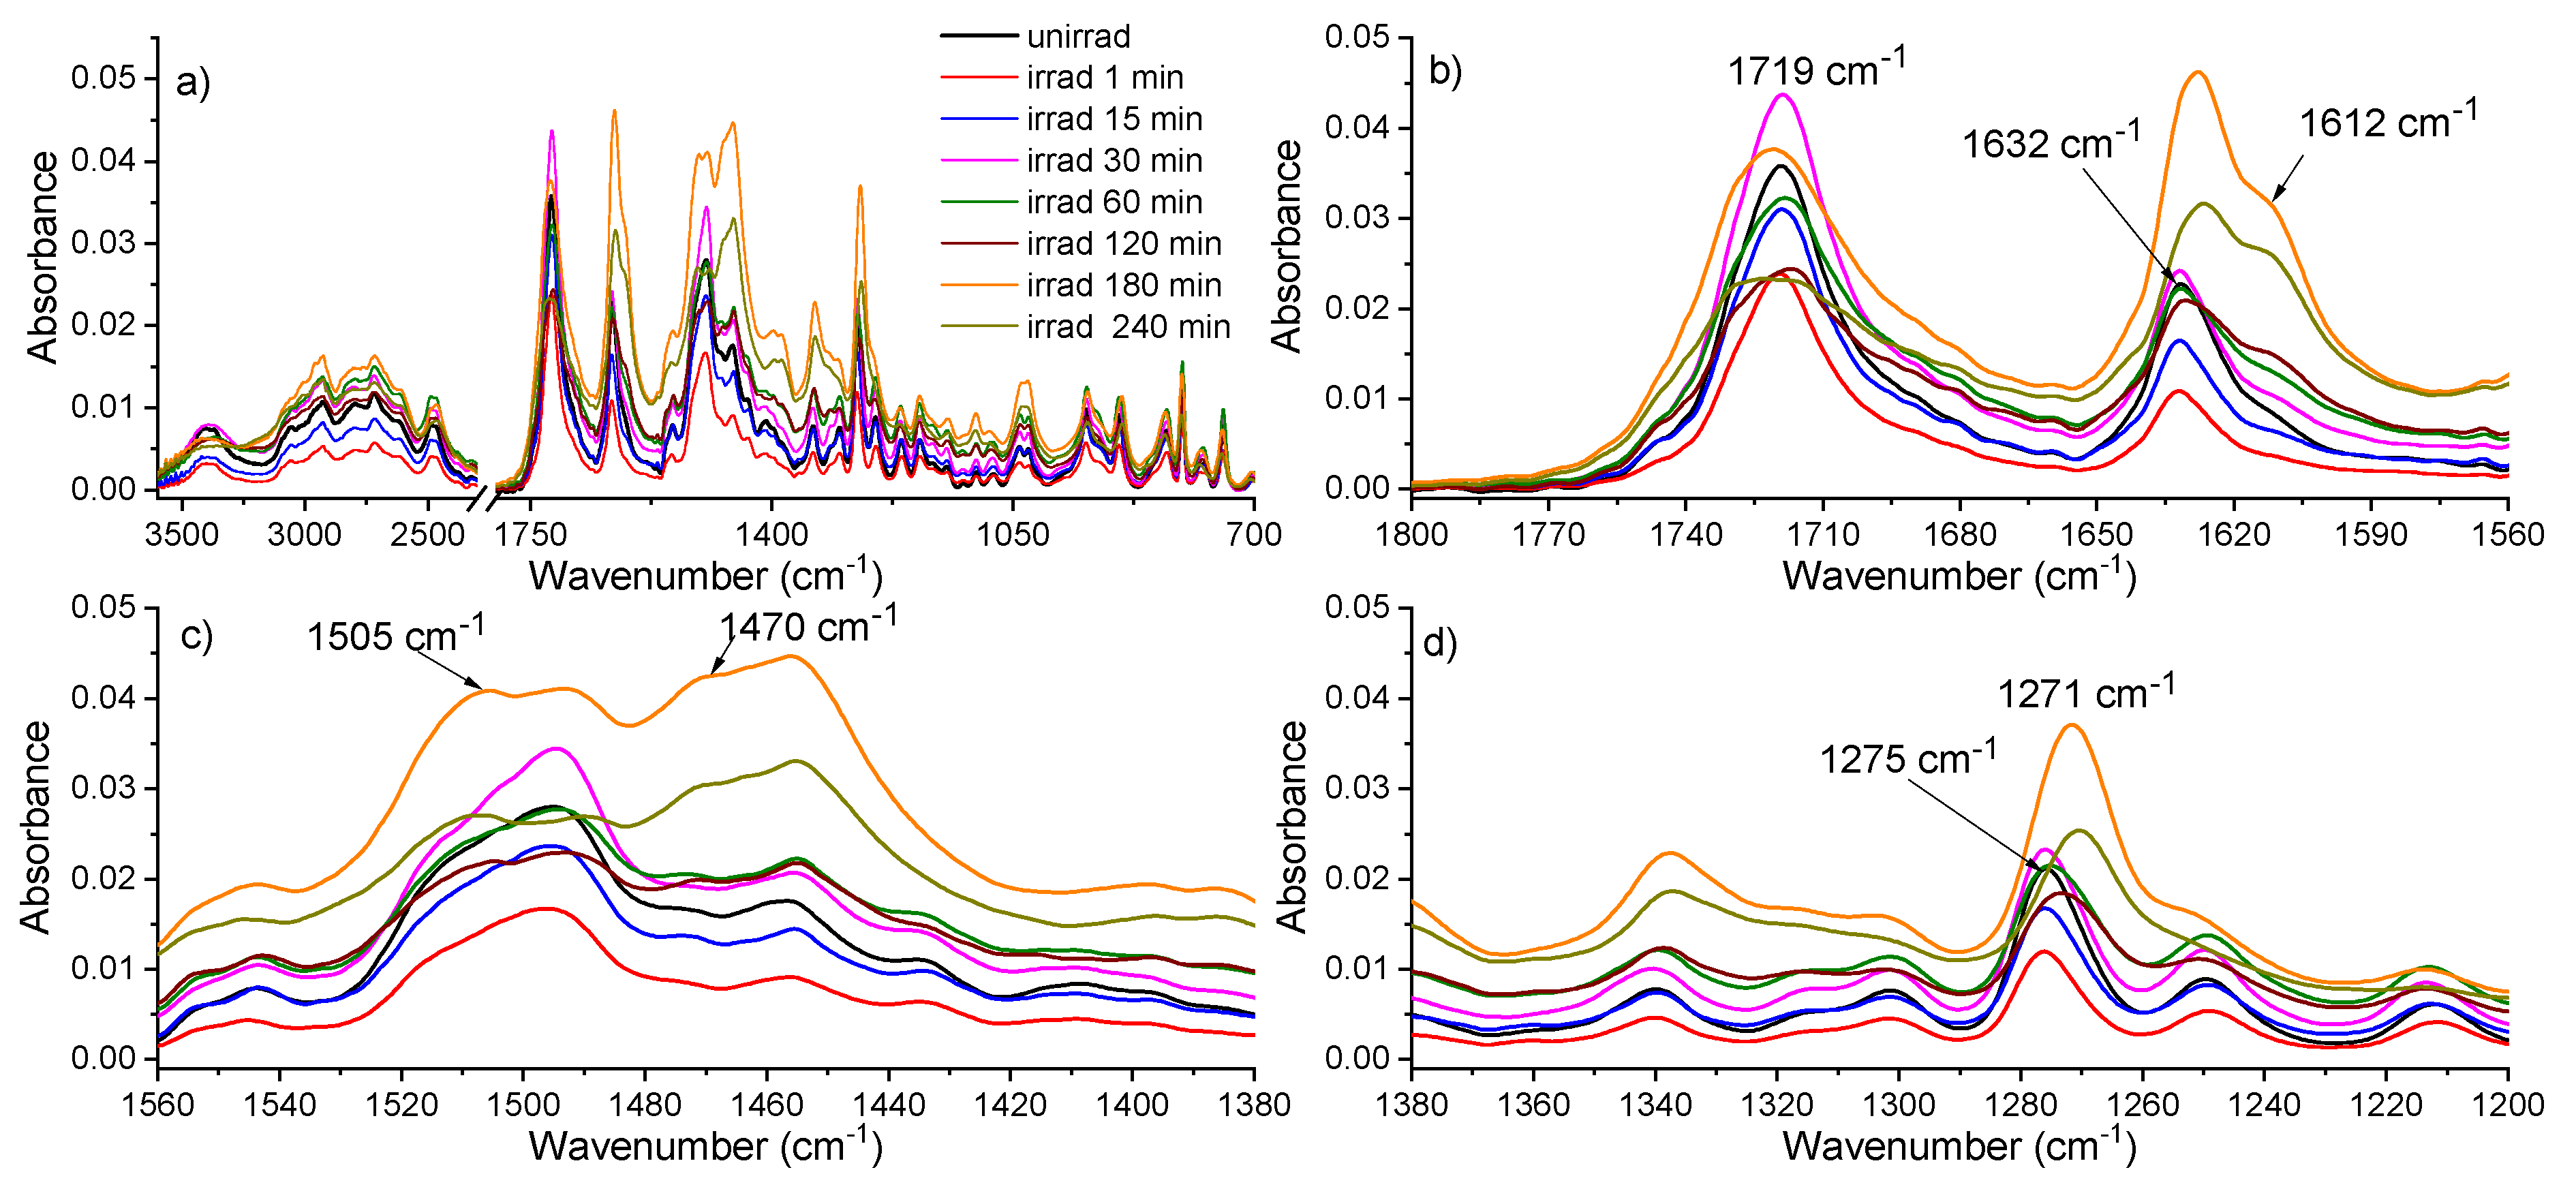
2.4. FTIR Absorption Spectroscopy
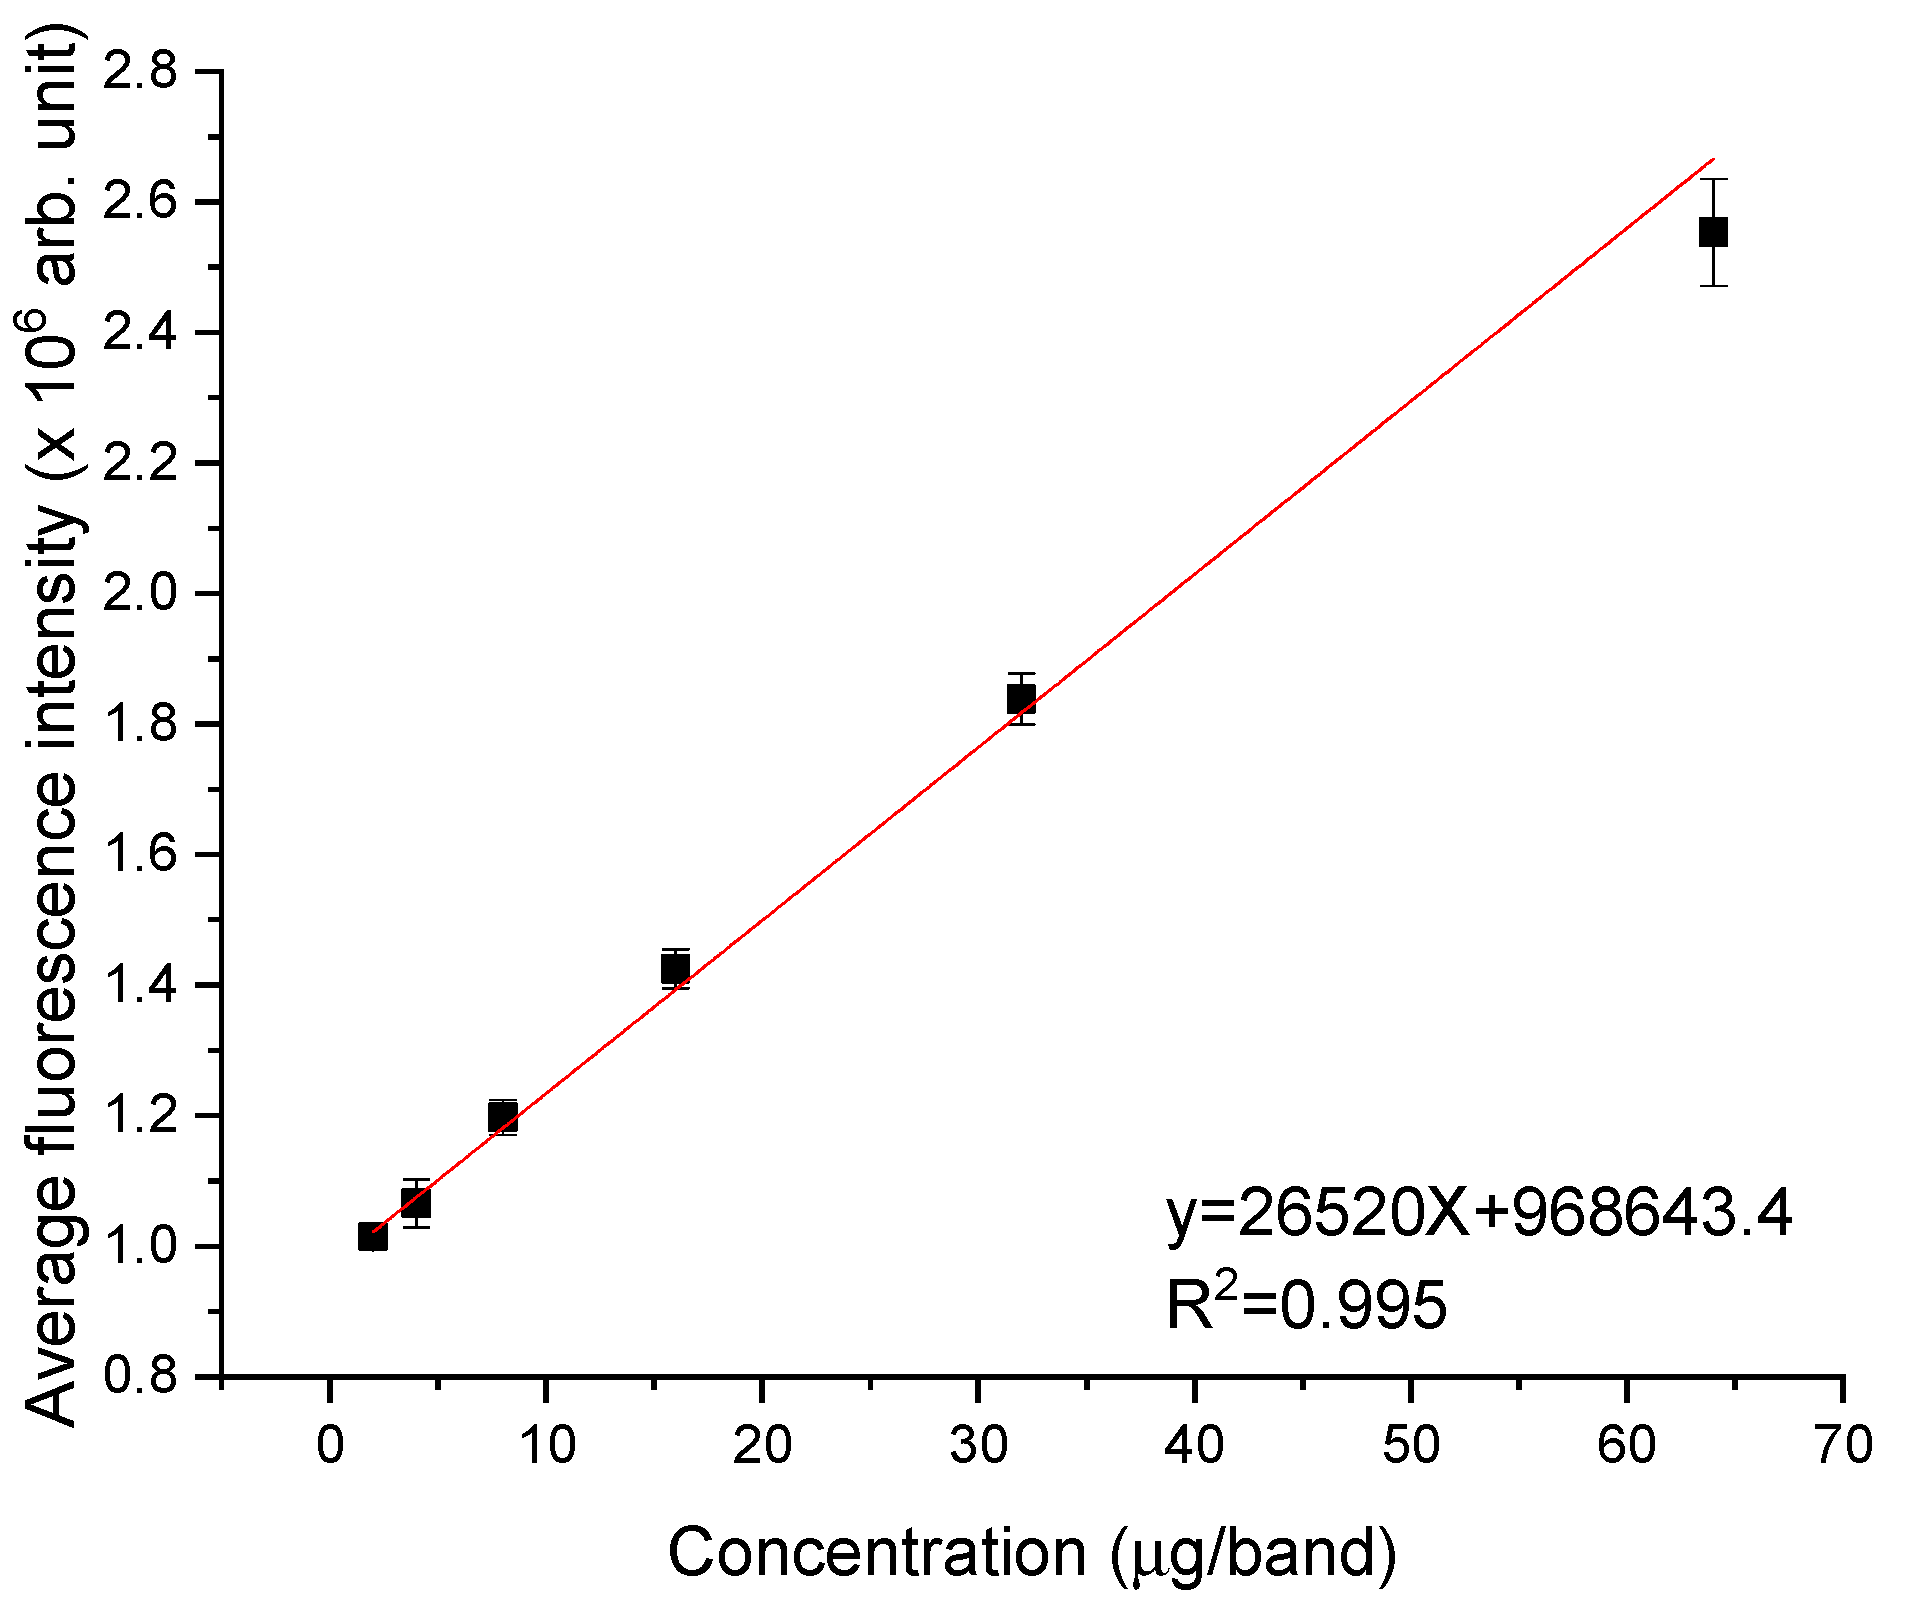
2.5. HPTLC Densitometry
3. Discussion
4. Materials and Methods
4.1. Irradiation Protocol
4.2. Sample Characterization
4.2.1. Laser-Induced Fluorescence
4.2.2. UV-Vis Absorption Spectroscopy
4.2.3. PH Assay
4.2.4. FTIR Absorption Spectroscopy
4.2.5. HPTLC Densitometry
5. Conclusions
6. Patents
Author Contributions
Funding
Institutional Review Board Statement
Informed Consent Statement
Data Availability Statement
Conflicts of Interest
Sample Availability
References
- Seifrtová, M.; Nováková, L.; Lino, C.; Pena, A.; Solich, P. An overview of analytical methodologies for the determination of antibiotics in environmental waters. Anal. Chim. Acta 2009, 649, 158–179. [Google Scholar] [CrossRef] [PubMed]
- Ciprofloxacin Monograph for Professionals. Available online: https://www.drugs.com/monograph/ciprofloxacin.html (accessed on 20 March 2021).
- World Health Organization. Model List of Essential Medicines, 21st List, 2019; Licence: CC BY-NC-SA 3.0 IGO; World Health Organization: Geneva, Switzerland, 2019; Available online: https://apps.who.int/iris/handle/10665/325771 (accessed on 20 March 2021).
- Hooper, D.C.; Jacoby, G.A. Topoisomerase inhibitors: Fluoroquinolone mechanisms of action and resistance. Cold Spring Harb. Perspect. Med. 2016, 6, a025320. [Google Scholar] [CrossRef] [PubMed] [Green Version]
- Ciprofloxacin—Drug Usage Statistics, ClinCalc DrugStats Database. Available online: https://clincalc.com/DrugStats/Drugs/Ciprofloxacin (accessed on 8 February 2021).
- Caliman, F.A.; Gavrilescu, M. Pharmaceuticals, personal care products and endocrine disruptingagents in the environment—A review. Clean Soil Air Water 2009, 37, 277–303. [Google Scholar] [CrossRef]
- Bhandari, A.; Close, L.I.; Kim, W.; Hunter, R.P.; Koch, D.E.; Surampalli, R.Y. Occurrence of ciprofloxacin, sulfamethoxazole, and azithromycin in municipal wastewater treatment plants. Pract. Period. Hazard. Toxic Radioact. Waste Manag. 2008, 12, 275–281. [Google Scholar] [CrossRef]
- Plósz, B.G.; Leknes, H.; Thomas, K.V. Impacts of competitive inhibition, parent compound formation and partitioning behavior on the removal of antibiotics in municipal wastewater treatment. Environ. Sci. Technol. 2010, 44, 734–742. [Google Scholar] [CrossRef]
- Ferguson, J.; Phillips, G.; McEwan, J.; Moreland, T.; Johnson, B.E. Loss of antibiotic activity caused by photodegradation: In vivo studies. Br. J. Derm. 1988, 119, 550–551. [Google Scholar] [CrossRef] [PubMed]
- Hu, H.; Chen, Y.; Ye, J.; Zhuang, L.; Zhang, H.; Ou, H. Degradation of ciprofloxacin by 185/254 Nm vacuum ultraviolet: Kinetics, mechanism and toxicology. Environ. Sci. 2019, 5, 564–576. [Google Scholar] [CrossRef]
- Singh, G.D.; Gupta, K.C. Photo and UV degradation of ciprofloxacin antibiotic. Int. J. Curr. Microbiol. Appl. Sci. 2014, 3, 641–648. [Google Scholar]
- Berman, M.R.; Zare, R.N. Laser fluorescence analysis of chromatograms. Subnanogram detection of aflatoxins. Anal. Chem. 1975, 47, 1200–1201. [Google Scholar] [CrossRef]
- Kawazumi, H.; Yeung, E.S. Resonant cell laser-based photoacoustic densitometer for thin-layer chromatography. Appl. Spectrosc. 1988, 42, 1228–1231. [Google Scholar] [CrossRef]
- Chen, T.I.; Morris, M.D. Photothermal deflection densitometer for thin-layer chromatography. Anal. Chem. 1984, 56, 19–21. [Google Scholar] [CrossRef]
- Hernández, F.; Rivera, A.; Ojeda, A.; Zayas, T.; Cedillo, L. Photochemical degradation of the ciprofloxacin antibiotic and its microbiological validation. J. Environ. Sci. Eng. A 2012, 1, 448–453. [Google Scholar]
- Kus, S.; Marczenko, Z.; Obarski, N. Derivative UV-VIS spectrophotometry in analytical chemistry. Chem. Anal. 1996, 41, 899–929. [Google Scholar]
- Avisar, D.; Lester, Y.; Mamane, H. PH induced polychromatic UV treatment for the removal of a mixture of SMX, OTC and CIP from water. J. Hazard. Mater. 2010, 175, 1068–1074. [Google Scholar] [CrossRef]
- Gunasekaran, S.; Anita, B. Spectral investigation and normal coordinate analysis of piperazine. Indian J. Pure Appl. Phys. 2008, 46, 833–838. [Google Scholar]
- Tozar, T.; Boni, M.; Andrei, I.R.; Pascu, M.L.; Staicu, A. HPTLC densitometry method based on picosecond laser-induced fluorescence for the analysis of thioridazine and its UV photoproducts. J. Chromatogr. A. under review.
- Sherma, J.; Fried, B. Handbook of Thin-Layer Chromatography, 3rd ed.; Marcel Dekker: New York, NY, USA, 2003. [Google Scholar]
- Jenkins, D.; Diallo, C.; Bethea, E.; Kaale, E.; Layloff, T. Method Validation approaches for pharmaceutical assessments—Highlights with High Performance Thin Layer Chromatographic (HPTLC) techniques. In Calibration and Validation of Analytical Methods—A Sampling of Current Approaches; Stauffer, M.T., Ed.; IntechOpen: London, UK, 2018. [Google Scholar]
- Center for Drug Evaluation and Research. Q2B Validation of Analytical Procedures: Methodology. Available online: https://www.fda.gov/regulatory-information/search-fda-guidance-documents/q2b-validation-analytical-procedures-methodology (accessed on 20 March 2021).
- Reich, E.; Schibli, A. High-Performance Thin-Layer Chromatography for the Analysis of Medicinal Plants; Thieme: New York, NY, USA, 2007. [Google Scholar]
- Atkins, P.W.; De Paula, J. Elements of Physical Chemistry, 5th ed.; Oxford University Press: New York, NY, USA, 2009. [Google Scholar]
- Lakowicz, J.R. Effects of solvents on fluorescence emission spectra. In Principles of Fluorescence Spectroscopy; Springer: Boston, MA, USA, 1983; pp. 187–215. [Google Scholar]
- Gutiérrez, M.C.; Hortigüela, M.J.; Ferrer, M.L.; del Monte, F. Highly fluorescent rhodamine B nanoparticles entrapped in hybrid glasses. Langmuir 2007, 23, 2175–2179. [Google Scholar] [CrossRef]
- Liang, S.; Shephard, K.; Pierce, D.T.; Zhao, J.X. Effects of a nanoscale silica matrix on the fluorescence quantum yield of encapsulated dye molecules. Nanoscale 2013, 5, 9365. [Google Scholar] [CrossRef]
- Vasconcelos, T.G.; Henriques, D.M.; König, A.; Martins, A.F.; Kümmerer, K. Photo-Degradation of the antimicrobial ciprofloxacin at high PH: Identification and biodegradability assessment of the primary by-products. Chemosphere 2009, 76, 487–493. [Google Scholar] [CrossRef]
- Jia, Z.; Lv, R.; Guo, L.; Zhang, J.; Li, R.; Liu, J.; Fan, C. Rapid degradation of ciprofloxacin over BiOCl: Insight into the molecular structure transformation and antibacterial activity elimination. Sep. Purif. Technol. 2021, 257, 117872. [Google Scholar] [CrossRef]
- Mella, M.; Fasani, E.; Albini, A. Photochemistry of 1-Cyclopropyl-6-Fluoro-1,4-Dihydro-4-Oxo-7- (Piperazin-1-Yl)Quinoline-3-carboxylic acid (=ciprofloxacin) in aqueous solutions. Helv. Chim. Acta 2001, 84, 2508–2519. [Google Scholar] [CrossRef]
- Bicking, M.K.L.; Kniseley, R.N.; Svec, H.J. Determination of aflatoxins in air samples of refuse-derived fuel by thin-layer chromatography with laser-induced fluorescence spectrometric detection. Anal. Chem. 1983, 55, 200–204. [Google Scholar] [CrossRef]
- Huie, C.W.; Williams, W.R. Laser fluorometric detection of porphyrin methyl esters for high-performance thin-layer chromatography. Anal. Chem. 1989, 61, 2288–2292. [Google Scholar] [CrossRef] [PubMed]


| Comparison between Plates | Mean Diff. | SEM | Statistical Significance | LCL | UCL |
|---|---|---|---|---|---|
| Plate 2 ↔ Plate 1 | 25534.7 | 342196.8 | No | −703840.5 | 754909.9 |
| Plate 3 ↔ Plate 1 | −114304.5 | 342196.8 | No | −843679.8 | 615070.7 |
| Plate 3 ↔ Plate 2 | −139839.2 | 342196.8 | No | −869214.5 | 589535.9 |
| CIP | CIP-2 | CIP-3 |
|---|---|---|
 |  |  |
Publisher’s Note: MDPI stays neutral with regard to jurisdictional claims in published maps and institutional affiliations. |
© 2021 by the authors. Licensee MDPI, Basel, Switzerland. This article is an open access article distributed under the terms and conditions of the Creative Commons Attribution (CC BY) license (https://creativecommons.org/licenses/by/4.0/).
Share and Cite
Tozar, T.; Boni, M.; Staicu, A.; Pascu, M.L. Optical Characterization of Ciprofloxacin Photolytic Degradation by UV-Pulsed Laser Radiation. Molecules 2021, 26, 2324. https://doi.org/10.3390/molecules26082324
Tozar T, Boni M, Staicu A, Pascu ML. Optical Characterization of Ciprofloxacin Photolytic Degradation by UV-Pulsed Laser Radiation. Molecules. 2021; 26(8):2324. https://doi.org/10.3390/molecules26082324
Chicago/Turabian StyleTozar, Tatiana, Mihai Boni, Angela Staicu, and Mihail Lucian Pascu. 2021. "Optical Characterization of Ciprofloxacin Photolytic Degradation by UV-Pulsed Laser Radiation" Molecules 26, no. 8: 2324. https://doi.org/10.3390/molecules26082324