Article

Purification, Structural Characterization and Immunomodulatory Effects of Polysaccharides from Amomumvillosum Lour. on RAW 264.7 Macrophages

1
School of Pharmaceutical Sciences, Sun Yat-Sen University, Guangzhou 510006, China
2
Guangdong Technology Research Center for Advanced Chinese Medicine, Guangzhou 510006, China
3
State Key Laboratory of Natural Medicines, School of Traditional Chinese Pharmacy, China Pharmaceutical University, Nanjing 210009, China
4
Yayisan Chinese Herbs Plantation Ltd., Heyuan 517428, China
*
Author to whom correspondence should be addressed.
Molecules 2021, 26(9), 2672; https://doi.org/10.3390/molecules26092672
Submission received: 9 March 2021 / Revised: 26 April 2021 / Accepted: 29 April 2021 / Published: 2 May 2021

Abstract

:
Amomum Villosum Lour. (A. villosum) is a folk medicine that has been used for more than 1300 years. However, study of the polysaccharides of A. villosum is seriously neglected. The objectives of this study are to explore the structural characteristics of polysaccharides from A. villosum (AVPs) and their effects on immune cells. In this study, the acidic polysaccharides (AVPG-1 and AVPG-2) were isolated from AVPs and purified via anion exchange and gel filtration chromatography. The structural characteristics of the polysaccharides were characterized by methylation, HPSEC-MALLS-RID, HPLC, FT-IR, SEM, GC-MS and NMR techniques. AVPG-1 with a molecular weight of 514 kDa had the backbone of → 4)-α-d-Glcp-(1 → 3,4)-β-d-Glcp-(1 → 4)-α-d-Glcp-(1 →. AVPG-2 with a higher molecular weight (14800 kDa) comprised a backbone of → 4)-α-d-Glcp-(1 → 3,6)-β-d-Galp-(1 → 4)-α-d-Glcp-(1 →. RAW 264.7 cells were used to investigate the potential effect of AVPG-1 and AVPG-2 on macrophages, and lipopolysaccharide (LPS) was used as a positive control. The results from bioassays showed that AVPG-2 exhibited stronger immunomodulatory activity than AVPG-1. AVPG-2 significantly induced nitric oxide (NO) production as well as the release of interleukin (IL)-6 and tumor necrosis factor alpha (TNF-α), and upregulated phagocytic capacities of RAW 264.7 cells. Real-time PCR analysis revealed that AVPG-2 was able to turn the polarization of macrophages to the M1 direction. These results suggested that AVPs could be explored as potential immunomodulatory agents of the functional foods or complementary medicine.

1. Introduction

Amomum villosum Lour. (Zingiberaceae, A. villosum) has been used as a traditional Chinese medicine for the treatment of gastrointestinal diseases for more than 1300 years [1]. A. villosum is widely distributed in South and East Asia [2]. Accumulating studies demonstrated that the major bioactive components of A. villosum included volatile oils, flavonoids, terpenoids and polysaccharides, which showed anti-inflammation, anti-oxidant, anti-ulceration and anti-microbial activities [3,4,5,6,7,8,9].
Polysaccharides are macro-biomolecules that display a wide spectrum of biological and pharmacological activities, such as anti-oxidative, immunomodulatory, anti-tumor and hypoglycemic effects [10,11,12,13,14]. However, there are only a few studies concerning A. villosum polysaccharides (AVPs). Studies of AVPs have focused mainly on the effect of extraction methods on properties, the optimal parameters for the extraction of AVPs by ultrasonic assisted extraction, the anti-oxidant activities in vitro and in vivo, and the immunostimulatory activities of crude polysaccharides [15,16,17]. Furthermore, almost all samples used in those studies come from their geo-authentic habitat, Yangchun, which is located in the southwest of Guangdong province [18]. However, on the market, A. villosum mostly comes from Yunnan province because the production from Yangchun cannot meet the increasing demand [19]. Therefore, a thorough investigation into the structure, biological activities and structure-activity relationship of purified AVPs from other regions is required.
In the present study, A. villosum from Yunnan province was analyzed and two fractions (named AVPG-1 and AVPG-2) were purified from it. Their structural characteristics, including molecular weight, monosaccharide composition, surface morphology, triple helical conformation and glycosyl linkages, were clarified. Furthermore, the in vitro immunomodulatory activities of the two polysaccharides were evaluated using RAW 264.7 macrophages as a model. The results of the present study could provide a better understanding of the structure-bioactivity relationship of polysaccharides and pave the road for development of new immunomodulatory agents.

2. Results and Discussion

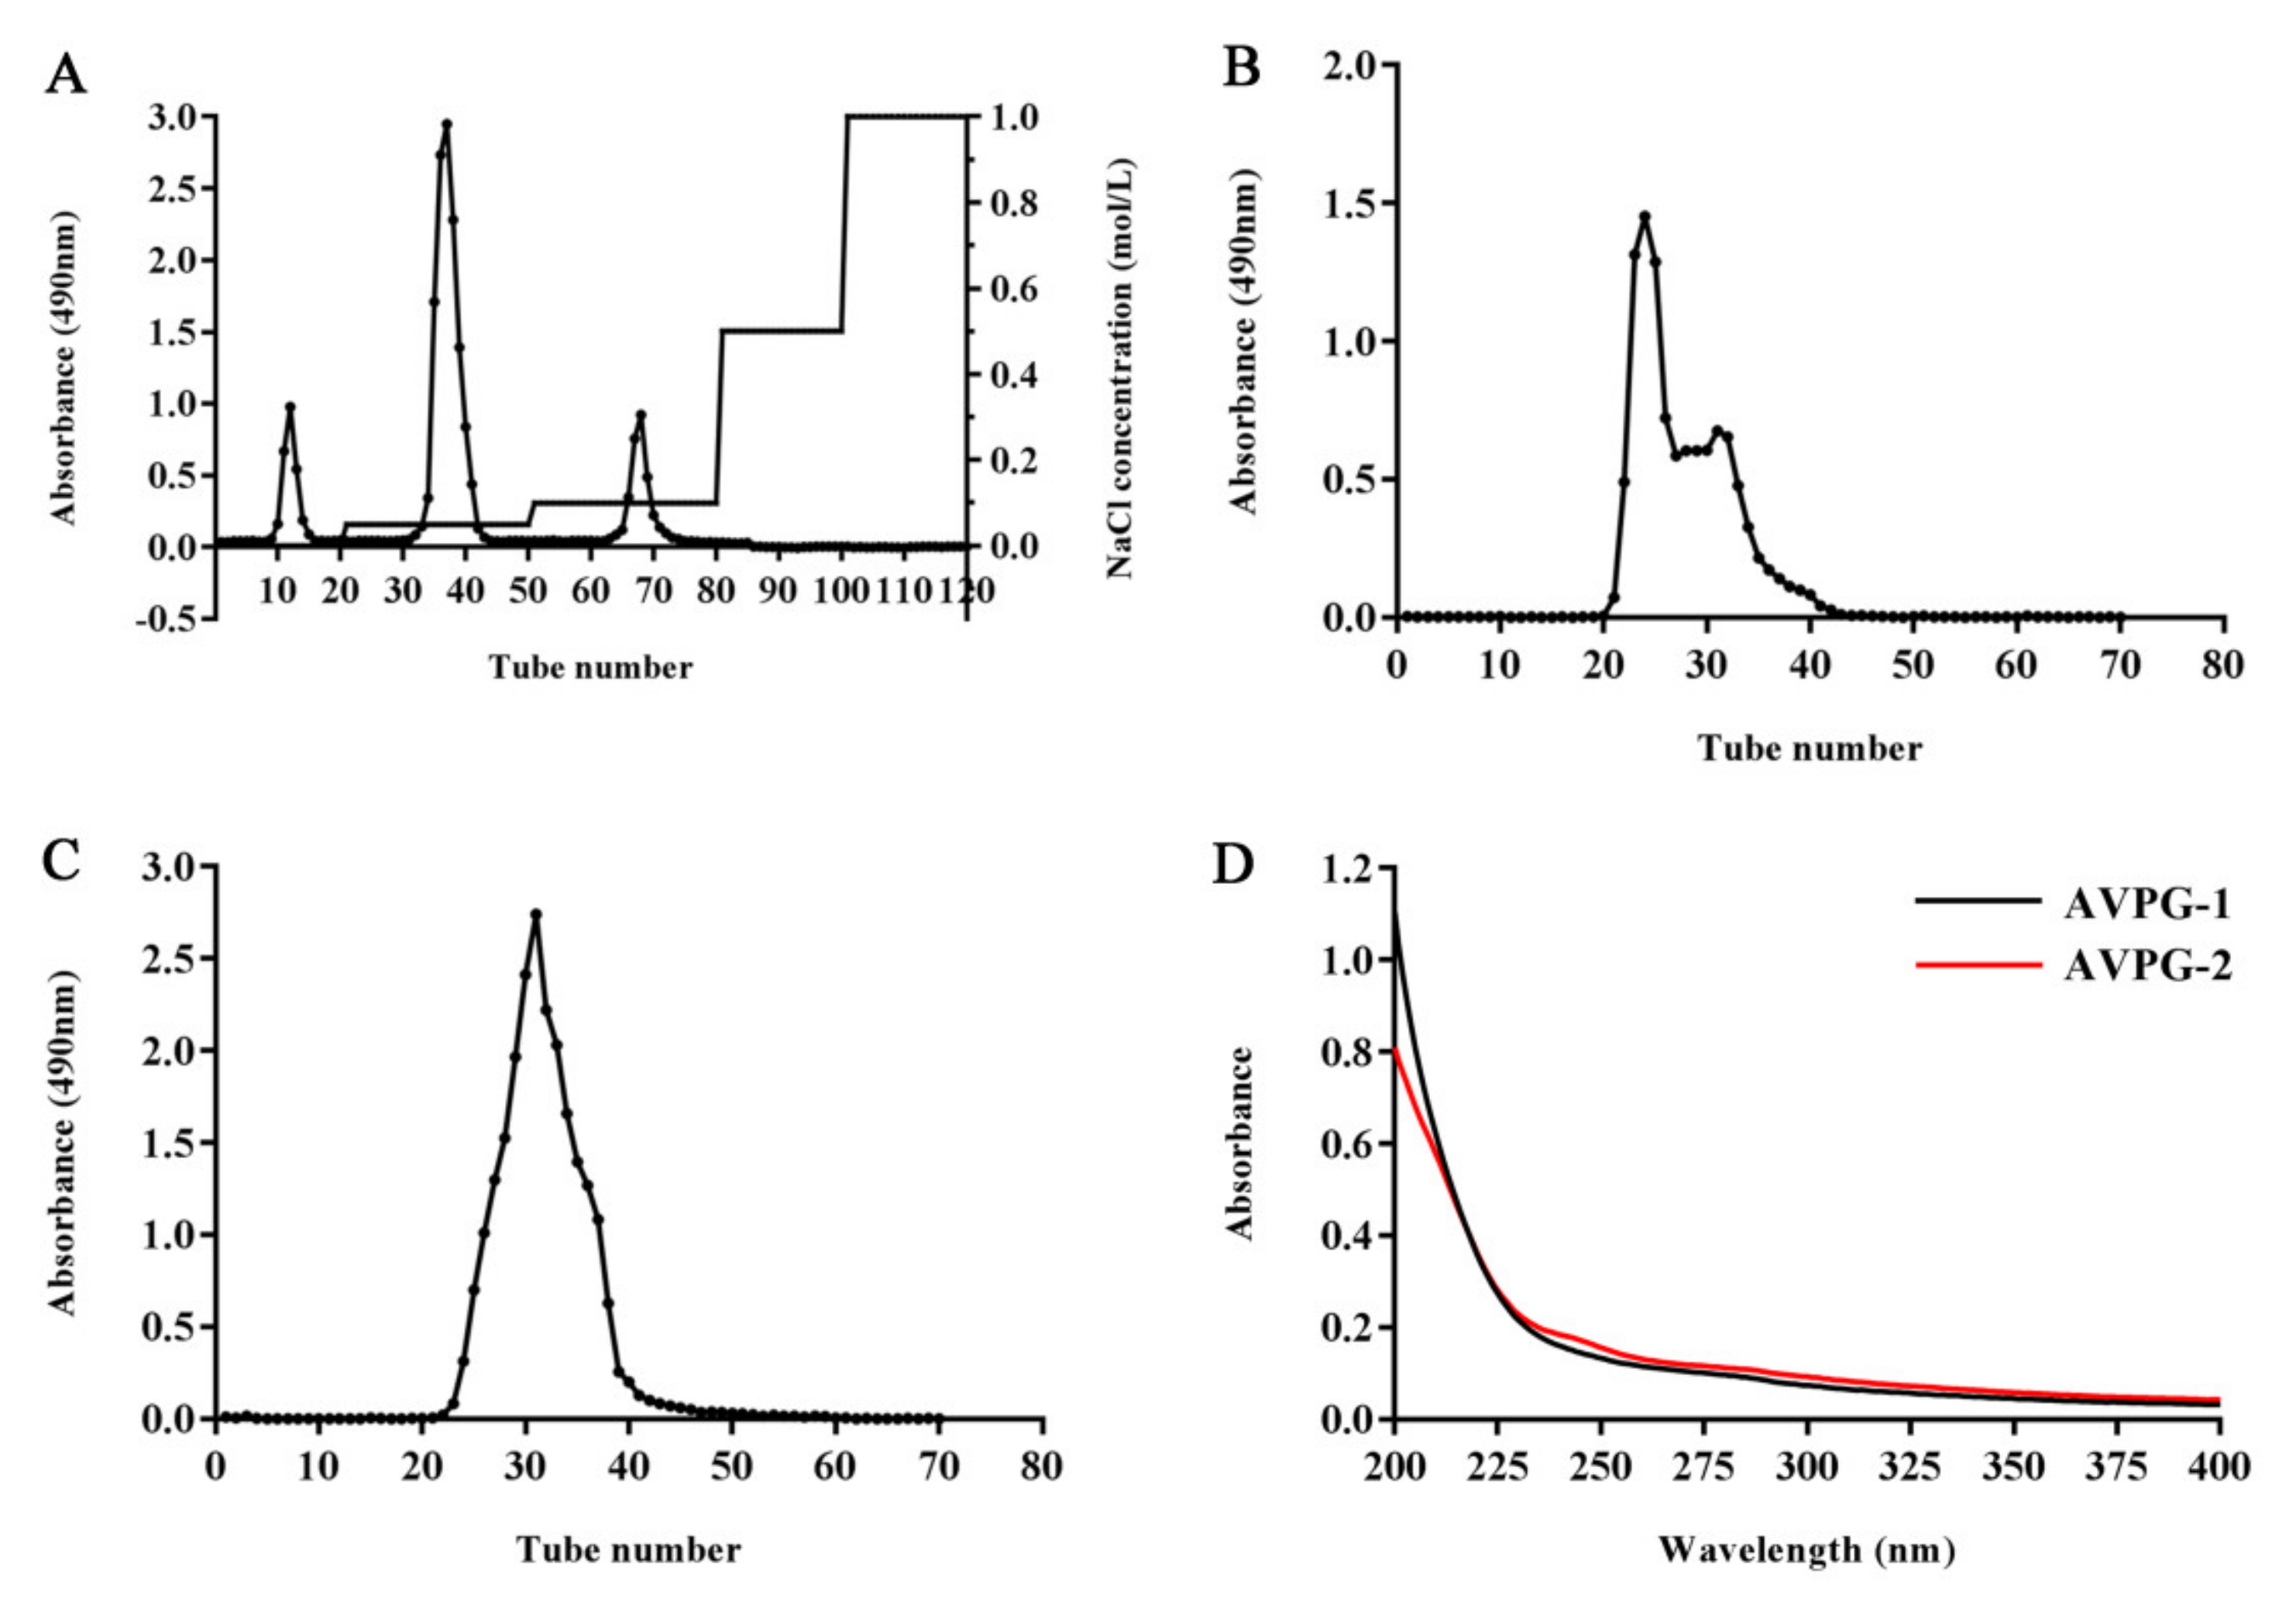
2.1. Preparation and Physicochemical Features of Polysaccharides

The crude polysaccharides were obtained through hot-water extraction, followed by ethanol precipitation, deproteinization and lyophilization. AVPs were purified by using DEAE-cellulose 52 (Figure 1A) and Sephadex G-100 gel filtration chromatography to obtain AVPG-1 (Figure 1B) and AVPG-2 (Figure 1C). The yields of AVPG-1 and AVPG-2 were 4.19% and 6.27%, respectively.
AVPG-1 contained a higher content of total carbohydrate (88.74% vs. 64.06%) and protein (0.18% vs. 0.14%), while AVPG-2 contained higher contents of uronic acid (28.04% vs. 7.21%) and sulfate (1.06% vs. 0.69%). It was reported that many biological activities, e.g., anti-oxidant activity, immunomodulatory activity and anti-tumor activity, were related to the molecular weight, sulfate content and uronic acid content of polysaccharides [20,21]. Moreover, the content of uronic acid was more important for anti-tumor activity than sulfate and molecular weight [22]. Both the purified polysaccharides contained a very low protein content, which was further demonstrated by ultraviolet (UV) spectrometry. The scanned UV spectra showed no absorption at 260 and 280 nm (Figure 1D) implying that neither nucleic acids nor proteins were detected in both fractions.
The endotoxin contamination existed in samples may lead to false positives in immunostimulatory assays [23]. Results of endotoxin test showed that there were low contents of endotoxin existed in AVPG-1 (0.139 EU/mL) and AVPG-2 (0.126 EU/mL). The concentrations of endotoxin in samples were lower than the endotoxin limit for a medical device (0.5 EU/mL) [24]. In addition, the macrophages were not so sensitive to react to LPS (1 ng/mL) [25]. In summary, the effect of AVPG-1 and AVPG-2 on macrophages is likely independent of any potential contaminating endotoxin.

2.2. Structural Characterization of Polysaccharides

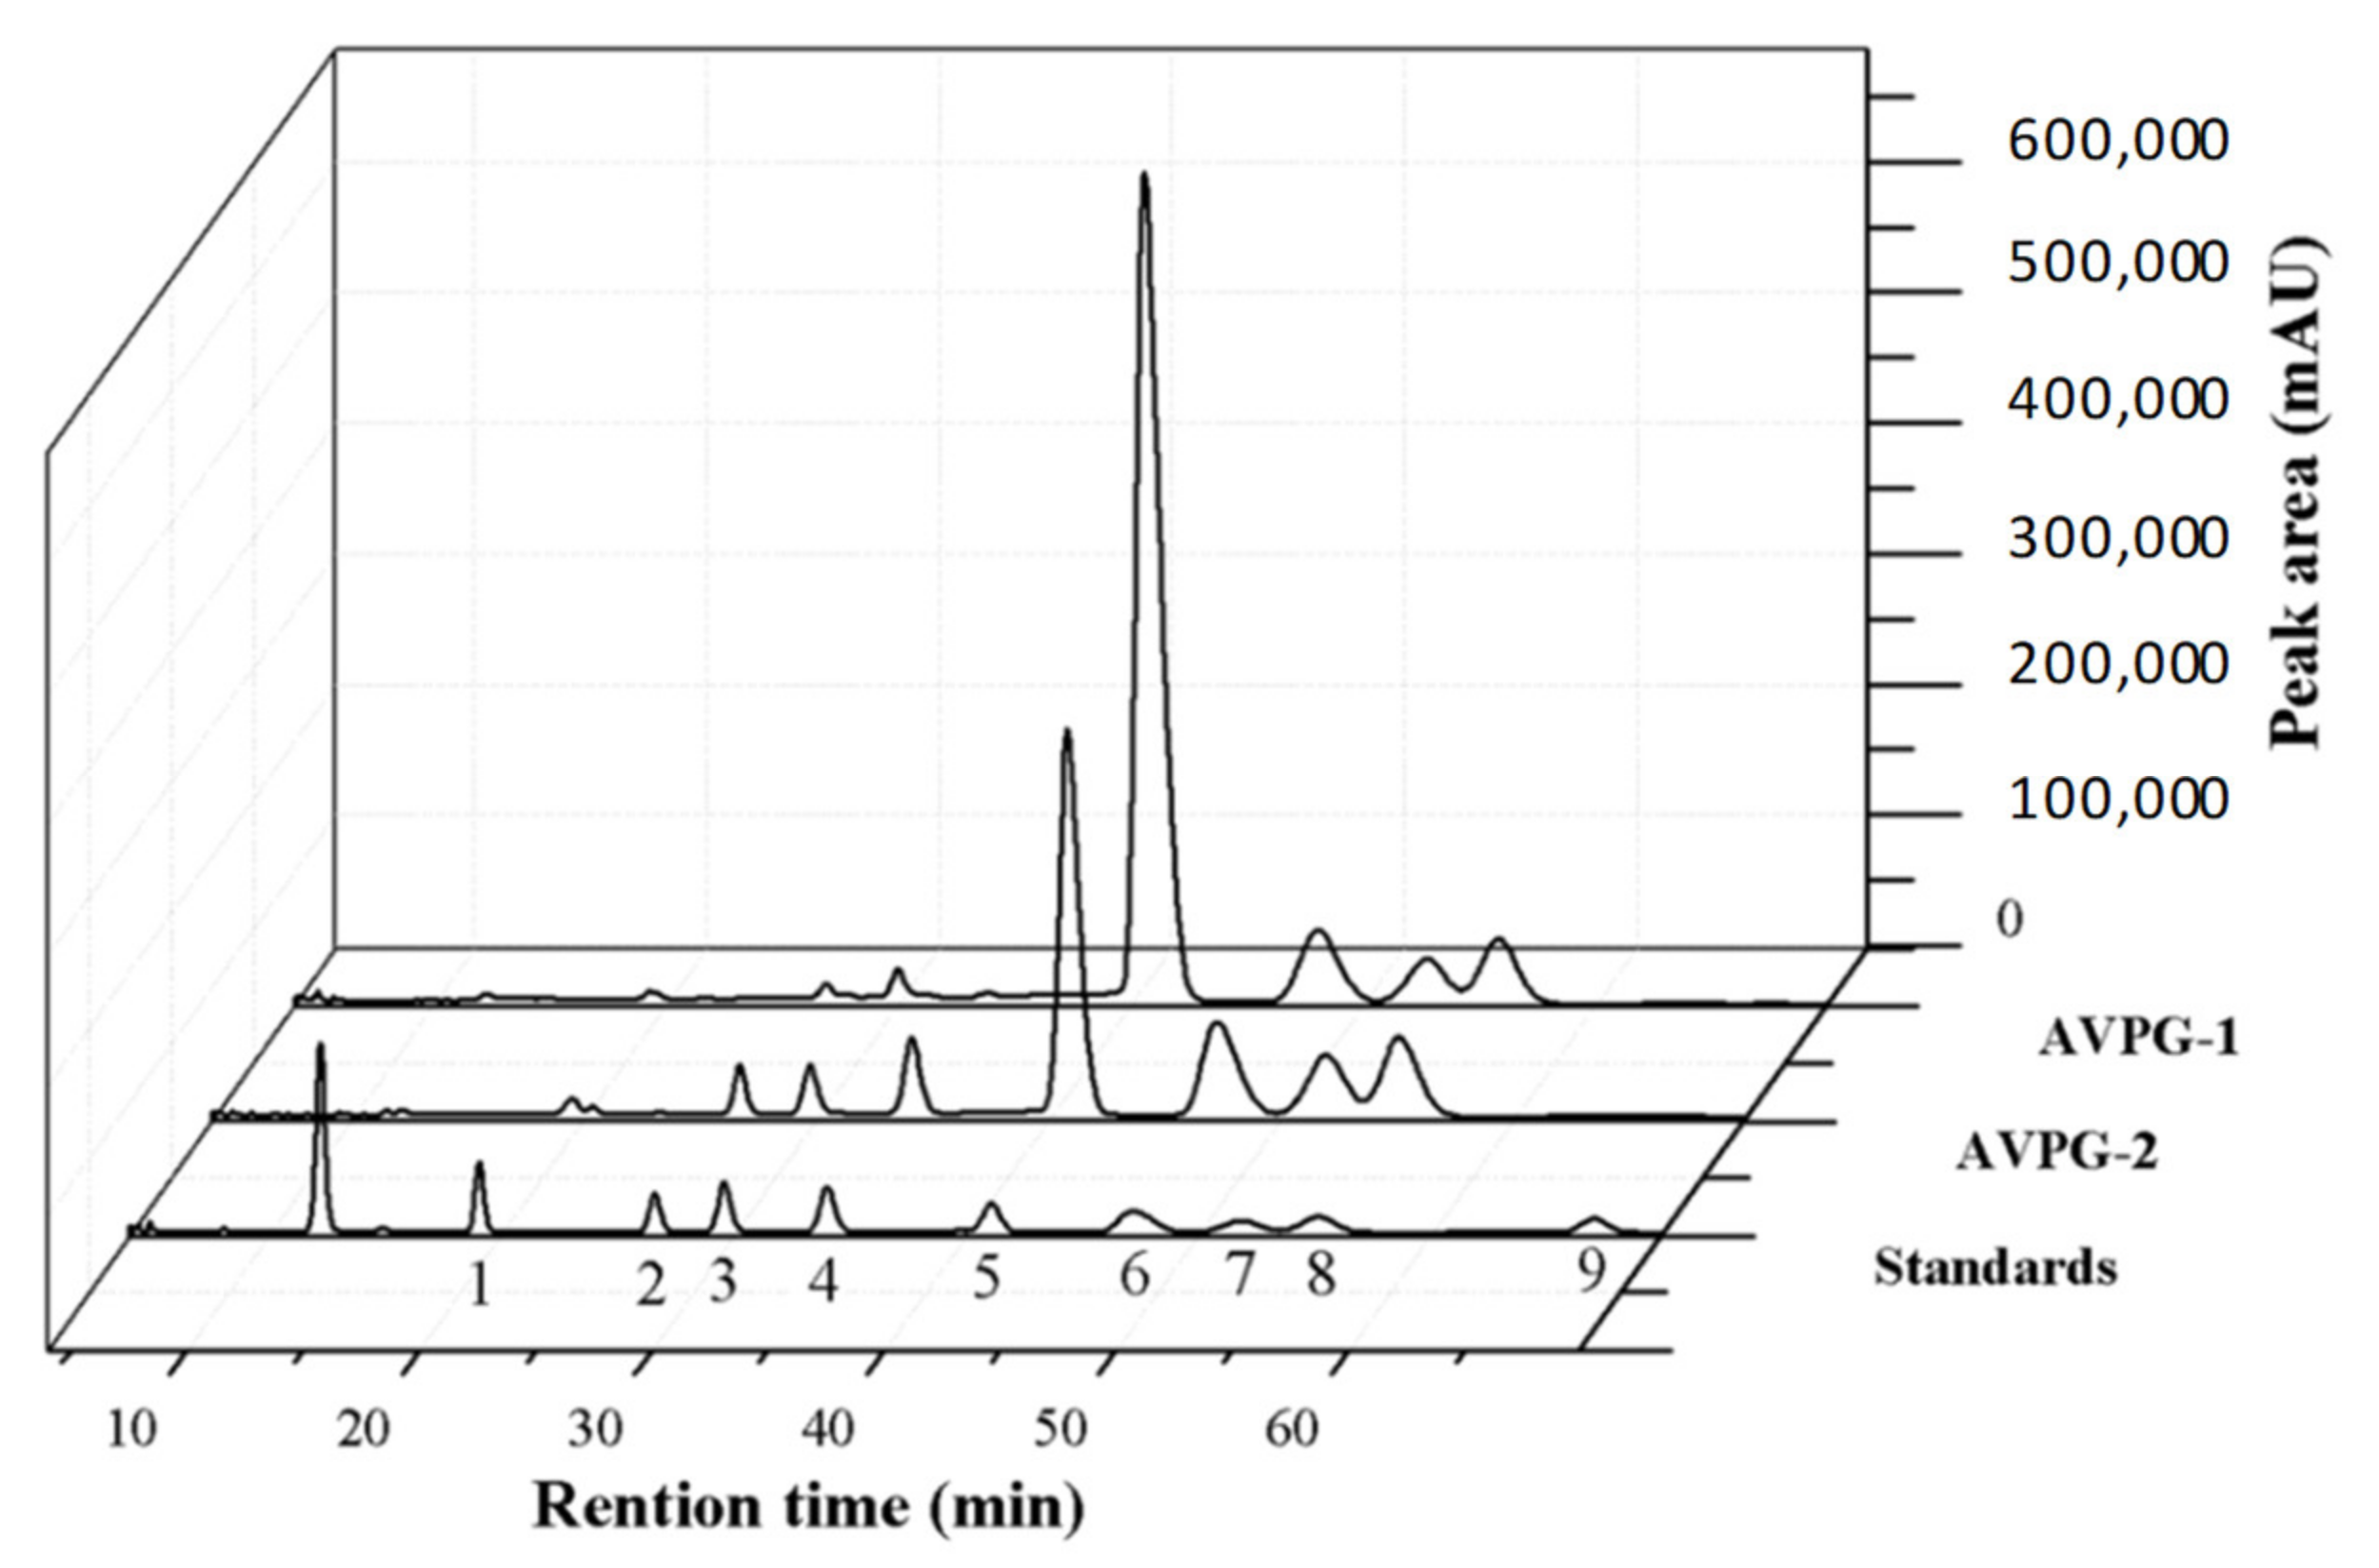
2.2.1. Monosaccharide Composition Identification

As shown in Figure 2, AVPG-1 is mainly comprised of glucose (73.11%), galactose (10.29%), xylose (6.21%), arabinose (8.83%) and minor glucuronic acid (1.57%). AVPG-2 is mainly comprised of rhamnose (3.11%), glucose (40.23%), galactose (17.82%), xylose (12.53%), arabinose (15.81%), glucuronic acid (3.99%) and galacturonic acid (6.51%). The monosaccharide composition of the two polysaccharides was similar. Glucose played a dominant role in all kinds of monosaccharides. The major difference between them was that AVPG-2 had a higher ratio of uronic acid than AVPG-1, which coincided with the results of the m-hydroxybiphenyl colorimetric test.

2.2.2. Determination of Homogeneity and Molecular Weight

Biological activities of polysaccharides are closely related to their molecular weights [26]. Hence, choosing a suitable method to measure the molecular weights of polysaccharides is very important. Both AVPG-1 and AVPG-2 showed a single, sharp and symmetrical peak on the high-performance gel permeation chromatography (HPGPC) chromatogram. However, their molecular weights were too high to be out of the range of linearity. Here, high performance size exclusion chromatography coupled with multi-angle laser light scattering and refractive index detector (HPSEC-MALLS-RID) with no need of standards was used. The number-average molecular weight (Mn) and weight-average molecular weight (Mw) for AVPG-1 were measured as 3.48 × 10⁵ Da and 5.14 × 10⁵ Da, and for AVPG-2 were 1.15 × 10⁷ Da and 1.48 × 10⁷ Da, respectively. The value of Mw/Mn, which is defined as the polydispersity index (PDI), represented the uniformity of particle size distribution (PDI = 1.0 of monodispersed particles) [27]. The results indicated that the distribution of molecular weight of AVPG-1 or AVPG-2 was symmetric and unimodal because only one peak was observed (Figure 3A,B) with a relatively small PDI value of 1.47 or 1.29, respectively. As a result, either AVPG-1 or AVPG-2 was a homogeneous polysaccharide.
The Mw of polysaccharides from A. villosum in this study was quite different from what was reported previously [15]. The possible reasons may be the discrepancy of origin and extraction methods. There were many studies suggesting that ultrasonic-assisted extraction would decrease the molecular weight of polysaccharides [28] and hot-water extraction would make polysaccharides particles gather into large aggregates [29].

2.2.3. Fourier Transform Infrared (FT-IR) Spectroscopy Analysis

Infrared spectroscopy is usually used to analyze the functional groups, monosaccharide types and glycosidic linkages of polysaccharides [30]. The FT-IR spectra of AVPG-1 and AVPG-2 are shown in Figure 3C. The FT-IR spectra could be divided into five fractions (A, B, C, D and E). The broad and intense peak of fraction A between 3600 cm−1 and 3200 cm−1 (AVPG-1: 3314.15 cm−1, AVPG-2: 3335.97 cm−1) was attributed to the stretching vibrations of hydroxyl groups (O-H) [31]. The small peaks at 2925.00 cm−1 and 2926.40 cm−1, which belonged to fraction B, were due to the bending vibration of C-H of the methyl groups [32]. In fraction C, the peaks centered at 1650–1600 cm−1 were caused by C=O stretching of free COO-, confirming the presence of uronic acid in AVPG-1 and AVPG-2. In addition, there was a specific peak at 1732.13 cm−1 shown in the spectrum of AVPG-2, which belonged to C=O stretching of methyl-esterified COO- (1760–1730 cm−1) [33]. Generally, the peaks of fraction D between 1200 cm−1 and 1000 cm−1 were called “finger-print” region of polysaccharides. In this region, multiple stretching vibrations came from asymmetric O-C-O (glycosidic linkages), C-C-O (sugar rings) and C-C-O (side groups) [34]. Three peaks were observed of AVPG-1(1149.03 cm−1, 1077.78 cm−1 and 1016.66 cm−1) and AVPG-2 (1147.55 cm−1, 1076.44 cm−1 and 1019.48 cm−1), respectively, signifying they were polysaccharides. The area of fraction E below 1000 cm−1 offers more information about the sophisticated structure [31]. The absorption peak at 853.08 cm−1 indicated that AVPG-1 mainly contained the α configuration [33]. The characteristic absorptions at 934.76 cm−1, 853.08 cm−1 and 761.71 cm−1 suggested that AVPG-1was a d-glucopyranose derivative [35]. As for AVPG-2, the weak absorption bands at 895.80 cm−1, 853.91 cm−1 and 835.77 cm−1 implied that α- and β- glycosidic linkages existed simultaneously [31]. In addition, peak intensities in the region of 1658–1650 cm−1 and 1555–1530 cm−1 were not detected indicating free of protein contamination [34]. These results further verified that AVPG-1 and AVPG-2 were acidic polysaccharides.

2.2.4. Determination of Triple Helical Structure

Polysaccharides with a triple-helix conformation can form a specific complex with Congo red in an alkaline solution [36], and the maximum absorption wavelength (λmax) of the complex would shift to a longer wavelength. As shown in Figure 3D, an obvious red-shift of the λmax was observed after forming the Congo red-AVPG-2 complex and then the tendency stabilized with increasing concentrations of NaOH solution (0–0.5 mol/L), while the λmax of both Congo red and the Congo red-AVPG-1 complex decreased under the same conditions. The results suggested that AVPG-2 possessed a triple-helical conformation, while AVPG-1 did not.

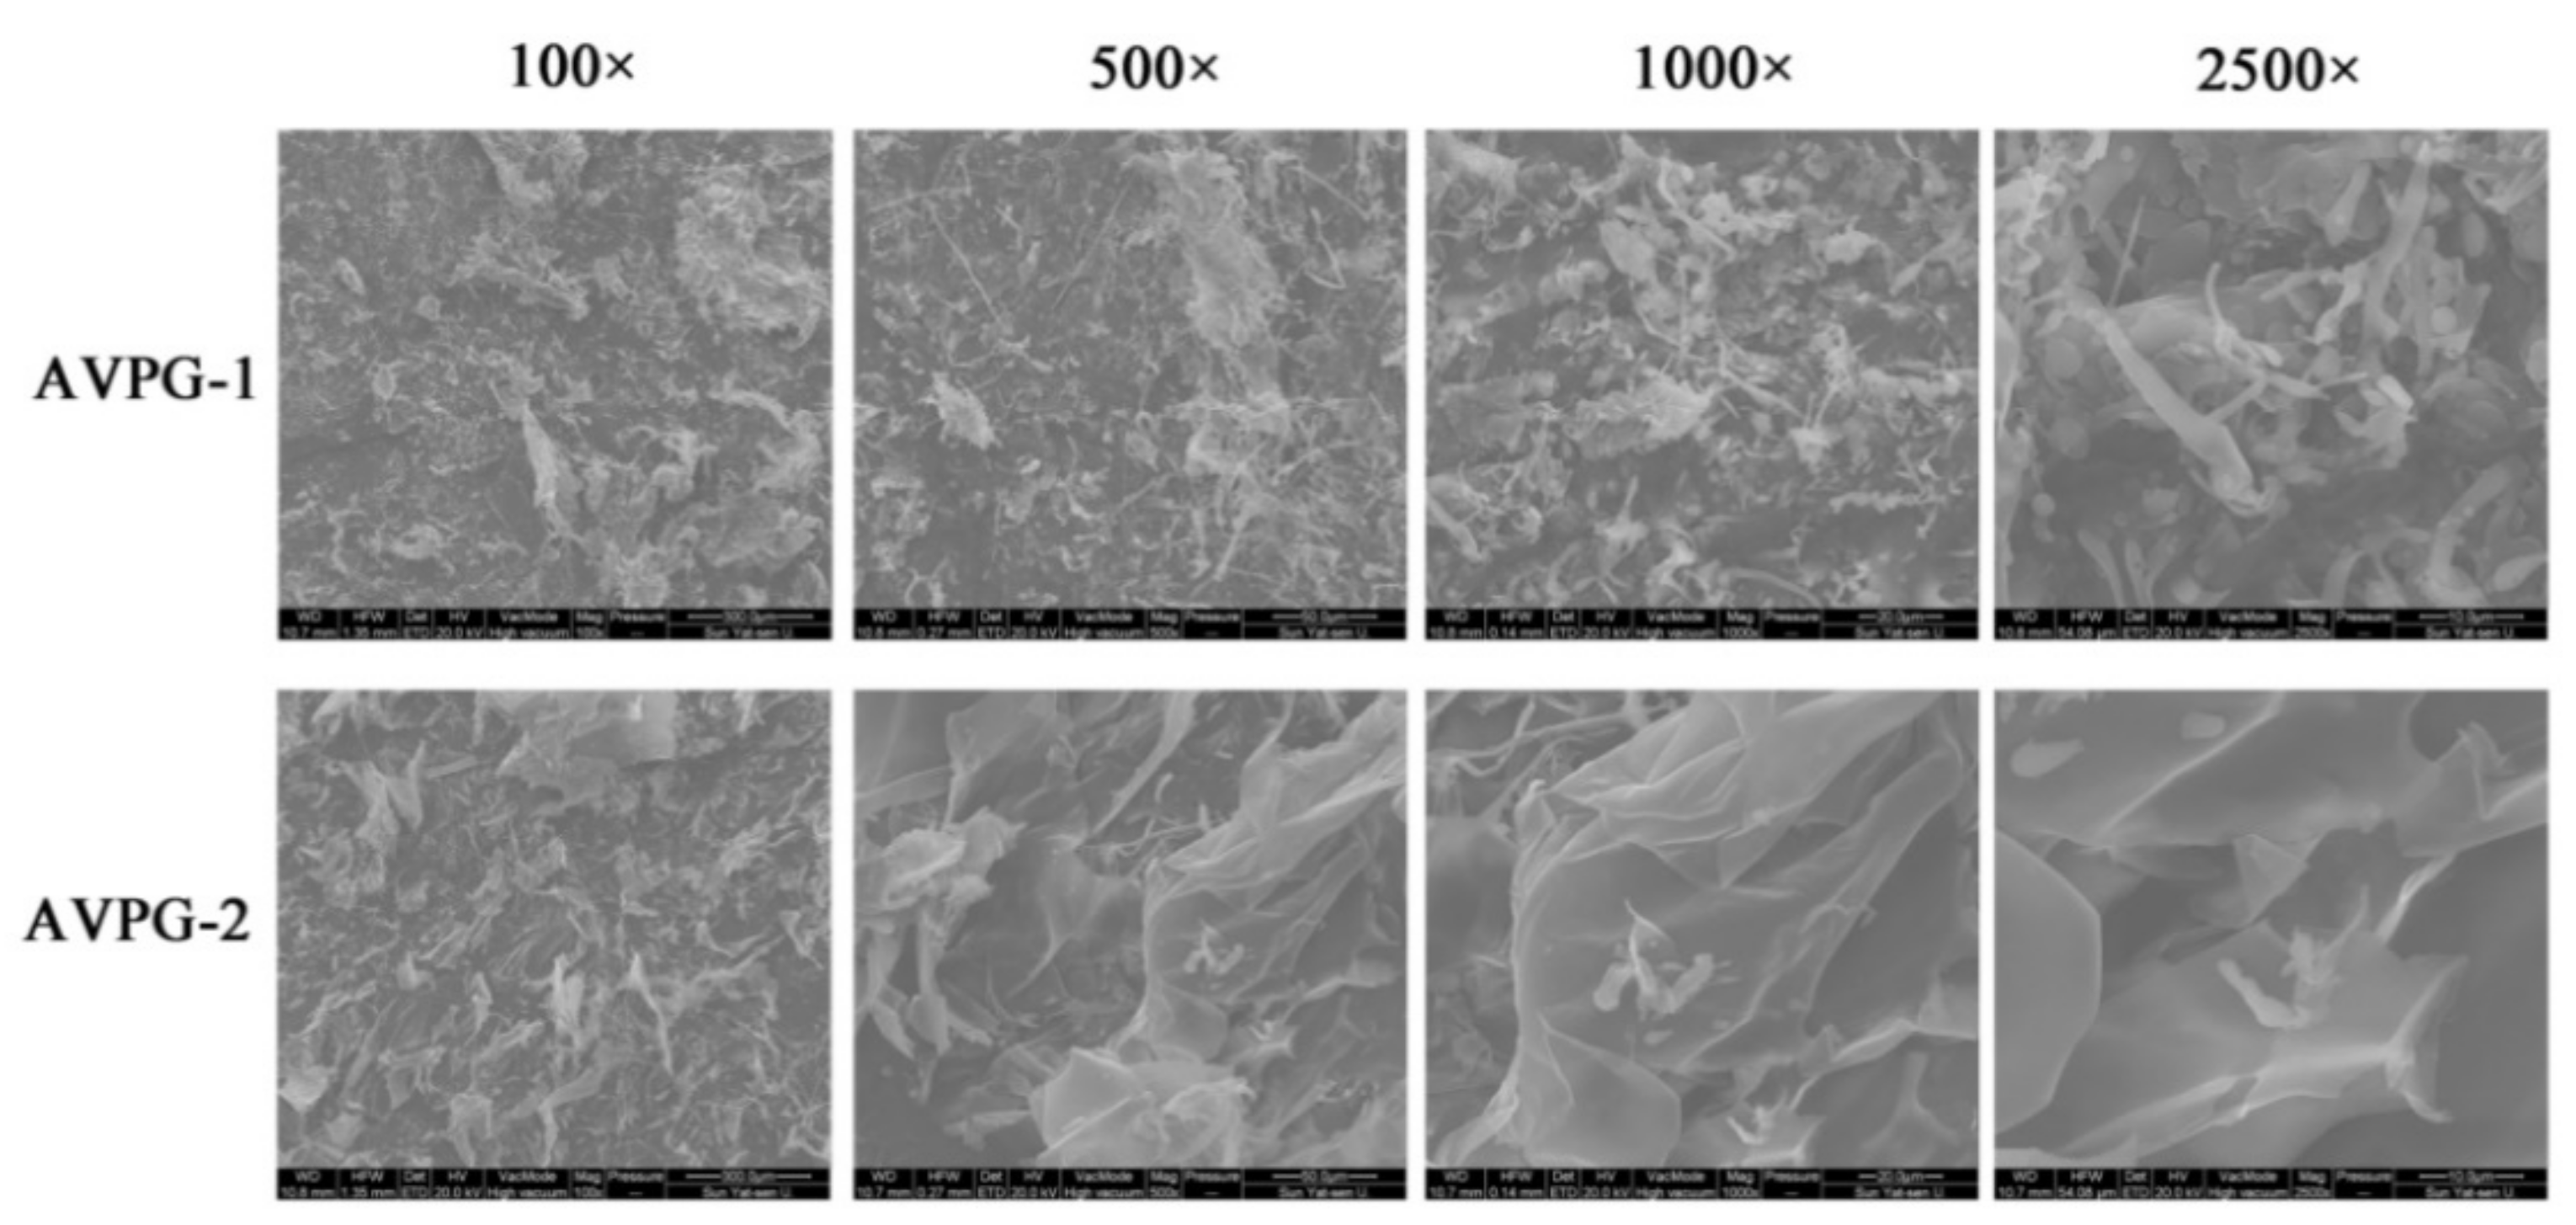
2.2.5. Surface Microscopic Analysis

Figure 4 shows the scanning electron microscopy (SEM) images of AVPG-1 and AVPG-2 at magnifications of 100×, 500×, 1000× and 2500×. The two polysaccharides displayed obvious variations in size and shape. AVPG-1 was gathered by a lot of particles similar to rod- and ellipsoid-shape. SEM observations revealed that the surface morphology of AVPG-2 presented a surface with a curled, tight and sheet-like appearance. In addition, few small particles were observed among the sheets. The tight and sheet-like appearance of AVPG-2 demonstrated that there might be strong interaction forces because of the highly branched conformation or electrostatic interactions between the polysaccharides [37,38].

2.2.6. Methylation Analysis

Methylation analysis was performed to determine the glycosidic bonds in polysaccharides and the results were listed in Table 1. The results implied that AVPG-1 was composed of →4)-Glcp-(1→, →3,4)-Glcp-(1→, →4)-Galp-(1→, Xylp-(1→ and Araf-(1→. AVPG-2 was composed of →4)-Glcp-(1→, →4)-Galp-(1→, Araf-(1→, →6)-Glcp, →3)-Galp-(1→, →3,6)-Galp-(1→, →5)-Araf-(1→, →4)-Xylp-(1→ and Rhap-(1→.

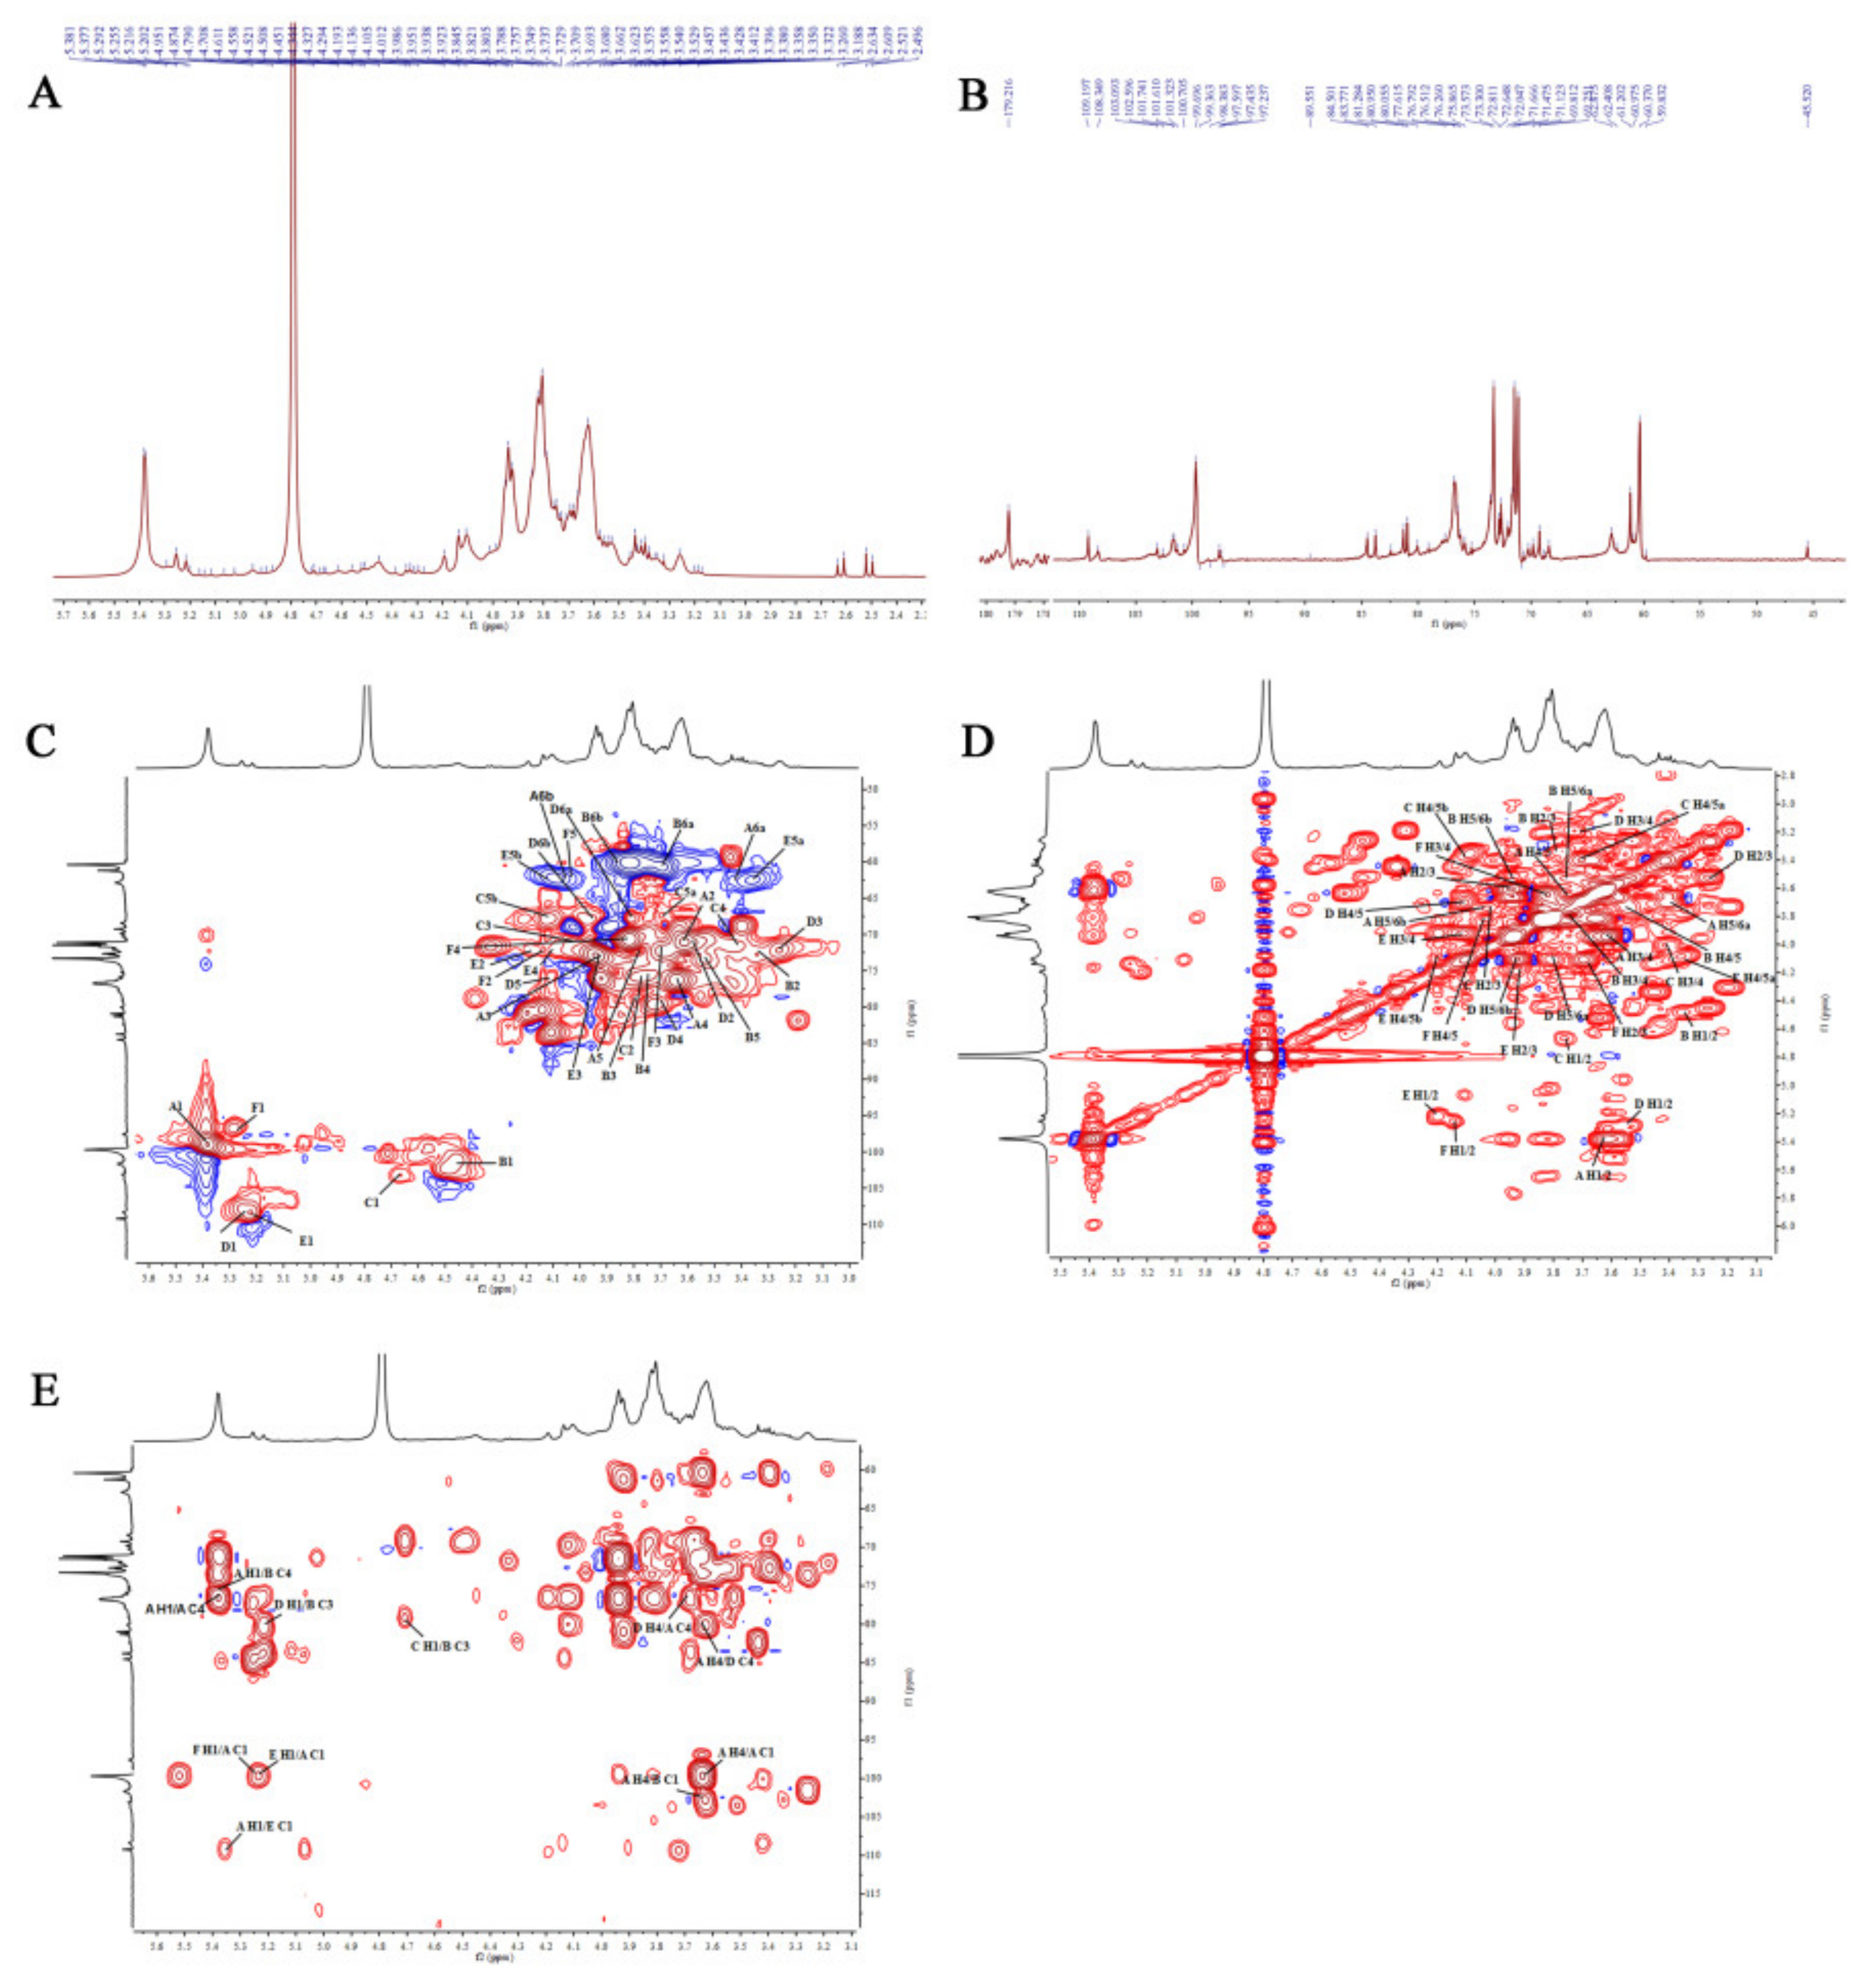
2.2.7. Nuclear Magnetic Resonance (NMR) Analysis

The structural characteristics of AVPG-1 and AVPG-2 were further analyzed by NMR spectra. The 1D NMR spectra and 2D NMR spectra of the two polysaccharides are shown in Figure 5 and Figure 6. Their corresponding carbon and hydrogen signals are listed in Table 2.
The 1H NMR spectrum of AVPG-1 showed six anomeric signals at δ 5.38 ppm, δ 4.45 ppm, δ 4.71 ppm, δ 5.22 ppm, δ 5.20 ppm and δ 5.26 ppm (denoted as A, B, C, D, E and F, respectively). In 13C NMR spectrum, six signals were found in the anomeric region at δ 99.70 ppm, δ 101.61 ppm, δ 103.10 ppm, δ 108.35 ppm, δ 109.20 ppm and δ 97.60 ppm. An additional signal, assigned to uronic acid, was observed in the unesterified region at δ 179.22 ppm.
The heteronuclear single-quantum coherence (HSQC) correlation map from anomeric region showed C1/H1 signals at δ 5.38/99.70 ppm (A), δ 4.45/101.61 ppm (B), δ 4.71/103.10 ppm (C), δ 5.22/108.35 ppm (D), δ 5.20/109.20 ppm (E) and δ 5.26/97.60 ppm (F) (Figure 5C). The α-configurations of residues A, D, E and F were confirmed from the chemical shifts of anomeric protons of greater than δ 4.90 ppm, whereas the β-configurations of residues B and C were confirmed by the low frequency of H-1 and high frequency of C-1 signals [39]. The chemical shifts of H-1/H-2, H-2/H-3 and H-3/H-4 were observed at δ 5.38/3.62 ppm, δ 3.62/3.95 ppm and δ 3.95/3.64 ppm in 1H–1H correlated spectroscopy (1H-1H COSY) spectrum, thus the chemical shifts of H-1 to H-4 in residue A were assigned to be δ 5.38 ppm, δ 3.62 ppm, δ 3.95 ppm and δ 3.64 ppm, respectively. The H-5 and H-6 proton chemical shifts for residue A were obtained based on 1H-1H COSY and HSQC spectra. According to the 1H NMR assignment, their corresponding carbon signals from C-1 to C-6 were identified from HSQC spectra. Combined with literature data [40] and methylation analysis, the signals derived from residue A were successfully assigned to →4)-α-d-Glcp-(1→. Likewise, the assignment of chemical shifts of residues B to F abided by the same routine [41,42,43,44], as shown in Table 2. The downfield shifting of carbon signal of C-4 suggested a substitution on free hydroxyl group of C-4 of residues A, B and D. The downfield shifting of carbon signal of C-3 suggested a substitution on free hydroxyl group of C-3 of residues B [45]. Therefore, residues A to F were confirmed as →4)-α-d-Glcp-(1→, →3,4)-β-d-Glcp-(1→, β-d-Xylp-(1→, →4)-α-d-Galp-(1→, α-l-Araf-(1→ and α-d-GlcpA-(1→.
Subsequently, the heteronuclear multiple-bond correlation (HMBC) spectra were analyzed for the linkage sites and sequence among the sugar residues. The strong signal at δ 5.38/76.14 ppm (AH1/AC4) showed that C-4 of residue A was linked to O-1 of residue A. Similarly, the other cross signals were listed in Table S1. The HMBC spectrum suggested the sequences among the sugar residues of AVPG-1 are as follows: AC4 → AO1, AC1 → AO4, BC4 → AO1, BC1 → AO4, AC4 → DO4, BC3 → CO1, DC4 → AO4, EC1 → AO1, BC3 → DO1, AC1 → EO1 and AC1 → FO1. Finally, the results of monosaccharide composition, FT-IR, methylation and NMR spectra analyses suggested that AVPG-1 might be constructed by a backbone of → 4)-α-d-Glcp-(1 → 3,4)-β-d-Glcp-(1 → 4)-α-d-Glcp-(1 → with several side chains.
Similarly, the 13C NMR spectrum (Figure 6B) of AVPG-2 showed twelve anomeric carbon signals in the anomeric region, which were correlated to proton signals in the HSQC spectrum (Figure 6C). These twelve correlation peaks in the anomeric region of AVPG-2, including δ 4.62/95.84 ppm, δ 5.40/99.70 ppm, δ 5.39/101.63 ppm, δ 5.22/108.27 ppm, δ 4.41/103.09 ppm, δ 5.23/109.18 ppm, δ 5.20/92.01 ppm, δ 5.07/98.92 ppm, δ 4.49/102.72 ppm, δ 4.71/100.70 ppm, δ 5.26/97.61 ppm and δ 5.06/107.43 ppm (denoted as A, B, C, D, E, F, G, H, I, J, K and L, respectively), revealed that there were twelve sugar residues in AVPG-2. The assignment of chemical shifts of these residues were determined according to 1H, 13C, HSQC, 1H-1H COSY and HMBC spectra, as well as data reported in the literature [40,43,44,46,47,48,49] and the results of methylation analysis, as shown in Table 2. The linkage sites and sequence among the sugar residues of AVPG-2 were also analyzed according to the HMBC spectra (Figure 6E). The cross signals were listed in Table S1. The sequences among the sugar residues of AVPG-2 are as follows: BC4 → BO1, BC1 → BO4, BC1 → EO3, EC1 → BO4, IC4 → EO6, EC6 → IO4, AC6 → IO1, IC1 → AO6, EC6 → DO4, CC3 → DO1, DC1 → CO3, HC5 → CO1, FC1 → HO1, EC6 → JO1, HC1 → EO6, LC4 → HO5, BC1 → EO6, BC4 → KO1, BC4 → EO6 and BC1 → GO1. Accordingly, AVPG-2 might be a heteropolysaccharide with a backbone of → 4)-α-d-Glcp-(1 → 3,6)-β-d-Galp-(1 → 4)-α-d-Glcp-(1 → with several side chains.

2.3. Immunomodulatory Activities

Macrophages belong to the congenital immune system and play a vital role in the innate and adaptive immune regulation. Macrophages have multiple functions such as phagocytosis, antigen presentation and production of different type of cytokines [50]. In the present study, the immunomodulatory activities of polysaccharides were assayed using RAW 264.7 cells by measuring their viability, phagocytosis, induced nitric oxide (NO) and cytokines production.

2.3.1. Effects of Polysaccharides on Cell Viability and NO Production of Macrophages

The Cell Counting Kit-8 (CCK-8) assay was used to measure the influence of AVPG-1 and AVPG-2 on the viability of RAW 264.7 cells. As shown in Figure 7A,B, both polysaccharides increased cell proliferation at the tested concentrations in comparison with the blank control. AVPG-2 exhibited a better activity of stimulating cell proliferation than that of AVPG-1.
NO is a kind of important molecules with lots of physiological functions like resisting pathogen invasion and regulating apoptosis [51]. Besides, the increased NO secretion was also commonly function as an indicator of macrophage activation, especially in the assessment of immunostimulatory activity of polysaccharides. As shown in Figure 7C,D, AVPG-1 significantly increased the NO production at concentrations of 50, 100 and 200 μg/mL (p < 0.05), and the amount of NO released reached the maximum when the concentration was 100 μg/mL. AVPG-2 exhibited strong stimulatory effect on RAW 264.7 cells at all concentrations. The amount of NO released by RAW 264.7 cells was close to that of the lipopolysaccharide (LPS) group when the concentration of AVPG-2 reached 800 μg/mL. Moreover, AVPG-2 induced significantly more NO production than AVPG-1. This difference might be related to the molecular weight. It was reported that molecular weight of polysaccharides was a key factor to affect NO production, and the polysaccharides with higher molecular weight induced more NO production [52].
The immunomodulatory activity of AVPG-2 was better than that of AVPG-1, as shown by the results of the cell viability and NO production assays. As a result, AVPG-2 was selected for further investigation.

2.3.2. Effect of AVPG-2 on Cytokines Secretion of Macrophages

Interleukin (IL-6) is a key signaling molecule in regulating acute-phase response, that promotes the population expansion and activation of T cells and the differentiation of B cells [53]. TNF-α is one of the most important cytokines that regulates acute local or systemic immune and inflammatory responses [54]. Briefly, IL-6 and tumor necrosis factor (TNF)-α are pro-inflammatory cytokines playing important roles in the regulation of the immune response. IL-10 is secreted by a wide range of cell types and has been intensively studied due to its pleiotropic and at times seemingly contradictory effects. In this work, the secretion of IL-6, TNF-α and IL-10 were investigated by Enzyme-linked Immunosorbent Assay (ELISA) kits. Results showed that AVPG-2 significantly promoted the secretions of IL-6 and TNF-α in RAW 264.7 cells compared to the control group (p < 0.05) (Figure 7E,F). The effect of AVPGs on the secretion of IL-6 was comparable to that of LPS when the concentrations of AVPG-2 reached to 400 and 800 μg/mL. However, the production of IL-10 was slightly increased (Figure 7G). According to these data, we speculated that RAW 264.7 cells were activated into M1 macrophages after exposure to AVPG-2.

2.3.3. Effects of AVPG-2 on Polarization of Macrophages

Macrophages can be polarized into M1 or M2 macrophages by environmental factors. M1 macrophages participate in the removal of pathogens; they secrete higher levels of pro-inflammatory cytokines such as TNF-α, IL-1α, IL-1β, IL-6, IL-12, IL-23 and cyclooxygenase (COX)-2 and low levels of IL-10. In contrast, M2 macrophages produce anti-inflammatory cytokines such as higher levels of IL-10 and transforming growth factor (TGF)-β, but little IL-12 [55]. The two sub-populations of macrophages have different functions and participate in the pathogenic process of various diseases.
To further investigate which subtypes are activated in response to AVPG-2 treatment, the transcription of CD86 and CD206, two commonly used markers of M1 macrophages and M2 macrophages were investigated [56]. LPS and IL-4 are the M1 and M2 polarization agents, respectively [57,58]. As shown in Figure 7H, LPS and IL-4 upregulated the mRNA expression of CD86 and CD206, respectively. This result indicated that the experimental models were established successfully. When RAW 264.7 cells were exposed to AVPG-2, the mRNA expression of CD86 was increased, while CD206 decreased, which was similar to LPS. When the cells were co-stimulated by IL-4 and AVPG-2, the mRNA expression of CD86 was increased, while CD206 decreased slightly, which indicated that IL-4 induced M2 polarization was reversed. This phenomenon did not occur in the co-stimulation group of LPS and AVPG-2. This experiment indicated that AVPG-2 induced M1 polarization in macrophages and it could screw the polarization of macrophages to M1 direction. The result confirmed the conjecture mentioned above.

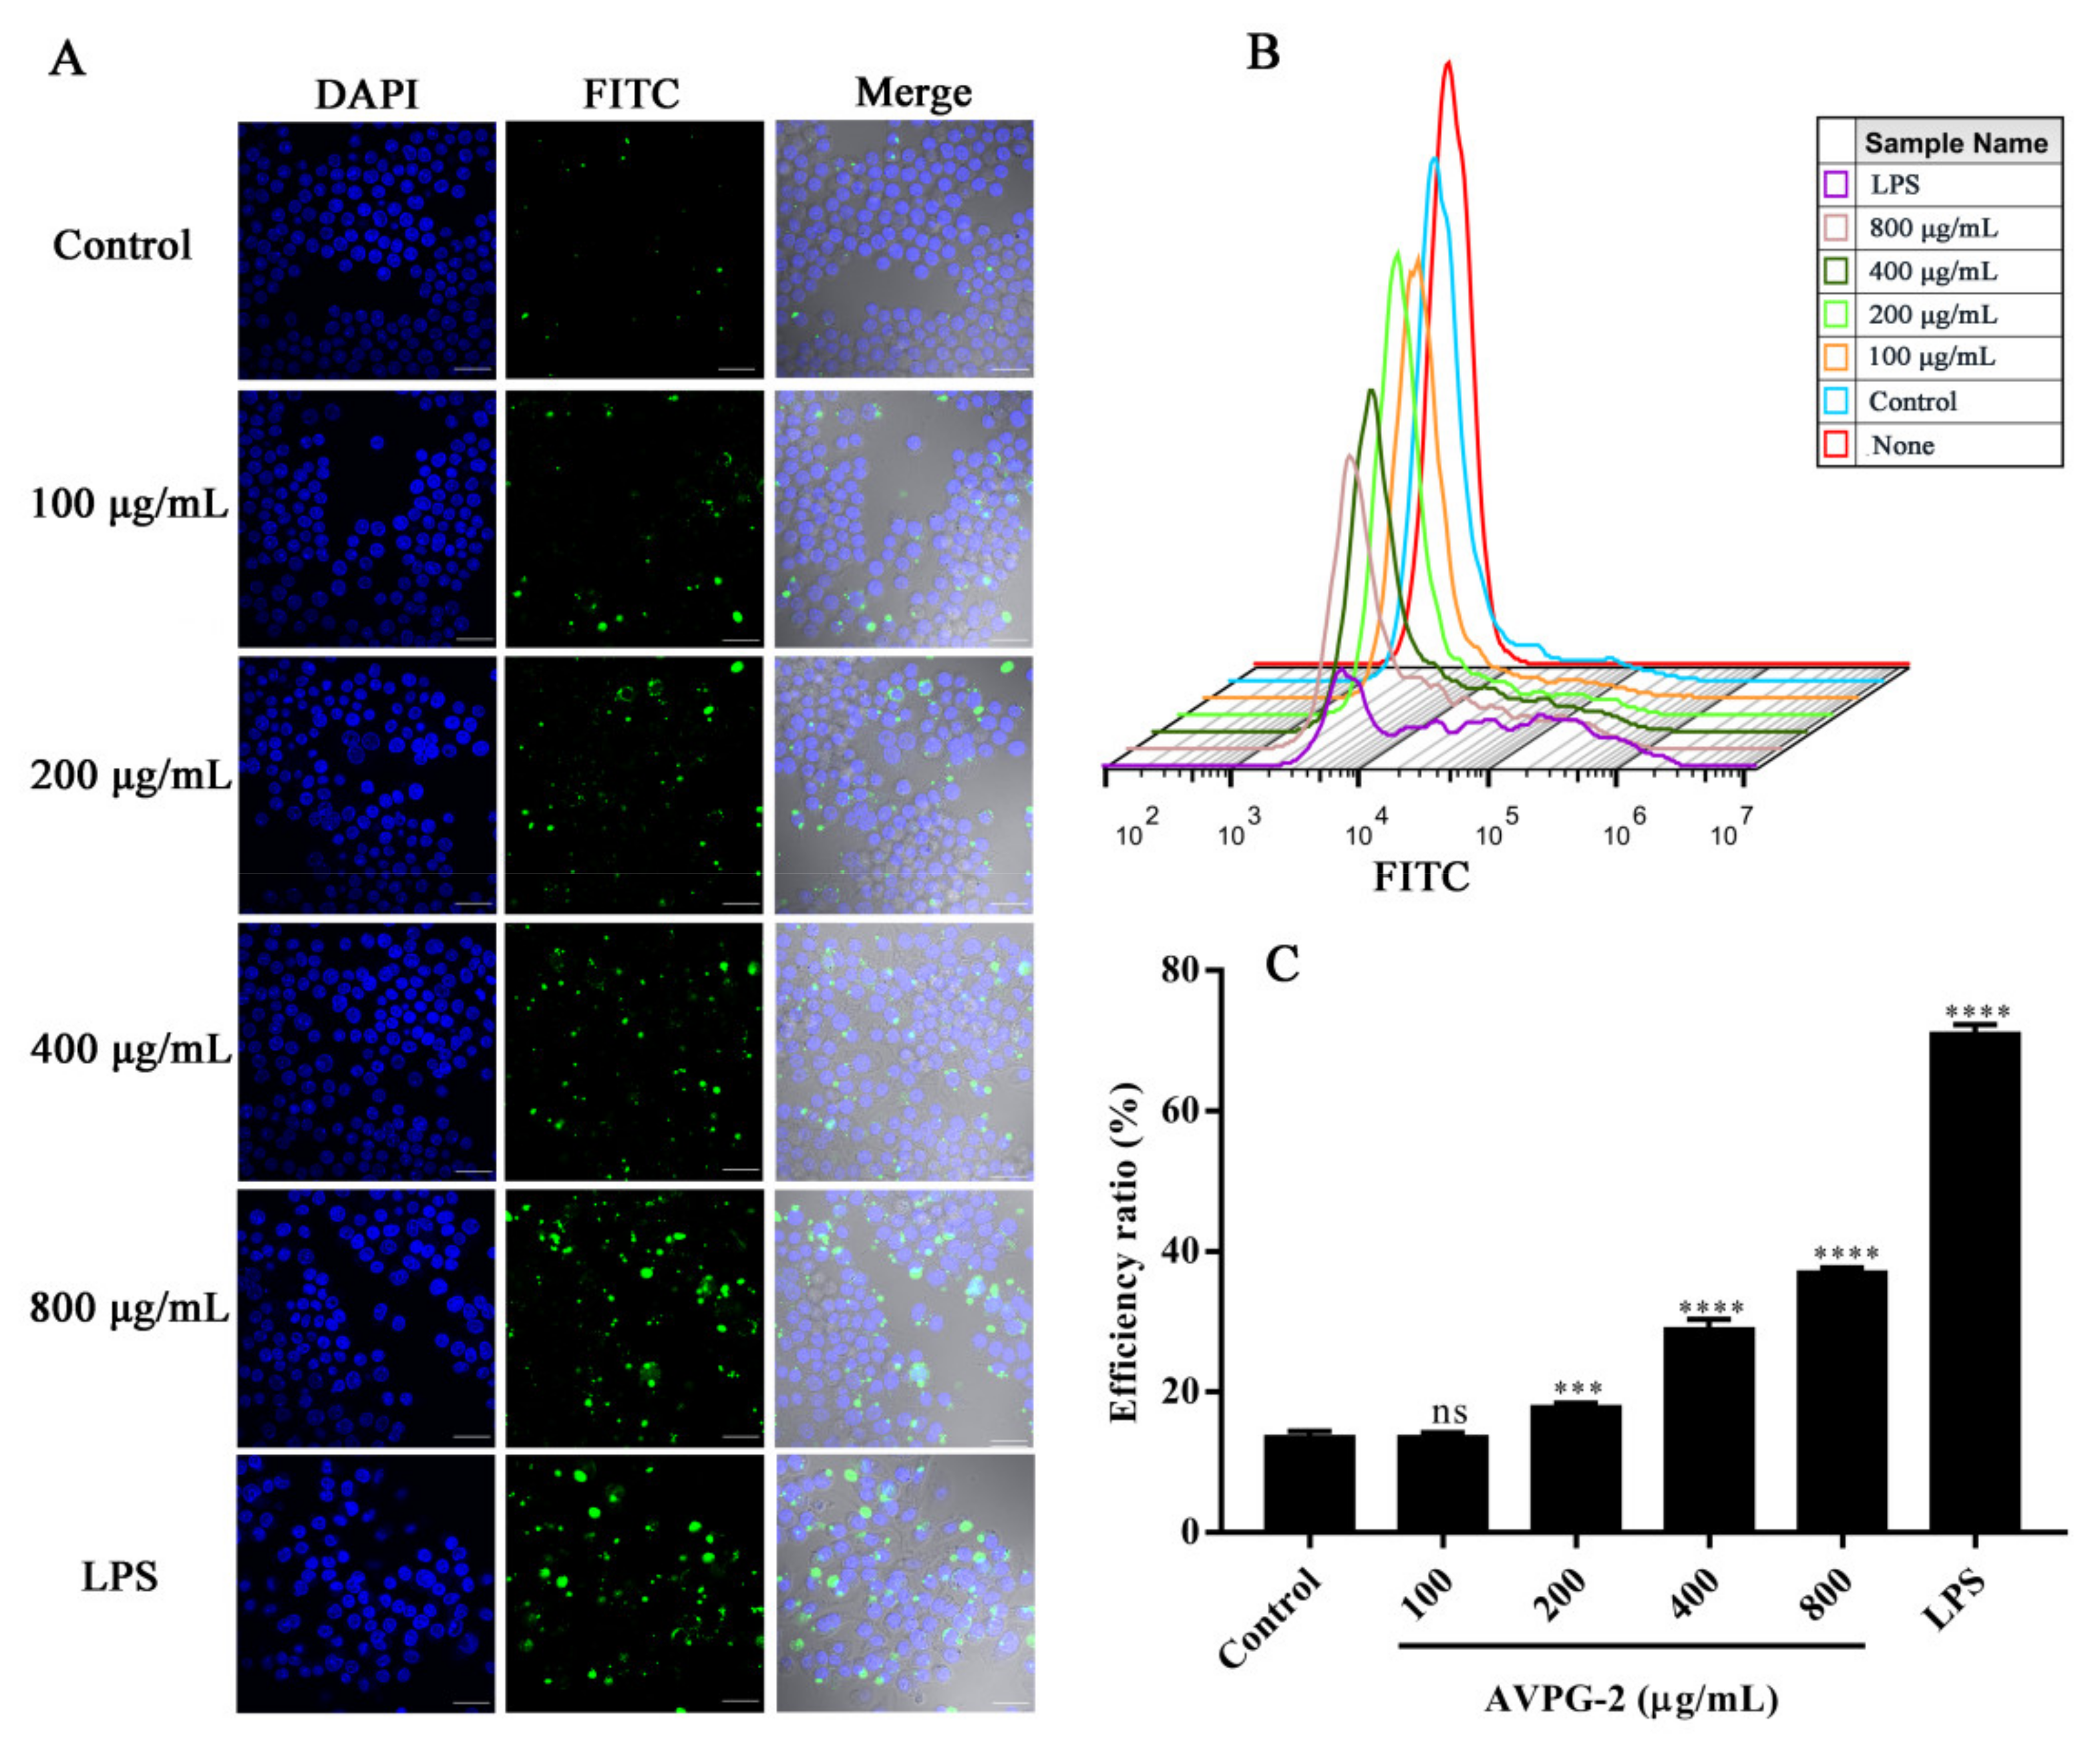
2.3.4. Effects of AVPG-2 on Phagocytic Capacity of Macrophages

The process for large particles engulfed by membrane protrusions is called phagocytosis [59]. Phagocytosis is a vital basis for macrophages to exert its functions in eliminating pathogens and damaged cells, and it is one of the indicators for macrophage activation. Here, we determined the effect of AVPG-2 on phagocytic capacity of RAW 264.7 cells qualitatively by using fluorescein isothiocyanate (FITC)-labeled Escherichia coli (E. coli) on a laser scanning confocal microscope. As illustrated in Figure 8A, the FITC-labeled E. coli (green fluorescence) were apparently engulfed into cells and outside of nucleus (blue fluorescence). A dose-dependent increase of the intensity of green fluorescence was observed in AVPG-2 treated groups. To perform a quantitative analysis of the fluorescence intensity, a flow cytometer was used. The results showed that the fluorescence intensity gradually increased with increasing concentrations of AVPG-2 (Figure 8B). The efficiency ratio, which was defined as the percentage of cells that have engulfed FITC-labeled E. coli [60], of positive fluorescence cells in drug groups at concentrations of 200, 400 and 800 μg/mL was significantly higher than that of control group (p < 0.001) (Figure 8C).
The immunomodulatory activity study indicated that AVPG-1 and AVPG-2 exhibited immunostimulatory activity and the effect of AVPG-2 was stronger than that of AVPG-1. The bioactivities of polysaccharides were closely related to its chemical structure. Growing evidence demonstrated that these structural features mainly include monosaccharide composition, molecular weight, glycosidic linkage types, the diastereomeric forms and conformation [61,62,63]. Structural analyses indicated that AVPG-2 possessed a higher molecular weight (1.48 × 10⁷ g/mol), higher uronic acid content (28.04 ± 0.46) and more glycosidic linkage types than AVPG-1. Moreover, AVPG-2 existed as a triple helix structure but AVPG-1 did not. According to previous studies, all those features (higher molecular weight [64], higher uronic acid content [65], specific glycosidic linkage types [54] and triple helix structure [26]) made a stronger immunomodulatory activity of polysaccharides. Further experiments suggested that AVPG-2 could enhance the secretion of NO, IL-6 and TNF-α by RAW 264.7 cells and slightly elevate cell viability, as well as improve phagocyte activity of macrophages. Aside from function as markers of M1 macrophages, the pro-inflammatory factors are the mediators to exert their immunomodulatory function of macrophages. For example, IL-6 plays an important role in boosting T cells trafficking to lymph nodes and to tumor sites, where they could become activated and execute their cytotoxic effector functions, respectively [66]. TNF-α could also enhance anti-tumor immunity [67]. RT-PCR analysis showed that macrophages could be polarized into M1 but not M2 phenotype upon AVPG-2 stimulation. The different macrophage populations, M1 and M2, play different roles in various processes [50]. For example, M1 macrophages are able to kill tumor cells, while M2 macrophages promote angiogenesis and tumor growth [68]. In patients with various cancers, the presence of M2 macrophages are closely correlated to poor prognosis [69]. Our results demonstrated that AVPG-2 was able to turn the polarization of macrophages to the M1 direction, which may provide additional help to slow down the progression of malignant diseases [70]. However, M1 macrophages would damage normal cells and tissues when overly induced. Keeping the balance of M1/M2 macrophage polarization is very important, because it governs the fate of an organ in inflammation or injury. AVPG-2 activated macrophages moderately in the present study. Although the bioavailability and bacteria digestion were commonly considered as limiting factor for the clinical usage of polysaccharide, accumulating studies demonstrated certain polysaccharides were able to penetrate into the gastrointestinal mucous barrier and ingest into the blood circulation. For example, a polysaccharide from Angelica sinensis was able to penetrate through the intestinal monolayer via endocytosis and absorb into the blood [71]. Additionally, some peptides were able to inhibit the digestive enzyme, which may provide an alternative way to promote its absorption and bioavailability [72]. Considering the plant derived polysaccharides share similar physicochemical properties, the AVPG-2 identified in our study may absorb as their original form in vivo, at least partially, and exert its immunoregulatory effects. It is possible to develop AVPG-2 into immunomodulatory agents. Further investigations should focus on the pathways related to absorption and metabolism. The signaling pathways for immune regulation also need to be clarified.

3. Materials and Methods

3.1. Materials and Reagents

The seeds of A. villosum were purchased from Wenshan Autonomous Prefecture, Yunnan Province, China: 2019 harvest. DEAE-52 Cellulose and Sephadex G-100 were purchased from Solarbio (Beijing, China). Monosaccharide standards and LPS were purchased from Sigma-Aldrich Chemical Co. (St., Louis, MO, USA). Deuterium oxide and trifluoroacetate acid (TFA) were purchased from Sigma-Aldrich Co. (Beijing, China). Dulbecco’s modified eagle’s medium (DMEM), fetal bovine serum (FBS), penicillin and streptomycin were purchased from Gibco Life Technologies (Grand Island, NY, USA). Chromatographic grade acetonitrile was purchased from Oceanpak (Goteborg, Sweden). The CCK-8 was acquired from Beijing Solarbio Science & Technology Co., Ltd. (Beijing, China). The Griess assay kit was obtained from Beyotime Biotechnology (Shanghai, China). Mouse ELISA kits to detect TNF-α, IL-6 and IL-10 were purchased from Neobioscience Technology Co., Ltd. (Shenzhen, China). All other reagents were of analytical grade.

3.2. Extraction and Purification of Polysaccharides

The seeds of A. villosum were pulverized into fine powder and then passed through a 40-mesh sieve. The powder (200 g) was pretreated three times with 95% ethanol at 80 °C for 3 h to remove lipids and pigments. The residue was air-dried and extracted three times with water (4 L) at 95 °C for 3 h. Subsequently, the supernatant was gathered, centrifuged at 5000 rpm for 10 min, concentrated using a vacuum rotary evaporator (Gongyi Yuhua Experimental Instrument Co., Ltd., Gongyi, China), and then mixed with four volumes of absolute ethanol overnight at 4 °C. The precipitate was collected by centrifugation at 5000 rpm for 10 min. After removing proteins by Sevag regent, the crude polysaccharides were obtained.
AVPs were applied to a DEAE Cellulose-52 column (2.6 × 30 cm) and then stepwise eluted using distilled water, followed by 0.05, 0.1, 0.5 and 1.0 M NaCl solutions at a flow rate of 1.0 mL/min. Three fractions that were eluted using distilled water, 0.05 M and 0.1 M NaCl solutions were obtained and named as AVPD-0, AVPD-1 and AVPD-2, respectively. AVPD-1 and AVPD-2 were further dialyzed using a dialysis bag (molecular weight cut-off: 3500 Da) against running water for 24 h, and then freeze-dried. Sephadex G-100 chromatography column (2.6 × 60 cm) was used to further purify the two fractions, resulting in the target polysaccharides designated as AVPG-1 and AVPG-2.

3.3. Preliminary Chemical Analysis

The content of carbohydrate in each sample was determined by phenol-sulfuric acid colorimetric method using glucose as the standard [73]. The content of protein was measured by the Bradford method using bovine serum albumin as the standard [74]. The content of uronic acid was analyzed by the m-hydroxybiphenyl colorimetric method using D-glucuronic acid as the standard [75]. The content of sulfate was tested by the barium chloride-gelatin method [76]. The content of endotoxin in the samples was determined by the end-point chromogenic tachypleus amebocyte lysate (TAL) assay kit [77]. The procedures were performed according to the manufacturer’s instructions. The samples were diluted to 800 μg/mL.

3.4. Determination of Homogeneity and Molecular Weight

The Mn, Mw and PDI for the two polysaccharide fractions in 0.9% NaCl aqueous solution were measured using HPSEC-MALLS-RID. HPSEC-MALLS-RID measurements were carried out on a multi-angle laser light scattering detector (DAWN HELEOS-II, Wyatt Technology Co., Santa Barbara, CA, USA) with a separation module (Waters e2695) equipped with a TSK-Gel G4000SWXL column (300 mm × 7.8 mm, i.d., Tosoh Bioscience, Tokyo, Japan) at 35 °C. A differential refractive index detector (RID, Optilab T-rEX, Wyatt Technology Co., Santa Barbara, CA, USA) was connected simultaneously. The mobile phase was 0.9% NaCl aqueous solution and was passed through the HPSEC column at a flow rate of 0.5 mL/min. Astra software (Version 7.1.3) was utilized for data acquisition and analysis. The molecular weight was calculated using the Zimm model.

3.5. Monosaccharide Composition Identification

The monosaccharide composition of the polysaccharides was evaluated using HPLC according to a previously reported method with some modifications [78]. Briefly, AVPG-1 and AVPG-2 were hydrolyzed with 2 mL of 3 M TFA at 120 °C for 6 h. After removal of the TFA, the hydrolysates were dissolved in 0.8 mL deionized water, and then 0.1 mL 0.5 M 1-phenyl-3-methyl-5-pyrazolone (PMP) and 0.1 mL 0.3 M NaOH were added. The mixtures were reacted at 70 °C for 30 min. After being neutralized by adding 0.3 M HCl, the resulting solutions were extracted with chloroform three times. Finally, the sample solutions were filtered through a 0.22 μm syringe filter and analyzed by HPLC (Shimadzu Corporation, Kyoto, Japan) using a Zorbax Eclipse XDB-C18 column (4.6 × 250 mm, 5 μm, Agilent Technologies, Santa Clara, CA, USA). The optimal mobile phase consisted of 0.05 M phosphate buffer (pH 6.7, solvent A) and acetonitrile (solvent B) at a flow rate of 1 mL/min. The gradient elution was as follows: started from 16.0% B and maintained for 40 min, followed by a liner decrease to 14% B in 1 min and maintained for 13 min, and finally returned to 16% B in 1 min and then isocratic for 15 min. The column temperature was kept at 35 °C and the injection volume was 20 μL, with a detection wavelength of 250 nm. Glucose (Glc), mannose (Man), galactose (Gal), rhamnose (Rha), xylose (Xyl), arabinose (Ara), fucose (Fuc), glucuronic acid (GlcA) and galacturonic acid (GalA) were used as monosaccharides standards.

3.6. UV Spectroscopy and FT-IR Spectroscopy Analysis

The samples were dissolved in deionized water at a concentration of 1.0 mg/mL, and the UV spectra of AVPG-1 and AVPG-2 were recorded in the wavelength range of 200–400 nm using a UV-vis spectrophotometer (UV-2600, Shimadzu Corporation, Kyoto, Japan).
The FT-IR spectra were obtained using a Fourier transform infrared spectrophotometer (UATR Two, PerkinElmer, The Netherlands) in the range of 4000–400 cm−1.

3.7. Determination of Triple-Helical Structure

The Congo red test was used to determine the conformation of AVPG-1 and AVPG-2 according to a previous report with some modifications [79]. Briefly, each sample solution (1.0 mL, 1.0 mg/mL) was thoroughly mixed with 1.0 mL of Congo red solution (80 μM). NaOH solution (1.0 M) was gradually added into the mixture until the final concentration of NaOH reached to 0, 0.1, 0.2, 0.3, 0.4, 0.5 or 0.6 M. After standing for 10 min at room temperature (RT), the λmax of the mixture was recorded by using Shimadzu UV-2600 spectrophotometer in the range of 400–600 nm.

3.8. Surface Microscopic Analysis

A field-emission scanning electron microscope (FESEM, Gemini500, Zeiss/Bruker, Oberkochen, Germany) was used to obtain the surface micrographs of AVPG-1 and AVPG-2. The dried samples were affixed on a specimen holder with the help of double-sided adhesive tape and coated with gold powder to make them conductive. The images were obtained at an accelerating voltage of 20.0 kV.

3.9. Methylation Analysis

The polysaccharides were methylated in accordance with previous method [80] to analyze the glycosidic linkage pattern. Briefly, each polysaccharide (8 mg) was dissolved in 5 mL of anhydrous dimethylsulfoxide (DMSO) and sonicated for 1 h. Next, 600 mg of powdered NaOH was added and sonicated for 1 h. Subsequently, methyl iodide (500 μL) was added in the dark and sonicated for 10 min. The process was repeated three times, and the final sonication continued for 1 h. Finally, distilled water (2 mL) was added to terminate this reaction and chloroform was used to extract the methylated polysaccharide. Complete methylation of polysaccharides was confirmed by the disappearance of –OH band (3000–3500 cm−1) in FT-IR spectrum (Figures S1 and S2).
The partially methylated polysaccharide was hydrolyzed with 3 M TFA at 120 °C for 6 h, reduced with NaBD4, and then acetylated with acetic anhydride to yield partially methylated alditol acetates (PMAA). Then, the PMAA were identified by gas chromatography-mass spectrometry (GC-MS) using an HP-5 MS fused silica capillary column. The initial column temperature was 80 °C (held for 1 min), after which the temperature was increased to 280 °C at 5 °C/min and held for 1 min. The compound that corresponded to each peak was identified by comparing to the MS data in the CCRC database (https://www.ccrc.uga.edu/specdb/ms/pmaa/pframe.html, accessed on 27 April 2021).

3.10. NMR Spectroscopy Analysis

AVPG-1 and AVPG-2 was dissolved in deuterium oxide (D2O) at 60 mg/mL, respectively. The samples were then subjected to a Bruker Avance-600 spectrometer (Bruker, Fällanden, Switzerland) to record NMR spectra at 30 °C including 1H NMR, 13C NMR, 1H–1H COSY, HSQC and HMBC. MestReNova Software was used to process the NMR data, and chemical shifts (δ) were expressed in ppm.

3.11. Immunomodulatory Activity

3.11.1. Cell Culture

The RAW 264.7 murine macrophage cell line was purchased from the Cell Bank of Shanghai Institute of Biochemistry and Cell Biology (Chinese Academy of Sciences, Shanghai, China). RAW 264.7 cells were cultured in DMEM high-glucose medium supplemented with 10% FBS, 100 U/mL penicillin and 100 μg/mL streptomycin at 37 °C in a humidified atmosphere of 5% CO2.

3.11.2. Assay of Cell Viability

The effect of AVPG-1 and AVPG-2 on cell viability was evaluated by the CCK-8 assay according to the manufacturer’s instructions. Briefly, RAW 264.7 cells (5.0 × 10³ cells/well) were cultured in 96-well plates for 24 h, and then treated with polysaccharides at final concentrations of 100, 200, 400 and 800 μg/mL for 24 h. An equal volume of culture medium was used as a blank control and LPS (1 μg/mL) was used as a positive control. After adding 10 μL of CCK-8 to each well, the plates were further incubated for 3 h at 37 °C. Subsequently, the optical density (OD) was read on a microplate reader (Epoch, BioTeck Instruments Inc., Winooski, VT, USA) at 450 nm. Cell viability was expressed as the ratio of absorbance values between treatments and the blank control group. The experiment was performed in triplicate.

3.11.3. Assay of NO

RAW 264.7 cells (5.0 × 10⁴ cells/well) were seeded in 96-well plates for 24 h, and then stimulated by polysaccharides (100, 200, 400 and 800 μg/mL) or 1.0 μg/mL LPS (positive control). Culture medium was used as a blank control. NO secreted by macrophage RAW 264.7 cells was determined by Griess reaction according to the manufacturer’s instructions. The results were calculated as ratio of absorbance values between treatments and the blank control group.

3.11.4. Determination of Cytokines

The concentrations of TNF-α, IL-6 and IL-10 released from RAW 264.7 cells were determined using ELISA kits according to the manufacturer’s instructions. The experiment was performed in triplicate.

3.11.5. Real Time (RT)-PCR

RAW 264.7 cells were cultured in 6-well plates at a density of 1.1 × 10⁶ cells/well for 24 h, and then treated with LPS (1.0 μg/mL), IL-4 (20 ng/mL), polysaccharides (400 μg/mL); polysaccharides (400 μg/mL) and LPS (1.0 μg/mL); polysaccharides (400 μg/mL) and IL-4 (20 ng/mL); or culture medium (blank control) for 24 h, respectively. Total RNA was extracted using the Trizol reagent (Invitrogen, Carlsbad, CA, USA). The concentration of RNA in samples was measured by a Nanodrop 2000 ultramicro spectrophotometer (Thermo Fisher Scientific, Waltham, MA, USA). Then, the mRNA samples were reversely transcribed into complementary DNA using the HiScript II Q RT SuperMix for qPCR (Vazyme, Nanjing, China). Quantitative RT-PCR assays were conducted using the HieffTM qPCR SYBR® Green Master Mix (Yeasen, Shanghai, China) and detected by the LightCycler 96 RT-PCR System (Roche, Basel, Switzerland). Glyceraldehyde 3-phosphate dehydrogenase (GAPDH) was used as an internal control. All experiments were performed in triplicate. The following primers were used: CD206 forward 5′-GTCAGAACAGACTGCGTGGA-3′, CD206 reverse 5′-AGGGATCGCCTGTTTTCCAG-3′; CD86 forward 5′-ATGGACCCCAGATGCACCA-3′, CD86 reverse CCTTTGTAAATGGGCACGGC; and GAPDH forward 5′-GGTGAAGGTCGGTGTGAACG-3′, GAPDH reverse 5′-CTCGCTCCTGGAAGATGGTG-3′.

3.11.6. Assay of Macrophages Phagocytosis

Phagocytosis of target particles by RAW 264.7 cells was analyzed qualitatively using microscopy and quantitatively using flow cytometry.
RAW 264.7 cells were plated in glass bottom cell culture dishes at a density of 1 × 10⁵ cells/well and exposed to complete medium alone (blank control) or different concentrations of polysaccharides or LPS (positive control) for 24 h. After treatment, FITC-labeled E. coli (K-12 strain) BioParticles (Molecular Probes: E2861) were incubated with macrophages for 30 min. The final number ratio of cells to bacteria was 1:3000. The fluorescent signal of extracellular E. coli was removed by cold PBS, and the cells were then fixed in 4% paraformaldehyde for 20 min. Nuclei were stained by DAPI for 15 min after removing the paraformaldehyde. The excess dye solution was removed by cold PBS. Finally, macrophages phagocytosis of FITC-labeled E. coli was measured using laser scanning confocal microscopy (LSCM, FV 3000, Olympus, Tokyo, Japan).
RAW 264.7 cells were seeded in a 12-well plate at a density of 1 × 10⁵ cells/well. The cells were treated with polysaccharides, LPS or culture medium and FITC-labeled E. coli as described above. After the extracellular signals were washed out, cells were gently de-adhered by pipetting up and down, and then transferred into micro-centrifuge tubes for flow cytometry. All data were acquired on a Beckman-Coulter CytoFLEX S instrument and analyzed with FlowJo V10 software.

3.12. Statistical Analysis

The results were expressed as mean ± standard deviation (SD) of three replicates. One-way ANOVA with Dunnett post hoc test was used for the statistical analysis. Significant difference was considered when * p < 0.05, ** p < 0.005, *** p < 0.001, **** p < 0.0001, and all the analyses were performed using GraphPad Prism® version 7.0 (GraphPad Software, San Diego, CA, USA).

4. Conclusions

In summary, two polysaccharides of Amomum villosum Lour. were successfully isolated and purified, and their structural characterization and immunomodulatory activities were explored. The average molecular weight of AVPG-1 and AVPG-2 were 5.14 × 10⁵ Da and 1.48 × 10⁷ Da, respectively. Methylation and NMR analysis revealed that the backbone was → 4)-α-dD-Glcp-(1 → 3,4)-β-d-Glcp-(1 → 4)-α-d-Glcp-(1 → and → 4)-α-d-Glcp-(1 → 3,6)-β-d-Galp-(1 → 4)-α-d-Glcp-(1 →, respectively. Biological activity study revealed that AVPG-2 could turn the polarization of macrophages to the M1 direction and increased cell viability, promoted the secretion of NO and cytokines and boosted the phagocytic capacity of macrophages. Therefore, AVPG-2 exhibited good immunomodulatory activity. AVPG-2 has the potential to act as a natural immunomodulatory ingredient or a functional food.

Supplementary Materials

The following are available online, Figure S1: FT-IR spectrum of the partially methylated AVPG-1, Figure S2: FT-IR spectrum of the partially methylated AVPG-2, Table S1: The cross signals obtained from HMBC spectra of AVPG-1 and AVPG-2.

Author Contributions

Conceptualization, Y.Z. and Z.Z.; methodology, E.-H.L. and C.T.; software, E.-H.L.; validation, L.Z.; formal analysis, Y.Z. and C.Q.; investigation, Y.Z. and C.Q.; resources, J.Z. and Z.Z.; writing—original draft preparation, Y.Z.; writing—review and editing, Z.Z.; project administration, X.X. and Z.Z.; funding acquisition, D.Y. and Z.Z. All authors have read and agreed to the published version of the manuscript.

Funding

This research was funded by the National Key Research and Development Program of China (No. 2017YFC1701100) and the Guangdong Agricultural Science and Technology Innovation and Promotion Project of China (No. 2020KJ142 & 2019KJ142).

Institutional Review Board Statement

Not applicable.

Informed Consent Statement

Not applicable.

Data Availability Statement

The data presented in this study are available in article and supplementary material.

Conflicts of Interest

The authors declare no conflict of interest.

Sample Availability

Not available.

References

  1. Suo, S.; Lai, Y.; Li, M.; Song, Q.; Cai, J.; Zhao, J.; Yang, Q.; Ung, C.O.L.; Hu, H. Phytochemicals, pharmacology, clinical application, patents, and products of Amomi fructus. Food Chem. Toxicol. 2018, 119, 31–36. [Google Scholar] [CrossRef]
  2. Tang, C.; Chen, J.; Zhou, Y.; Ding, P.; He, G.; Zhang, L.; Zhao, Z.; Yang, D. Exploring antimicrobial mechanism of essential oil of Amomum villosum Lour through metabolomics based on gas chromatography-mass spectrometry in methicillin-resistant Staphylococcus aureus. Microbiol. Res. 2021, 242, 126608. [Google Scholar] [CrossRef] [PubMed]
  3. Ao, H.; Wang, J.; Chen, L.; Li, S.; Dai, C. Comparison of volatile oil between the fruits of Amomum villosum Lour. and Amomum villosum Lour. var. xanthioides T. L. Wu et Senjen based on GC-MS and chemometric techniques. Molecules 2019, 24, 1663. [Google Scholar] [CrossRef] [Green Version]
  4. Yin, H.; Dan, W.; Fan, B.; Guo, C.; Wu, K.; Li, D.; Xian, K.; Pescitelli, G.; Gao, J. Anti-inflammatory and α-glucosidase inhibitory activities of labdane and norlabdane diterpenoids from the rhizomes of Amomum Villosum. J. Nat. Prod. 2019, 82, 2963–2971. [Google Scholar] [CrossRef]
  5. Xue, X.; Zhao, Z.; Li, Q.; Wang, D.; Xu, X.; Zhu, L.; Yang, D. Determination of flavonoids by solidification of floating organic drop liquid-phase microextraction and high-performance liquid chromatography. Anal. Lett. 2016, 2719, 2384–2396. [Google Scholar] [CrossRef]
  6. Huang, Y.; Yen, G.; Sheu, F.; Lin, J.; Chau, C. Dose effects of the food spice cardamom on aspects of hamster gut physiology. Mol. Nutr. Food Res. 2007, 51, 602–608. [Google Scholar] [CrossRef] [PubMed]
  7. Lim, D.; Choi, H.; Park, S.; Kim, H.; Yu, G.; Kim, J.; Park, W. Activation of the Nrf2/HO-1 pathway by Amomum villosum extract suppresses LPS-induced oxidative stress in vitro and ex vivo. Evid. Based. Complement. Alternat. Med. 2020, 2020, 2837853. [Google Scholar] [CrossRef]
  8. Zhang, T.; Lu, S.H.; Bi, Q.; Liang, L.; Wang, Y.F.; Yang, X.X.; Gu, W.; Yu, J. Volatile Oil from Amomi Fructus attenuates 5-fluorouracil-induced intestinal mucositis. Front. Pharmacol. 2017, 8, 786. [Google Scholar] [CrossRef] [PubMed]
  9. Chen, Z.; Ni, W.; Yang, C.; Zhang, T.; Lu, S.; Zhao, R.; Mao, X.; Yu, J. Therapeutic effect of Amomum villosum on inflammatory bowel disease in rats. Front. Pharmacol. 2018, 9, 639. [Google Scholar] [CrossRef] [Green Version]
  10. Yao, Y.; Mi, W.; Cao, G.; Yang, R.; Chen, H.; Liu, Y.; Zou, H.; Yan, Y. The absorption characteristics of nonvolatile components in a water extraction from Amomi fructus as determined by in situ single-pass intestinal perfusion and high-performance liquid chromatography. Front. Pharmacol. 2020, 11, 711. [Google Scholar] [CrossRef]
  11. Wang, J.; Hu, S.; Nie, S.; Yu, Q.; Xie, M. Reviews on mechanisms of in vitro antioxidant activity of polysaccharides. Oxid. Med. Cell. Longev. 2016, 2016, 5692852. [Google Scholar] [CrossRef] [PubMed] [Green Version]
  12. Ramberg, J.E.; Nelson, E.D.; Sinnott, R.A. Immunomodulatory dietary polysaccharides: A systematic review of the literature. Nutr. J. 2010, 9, 54. [Google Scholar] [CrossRef] [Green Version]
  13. Yang, X.; Ji, H.; Feng, Y.; Yu, J.; Liu, A. Structural characterization and antitumor activity of polysaccharides from Kaempferia galanga L. Oxid. Med. Cell. Longev. 2018, 2018, 9579262. [Google Scholar] [CrossRef] [PubMed] [Green Version]
  14. Cui, J.-F.; Ye, H.; Zhu, Y.-J.; Li, Y.-P.; Wang, J.-F.; Wang, P. Characterization and hypoglycemic activity of a rhamnan-type sulfated polysaccharide derivative. Mar. Drugs 2019, 17, 21. [Google Scholar] [CrossRef] [Green Version]
  15. Zhang, D.; Li, S.; Xiong, Q.; Jiang, C.; Lai, X. Extraction, characterization and biological activities of polysaccharides from Amomum villosum. Carbohydr. Polym. 2013, 95, 114–122. [Google Scholar] [CrossRef]
  16. Zhang, J.; Xiong, Q.; Li, S.; Li, X.; Chen, J.; Cao, M.; Lu, L.; Wan, M.; Zhang, D. A comparison study on polysaccharides from novel hybrids of Amomum villosum and its female parent. Int. J. Biol. Macromol. 2015, 81, 396–399. [Google Scholar] [CrossRef] [PubMed]
  17. Yan, Y.; Li, X.; Wan, M.; Chen, J.; Li, S.; Cao, M.; Zhang, D. Effect of extraction methods on property and bioactivity of water-soluble polysaccharides from Amomum villosum. Carbohydr. Polym. 2015, 117, 632–635. [Google Scholar] [CrossRef] [PubMed]
  18. Chen, L.-X.; Lai, Y.-F.; Zhang, W.-X.; Cai, J.; Hu, H.; Wang, Y.; Zhao, J.; Li, S.-P. Comparison of volatile compounds in different parts of fresh Amomum villosum Lour. from different geographical areas using cryogenic grinding combined HS-SPME-GC-MS. Chin. Med. 2020, 15, 97. [Google Scholar] [CrossRef]
  19. Lai, Y.-F.; Chen, L.-X.; Chen, Y.-N.; Zhao, J.; Leong, F.; Li, X.-W.; Yang, Q.; Li, P.; Hu, H. Sustainable development of Amomum villosum: A systematic inveatigation on three different production modes. Afr. J. Tradit. Complement. Altern. Med. 2016, 13, 97–104. [Google Scholar] [CrossRef]
  20. Zhao, C.; Li, X.; Miao, J.; Jing, S.; Li, X.; Huang, L.; Gao, W. The effect of different extraction techniques on property and bioactivity of polysaccharides from Dioscorea hemsleyi. Int. J. Biol. Macromol. 2017, 102, 847–856. [Google Scholar] [CrossRef]
  21. Wang, M.; Jiang, C.; Ma, L.; Zhang, Z.; Cao, L.; Liu, J.; Zeng, X. Preparation, preliminary characterization and immunostimulatory activity of polysaccharide fractions from the peduncles of Hovenia dulcis. Food Chem. 2013, 138, 41–47. [Google Scholar] [CrossRef]
  22. Jin, W.; Zhang, W.; Liu, G.; Yao, J.; Shan, T.; Sun, C.; Zhang, Q. The structure-activity relationship between polysaccharides from Sargassum thunbergii and anti-tumor activity. Int. J. Biol. Macromol. 2017, 105, 686–692. [Google Scholar] [CrossRef]
  23. Gertsch, J.; Viveros-Paredes, J.M.; Taylor, P. Plant immunostimulants-scientific paradigm or myth? J. Ethnopharmacol. 2011, 136, 385–391. [Google Scholar] [CrossRef]
  24. Ye, S.; Zhang, J.; Liu, Z.; Zhang, Y.; Li, J.; Li, Y.O. Biosynthesis of selenium rich exopolysaccharide (Se-EPS) by Pseudomonas PT-8 and characterization of its antioxidant activities. Carbohydr. Polym. 2016, 142, 230–239. [Google Scholar] [CrossRef] [PubMed]
  25. Sachithanandan, N.; Graham, K.L.; Galic, S.; Honeyman, J.E.; Fynch, S.L.; Hewitt, K.A.; Steinberg, G.R.; Kay, T.W. Macrophage deletion of SOCS1 increases sensitivity to LPS and palmitic acid and results in systemic inflammation and hepatic insulin resistance. Diabetes 2011, 60, 2023–2031. [Google Scholar] [CrossRef] [PubMed] [Green Version]
  26. Li, C.; Huang, Q.; Fu, X.; Yue, X.-J.; Liu, R.H.; You, L.-J. Characterization, antioxidant and immunomodulatory activities of polysaccharides from Prunella vulgaris Linn. Int. J. Biol. Macromol. 2015, 75, 298–305. [Google Scholar] [CrossRef]
  27. Li, Q.; Wang, W.; Zhu, Y.; Chen, Y.; Zhang, W.; Yu, P.; Mao, G.; Zhao, T.; Feng, W.; Yang, L.; et al. Structural elucidation and antioxidant activity a novel Se-polysaccharide from Se-enriched Grifola frondosa. Carbohydr. Polym. 2017, 161, 42–52. [Google Scholar] [CrossRef] [PubMed]
  28. Chaouch, M.A.; Hafsa, J.; Rihouey, C.; Le Cerf, D.; Majdoub, H. Depolymerization of polysaccharides from Opuntia ficus indica: Antioxidant and antiglycated activities. Int. J. Biol. Macromol. 2015, 79, 779–786. [Google Scholar] [CrossRef] [PubMed]
  29. Chen, G.; Fang, C.; Ran, C.; Tan, Y.; Yu, Q.; Kan, J. Comparison of different extraction methods for polysaccharides from bamboo shoots (Chimonobambusa quadrangularis) processing by-products. Int. J. Biol. Macromol. 2019, 130, 903–914. [Google Scholar] [CrossRef]
  30. Jing, L.; Sheng, J.; Jiang, J.; Wang, Y.; Shen, X.; Liu, D.; Zhang, W.; Mao, S. Chemical characteristics and cytoprotective activities of polysaccharide fractions from Athyrium Multidentatum (Doll.) Ching. Int. J. Biol. Macromol. 2020, 158, 1227–1238. [Google Scholar] [CrossRef] [PubMed]
  31. Zhang, H.; Zou, P.; Zhao, H.; Qiu, J.; Regenstein, J.M.; Yang, X. Isolation, purification, structure and antioxidant activity of polysaccharide from pinecones of Pinus koraiensis. Carbohydr. Polym. 2021, 251, 117078. [Google Scholar] [CrossRef] [PubMed]
  32. Li, F.; Wei, Y.; Liang, L.; Huang, L.; Yu, G.; Li, Q. A novel low-molecular-mass pumpkin polysaccharide: Structural characterization, antioxidant activity, and hypoglycemic potential. Carbohydr. Polym. 2021, 251, 117090. [Google Scholar] [CrossRef]
  33. Hu, Z.; Zhou, H.; Zhao, J.; Sun, J.; Li, M.; Sun, X. Microwave-assisted extraction, characterization and immunomodulatory activity on RAW264.7 cells of polysaccharides from Trichosanthes kirilowii Maxim seeds. Int. J. Biol. Macromol. 2020, 164, 2861–2872. [Google Scholar] [CrossRef]
  34. Guo, R.; Tian, S.; Li, X.; Wu, X.; Liu, X.; Li, D.; Liu, Y.; Ai, L.; Song, Z.; Wu, Y. Pectic polysaccharides from purple passion fruit peel: A comprehensive study in macromolecular and conformational characterizations. Carbohydr. Polym. 2020, 229, 115406. [Google Scholar] [CrossRef]
  35. He, B.-L.; Zheng, Q.-W.; Guo, L.-Q.; Huang, J.-Y.; Yun, F.; Huang, S.-S.; Lin, J.-F. Structural characterization and immune-enhancing activity of a novel high-molecular-weight polysaccharide from Cordyceps militaris. Int. J. Biol. Macromol. 2020, 145, 11–20. [Google Scholar] [CrossRef] [PubMed]
  36. Zhang, H.; Zhao, J.; Shang, H.; Guo, Y.; Chen, S. Extraction, purification, hypoglycemic and antioxidant activities of red clover (Trifolium pratense L.) polysaccharides. Int. J. Biol. Macromol. 2020, 148, 750–760. [Google Scholar] [CrossRef] [PubMed]
  37. Zheng, Y.; Zhang, S.; Wang, Q.; Lu, X.; Lin, L.; Tian, Y.; Xiao, J.; Zheng, B. Characterization and hypoglycemic activity of a β-pyran polysaccharides from bamboo shoot (Leleba oldhami Nakal) shells. Carbohydr. Polym. 2016, 144, 438–446. [Google Scholar] [CrossRef]
  38. Pu, X.; Ma, X.; Liu, L.; Ren, J.; Li, H.; Li, X.; Yu, S.; Zhang, W.; Fan, W. Structural characterization and antioxidant activity in vitro of polysaccharides from angelica and astragalus. Carbohydr. Polym. 2016, 137, 154–164. [Google Scholar] [CrossRef]
  39. Cheng, J.; Song, J.; Wei, H.; Wang, Y.; Huang, X.; Liu, Y.; Lu, N.; He, L.; Lv, G.; Ding, H.; et al. Structural characterization and hypoglycemic activity of an intracellular polysaccharide from Sanghuangporus sanghuang mycelia. Int. J. Biol. Macromol. 2020, 164, 3305–3314. [Google Scholar] [CrossRef]
  40. Patra, S.; Maity, P.; Chakraborty, I.; Sen, I.K.; Ghosh, D.; Rout, D.; Bhanja, S.K. Structural studies of immunomodulatory (1→3)-, (1→4)-α glucan from an edible mushroom Polyporus grammocephalus. Int. J. Biol. Macromol. 2020, 168, 649–655. [Google Scholar] [CrossRef]
  41. Guo, R.; Li, X.; Chen, X.; Kou, Y.; Hu, H.; Liu, X.; Li, D.; Liu, Y.; Ai, L.; Song, Z.; et al. An ultrasonic-extracted arabinoglucan from Tamarindus indica L. pulp: A study on molecular and structural characterizations. Int. J. Biol. Macromol. 2020, 164, 3687–3697. [Google Scholar] [CrossRef] [PubMed]
  42. Molaei, H.; Jahanbin, K. Structural features of a new water-soluble polysaccharide from the gum exudates of Amygdalus scoparia Spach (Zedo gum). Carbohydr. Polym. 2018, 182, 98–105. [Google Scholar] [CrossRef]
  43. Guo, W.; Rao, G.; Wen, X. Arabinogalactan in banana: Chemical characterization and pharmaceutical effects. Int. J. Biol. Macromol. 2021, 167, 1059–1065. [Google Scholar] [CrossRef] [PubMed]
  44. Sznaider, F.; Rojas, A.M.; Stortz, C.A.; Navarro, D.A. Chemical structure and rheological studies of arabinoglucuronoxylans from the Cercidium praecox exudate brea gum. Carbohydr. Polym. 2020, 228, 115388. [Google Scholar] [CrossRef] [PubMed]
  45. Zhang, X.; Cai, Z.; Mao, H.; Hu, P.; Li, X. Isolation and structure elucidation of polysaccharides from fruiting bodies of mushroom Coriolus versicolor and evaluation of their immunomodulatory effects. Int. J. Biol. Macromol. 2021, 166, 1387–1395. [Google Scholar] [CrossRef] [PubMed]
  46. Makarova, E.N.; Shakhmatov, E.G. Structural characteristics of oxalate-soluble polysaccharides from Norway spruce (Picea abies) foliage. Carbohydr. Polym. 2020, 246, 116544. [Google Scholar] [CrossRef] [PubMed]
  47. Schneider, V.S.; Iacomini, M.; Cordeiro, L.M.C. β-L-Araf-containing arabinan and glucuronoxylan from guavira fruit pomace. Carbohydr. Res. 2019, 481, 16–22. [Google Scholar] [CrossRef]
  48. Lan, H.; Cheng, Y.; Mu, J.; Huang, Y.; Chen, H.; Zhao, L.; Wang, K.; Hu, Z. Glucose-rich polysaccharide from dried “Shixia” longan activates macrophages through Ca(2+) and CR3- mediated MAPKs and PI3K-AKT pathways. Int. J. Biol. Macromol. 2021, 167, 845–853. [Google Scholar] [CrossRef]
  49. Huo, J.; Wu, J.; Huang, M.; Zhao, M.; Sun, W.; Sun, X.; Zheng, F. Structural characterization and immuno-stimulating activities of a novel polysaccharide from Huangshui, a byproduct of Chinese Baijiu. Food Res. Int. 2020, 136, 109493. [Google Scholar] [CrossRef]
  50. Vogel, D.Y.S.; Glim, J.E.; Stavenuiter, A.W.D.; Breur, M.; Heijnen, P.; Amor, S.; Dijkstra, C.D.; Beelen, R.H.J. Human macrophage polarization in vitro: Maturation and activation methods compared. Immunobiology 2014, 219, 695–703. [Google Scholar] [CrossRef]
  51. Cui, Y.-S.; Li, Y.-X.; Jiang, S.-L.; Song, A.-N.; Fu, Z.; Dong, C.-X.; Yao, Z.; Qiao, W. Isolation, purification, and structural characterization of polysaccharides from Atractylodis Macrocephalae Rhizoma and their immunostimulatory activity in RAW264.7 cells. Int. J. Biol. Macromol. 2020, 163, 270–278. [Google Scholar] [CrossRef]
  52. Qi, J.; Kim, S.M. Effects of the molecular weight and protein and sulfate content of Chlorella ellipsoidea polysaccharides on their immunomodulatory activity. Int. J. Biol. Macromol. 2018, 107, 70–77. [Google Scholar] [CrossRef] [PubMed]
  53. Hunter, C.A.; Jones, S.A. IL-6 as a keystone cytokine in health and disease. Nat. Immunol. 2015, 16, 448–457. [Google Scholar] [CrossRef] [PubMed]
  54. Yu, Y.; Zhang, Y.; Hu, C.; Zou, X.; Lin, Y.; Xia, Y.; You, L. Chemistry and immunostimulatory activity of a polysaccharide from Undaria pinnatifida. Food Chem. Toxicol. 2019, 128, 119–128. [Google Scholar] [CrossRef]
  55. Shapouri-Moghaddam, A.; Mohammadian, S.; Vazini, H.; Taghadosi, M.; Esmaeili, S.-A.; Mardani, F.; Seifi, B.; Mohammadi, A.; Afshari, J.T.; Sahebkar, A. Macrophage plasticity, polarization, and function in health and disease. J. Cell. Physiol. 2018, 233, 6425–6440. [Google Scholar] [CrossRef] [PubMed]
  56. Feng, L.; Xiao, X.; Liu, J.; Wang, J.; Zhang, N.; Bing, T.; Liu, X.; Zhang, Z.; Shangguan, D. Immunomodulatory effects of Lycium barbarum polysaccharide extract and its uptake behaviors at the cellular level. Molecules 2020, 25, 1351. [Google Scholar] [CrossRef] [PubMed] [Green Version]
  57. Daskalaki, M.G.; Bafiti, P.; Kikionis, S.; Laskou, M.; Roussis, V.; Ioannou, E.; Kampranis, S.C.; Tsatsanis, C. Disulfides from the brown alga dictyopteris membranacea suppress M1 macrophage activation by inducing AKT and suppressing MAPK/ERK signaling pathways. Mar. Drugs 2020, 18, 527. [Google Scholar] [CrossRef] [PubMed]
  58. Zajd, C.M.; Ziemba, A.M.; Miralles, G.M.; Nguyen, T.; Feustel, P.J.; Dunn, S.M.; Gilbert, R.J.; Lennartz, M.R. Bone marrow-derived and elicited peritoneal macrophages are not created equal: The questions asked dictate the cell type used. Front. Immunol. 2020, 11, 269. [Google Scholar] [CrossRef] [Green Version]
  59. Hartenstein, V.; Martinez, P. Phagocytosis in cellular defense and nutrition: A food-centered approach to the evolution of macrophages. Cell Tissue Res. 2019, 377, 527–547. [Google Scholar] [CrossRef]
  60. Martinez, J.; Cunha, L.D.; Park, S.; Yang, M.; Lu, Q.; Orchard, R.; Li, Q.-Z.; Yan, M.; Janke, L.; Guy, C.; et al. Noncanonical autophagy inhibits the autoinflammatory, lupus-like response to dying cells. Nature 2016, 533, 115–119. [Google Scholar] [CrossRef]
  61. Wei, Z.; Chen, G.; Zhang, P.; Zhu, L.; Zhang, L.; Chen, K. Rhizopus nigricans polysaccharide activated macrophages and suppressed tumor growth in CT26 tumor-bearing mice. Carbohydr. Polym. 2018, 198, 302–312. [Google Scholar] [CrossRef] [PubMed]
  62. Bonam, S.R.; Bhunia, D.; Muller, S.; Nerella, S.G.; Alvala, M.; Halmuthur Mahabalarao, S.K. Novel trisaccharide based phospholipids as immunomodulators. Int. Immunopharmacol. 2019, 74, 105684. [Google Scholar] [CrossRef]
  63. Sandeep, A.; Reddy, B.S.; Hyder, I.; Halmuthur, M.S.K. Synthesis of a new class of glycolipids and the evaluation of their immunogenicity using murine splenocytes. J. Carbohydr. Chem. 2016, 35, 326–343. [Google Scholar] [CrossRef]
  64. Suárez, E.R.; Syvitski, R.; Kralovec, J.A.; Noseda, M.D.; Barrow, C.J.; Ewart, H.S.; Lumsden, M.D.; Grindley, T.B. Immunostimulatory polysaccharides from Chlorella pyrenoidosa. A new galactofuranan. measurement of molecular weight and molecular weight dispersion by DOSY NMR. Biomacromolecules 2006, 7, 2368–2376. [Google Scholar] [CrossRef]
  65. Chen, Q.; Chen, Y.; Zhou, S.; Yip, K.; Xu, J.; Chen, H. Laser microdissection hyphenated with high performance gel permeation chromatography-charged aerosol detector and ultra performance liquid chromatography-triple quadrupole mass spectrometry for histochemi. Int. J. Biol. Macromol. 2018, 107, 332–342. [Google Scholar] [CrossRef]
  66. Fisher, D.T.; Appenheimer, M.M.; Evans, S.S. The two faces of IL-6 in the tumor microenvironment. Semin. Immunol. 2014, 26, 38–47. [Google Scholar] [CrossRef] [Green Version]
  67. Jiang, Y.; Chen, J.; Bi, E.; Zhao, Y.; Qin, T.; Wang, Y.; Wang, A.; Gao, S.; Yi, Q.; Wang, S. TNF-α enhances Th9 cell differentiation and antitumor immunity via TNFR2-dependent pathways. J. Immunother. cancer 2019, 7, 28. [Google Scholar] [CrossRef] [PubMed] [Green Version]
  68. Wu, J.; Frady, L.N.; Bash, R.E.; Cohen, S.M.; Schorzman, A.N.; Su, Y.-T.; Irvin, D.M.; Zamboni, W.C.; Wang, X.; Frye, S.V.; et al. MerTK as a therapeutic target in glioblastoma. Neuro. Oncol. 2018, 20, 92–102. [Google Scholar] [CrossRef] [PubMed] [Green Version]
  69. Hu, H.; Hang, J.-J.; Han, T.; Zhuo, M.; Jiao, F.; Wang, L.-W. The M2 phenotype of tumor-associated macrophages in the stroma confers a poor prognosis in pancreatic cancer. Tumour Biol. 2016, 37, 8657–8664. [Google Scholar] [CrossRef] [PubMed]
  70. Cheng, H.; Wang, Z.; Fu, L.; Xu, T. Macrophage polarization in the development and progression of ovarian cancers: An overview. Front. Oncol. 2019, 9, 421. [Google Scholar] [CrossRef] [Green Version]
  71. Wang, K.; Cheng, F.; Pan, X.; Zhou, T.; Liu, X.; Zheng, Z.; Luo, L.; Zhang, Y. Investigation of the transport and absorption of Angelica sinensis polysaccharide through gastrointestinal tract both in vitro and in vivo. Drug Deliv. 2017, 24, 1360–1371. [Google Scholar] [CrossRef] [Green Version]
  72. Espinal-Ruiz, M.; Parada-Alfonso, F.; Restrepo-Sánchez, L.P.; Narváez-Cuenca, C.E. Inhibition of digestive enzyme activities by pectic polysaccharides in model solutions. Bioact. Carbohydrates Diet. Fibre 2014, 4, 27–38. [Google Scholar] [CrossRef]
  73. Dubois, M.; Gilles, K.A.; Hamilton, J.K.; Rebers, P.A.; Smith, F. Colorimetric method for determination of sugars and related substances. Anal. Chem. 1956, 28, 350–356. [Google Scholar] [CrossRef]
  74. Bradford, M.M. A rapid and sensitive method for the quantitation of microgram quantities of protein utilizing the principle of protein-dye binding. Anal. Biochem. 1976, 72, 248–254. [Google Scholar] [CrossRef]
  75. Blumenkrantz, N.; Asboe-Hansen, G. New method for quantitative determination of uronic acids. Anal. Biochem. 1973, 54, 484–489. [Google Scholar] [CrossRef]
  76. Dodgson, K.S.; Price, R.G. A note on the determination of the ester sulphate content of sulphated polysaccharides. Biochem. J. 1962, 84, 106–110. [Google Scholar] [CrossRef] [Green Version]
  77. Zhang, Y.; Chen, Z.; Huang, Z.; Wu, Z.; Xu, J.; Wang, K. A comparative study on the structures of Grifola frondosa polysaccharides obtained by different decolourization methods and their in vitro antioxidant activities. Food Funct. 2019, 10, 6720–6731. [Google Scholar] [CrossRef]
  78. Huang, D.; Zhang, M.; Yi, P.; Yan, C. Structural characterization and osteoprotective effects of a novel oligo-glucomannan obtained from the rhizome of Cibotium barometz by alkali extraction. Ind. Crops Prod. 2018, 113, 202–209. [Google Scholar] [CrossRef]
  79. Zeng, F.; Chen, W.; He, P.; Zhan, Q.; Wang, Q.; Wu, H.; Zhang, M. Structural characterization of polysaccharides with potential antioxidant and immunomodulatory activities from Chinese water chestnut peels. Carbohydr. Polym. 2020, 246, 116551. [Google Scholar] [CrossRef]
  80. Chen, X.; Li, T.; Qing, D.; Chen, J.; Zhang, Q.; Yan, C. Structural characterization and osteogenic bioactivities of a novel Humulus lupulus polysaccharide. Food Funct. 2020, 11, 1165–1175. [Google Scholar] [CrossRef] [PubMed]
Figure 1. Elution curve of A. villosum polysaccharides (AVPs) on DEAE-52 column (A). Elution curve of AVPG-1 (B) and AVPG-2 (C) on Sephadex G-100 gel chromatography column. Ultraviolet (UV) spectra (D) of AVPG-1 and AVPG-2.
Molecules 26 02672 g001
Figure 2. The compositions of AVPG-1, AVPG-2 and nine monosaccharide standards detected by high performance liquid chromatography (HPLC). Peak identity: (1) mannose, (2) rhamnose, (3) glucuronic acid, (4) galacturonic acid, (5) glucose, (6) galactose, (7) xylose, (8) arabinose and (9) fucose.
Molecules 26 02672 g002
Figure 3. High performance size exclusion chromatography coupled with multi-angle laser light scattering and refractive index detector (HPSEC-MALLS-RID) chromatographic profile of the molar mass distribution of AVPG-1 (A) and AVPG-2 (B). Fourier transform infrared (FT-IR) spectroscopy of AVPG-1 and AVPG-2 (C). Maximum absorption wavelength of Congo red, Congo red + AVPG-1 or AVPG-2 at different concentrations of sodium hydroxide solution (D).
Molecules 26 02672 g003
Figure 4. Scanning electron microscope (SEM) images of AVPG−1 and AVPG−2 (at ×100, ×500, ×1000 and ×2500 magnification).
Molecules 26 02672 g004
Figure 5. The nuclear magnetic resonance (NMR) spectra of AVPG-1 in deuterium oxide (D2O): (A) 1H spectrum; (B) 13C NMR spectrum; (C) Heteronuclear single-quantum coherence (HSQC) spectrum; (D) 1H-1H correlated spectroscopy (1H-1H COSY) spectrum; and (E) Heteronuclear multiple-bond correlation (HMBC) spectrum.
Molecules 26 02672 g005
Figure 6. The NMR spectra of AVPG-2 in D2O: (A) 1H spectrum; (B) 13C NMR spectrum; (C) HSQC spectrum; (D) 1H-1H COSY spectrum; and (E) HMBC spectrum.
Molecules 26 02672 g006
Figure 7. Effects of AVPG-1 and AVPG-2 on cell proliferation (A,B) and nitric oxide (NO) release (C,D) of RAW 264.7. Effects of AVPG-2 on interleukin (IL)-6 (E), tumor necrosis factor alpha (TNF-α) (F) and IL-10 (G) production of RAW 264.7. Effects of AVPG-2 on mRNA expression of CD86 and CD206 (H), as determined by real time PCR (RT-PCR). Ns represents no significant difference versus control group, * p < 0.05 versus control group, ** p < 0.01 versus control group, *** p < 0.001 versus control group, **** p < 0.0001 versus control group.
Molecules 26 02672 g007
Figure 8. Effects of AVPG-2 on the phagocytic capacity of RAW 264.7 cells. (A) Images were captured by laser scanning confocal microscope (×60 magnification). Scale bars, 30 μm. The nuclei were visualized by DAPI (blue), and fluorescein isothiocyanate (FITC)-labeled E. coli appeared green fluorescence. (B) Fluorescence intensity detected by flow cytometry. (C) Efficiency ratio defined as percent of positive fluorescence cells in total cells. Ns represents no significant difference versus control group, *** p < 0.001 versus control group, **** p < 0.0001 versus control group.
Molecules 26 02672 g008
Table 1. Results of the methylation analysis of AVPG-1 and AVPG-2.
Methylated SugarsLinkageAVPG-1
(Molar Ratios)
AVPG-2
(Molar Ratios)
2,3,6-Me3-Glcp→4)-Glcp-(1→0.650.36
2,6-Me2-Glcp→3,4)-Glcp-(1→0.16ND
2,3,6-Me3-Galp→4)-Galp-(1→0.090.04
2,3,4-Me3-XylpXylp-(1→0.04ND
2,3,5-Me3-ArafAraf-(1→0.060.09
1,2,3,4-Me4-Glcp→6)-GlcpND0.09
2,4,6-Me3-Galp→3)-Galp-(1→ND0.03
2,4-Me2-Galp→3,6)-Galp-(1→ND0.17
2,3-Me2-Araf→5)-Araf-(1→ND0.06
2,3-Me2-Xylp→4)-Xylp-(1→ND0.10
2,3,4-Me3-RhalpRhap-(1→ND0.02
ND indicates not detected.
Table 2. 1H and 13C NMR chemical shifts (in ppm) for AVPG-1 and AVPG-2 recorded in D2O at 30 °C.
PeakGlycosyl ResidueH-1/C-1H-2/C-2H-3/C-3H-4/C-4H-5/C-5H-6/C-6
Chemical shifts of residues of AVPG-1
A-4)-α-d-Glcp-(1-5.38/99.703.62/71.013.95/72.923.64/73.253.76/72.263.41, 4.03
/68.98
B-3,4)-β-d-Glcp-(1-4.45/101.613.35/72.803.80/80.183.74/73.553.56/73.403.70, 3.94
/60.44
Cβ-d-Xylp-(1-4.71/103.103.76/75.834.03/71.183.41/71.673.70, 4.12/67.49
D-4)-α-d-Galp-(1-5.22/108.353.56/78.603.26/72.213.69/79.544.11/76.603.80, 4.00
/67.54
Eα-l-Araf-(1-5.20/109.204.19/80.853.92/75.864.11/83.773.36, 4.20/62.46
Fα-d-GlcpA-(1-5.26/97.604.14/80.373.69/79.683.82/70.894.04/61.64-/179.22
Chemical shifts of residues of AVPG-2
A-6)-β-d-Glcp4.62/95.843.22/71.193.45/75.813.87/69.304.09/68.423.70, 3.94/61.23
B-4)-α-d-Glcp-(1-5.40/99.703.62/71.553.94/73.193.61/76.663.75/76.473.41, 3.98/68.70
C-3)-α-d-Galp-(1-5.39/101.633.62/71.433.70/79.943.40/69.513.93/73.114.12, 4.19/68.14
D-4)-α-d-Galp-(1-5.22/108.273.50/71.363.26/72.733.67/72.583.40/72.253.71, 3.82/60.94
E-3,6)-β-d-Galp-(1-4.41/103.093.50/71.633.70/80.033.53/73.813.36/69.573.71, 4.09/68.50
Fα-l-Araf-(1-5.23/109.184.19/81.193.80/76.314.11/76.433.45, 3.80/60.36
Gα-l-Araf-(1-5.20/92.014.20/81.253.91/76.634.11/76.523.45, 3.80/60.36
H-5)-α-l-Araf-(1-5.07/98.924.11/83.853.92/76.494.19/81.183.68, 3.91/76.67
I-4)-β-d-Xylp-(1-4.49/102.723.34/73.173.55/73.973.94/76.493.39, 4.10/62.89
Jα-l-Rhap-(1-4.71/100.703.90/73.374.11/80.403.41/72.034.01/69.881.23/16.42
Kα-d-GlcpA-(1-5.26/97.614.14/80.603.92/76.474.19/80.943.98/68.66177.05
L-4)-α-d-GalpA5.06/107.433.74/79.843.63/71.494.10/83.893.92/76.46175.38
Publisher’s Note: MDPI stays neutral with regard to jurisdictional claims in published maps and institutional affiliations.

