
Dust-Acoustic Nonlinear Waves in a Nanoparticle Fraction of Ultracold (2K) Multicomponent Dusty Plasma

 , , and
Abstract
:1. Introduction
2. Results
2.1. Plasma Parameters
2.2. The Main Forces
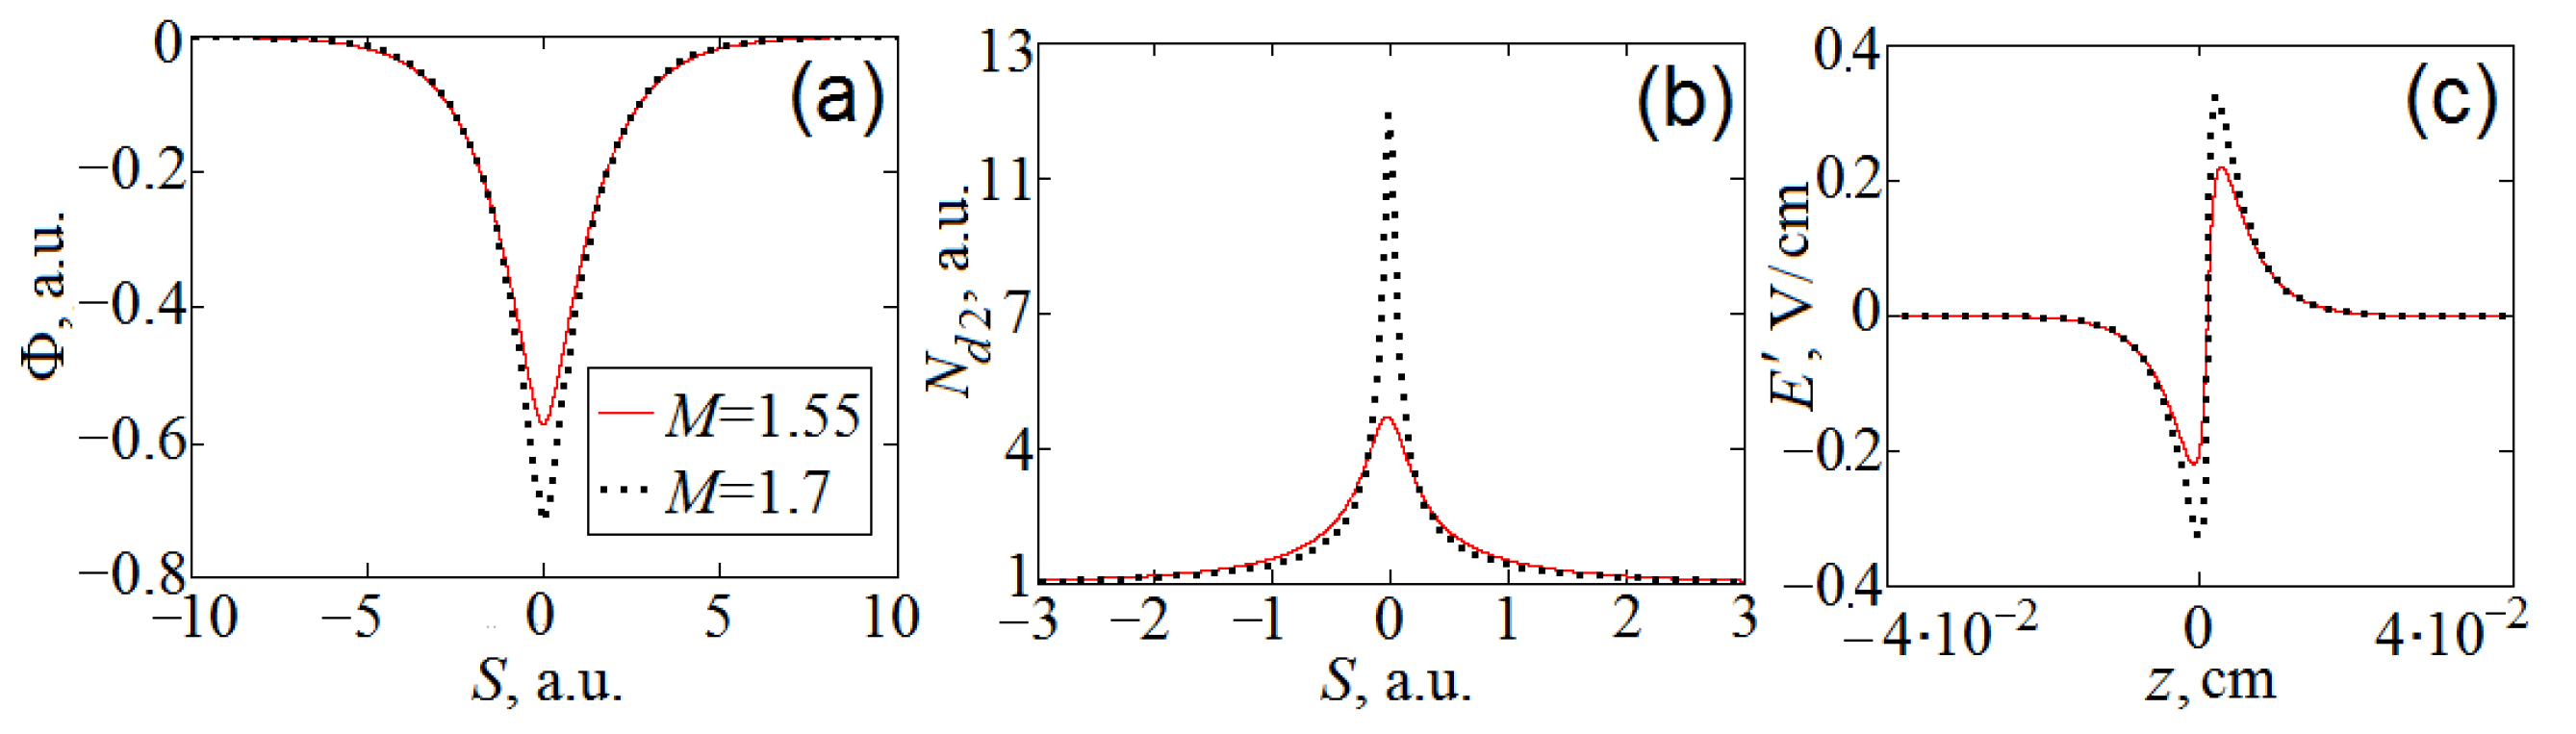
2.3. Hydrodynamic Wave Model
3. Discussion
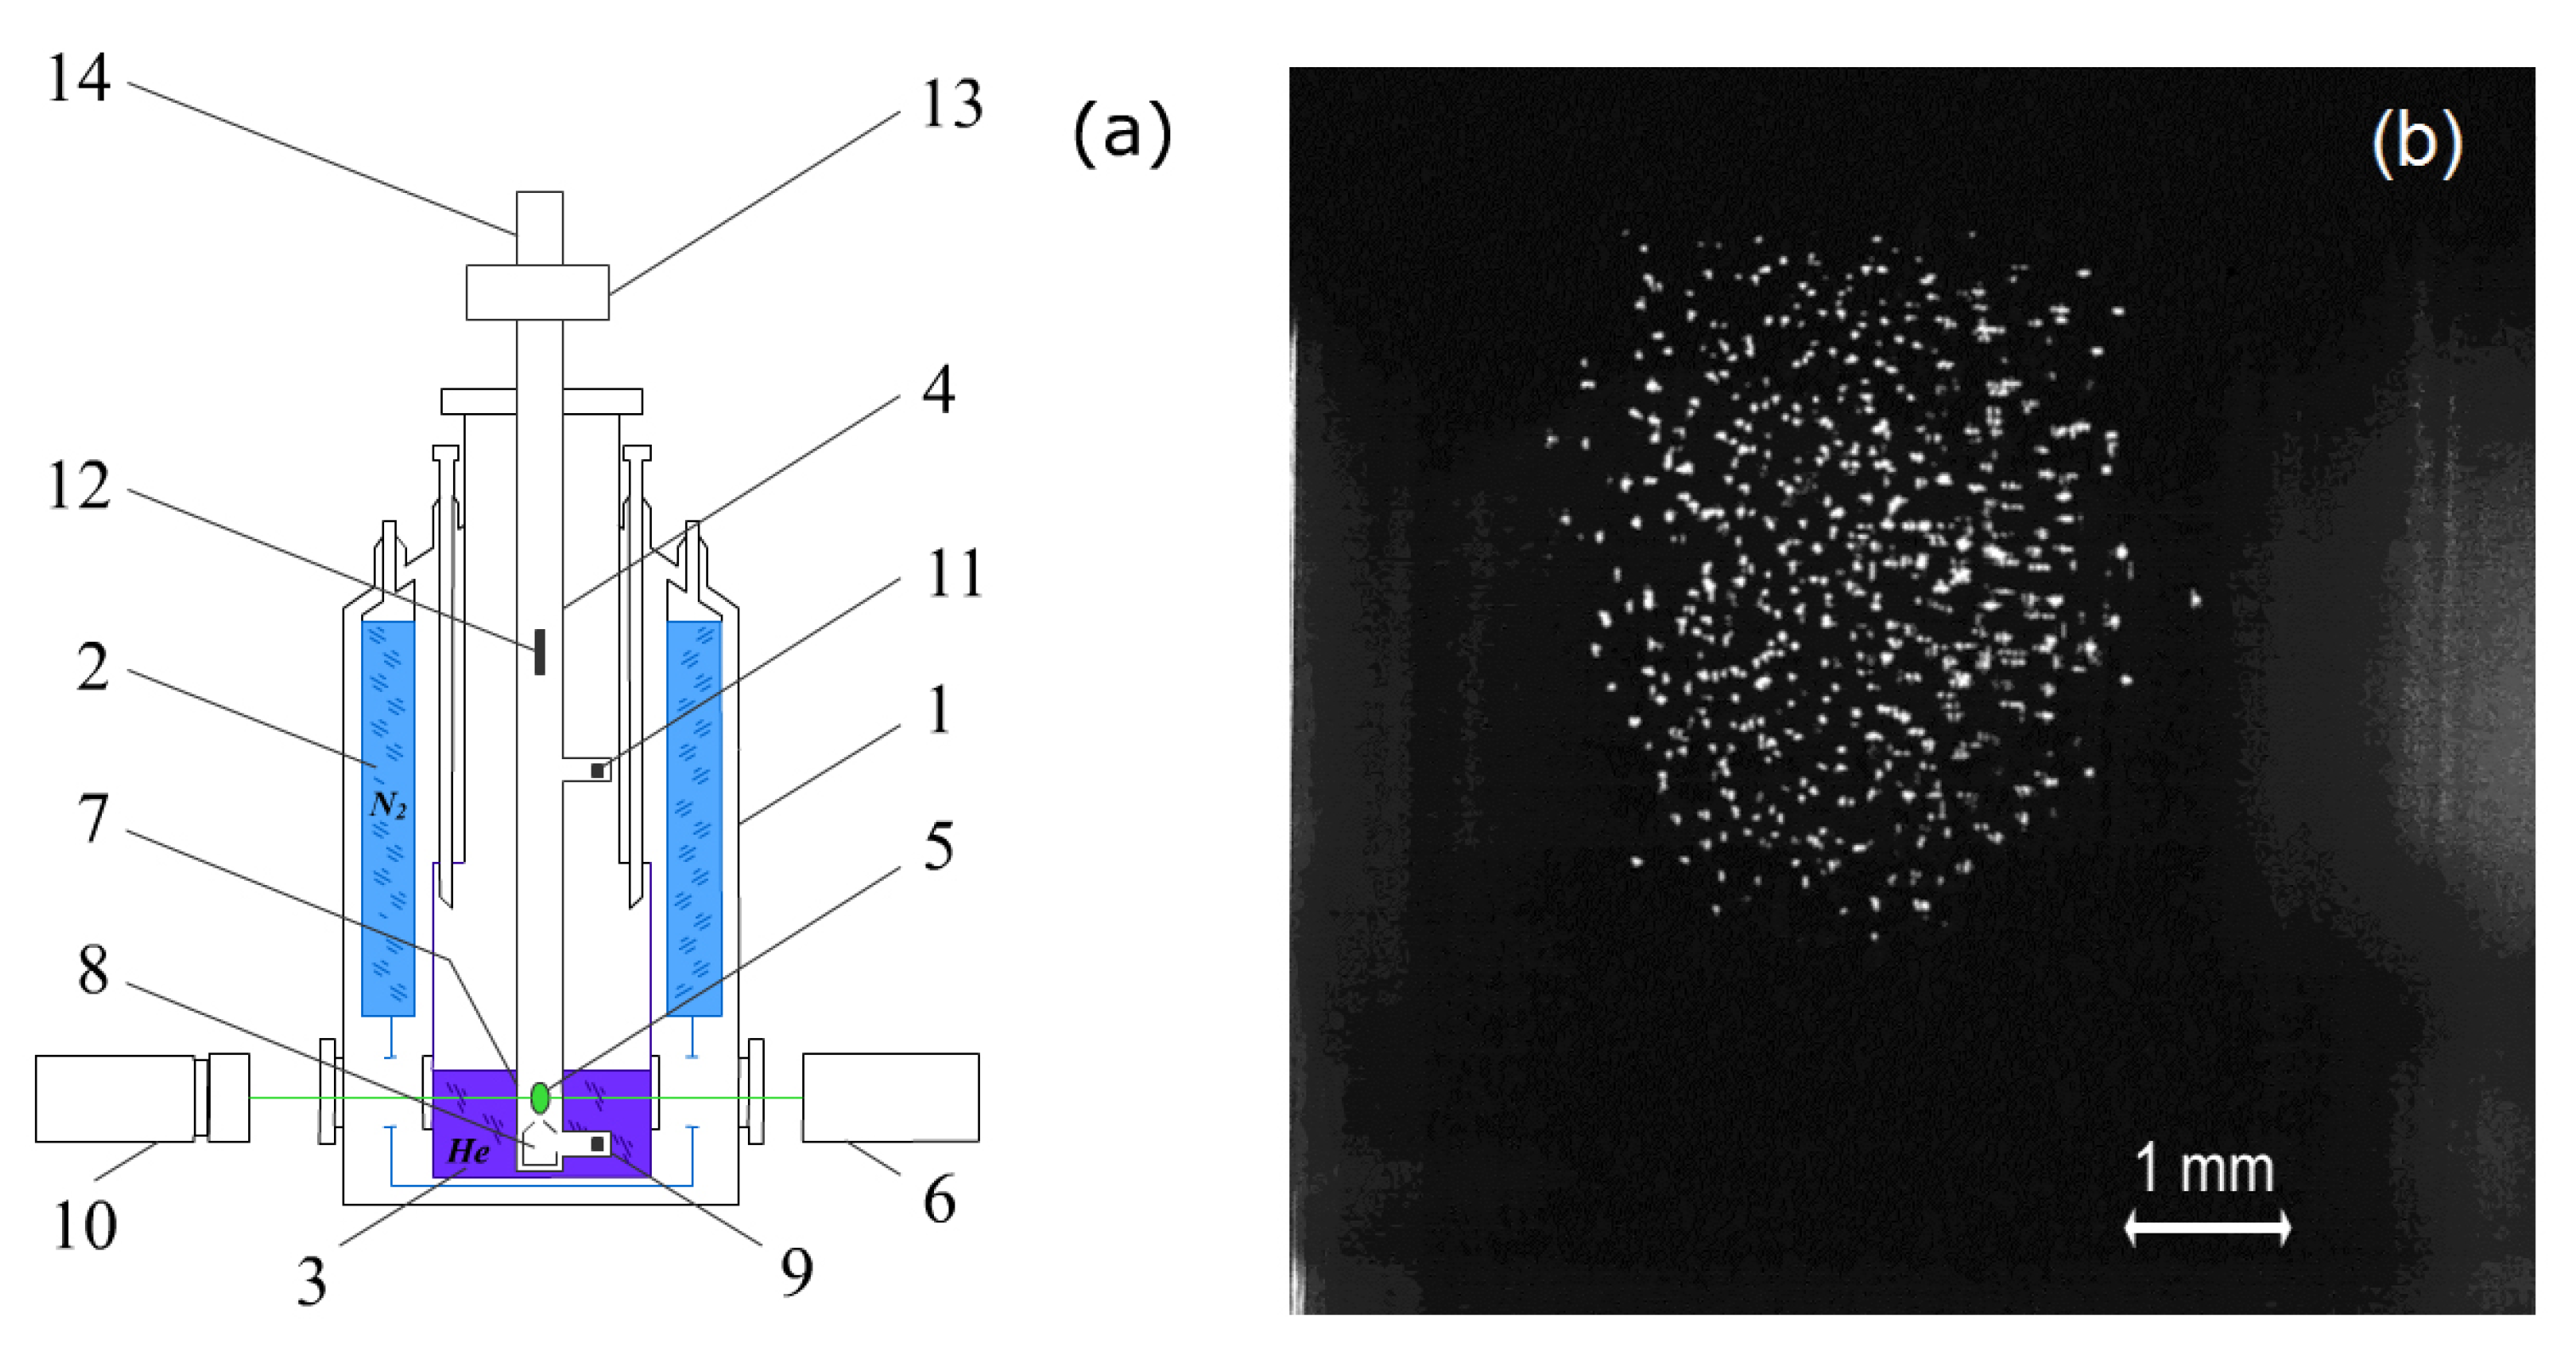
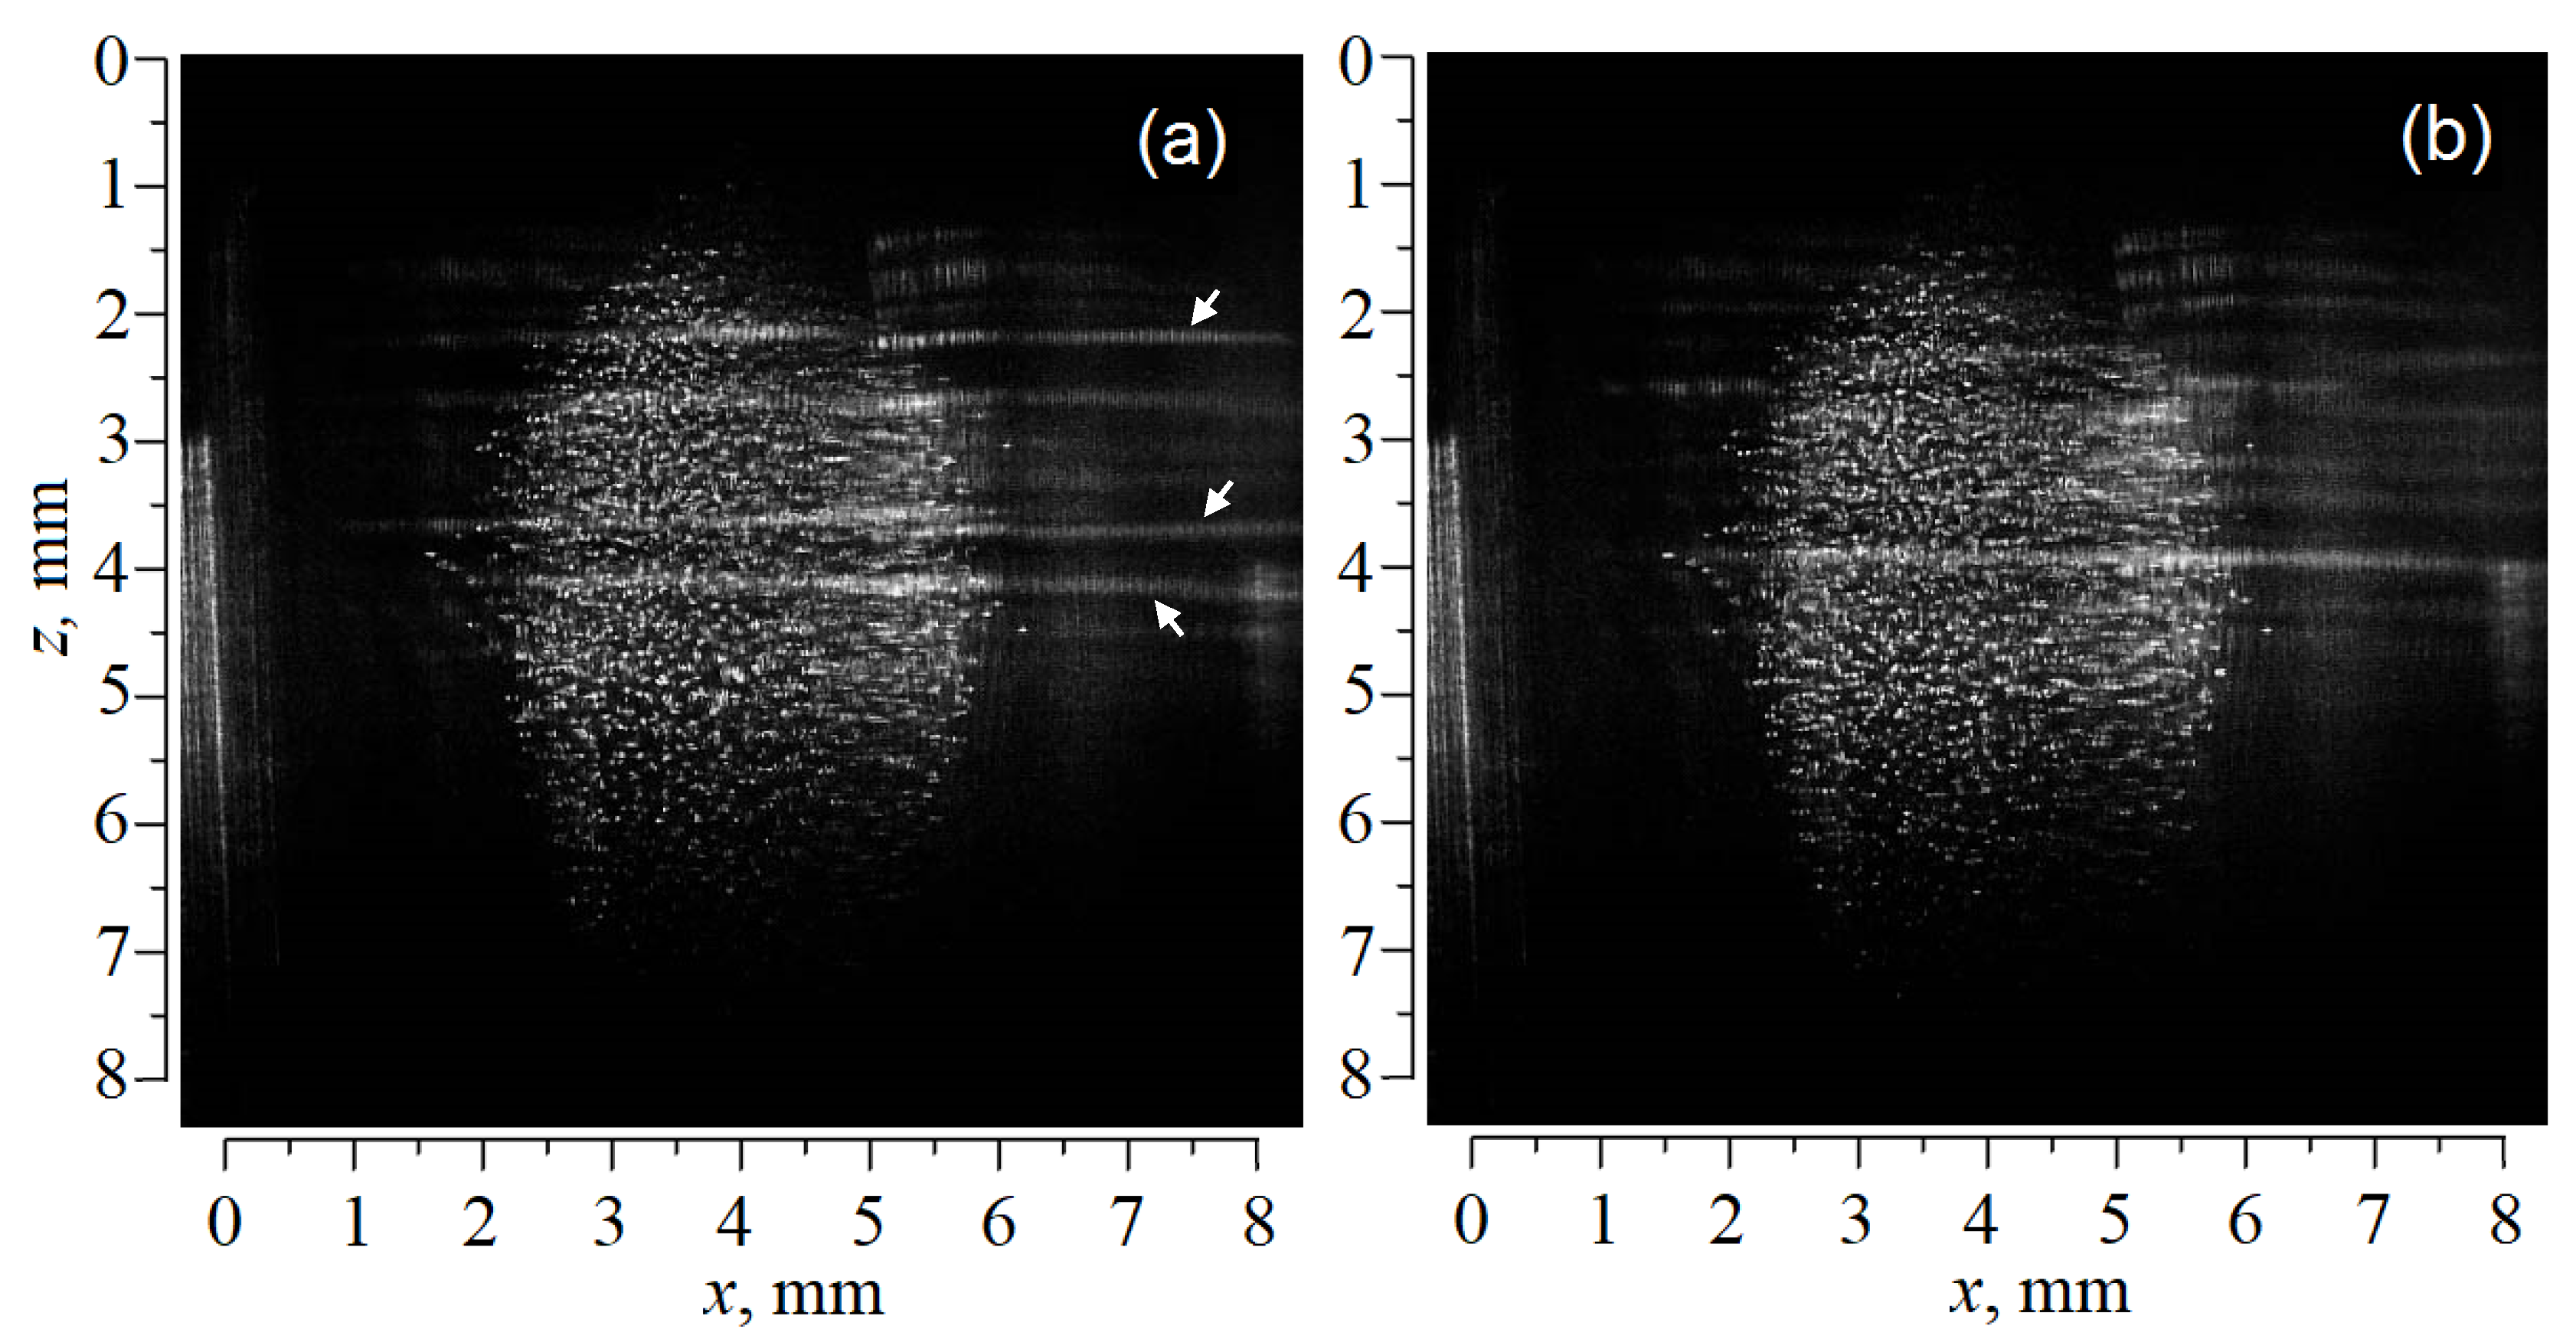
4. Experiment
5. Conclusions
Author Contributions
Funding
Institutional Review Board Statement
Informed Consent Statement
Data Availability Statement
Conflicts of Interest
Sample Availability
References
- Shukla, P.K.; Mamun, A.A. Introduction to Dusty Plasma Physics; IoP Publishing Ltd.: Bristol, UK, 2002. [Google Scholar]
- Mikikian, M.; Boufendi, L.; Bouchoule, A.; Thomas, H.M.; Morfill, G.E.; Nefedov, A.P.; Fortov, V.E.; The PKE–Nefedov Team. Formation and behaviour of dust particle clouds in a radio-frequency discharge: Results in the laboratory and under microgravity conditions. New J. Phys. 2003, 5, 19. [Google Scholar] [CrossRef]
- Fortov, V.E.; Vasilyak, L.M.; Vetchinin, S.P.; Zimnukhov, V.S.; Nefedov, A.P.; Polyakov, D.N. Plasma-dust structures at cryogenic temperatures. Dokl. Phys. 2002, 47, 21. [Google Scholar] [CrossRef]
- Antipov, S.N.; Asinovskii, E.I.; Fortov, V.E.; Kirillin, A.V.; Markovets, V.V.; Petrov, O.F.; Platonov, V.I. Dust structures in cryogenic gas discharges. Phys. Plasmas 2007, 14, 090701. [Google Scholar] [CrossRef]
- Ishihara, O. Complex Plasma Research under Extreme Conditions. AIP Conf. Proc. 2008, 1041, 139. [Google Scholar]
- Ishihara, O. Low-dimensional structures in a complex cryogenic plasma. Plasma Phys. Control. Fusion 2012, 5, 124020. [Google Scholar] [CrossRef]
- Shindo, M.; Samarian, A.; Ishihara, O. Dynamics of Charged Dust near Liquid Helium Surface. In Proceedings of the 12th Asia Pacific Physics Conference JPS, Makuhari, Japan, 14–19 July 2013; Volume 1, p. 015049. [Google Scholar]
- Polyakov, D.N.; Vasilyak, L.M.; Shumova, V.V. Synergetics of Dusty Plasma and Technological Aspects of the Application of Cryogenic Dusty Plasma. Surf. Eng. Appl. Electrochem. 2015, 51, 143. [Google Scholar] [CrossRef]
- Samoilov, I.S.; Baev, V.P.; Timofeev, A.V.; Amirov, R.K.; Kirillin, A.V.; Nikolaev, V.S.; Bedran, Z.V. Dusty plasma in a glow discharge in helium in temperature range of 5–300. J. Exp. Theor. Phys. 2017, 124, 496. [Google Scholar] [CrossRef]
- Sundar, S.; Moldabekov, Z.A. Ultracold ions wake in dusty plasmas. New J. Phys. 2020, 22, 033028. [Google Scholar] [CrossRef]
- Maiorov, S.A.; Tkachev, A.N.; Yakovlenko, S.I. Metastable state of supercooled plasma. Phys. Scr. 1995, 51, 498. [Google Scholar] [CrossRef]
- Asinovskii, E.I.; Kirillin, A.V.; Markovets, V.V.; Fortov, V.E. Change-over of the conductivity mechanism in a nonperfect helium plasma on cooling to ~5 K. Dokl. Phys. 2001, 46, 321. [Google Scholar] [CrossRef]
- Killian, T.C.; Pattard, T.; Pohl, T.; Rost, J.M. Ultracold neutral plasmas. Phys. Rep. 2007, 449, 77. [Google Scholar] [CrossRef] [Green Version]
- Hutchinson, H.; Haakonsen, C.B. Collisional effects on nonlinear ion drag force for small grains. Phys. Plasmas 2013, 20, 083701. [Google Scholar] [CrossRef] [Green Version]
- Semenov, I.L.; Khrapak, S.A.; Thomas, H.M. Approximate expression for the electric potential around an absorbing particle in isotropic collisionless plasma. Phys. Plasmas 2015, 22, 053704. [Google Scholar] [CrossRef] [Green Version]
- Ellis, H.W.; Thackston, M.G.; McDaniel, E.W.; Mason, E.A. Transport properties of gaseous ions over a wide energy range. Part III. Atomic Data Nucl. Data Tables 1984, 31, 113. [Google Scholar] [CrossRef]
- Saito, N.; Kojima, T.M.; Kobayashi, N.; Kaneko, Y. Mobilities of He+, Ne+, Ar+, and Kr+ in He gas at 4.35 K. J. Chem. Phys. 1994, 100, 5726. [Google Scholar] [CrossRef]
- Viehland, L.A.; Mason, E.A. Transport properties of gaseous ions over a wide energy range. PartIV. Atomic Data Nucl. Data Tables 1995, 60, 137. [Google Scholar] [CrossRef]
- Maiorov, S.A. Ion drift in a gas in an external electric field. Plasma Phys. Rep. 2009, 35, 802. [Google Scholar] [CrossRef]
- Khrapak, A.G.; Golyatina, R.I.; Maiorov, S.A.; Khrapak, S.A. Approximation of the Mobility of Atomic Ions of Noble Gases in Their Parent Gas. High Temp. 2020, 58, 545. [Google Scholar] [CrossRef]
- Ramazanov, T.S.; Daniyarov, T.T.; Maiorov, S.A.; Kodanova, S.K.; Dosbolayev, M.K.; Zhankarashev, E.B. Ion heating in dusty plasma of noble gas mixtures. Contrib. Plasma Phys. 2011, 51, 505. [Google Scholar] [CrossRef]
- Antipov, S.N.; Asinovskii, E.I.; Kirillin, A.V.; Maiorov, S.A.; Markovets, V.V.; Petrov, O.F.; Fortov, V.E. Charge and structures of dust particles in a gas discharge at cryogenic temperatures. J. Exp. Theor. Phys. 2008, 106, 830. [Google Scholar] [CrossRef]
- Boltnev, R.E.; Vasiliev, M.M.; Kononov, E.A.; Petrov, O.F. Self-organization phenomena in a cryogenic gas discharge plasma: Formation of a nanoparticle cloud and dust-acoustic waves. J. Exp. Theor. Phys. 2018, 126, 561. [Google Scholar] [CrossRef]
- Boltnev, R.E.; Vasiliev, M.M.; Kononov, E.A.; Petrov, O.F. Formation of solid helical filaments at temperatures of superfluid helium as self-organization phenomena in ultracold dusty plasma. Sci. Rep. 2019, 9, 3261. [Google Scholar] [CrossRef] [Green Version]
- Boltnev, R.E.; Vasiliev, M.M.; Petrov, O.F. An experimental setup for investigation of cryogenic helium plasma and dusty plasma structures within a wide temperature range. Instrum. Exp. Tech. 2018, 61, 626. [Google Scholar] [CrossRef]
- Trukhachev, F.M.; Petrov, O.F.; Vasiliev, M.M.; Tomov, A.V. Relationship between the dust-acoustic soliton parameters and the Debye radius. J. Phys. Conf. Ser. 2020, 1556, 012073. [Google Scholar] [CrossRef]
- Liu, J.; Ma, J.X. Dust-acoustic soliton in a streaming plasma. Chin. Phys. Lett. 1997, 14, 432. [Google Scholar]
- Kubota, J.; Kojima, C.; Sekine, W.; Ishihara, O. Coulomb cluster in a plasma under cryogenic environment. J. Plasma Fusion Res. Ser. 2009, 8, 286. [Google Scholar]
- Uotani, N.; Kubota, J.; Sekine, W.; Chikasue, M.; Shindo, M.; Ishihara, O. Dust Charging in Collisional Plasma in Cryogenic Environment. J. Plasma Fusion Res. Ser. 2010, 9, 404. [Google Scholar]
- Raizer, Y.P. Gas Discharge Physics; Springer: Berlin/Heidelberg, Germany, 1991. [Google Scholar]
- Hornbeck, J. The drift velocities of molecular and atomic ions in helium, neon, and argon. Phys. Rev. 1951, 84, 615. [Google Scholar] [CrossRef]
- Patterson, P.L. Temperature dependence of helium-ion mobilities. Phys. Rev. A 1970, 2, 1154. [Google Scholar] [CrossRef]
- Khrapak, A.; Ivlev, A.V.; Morfill, G.E.; Thomas, H.M. Ion drag force in complex plasmas. Phys. Rev. E 2002, 66, 046414. [Google Scholar] [CrossRef]
- Petrov, O.F.; Trukhachev, F.M.; Vasiliev, M.M.; Gerasimenko, N.V. Large-scale transport of charged macroparticles induced by dust–acoustic solitons. J. Exp. Theor. Phys. 2018, 126, 842. [Google Scholar] [CrossRef]
- Kotsarenko, N.Y.; Koshevaya, S.V.; Kotsarenko, A.N. Dusty plasma in space. GeofísicaInternacional 1998, 37, 71. [Google Scholar] [CrossRef]
- Fortov, V.E.; Hoefner, H.; Morfill, G.; Petrov, O.F.; Simonchik, L.V.; Thoma, M.; Truhachev, F.M.; Usachev, A.D.; Zobnin, A.V. Solitary model of charged particle transport in dusty plasma. In Proceedings of the 34th EPS Conference on Plasma Physics, Warsaw, Poland, 2–6 July 2007; Volume 315, p. 66. [Google Scholar]
- Rosenberg, M. Ion- and dust-acoustic instabilities in dusty plasmas. Planet. Space Sci. 1993, 41, 229. [Google Scholar] [CrossRef]
- Rosenberg, M. Ion-dust streaming instability in processing plasmas. J. Vac. Sci. Technol. A 1996, 14, 631. [Google Scholar] [CrossRef]
- D’Angelo, N. Dusty plasma ionization instability with ion drag. Phys. Plasmas 1998, 5, 3155. [Google Scholar] [CrossRef]
- Ivlev, A.V.; Samsonov, D.; Goree, J.; Morfill, G.; Fortov, V.E. Acoustic modes in a collisional dusty plasma. Phys. Plasmas 1999, 6, 741. [Google Scholar] [CrossRef]
- Molotkov, V.I.; Nefedov, A.P.; Torchinsky, V.M.; Fortov, V.E.; Khrapak, A.G. Dust acoustic waves in a DC glow-discharge plasma. J. Exp. Theor. Phys. 1999, 89, 477. [Google Scholar] [CrossRef]
- Khrapak, S.; Yaroshenko, V. Ion drift instability in a strongly coupled collisional complex plasma. Plasma Phys. Control. Fusion 2020, 62, 105006. [Google Scholar] [CrossRef]
- Fortov, V.E.; Khrapak, A.G.; Khrapak, S.A.; Molotkov, V.I.; Nefedov, A.P.; Petrov, O.F.; Torchinsky, V.M. Mechanism of dust-acoustic instability in a direct current glow discharge plasma. Phys. Plasmas 2000, 7, 1374. [Google Scholar] [CrossRef] [Green Version]
- Islam, M.K.; Nakashima, Y.; Yatsu, K. On low-frequency dust-modes in a collisional and streaming dusty plasma with dust charge fluctuation. Phys. Plasmas 2003, 10, 591. [Google Scholar] [CrossRef] [Green Version]
- Mondal, K.K. Propagation of dust-acoustic waves in weakly ionized plasmas with dust-charge fluctuation. Pramana-J. Phys. 2004, 63, 1021. [Google Scholar] [CrossRef]
- D’Angelo, N.; Merlino, R.L. Current-driven dust-acoustic instability in a collisional plasma. Planet. Space Sci. 1996, 44, 1593. [Google Scholar] [CrossRef]
- Polyakov, D.N.; Shumova, V.V.; Vasilyak, L.M. Self-organization of Coulomb balls in glow DC discharge in neon at cryogenic temperature. Plasma Sources Sci. Technol. 2019, 28, 065017. [Google Scholar] [CrossRef]
- Karasev, V.Y.; Dzlieva, E.S.; Pavlov, S.I.; Matvievskaya, O.V.; Polishchuk, V.A.; Ermolenko, M.A.; Eikhval’d, A.I.; Gorbenko, A.P. Surface modification of melamine formaldehyde resin particles in a stratified glow discharge in neon. Contrib. Plasma Phys. 2019, 59, e201800145. [Google Scholar] [CrossRef]
- Trukhachev, F.M.; Petrov, O.F.; Vasiliev, M.M.; Sevryugov, E.Y. A new approach to analysis of dust-acoustic solitons with a self-consistent charge of dust particles. J. Phys. A Math. Theor. 2019, 52, 345501. [Google Scholar] [CrossRef]
- Schwabe, M.; Khrapak, S.A.; Zhdanov, S.K.; Pustylnik, M.Y.; Räth, C.; Fink, M.; Kretschmer, M.; Lipaev, A.M.; Molotkov, V.I.; Schmitz, A.S.; et al. Slowing of acoustic waves in electrorheological and string-fluid complex plasmas. New J. Phys. 2020, 22, 083079. [Google Scholar] [CrossRef]

| Plasma Parameters | Value |
|---|---|
| Neutralgas pressure. | PHe = 5 Pa |
| Discharge current | I = 35 ± 15 μA |
| Discharge voltage | U = 3.21 kV |
| Neutralgas density | nHe = 1.8 × 10²³ m−3 |
| Temperature of the neutral gas (the walls of the discharge tube) | Ta ≈ 2 K |
| Radius of the first fraction dust particles | rd1 ≈ 1–5 μm |
| Radius of the second fraction dust particles | rd2 ≈ 15–35 nm |
| Mass density of the first fraction dust particles | ρ1 = 7200 kg/m3 |
| Mass density of the second fraction dust particles | ρ2 = 1100–1500 kg/m3 |
| Electric field strength | E ≈ 2000 V/m |
| Reduced electric field strength | E/N ≈ 10 Td |
| Plasma Parameters | Value |
|---|---|
| Density of the first fraction particles | nd1 = 3.0 × 105 cm−3 |
| Density of the second fraction particles | nd2 = 3.7 × 107 cm−3 |
| Charge of the first fraction dust | Z1 ≈ 500 |
| Charge of the second fraction dust | Z2 = 2 |
| Electron density | ne ≈ 1 × 107 cm−3 |
| Ion density | ni ≈ 2.3 × 108 cm−3 |
| Electron temperature | Te ≈ 104 K |
| Ion temperature | Ti ≈ 45 K |
| Electron Debye length | λDe = 2.2 × 10⁻¹ cm |
| Ion Debye length | λDi = 3.0 × 10⁻³ cm |
| Ion free path | li = 5.5 μm |
| Gravitational force for the first fraction particles | FG1 = 1.6 × 10⁻¹³ N |
| Gravitational force for the second fraction particles | FG2 = 2.0 × 10⁻¹⁸ N |
| Electric force for the first fraction particles | FE1 = 1.6 × 10⁻¹³ N |
| Electric force for the second fraction particles | FE2 = 3.2 × 10⁻¹⁶ N |
| Ion drag force for the first fraction particles | Fid1 = 3.0 × 10⁻¹⁴ N |
| Ion drag force for the second fraction particles | Fid2 = 4.9 × 10⁻¹⁸ N |
| Neutral drag force for the first fraction particles at u0d1 = 5 × 10⁻³ m/s | Fnd1 = 1.6 × 10⁻¹⁵ N |
| Neutral drag force for the second fraction particles at u0d2 = 0.2 m/s, γ = 1 + π/8 | Fnd2 = 2.2 × 10⁻¹⁶ N |
| Electron thermal velocity | υTe = 4 × 107 cm/s |
| Ion thermal velocity | υTi = 3 × 104 cm/s |
Publisher’s Note: MDPI stays neutral with regard to jurisdictional claims in published maps and institutional affiliations. |
© 2021 by the authors. Licensee MDPI, Basel, Switzerland. This article is an open access article distributed under the terms and conditions of the Creative Commons Attribution (CC BY) license (https://creativecommons.org/licenses/by/4.0/).
Share and Cite
Trukhachev, F.M.; Boltnev, R.E.; Vasiliev, M.M.; Petrov, O.F. Dust-Acoustic Nonlinear Waves in a Nanoparticle Fraction of Ultracold (2K) Multicomponent Dusty Plasma. Molecules 2022, 27, 227. https://doi.org/10.3390/molecules27010227
Trukhachev FM, Boltnev RE, Vasiliev MM, Petrov OF. Dust-Acoustic Nonlinear Waves in a Nanoparticle Fraction of Ultracold (2K) Multicomponent Dusty Plasma. Molecules. 2022; 27(1):227. https://doi.org/10.3390/molecules27010227
Chicago/Turabian StyleTrukhachev, Fedor M., Roman E. Boltnev, Mikhail M. Vasiliev, and Oleg F. Petrov. 2022. "Dust-Acoustic Nonlinear Waves in a Nanoparticle Fraction of Ultracold (2K) Multicomponent Dusty Plasma" Molecules 27, no. 1: 227. https://doi.org/10.3390/molecules27010227