
Effect of Ultrasound and Enzymatic Mash Treatment on Bioactive Compounds and Antioxidant Capacity of Black, Red and White Currant Juices


Abstract
1. Introduction
2. Results and Discussion
2.1. Effect of Ultrasound Mash Treatment on Juice Yield
2.2. Effect of Ultrasound Mash Treatment on pH, Titratable Acidity and Total Soluble Solids of Juice
2.3. Total Phenolic Content (TPC) and Antioxidant Capacity (TEAC) of Juices
2.4. Determination of Phenolic Compounds by High-Performance Liquid Chromatography (HPLC)
2.5. Determination of Anthocyanin by HPLC
2.6. Instrumental Color Parameters of Currant Juices
2.7. Ascorbic Acid Content in Juices
3. Materials and Methods
3.1. Currant Fruit
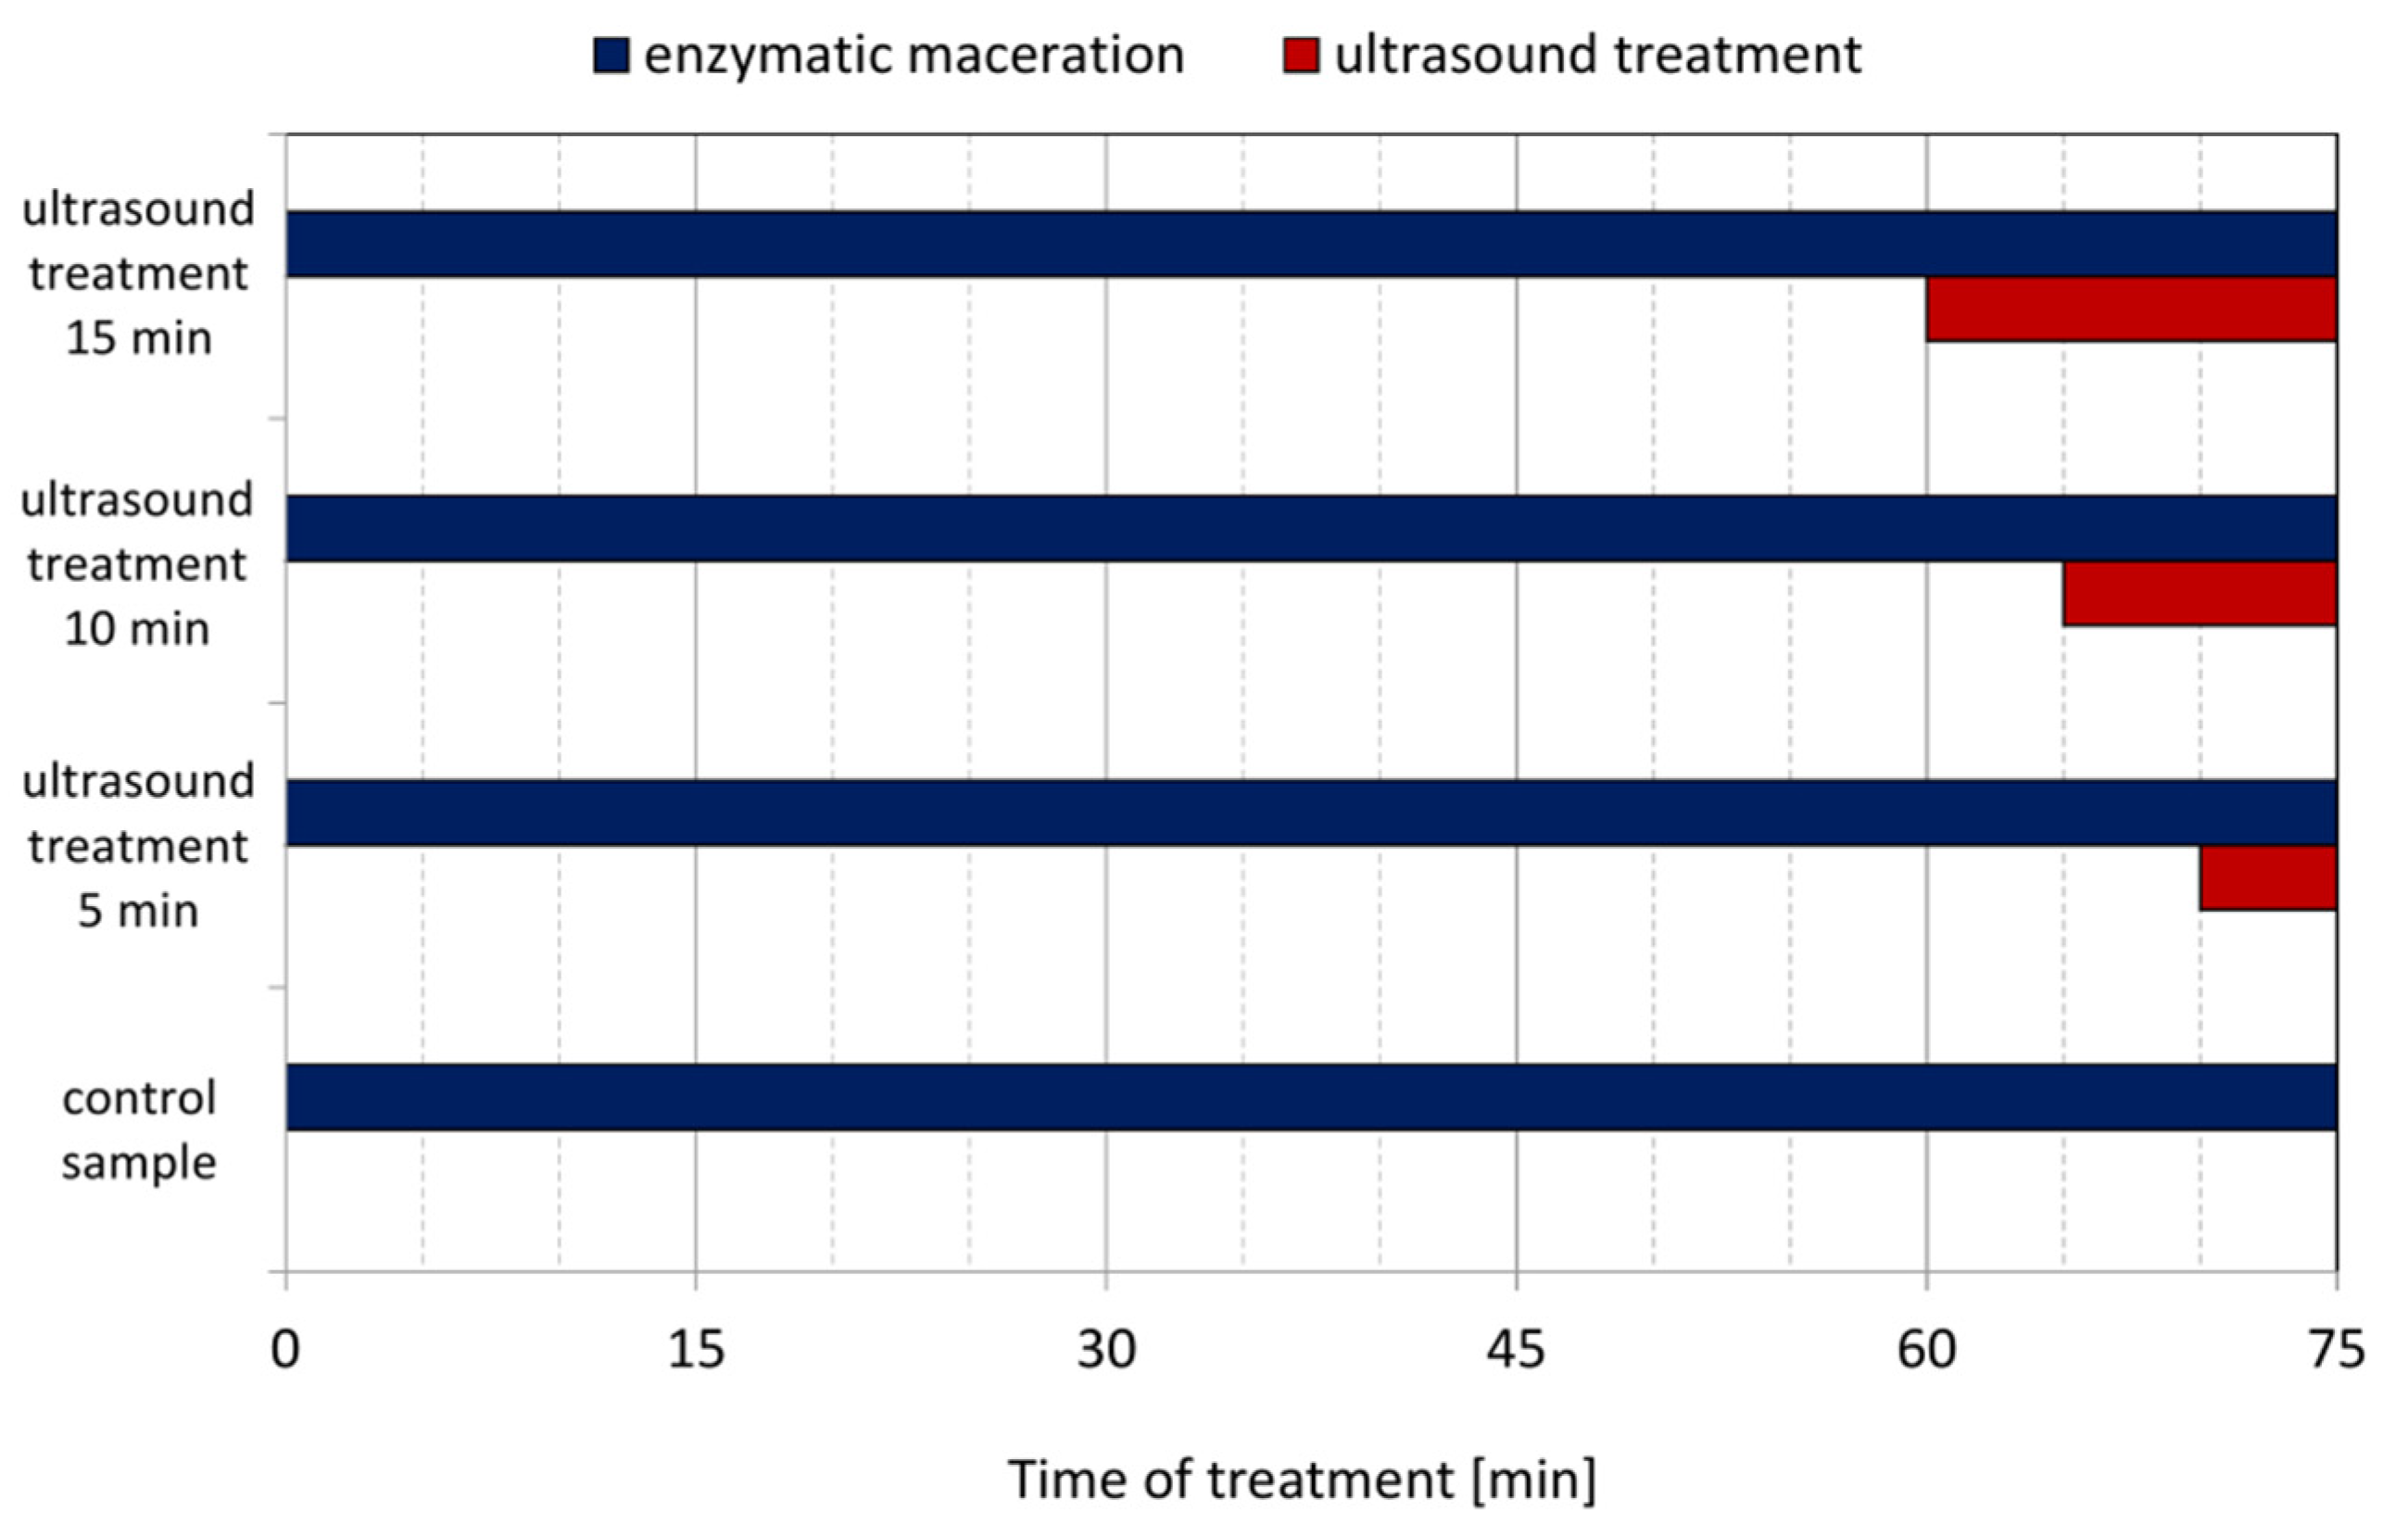
3.2. Enzymatic and Ultrasound Mash Treatment
3.3. Juice Pressing
3.4. Evaluation of Juice Yield
3.5. Determination of pH, Titratable Acidity and Soluble Solids
3.6. Total Phenolic Content (TPC)
3.7. Determination of Phenolic Compounds by HPLC
3.8. Determination of Anthocyanins by HPLC
3.9. Color Measurement
3.10. Determination of Ascorbic Acid Content by HPLC
3.11. Antioxidant Capacity Determination (TEAC)
3.12. Statistical Analysis
4. Conclusions
Author Contributions
Funding
Institutional Review Board Statement
Informed Consent Statement
Data Availability Statement
Acknowledgments
Conflicts of Interest
Sample Availability
References
- Brennan, R.M. Currants and Gooseberries. In Temperate Fruit Crop Breeding; Hancock, J.F., Ed.; Springer: Dordrecht, The Netherlands, 2008. [Google Scholar]
- Nour, V.; Trandafir, I.; Ionica, M.E. Ascorbic acid, anthocyanins, organic acids and mineral content of some black and red currant cultivars. Fruits 2011, 66, 353–362. [Google Scholar] [CrossRef]
- Food and Agriculture Organization of the United Nations. FAOSTAT Statistical Database; FAO: Rome, Italy, 2021. [Google Scholar]
- Karjalainen, R.; Anttonen, M.; Saviranta, N.; Stewart, D.; Mcdougall, G.; Hilz, H.; Pirjo, M.; Törrönen, R. A review on bioactive compounds in black currants (Ribes nigrum L.) and their potential health-promoting properties, Acta Horticulturae. I Int. Symp. Biotechnol. Fruit Species 2008, 839, 301–307. [Google Scholar] [CrossRef]
- Pluta, S. New challenges in the Ribes breeding and production, Acta Horticulturae. X Int. Rubus Ribes Symp. 2011, 946, 27–35. [Google Scholar] [CrossRef]
- Anttonen, M.J.; Karjalainen, R.O. High-Performance Liquid Chromatography Analysis of Black Currant (Ribes nigrum L.) Fruit Phenolics Grown either Conventionally or Organically. J. Agric. Food Chem. 2006, 54, 7530–7538. [Google Scholar] [CrossRef] [PubMed]
- Borges, G.; Degeneve, A.; Mullen, W.; Crozier, A. Identification of Flavonoid and Phenolic Antioxidants in Black Currants, Blueberries, Raspberries, Red Currants, and Cranberries. J. Agric. Food Chem. 2010, 58, 3901–3909. [Google Scholar] [CrossRef] [PubMed]
- Vagiri, M.; Ekholm, A.; Öberg, E.; Johansson, E.; Andersson, S.C.; Rumpunen, K. Phenols and Ascorbic Acid in Black Currants (Ribes nigrum L.): Variation Due to Genotype, Location, and Year. J. Agric. Food Chem. 2013, 61, 9298–9306. [Google Scholar] [CrossRef]
- Djordjević, B.; Šavikin, K.; Zdunić, G.; Janković, T.; Vulić, T.; Oparnica, Č.; Radivojević, D. Biochemical Properties of Red Currant Varieties in Relation to Storage. Plant Foods Hum. Nutr. 2010, 65, 326–332. [Google Scholar] [CrossRef]
- Wojdyło, A.; Oszmiański, J.; Milczarek, M.; Wietrzyk, J. Phenolic profile, antioxidant and antiproliferative activity of black and red currants (Ribes spp.) from organic and conventional cultivation. Int. J. Food Sci. Technol. 2013, 48, 715–726. [Google Scholar] [CrossRef]
- Berk, S.; Gundogdu, M.; Tuna, S.; Tas, A. Role of Maturity Stages on Phenolic Compounds and Organic Acids Contents in Red Currant Fruits. Int. J. Fruit Sci. 2020, 20, S1054–S1071. [Google Scholar] [CrossRef]
- Määttä, K.; Kamal-Eldin, A.; Törrönen, R. Phenolic compounds in berries of black, red, green, and white currants (Ribes sp.). Antioxid. Redox Signal. 2001, 3, 981–993. [Google Scholar] [CrossRef]
- Zheng, J.; Yang, B.; Tuomasjukka, S.; Ou, S.; Kallio, H. Effects of latitude and weather conditions on contents of sugars, fruit acids, and ascorbic acid in black currant (Ribes nigrum L.) juice. J. Agric. Food Chem. 2009, 57, 2977–2987. [Google Scholar] [CrossRef]
- Milošević, T.; Milošević, N. Vegetative Growth, Productivity, Berry Quality Attributes and Leaf Macronutrients Content of Currants as Affected by Species and Cultivars. Erwerbs-Obstbau 2018, 60, 53–65. [Google Scholar] [CrossRef]
- Ercan, S.Ş.; Soysal, Ç. Use of ultrasound in food preservation. Nat. Sci. 2013, 5, 5–13. [Google Scholar] [CrossRef]
- Swamy, G.J.; Muthukumarappan, K.; Asokapandian, S. Chapter 23—Ultrasound for Fruit Juice Preservation. In Fruit Juices; Rajauria, G., Tiwari, B., Eds.; Academic Press: San Diego, CA, USA, 2018; pp. 451–462. [Google Scholar] [CrossRef]
- Pingret, D.; Fabiano-Tixier, A.-S.; Bourvellec, C.L.; Renard, C.M.G.C.; Chemat, F. Lab and pilot-scale ultrasound-assisted water extraction of polyphenols from apple pomace. J. Food Eng. 2012, 111, 73–81. [Google Scholar] [CrossRef]
- Alessandro, L.G.d.; Kriaa, K.; Nikov, I.; Dimitrov, K. Ultrasound assisted extraction of polyphenols from black chokeberry. Sep. Purif. Technol. 2012, 93, 42–47. [Google Scholar] [CrossRef]
- Margean, A.; Lupu, M.I.; Alexa, E.; Padureanu, V.; Canja, C.M.; Cocan, I.; Negrea, M.; Calefariu, G.; Poiana, M.-A. An Overview of Effects Induced by Pasteurization and High-Power Ultrasound Treatment on the Quality of Red Grape Juice. Molecules 2020, 25, 1669. [Google Scholar] [CrossRef]
- Aadil, R.M.; Zeng, X.-A.; Han, Z.; Sun, D.-W. Effects of ultrasound treatments on quality of grapefruit juice. Food Chem. 2013, 141, 3201–3206. [Google Scholar] [CrossRef]
- Rojas, M.L.; Leite, T.S.; Cristianini, M.; Alvim, I.D.; Augusto, P.E.D. Peach juice processed by the ultrasound technology: Changes in its microstructure improve its physical properties and stability. Food Res. Int. 2016, 82, 22–33. [Google Scholar] [CrossRef]
- Wang, J.; Wang, J.; Ye, J.; Vanga, S.K.; Raghavan, V. Influence of high-intensity ultrasound on bioactive compounds of strawberry juice: Profiles of ascorbic acid, phenolics, antioxidant activity and microstructure. Food Control. 2019, 96, 128–136. [Google Scholar] [CrossRef]
- Nguyen, C.L.; Nguyen, H.V.H. Ultrasonic Effects on the Quality of Mulberry Juice. Beverages 2018, 4, 56. [Google Scholar] [CrossRef]
- Radziejewska-Kubzdela, E.; Szwengiel, A.; Ratajkiewicz, H.; Nowak, K. Effect of ultrasound, heating and enzymatic pre-treatment on bioactive compounds in juice from Berberis amurensis Rupr. Ultrason. Sonochem. 2020, 63, 104971. [Google Scholar] [CrossRef] [PubMed]
- Kuusi, T. The most important quality criteria of some homegrown black-currant varieties II. Dry matter, pectin, acid content, colour and formol value. Agric. Food Sci. 1965, 37, 282–304. [Google Scholar] [CrossRef][Green Version]
- Hilz, H.; Bakx, E.J.; Schols, H.A.; Voragen, A.G.J. Cell wall polysaccharides in black currants and bilberries-characterisation in berries, juice, and press cake. Carbohydr. Polym. 2005, 59, 477–488. [Google Scholar] [CrossRef]
- Tapre, A.R.; Jain, R.K. Pectinases: Enzymes for fruit processing industry. Int. Food Res. J. 2014, 21, 447–453. [Google Scholar]
- Zafra-Rojas, Q.Y.; Cruz-Cansino, N.; Ramírez-Moreno, E.; Delgado-Olivares, L.; Villanueva-Sánchez, J.; Alanís-García, E. Effects of ultrasound treatment in purple cactus pear (Opuntia ficus-indica) juice. Ultrason. Sonochem. 2013, 20, 1283–1288. [Google Scholar] [CrossRef]
- Yu, Z.; Xiyan, H. Sonication enhances quality and antioxidant activity of blueberry juice. Food Sci. Technol. 2017, 37, 599–603. [Google Scholar] [CrossRef]
- Bora, S.J.; Handique, J.; Sit, N. Effect of ultrasound and enzymatic pre-treatment on yield and properties of banana juice. Ultrason. Sonochem. 2017, 37, 445–451. [Google Scholar] [CrossRef] [PubMed]
- Rubinskiene, M.; Viskelis, P.; Duchovskis, P.; Bobinas, C. Change of biologically active constituents during ripening in black currants. J. Fruit Ornam. Plant Res. 2006, 14, 237–246. [Google Scholar]
- Dai, J.; Mumper, R.J. Plant phenolics: Extraction, analysis and their antioxidant and anticancer properties. Molecules 2010, 15, 7313–7352. [Google Scholar] [CrossRef] [PubMed]
- Toma, M.; Vinatoru, M.; Paniwnyk, L.; Mason, T.J. Investigation of the effects of ultrasound on vegetal tissues during solvent extraction. Ultrason. Sonochem. 2001, 8, 137–142. [Google Scholar] [CrossRef]
- Singleton, V.L.; Orthofer, R.; Lamuela-Raventós, R.M. [14] Analysis of total phenols and other oxidation substrates and antioxidants by means of folin-ciocalteu reagent. In Oxidants and Antioxidants Part A; Academic Press: Cambridge, CA, USA, 1999; pp. 152–178. [Google Scholar] [CrossRef]
- Feng, C.; Su, S.; Wang, L.; Wu, J.; Tang, Z.; Xu, Y.; Shu, Q.; Wang, L. Antioxidant capacities and anthocyanin characteristics of the black-red wild berries obtained in Northeast China. Food Chem. 2016, 204, 150–158. [Google Scholar] [CrossRef] [PubMed]
- Nguyen, L.; Le, V. Effects of ultrasonic treatment of rumduol mash on the antioxidant level of fruit juice. Int. Food Res. J. 2016, 23, 2335–2340. [Google Scholar]
- Gavrilova, V.; Kajdžanoska, M.; Gjamovski, V.; Stefova, M. Separation, Characterization and Quantification of Phenolic Compounds in Blueberries and Red and Black Currants by HPLC−DAD−ESI-MSn. J. Agric. Food Chem. 2011, 59, 4009–4018. [Google Scholar] [CrossRef] [PubMed]
- Olawuyi, I.; Park, J.J.; Lee, W. Effect of extraction conditions on ultrasonic-assisted extraction of polyphenolic compounds from okra (Abelmoschus esculentus L.) leaves. Korean J. Food Preserv. 2020, 27, 476–486. [Google Scholar] [CrossRef]
- Tiwari, B.K.; Patras, A.; Brunton, N.; Cullen, P.J.; O’Donnell, C.P. Effect of ultrasound processing on anthocyanins and color of red grape juice. Ultrason. Sonochem. 2010, 17, 598–604. [Google Scholar] [CrossRef]
- Alighourchi, H.; Barzegar, M.; Sahari, M.A.; Abbasi, S. Effect of sonication on anthocyanins, total phenolic content, and antioxidant capacity of pomegranate juices. Int. Food Res. J. 2013, 20, 1703–1709. [Google Scholar]
- Jakobek, L.; Šeruga, M.; Medvidović-Kosanović, M.; Novak, I. Anthocyanin content and antioxidant activity of various red fruit juices. Deutsch. Lebensm. 2007, 103, 58–64. [Google Scholar]
- Mokrzycki, W.; Tatol, M. Color difference Delta E—A survey. Mach. Graph. Vis. 2011, 20, 383–411. [Google Scholar]
- Cheng, L.H.; Soh, C.Y.; Liew, S.C.; Teh, F.F. Effects of sonication and carbonation on guava juice quality. Food Chem. 2007, 104, 1396–1401. [Google Scholar] [CrossRef]
- Adekunte, A.O.; Tiwari, B.K.; Cullen, P.J.; Scannell, A.G.M.; O’Donnell, C.P. Effect of sonication on colour, ascorbic acid and yeast inactivation in tomato juice. Food Chem. 2010, 122, 500–507. [Google Scholar] [CrossRef]
- Singleton, V.L.; Rossi, J.A. Colorimetry of Total Phenolics with Phosphomolybdic-Phosphotungstic Acid Reagents. Am. J. Enol. Vitic. 1965, 16, 144–158. [Google Scholar]
- Oszmiański, J.; Sapis, J.C. Anthocyanins in Fruits of Aronia Melanocarpa (Chokeberry). J. Food Sci. 1988, 53, 1241–1242. [Google Scholar] [CrossRef]
- Kurilich, A.C.; Tsau, G.J.; Brown, A.; Howard, L.; Klein, B.P.; Jeffery, E.H.; Kushad, M.; Wallig, M.A.; Juvik, J.A. Carotene, Tocopherol, and Ascorbate Contents in Subspecies of Brassica oleracea. J. Agric. Food Chem. 1999, 47, 1576–1581. [Google Scholar] [CrossRef] [PubMed]
- Re, R.; Pellegrini, N.; Proteggente, A.; Pannala, A.; Yang, M.; Rice-Evans, C. Antioxidant activity applying an improved\ABTS\radical cation decolorization assay. Free Radic. Biol. Med. 1999, 26, 1231–1237. [Google Scholar] [CrossRef]


| Duration of Ultrasound Treatment [min] | Juice Yield [%] | ||
|---|---|---|---|
| BC | RC | WC | |
| 0 | 71.2 | 85.9 | 80.6 |
| 5 | 68.9 | 86.5 | 80.7 |
| 10 | 73.8 | 86.3 | 81.4 |
| 15 | 73.1 | 88.0 | 81.9 |
| Duration of Ultrasound Treatment [min] | pH | Titratable Acidity [g/L] | Total Soluble Solids [°Bx] |
|---|---|---|---|
| BC | |||
| 0 | 2.83 ± 0.02a | 42.1 ± 0.2a | 12.7 ± 0.1b |
| 5 | 2.88 ± 0.07ab | 41.0 ± 0.5a | 12.2 ± 0.1a |
| 10 | 3.00 ± 0.03bc | 48.0 ± 0.0c | 12.1 ± 0.1a |
| 15 | 3.03 ± 0.03c | 45.0 ± 0.2b | 12.6 ± 0.2b |
| RC | |||
| 0 | 2.98 ± 0.02a | 27.8 ± 0.5a | 11.0 ± 0.0b |
| 5 | 2.96 ± 0.03a | 32.0 ± 0.9b | 10.8 ± 0.1a |
| 10 | 2.95 ± 0.02a | 30.1 ± 0.9ab | 11.2 ± 0.1c |
| 15 | 2.96 ± 0.03a | 29.1 ± 0.0a | 10.7 ± 0.1a |
| WC | |||
| 0 | 3.00 ± 0.02a | 27.2 ± 0.5a | 12.6 ± 0.1ab |
| 5 | 3.02 ± 0.03a | 26.6 ± 0.0a | 12.4 ± 0.1a |
| 10 | 3.01 ± 0.05a | 27.0 ± 0.7a | 12.4 ± 0.2ab |
| 15 | 3.01 ± 0.02a | 26.9 ± 0.5a | 12.8 ± 0.2b |
| Duration of Ultrasound Treatment [min] | TPC [mg/100 mL] | Ascorbic Acid [mg/100 mL] | Antioxidant Capacity TEAC [mmol/mL] |
|---|---|---|---|
| BC | |||
| 0 | 447 ± 32a | 104.6 ± 1.8a | 35.8 ± 1.2a |
| 5 | 499 ± 5ab | 106.5 ± 1.4a | 36.4 ± 1.1a |
| 10 | 534 ± 6b | 108.1 ± 1.8a | 38.3 ± 2.5ab |
| 15 | 538 ± 12b | 108.2 ± 2.5a | 40.3 ± 1.8b |
| RC | |||
| 0 | 310 ± 14a | 15.4 ± 3.3a | 20.1 ± 0.1a |
| 5 | 305 ± 10a | 13.2 ± 0.7a | 20.7 ± 2.4ab |
| 10 | 401 ± 29b | 16.5 ± 3.8a | 24.7 ± 1.8b |
| 15 | 490 ± 50c | 14.7 ± 3.1a | 23.9 ± 0.6b |
| WC | |||
| 0 | 569 ± 9b | 3.4 ± 0.5a | 37.1 ± 1.7a |
| 5 | 493 ± 31a | 5.4 ± 0.4b | 42.1 ± 1.8b |
| 10 | 513 ± 29ab | 5.1 ± 0.5b | 42.4 ± 2.1b |
| 15 | 550 ± 22b | 6.1 ± 1.8b | 41.0 ± 1.4ab |
| Duration of Ultrasound Treatment [min] | Gallic Acid | Neochlorogenic Acid | Chlorogenic Acid | Quercetin Derivative 1 | Quercetin Derivative 2 | Quercetin Derivative 3 | p-Coumaric Acid | Sum of Unknown | Sum of Phenolics |
|---|---|---|---|---|---|---|---|---|---|
| BC | |||||||||
| 0 | 2.02 ± 0.09 | 4.21 ± 0.14 | 4.18 ± 0.20 | 2.22 ± 0.08 | 2.02 ± 0.06 | 0.84 ± 0.05 | 3.56 ± 0.09 | 9.04 ± 0.64 | 30.1 ± 0.9 |
| 5 | 1.90 ± 0.13 | 4.28 ± 0.17 | 4.79 ± 0.17 | 2.21 ± 0.15 | 2.06 ± 0.16 | 0.93 ± 0.06 | 4.03 ± 0.13 | 9.98 ± 0.58 | 32.2 ± 1.1 |
| 10 | 1.54 ± 0.03 | 4.20 ± 0.23 | 4.84 ± 0.13 | 2.33 ± 0.14 | 2.08 ± 0.15 | 0.93 ± 0.02 | 4.01 ± 0.20 | 10.0 ± 0.9 | 32.0 ± 1.1 |
| 15 | 1.55 ± 0.10 | 4.27 ± 0.20 | 4.96 ± 0.19 | 2.40 ± 0.15 | 2.21 ± 0.05 | 1.03 ± 0.03 | 3.87 ± 0.25 | 9.52 ± 0.68 | 31.9 ± 1.4 |
| RC | |||||||||
| 0 | 2.81 ± 0.02 | 1.12 ± 0.06 | 0.91 ± 0.03 | nd | 0.68 ± 0.04 | 0.18 ± 0.06 | 0.29 ± 0.04 | 2.19 ± 0.18 | 9.26 ± 0.24 |
| 5 | 2.92 ± 0.07 | 1.18 ± 0.08 | 0.82 ± 0.07 | nd | 0.67 ± 0.05 | 0.10 ± 0.07 | 0.31 ± 0.04 | 2.34 ± 0.10 | 9.60 ± 0.65 |
| 10 | 2.96 ± 0.04 | 1.09 ± 0.04 | 0.84 ± 0.05 | nd | 0.70 ± 0.08 | 0.15 ± 0.06 | 0.33 ± 0.03 | 2.70 ± 0.20 | 9.94 ± 0.60 |
| 15 | 2.92 ± 0.02 | 1.14 ± 0.03 | 0.95 ± 0.07 | nd | 0.72 ± 0.05 | 0.18 ± 0.04 | 0.32 ± 0.03 | 2.37 ± 0.16 | 9.88 ± 0.65 |
| WC | |||||||||
| 0 | 4.72 ± 0.03 | 2.56 ± 0.08 | 0.89 ± 0.04 | 0.61 ± 0.03 | 0.25 ± 0.03 | 0.05 ± 0.04 | 0.40 ± 0.05 | 7.01 ± 0.58 | 18.3 ± 0.9 |
| 5 | 4.69 ± 0.06 | 2.55 ± 0.07 | 0.90 ± 0.04 | 0.61 ± 0.04 | 0.24 ± 0.06 | 0.04 ± 0.05 | 0.50 ± 0.07 | 7.41 ± 0.68 | 18.7 ± 0.9 |
| 10 | 4.67 ± 0.02 | 2.51 ± 0.08 | 0.89 ± 0.06 | 0.62 ± 0.02 | 0.18 ± 0.07 | 0.00 ± 0.06 | 0.41 ± 0.07 | 7.67 ± 0.56 | 18.8 ± 0.9 |
| 15 | 4.73 ± 0.05 | 2.54 ± 0.04 | 0.93 ± 0.08 | 0.60 ± 0.03 | 0.22 ± 0.06 | 0.05 ± 0.04 | 0.45 ± 0.02 | 6.33 ± 0.37 | 17.7 ± 0.8 |
| Duration of Ultrasound Treatment [min] | Delphinidin-3-O-Glucoside | Delphinidin-3-O-Rutinoside | Cyanidin-3-O-Glucoside | Cyanidin-3-O-Rutinoside | Sum of Unknown | Sum of Anthocyanins |
|---|---|---|---|---|---|---|
| BC | ||||||
| 0 | 20.9 ± 0.4 | 62.2 ± 0.7 | 8.1 ± 0.1 | 49.0 ± 0.5 | nd | 140 ± 1a |
| 5 | 21.0 ± 0.2 | 63.2 ± 0.9 | 7.8 ± 0.1 | 49.2 ± 0.9 | nd | 141 ± 2a |
| 10 | 22.2 ± 0.3 | 65.2 ± 0.4 | 8.6 ± 0.1 | 51.5 ± 0.2 | nd | 147 ± 1a |
| 15 | 22.6 ± 1.3 | 59.4 ± 10.2 | 8.3 ± 0.5 | 44.6 ± 7.4 | nd | 135 ± 19a |
| RC | ||||||
| 0 | 0.18 ± 0.01 | nd | 6.2 ± 0.1 | 2.1 ± 0.1 | 8.7 ± 0.1 | 17.1 ± 0.1a |
| 5 | 0.18 ± 0.01 | nd | 6.1 ± 0.1 | 2.1 ± 0.1 | 8.6 ± 0.1 | 17.0 ± 0.1a |
| 10 | 0.19 ± 0.01 | nd | 6.4 ± 0.1 | 2.2 ± 0.1 | 9.0 ± 0.1 | 17.9 ± 0.1a |
| 15 | 0.18 ± 0.01 | nd | 6.2 ± 0.2 | 2.1 ± 0.1 | 8.6 ± 0.2 | 17.1 ± 0.5a |
| Duration of Ultrasound Treatment [min] | L* | a* | b* | ΔE |
|---|---|---|---|---|
| BC | ||||
| 0 | 22.8 ± 0.1d | 55.0 ± 0.1d | 39.2 ± 0.1d | - |
| 5 | 22.2 ± 0.1c | 54.3 ± 0.1c | 38.2 ± 0.2c | 1.4 |
| 10 | 20.6 ± 0.1a | 52.6 ± 0.1a | 35.5 ± 0.1a | 4.9 |
| 15 | 21.2 ± 0.1b | 53.6 ± 0.1b | 36.5 ± 0.2b | 3.5 |
| RC | ||||
| 0 | 62.1 ± 0.4ab | 60.3 ± 0.3a | 20.8 ± 0.3ab | - |
| 5 | 62.5 ± 0.1b | 60.0 ± 0.1a | 20.4 ± 0.1a | 0.7 |
| 10 | 61.6 ± 0.1ab | 61.1 ± 0.1b | 21.9 ± 0.1c | 1.5 |
| 15 | 62.1 ± 0.1a | 60.4 ± 0.1a | 21.1 ± 0.1b | 0.3 |
| WC | ||||
| 0 | 93.4 ± 0.1bc | 0.9 ± 0.2a | 7.8 ± 0.1a | - |
| 5 | 93.6 ± 0.1c | 0.6 ± 0.1a | 7.8 ± 0.1a | 0.3 |
| 10 | 93.4 ± 0.1b | 0.6 ± 0.1a | 8.0 ± 0.1b | 0.4 |
| 15 | 93.1 ± 0.1a | 0.8 ± 0.1a | 8.7 ± 0.1c | 1.0 |
Publisher’s Note: MDPI stays neutral with regard to jurisdictional claims in published maps and institutional affiliations. |
© 2022 by the authors. Licensee MDPI, Basel, Switzerland. This article is an open access article distributed under the terms and conditions of the Creative Commons Attribution (CC BY) license (https://creativecommons.org/licenses/by/4.0/).
Share and Cite
Kidoń, M.; Narasimhan, G. Effect of Ultrasound and Enzymatic Mash Treatment on Bioactive Compounds and Antioxidant Capacity of Black, Red and White Currant Juices. Molecules 2022, 27, 318. https://doi.org/10.3390/molecules27010318
Kidoń M, Narasimhan G. Effect of Ultrasound and Enzymatic Mash Treatment on Bioactive Compounds and Antioxidant Capacity of Black, Red and White Currant Juices. Molecules. 2022; 27(1):318. https://doi.org/10.3390/molecules27010318
Chicago/Turabian StyleKidoń, Marcin, and Guruprasath Narasimhan. 2022. "Effect of Ultrasound and Enzymatic Mash Treatment on Bioactive Compounds and Antioxidant Capacity of Black, Red and White Currant Juices" Molecules 27, no. 1: 318. https://doi.org/10.3390/molecules27010318
APA StyleKidoń, M., & Narasimhan, G. (2022). Effect of Ultrasound and Enzymatic Mash Treatment on Bioactive Compounds and Antioxidant Capacity of Black, Red and White Currant Juices. Molecules, 27(1), 318. https://doi.org/10.3390/molecules27010318