
Salicylic Acid Stimulates Defense Systems in Allium hirtifolium Grown under Water Deficit Stress


 ,
, 
Abstract
:1. Introduction
2. Results
2.1. Relative Leaf Water Content (RWC)
2.2. Membrane Stability Index (MSI)
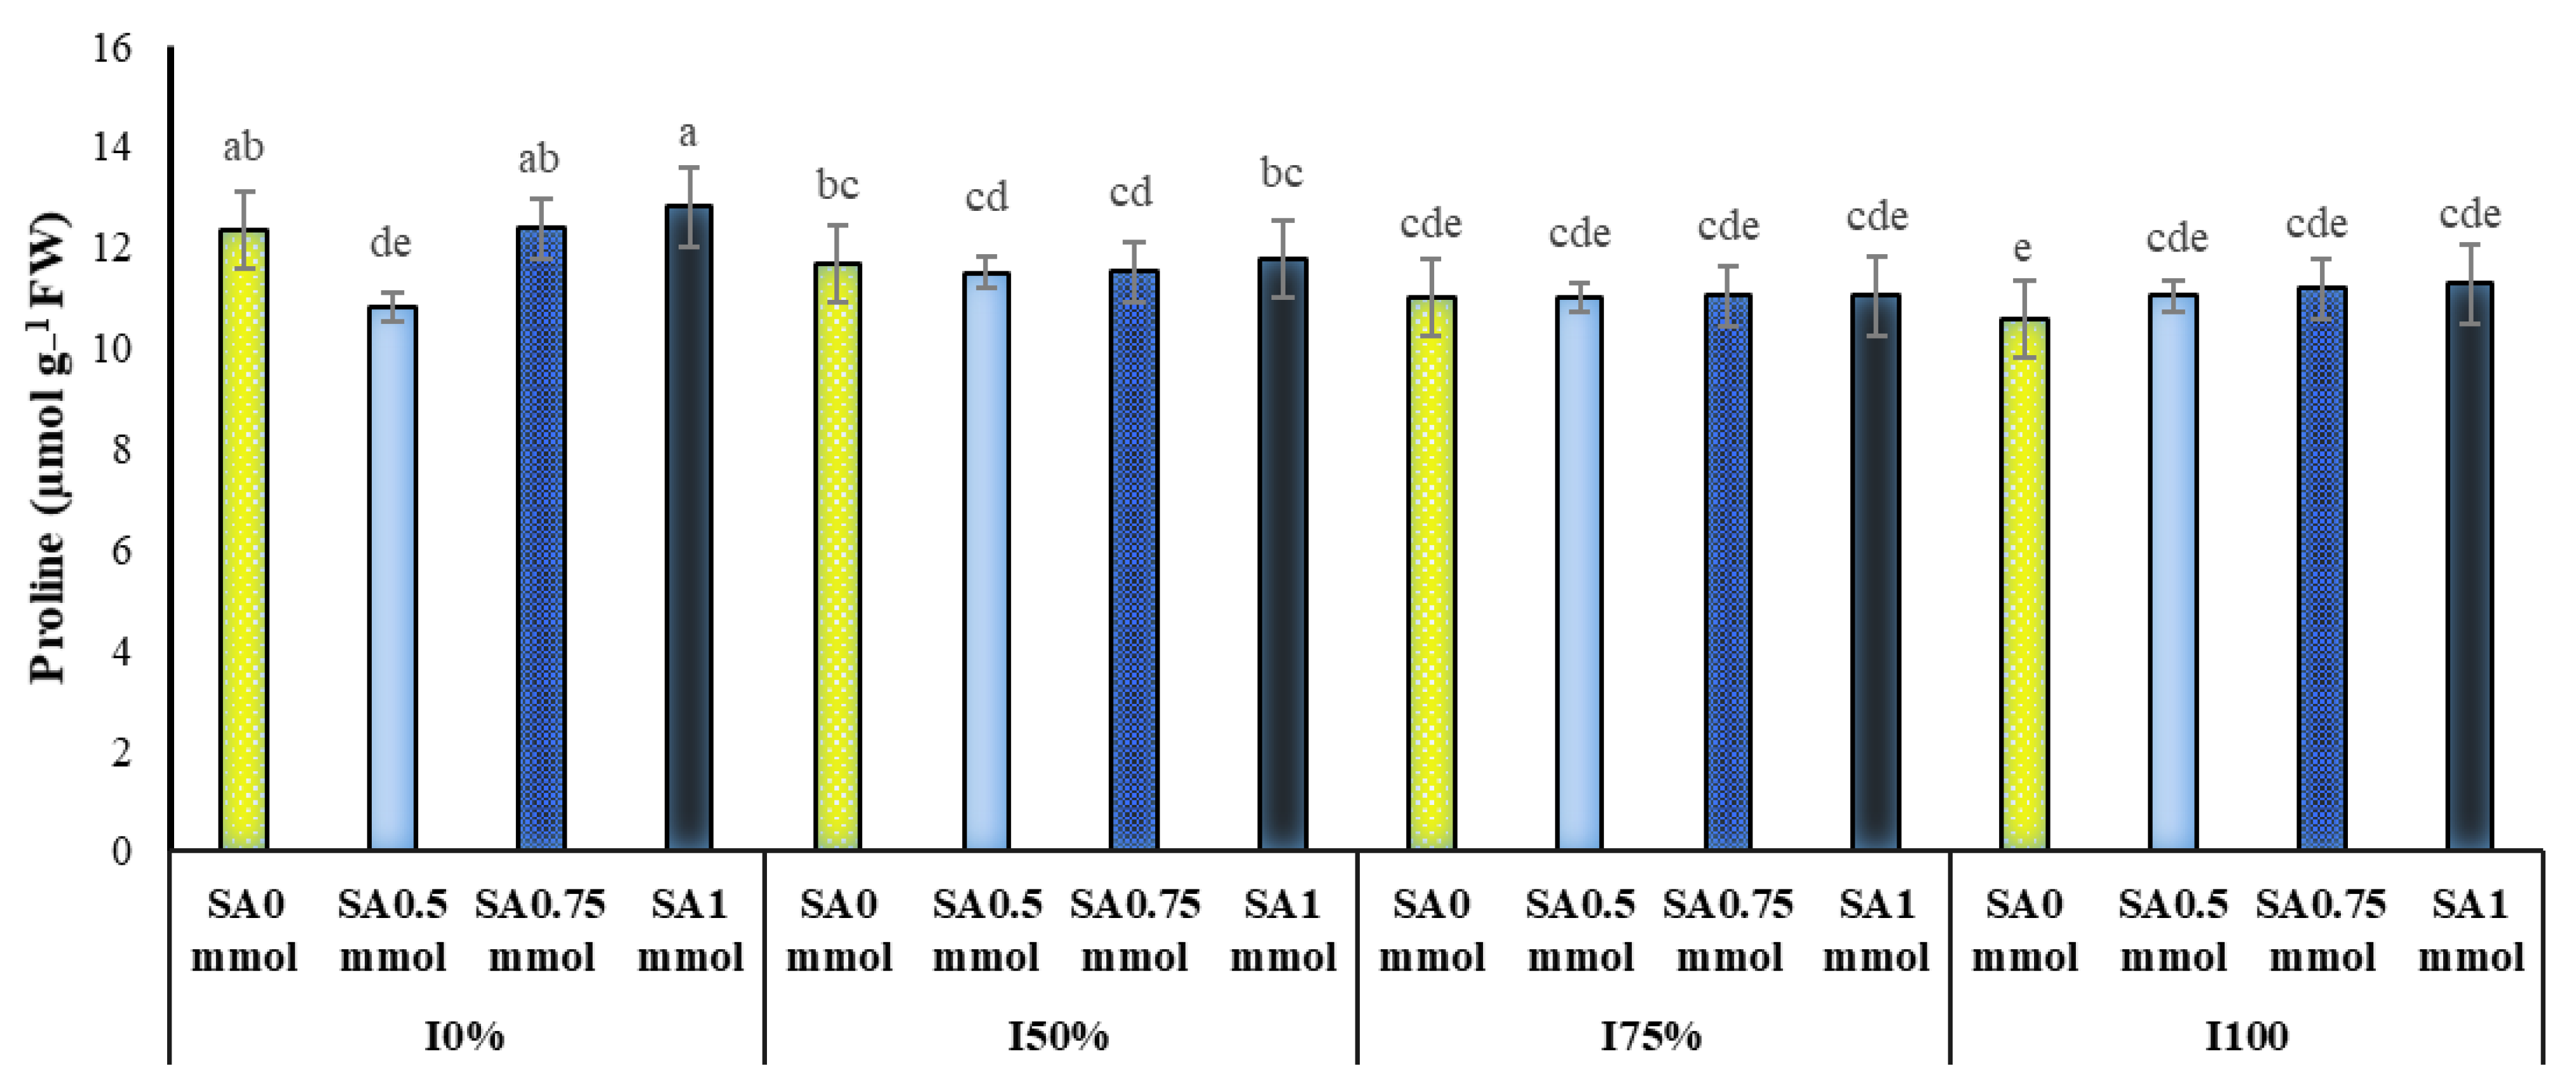
2.3. Proline
2.4. Antioxidant Enzymes
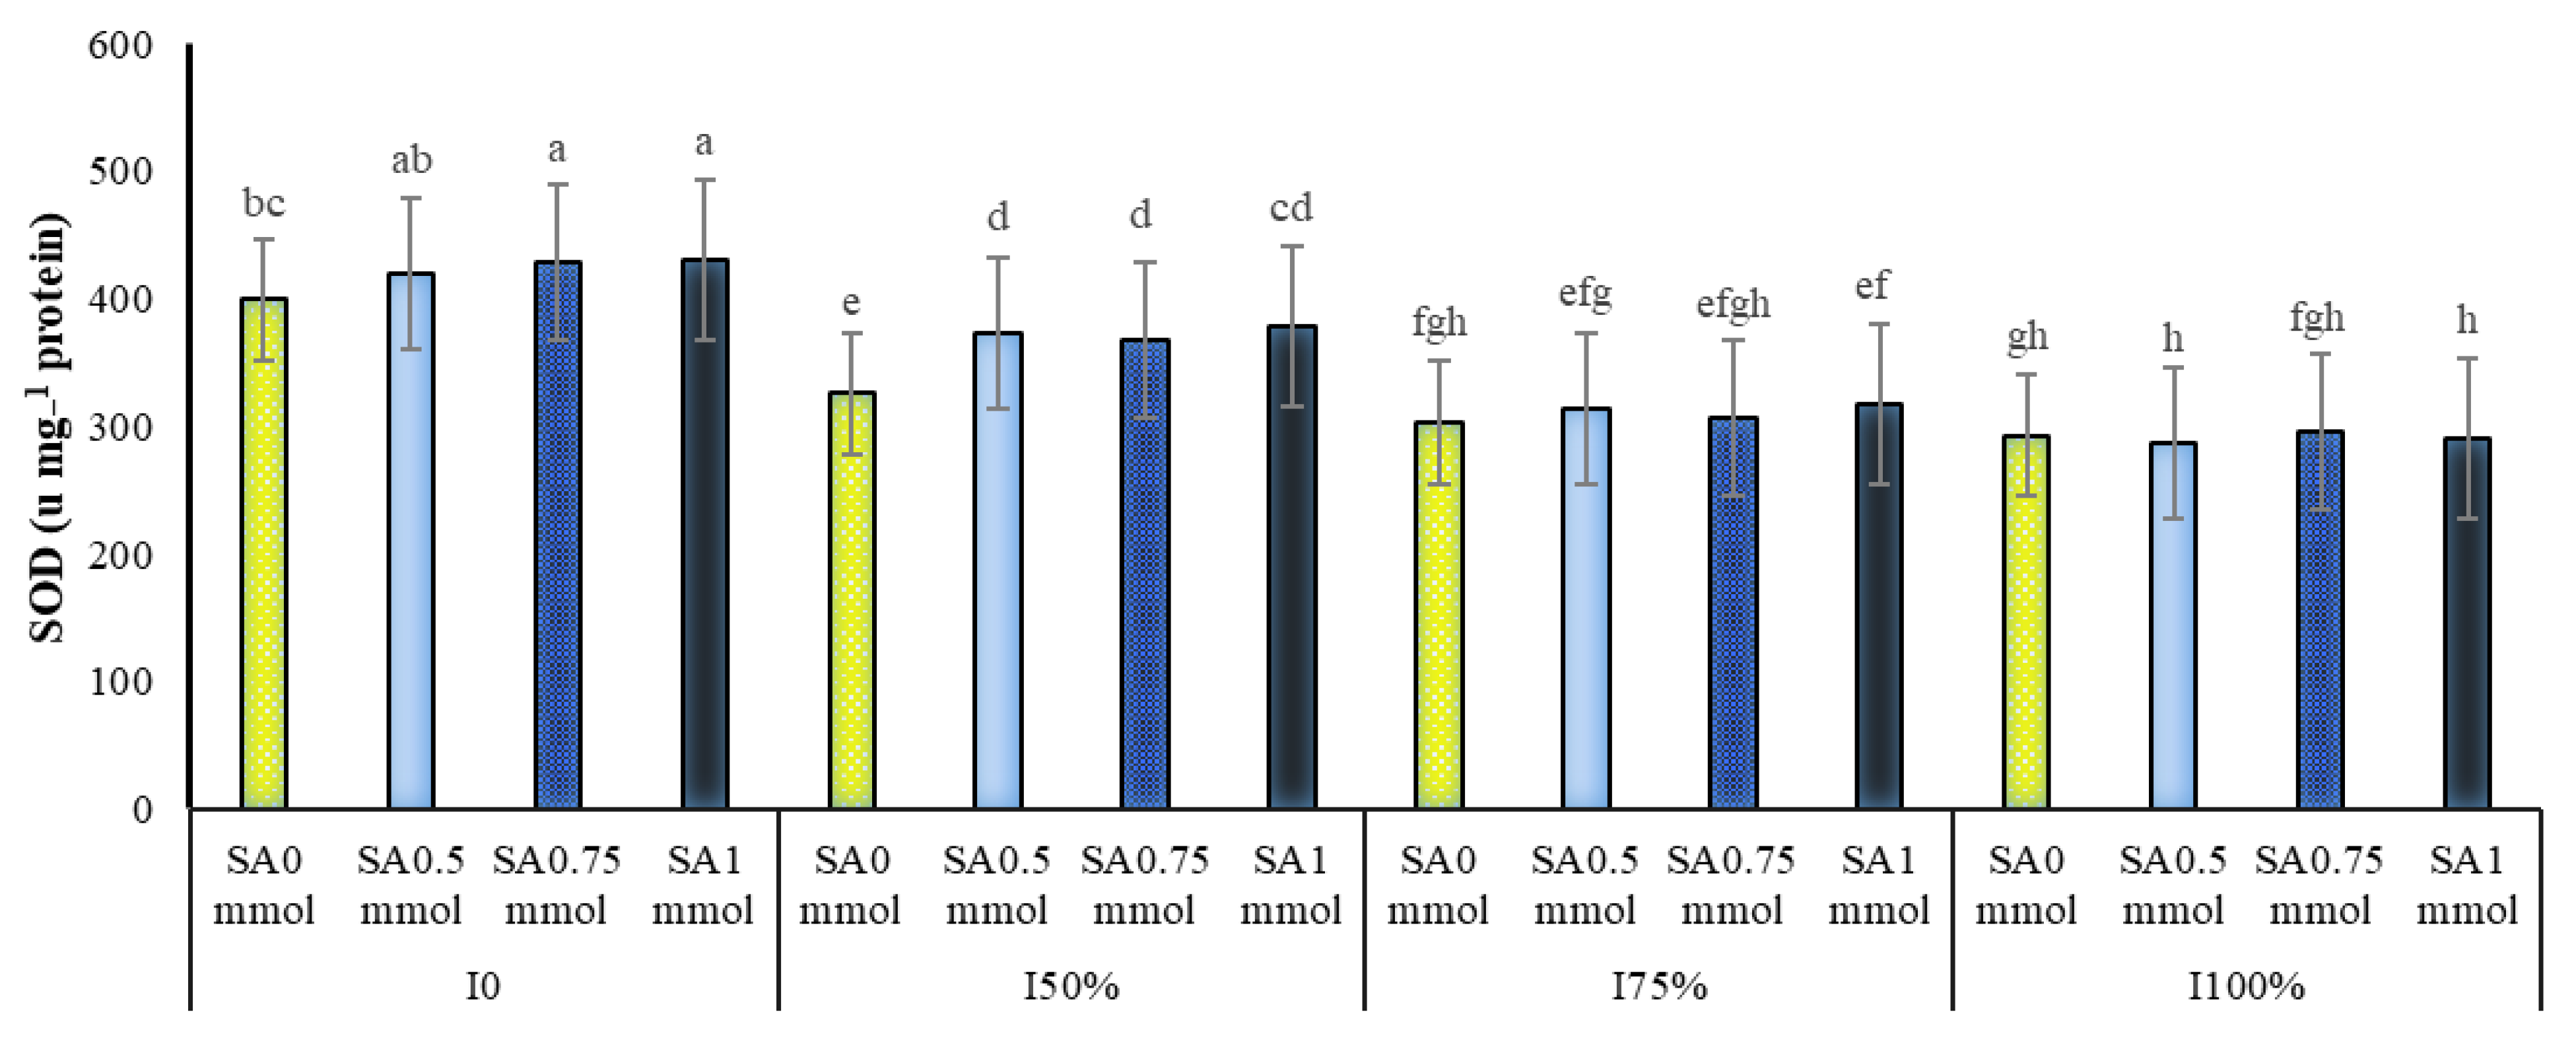
2.4.1. Superoxide Dismutase (SOD)
2.4.2. Glutathione Peroxidase (GPX)
2.4.3. Peroxidase (POD)
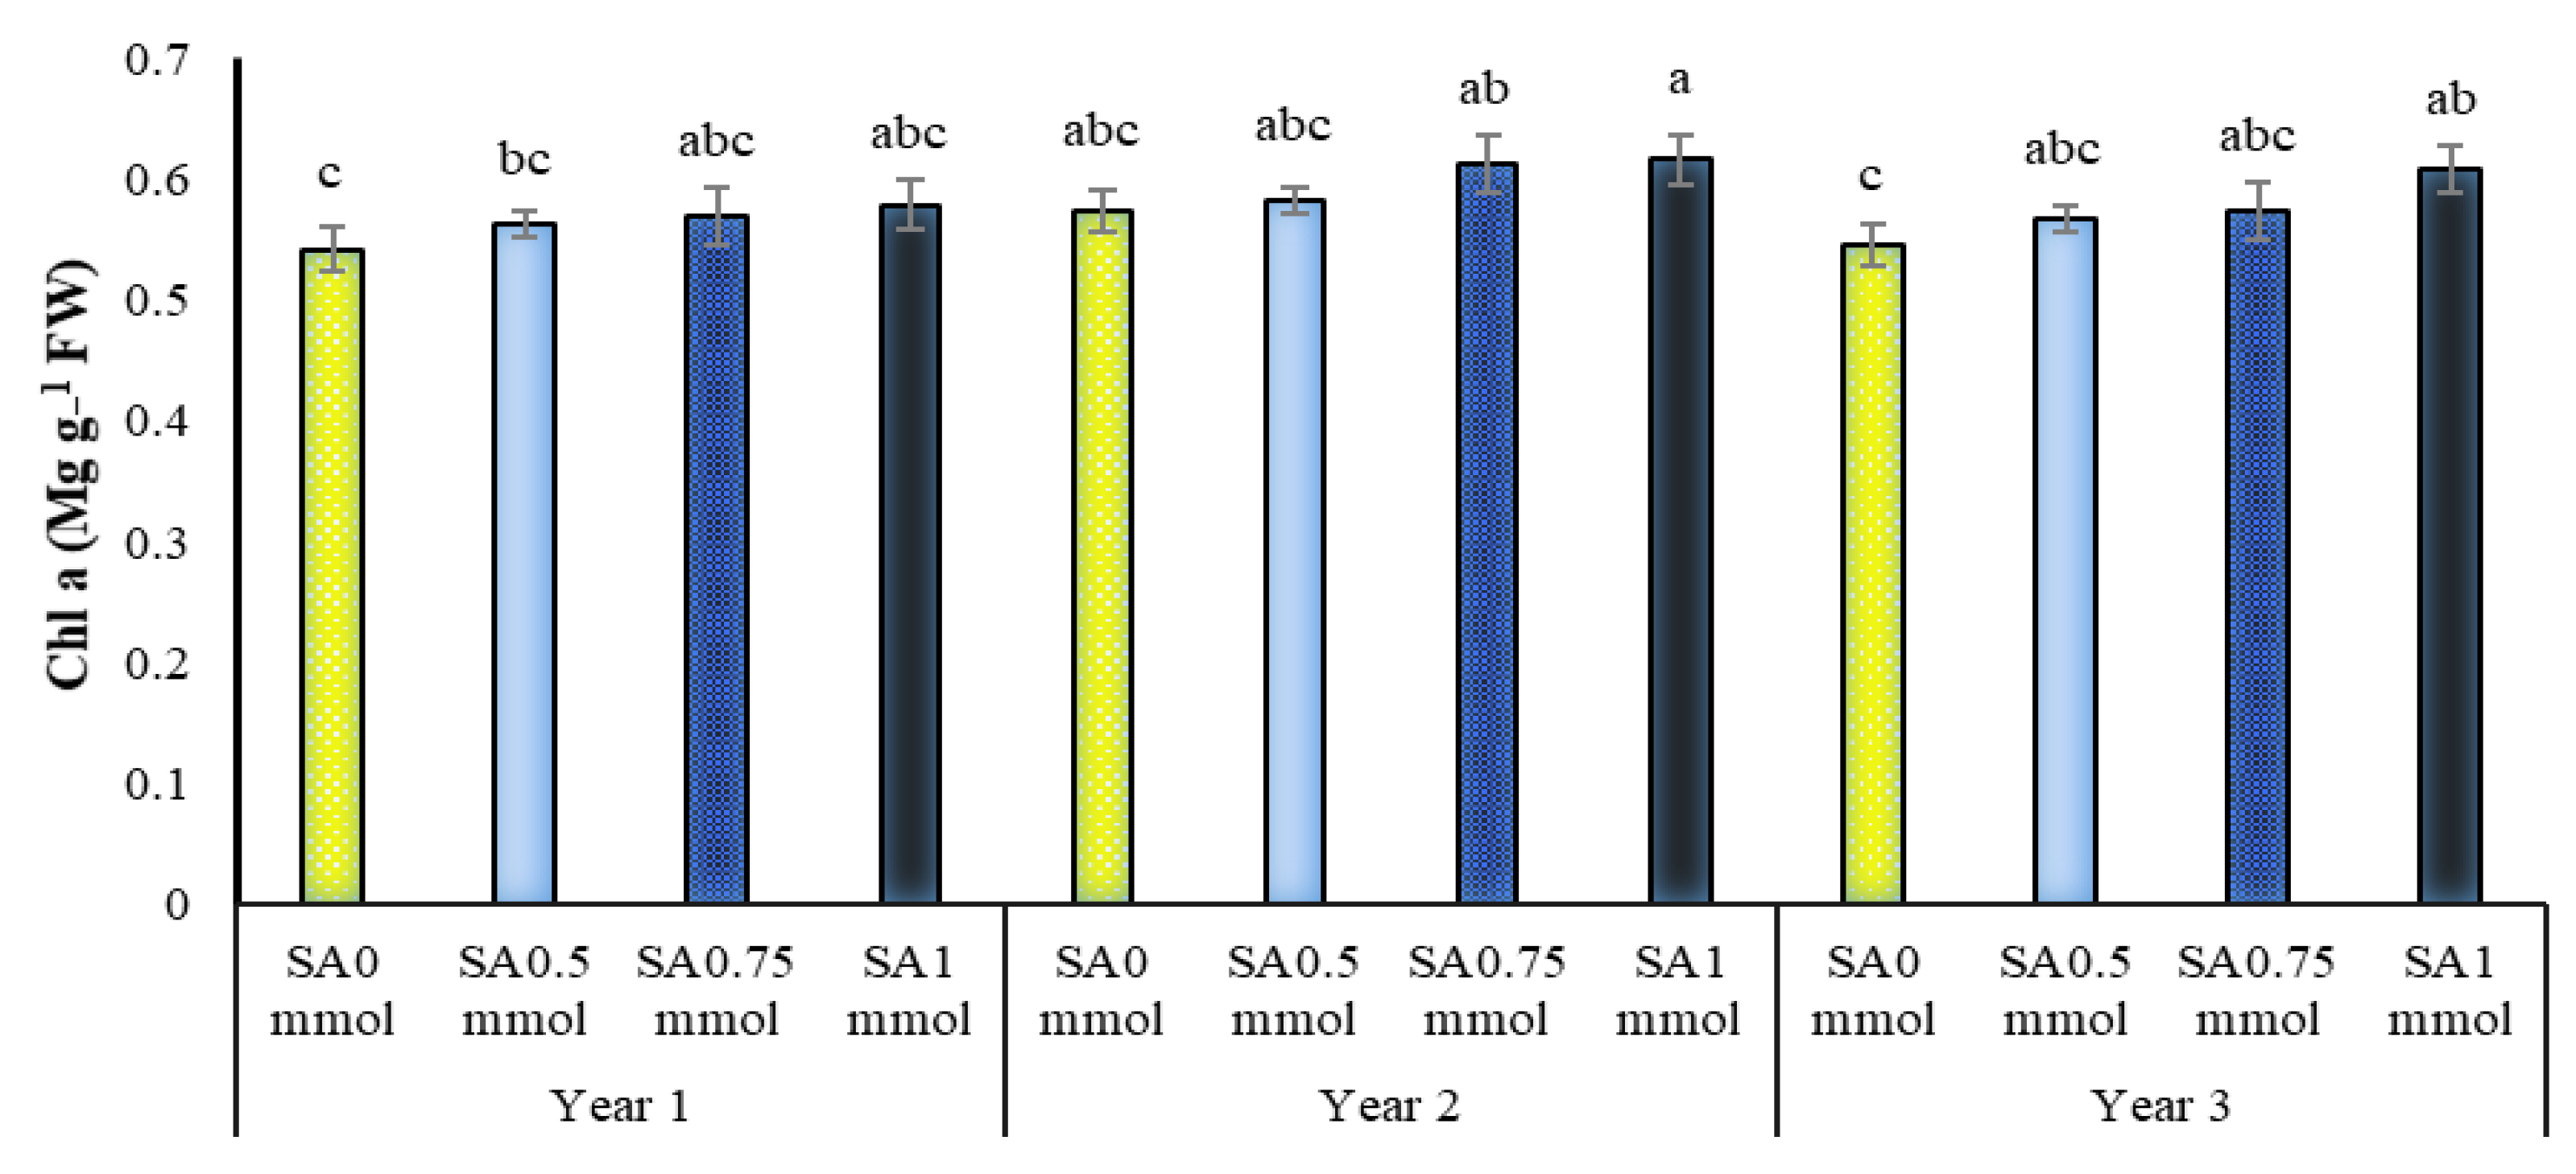
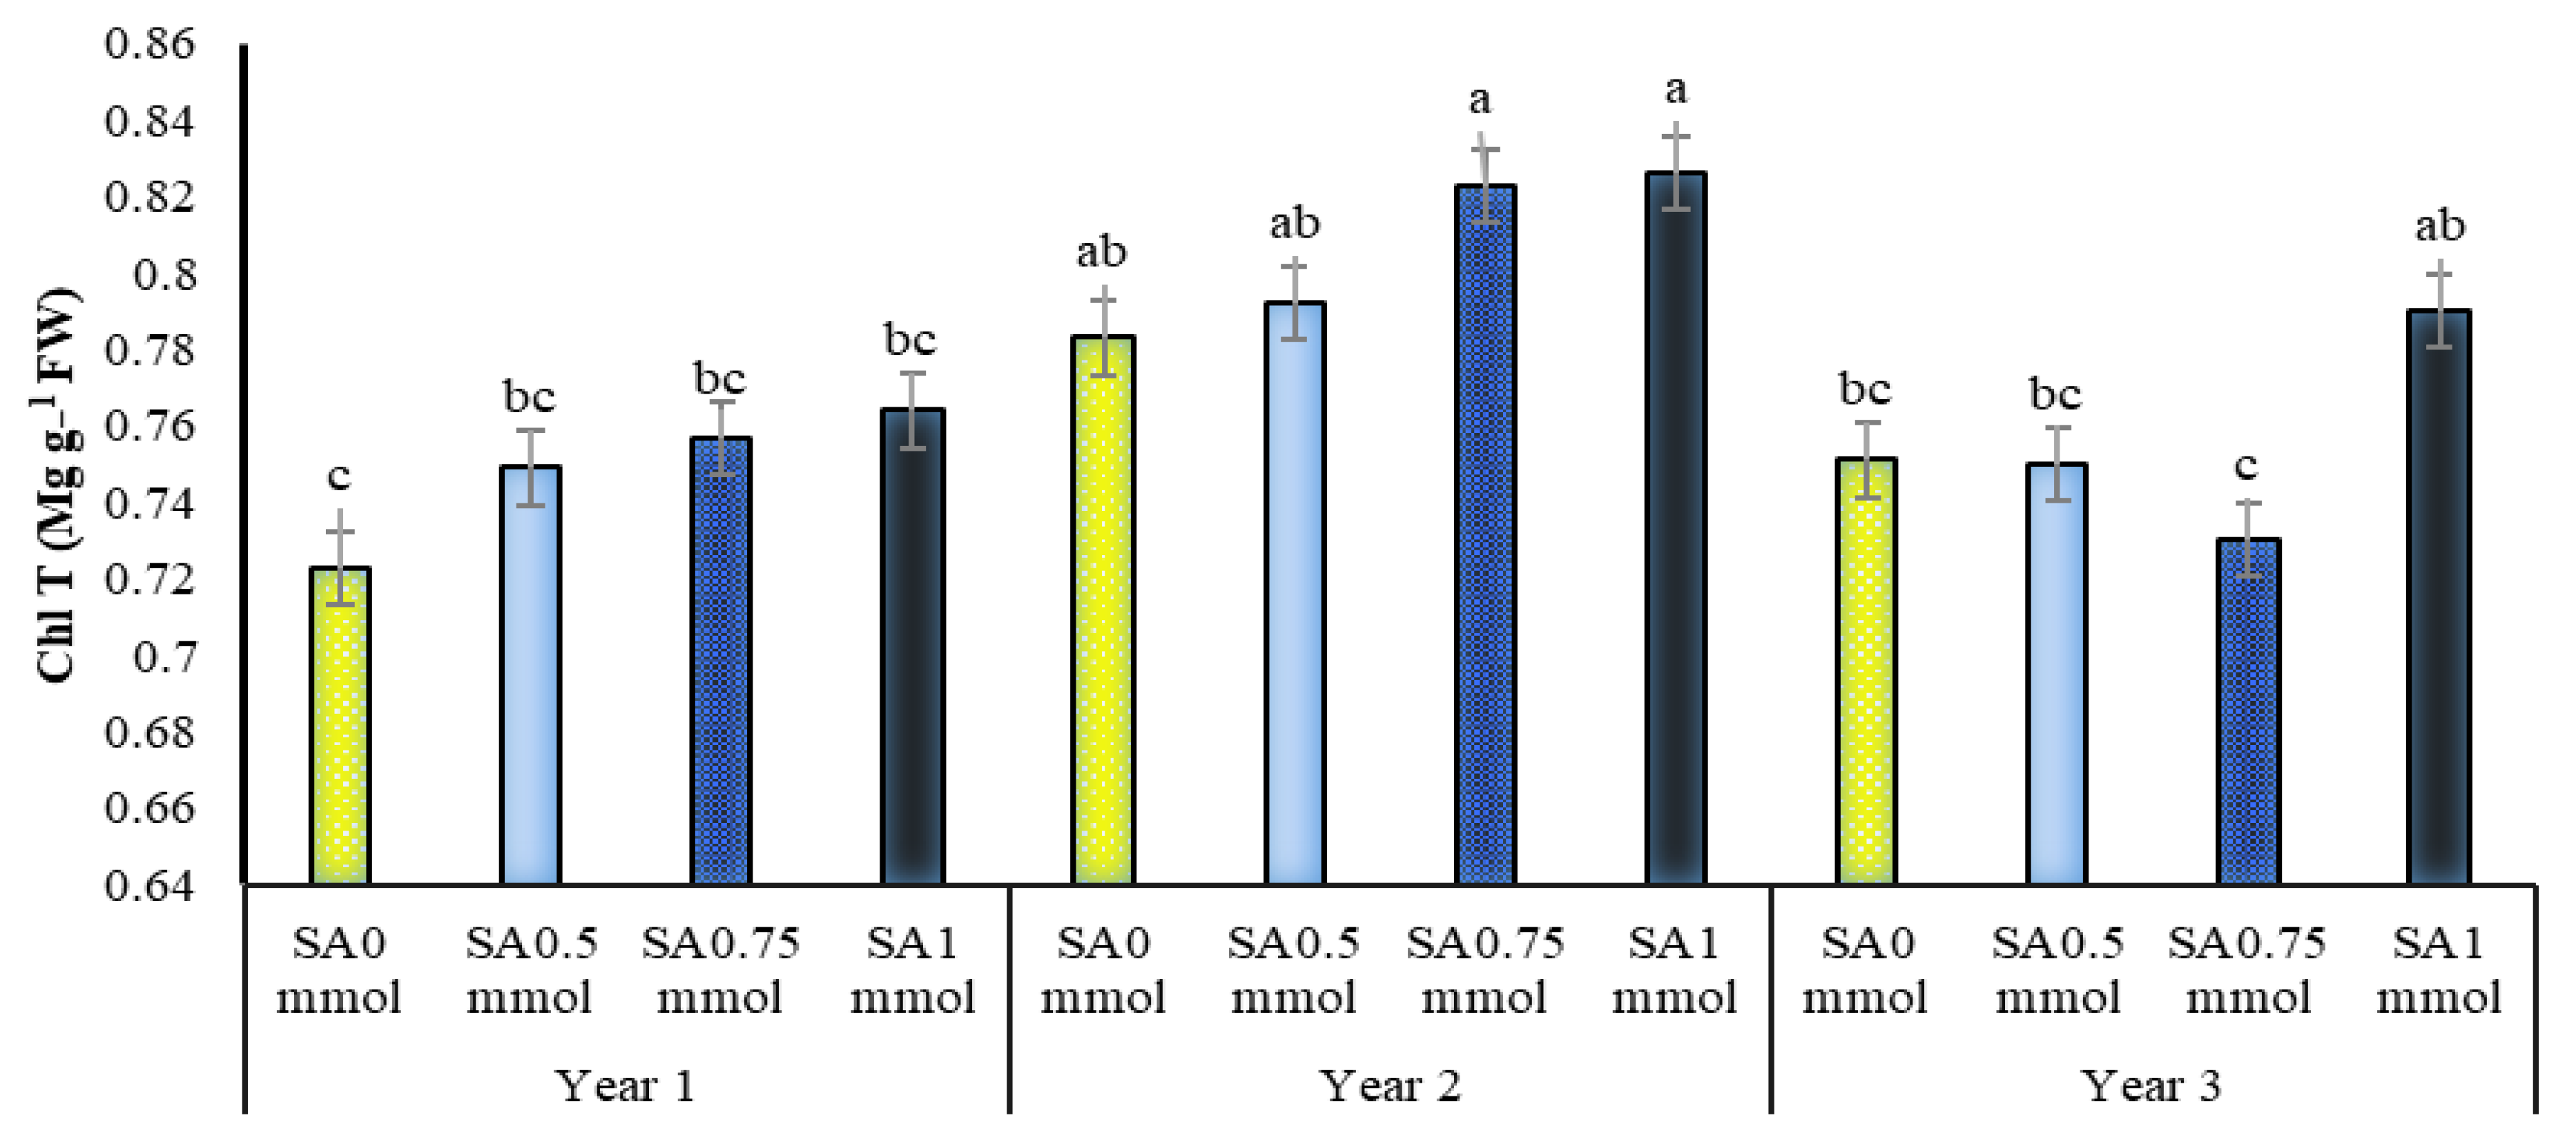
2.5. Chlorophylls a, b and Total Content
2.6. Carotenoid Content
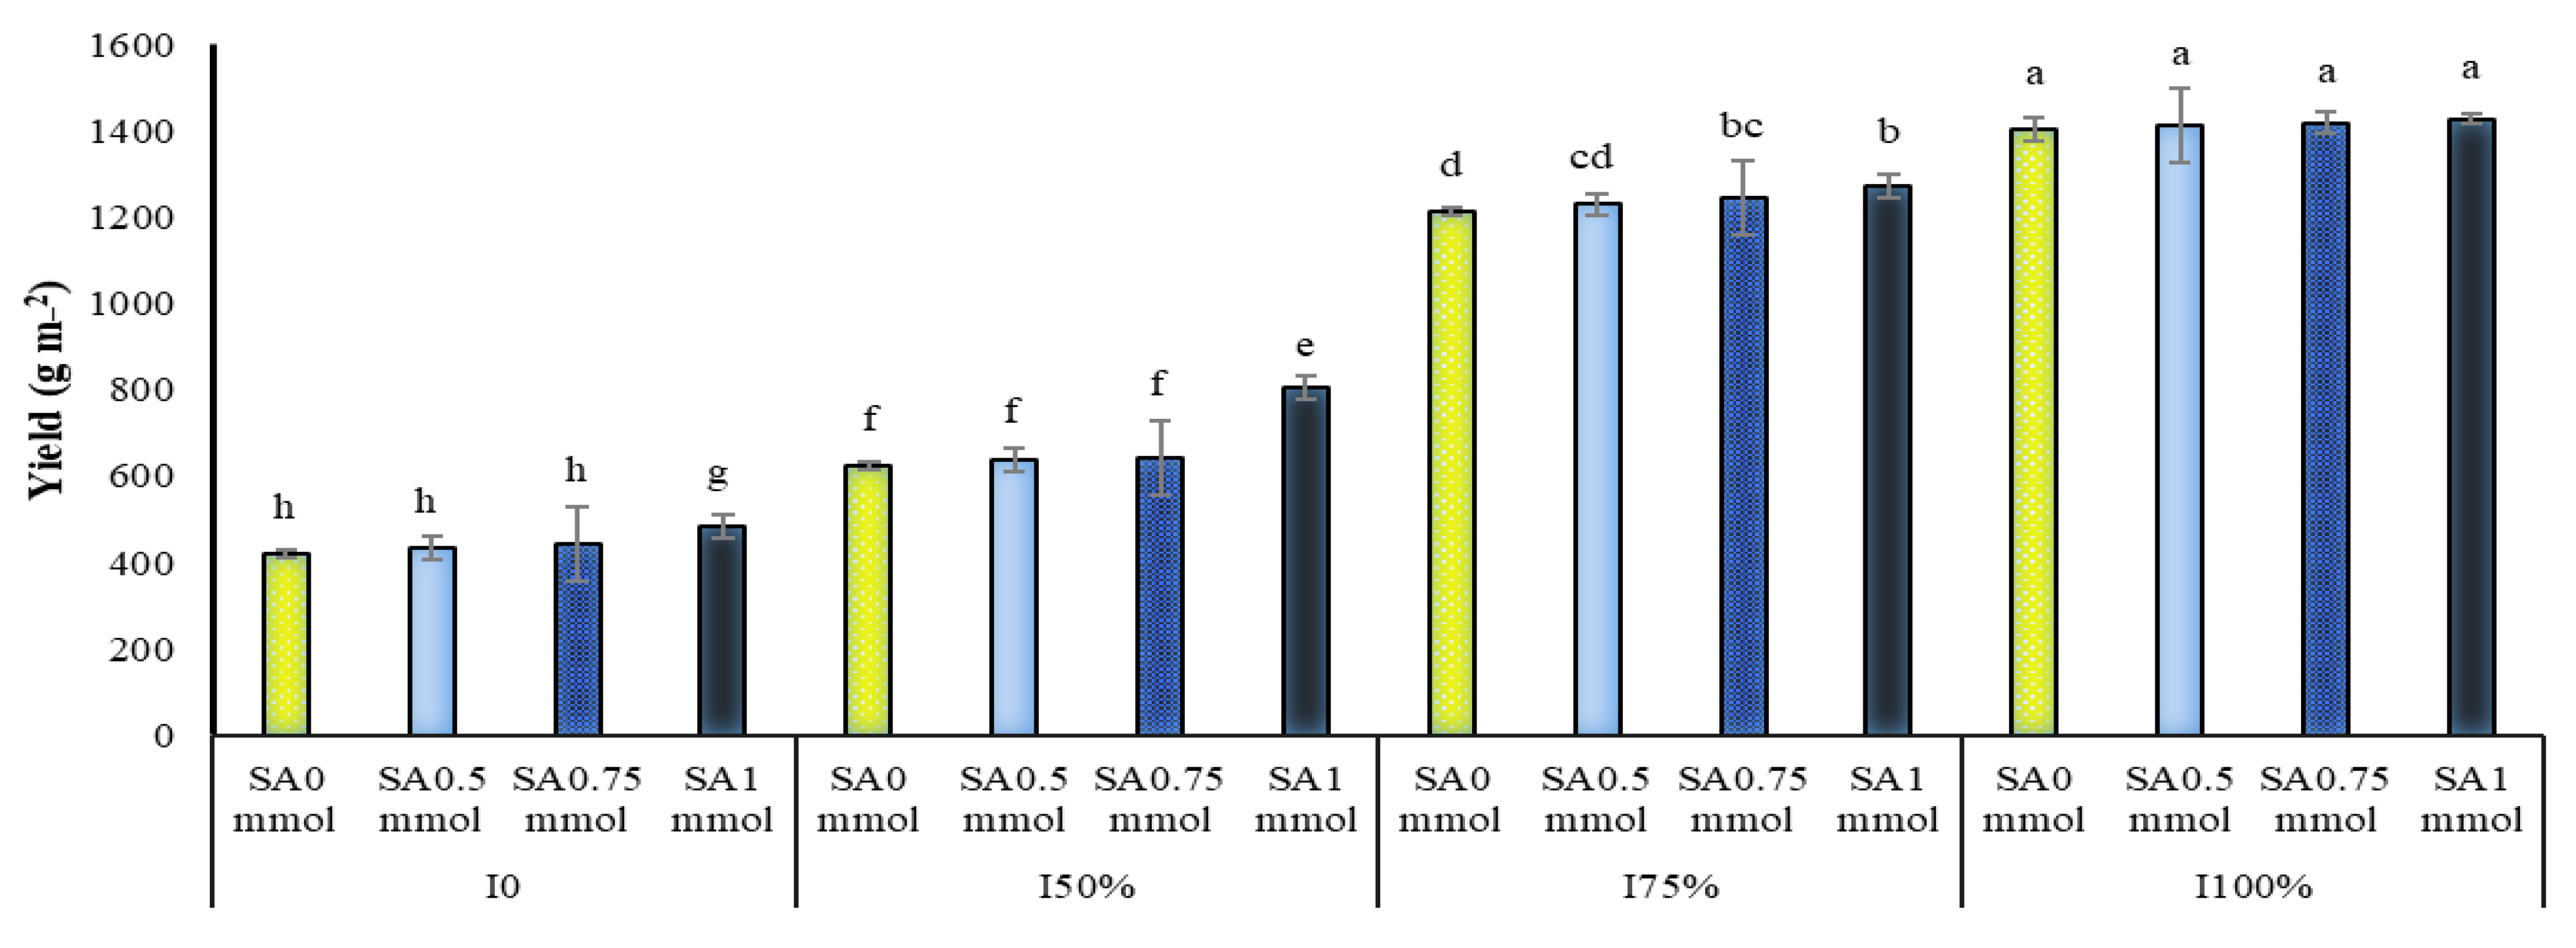
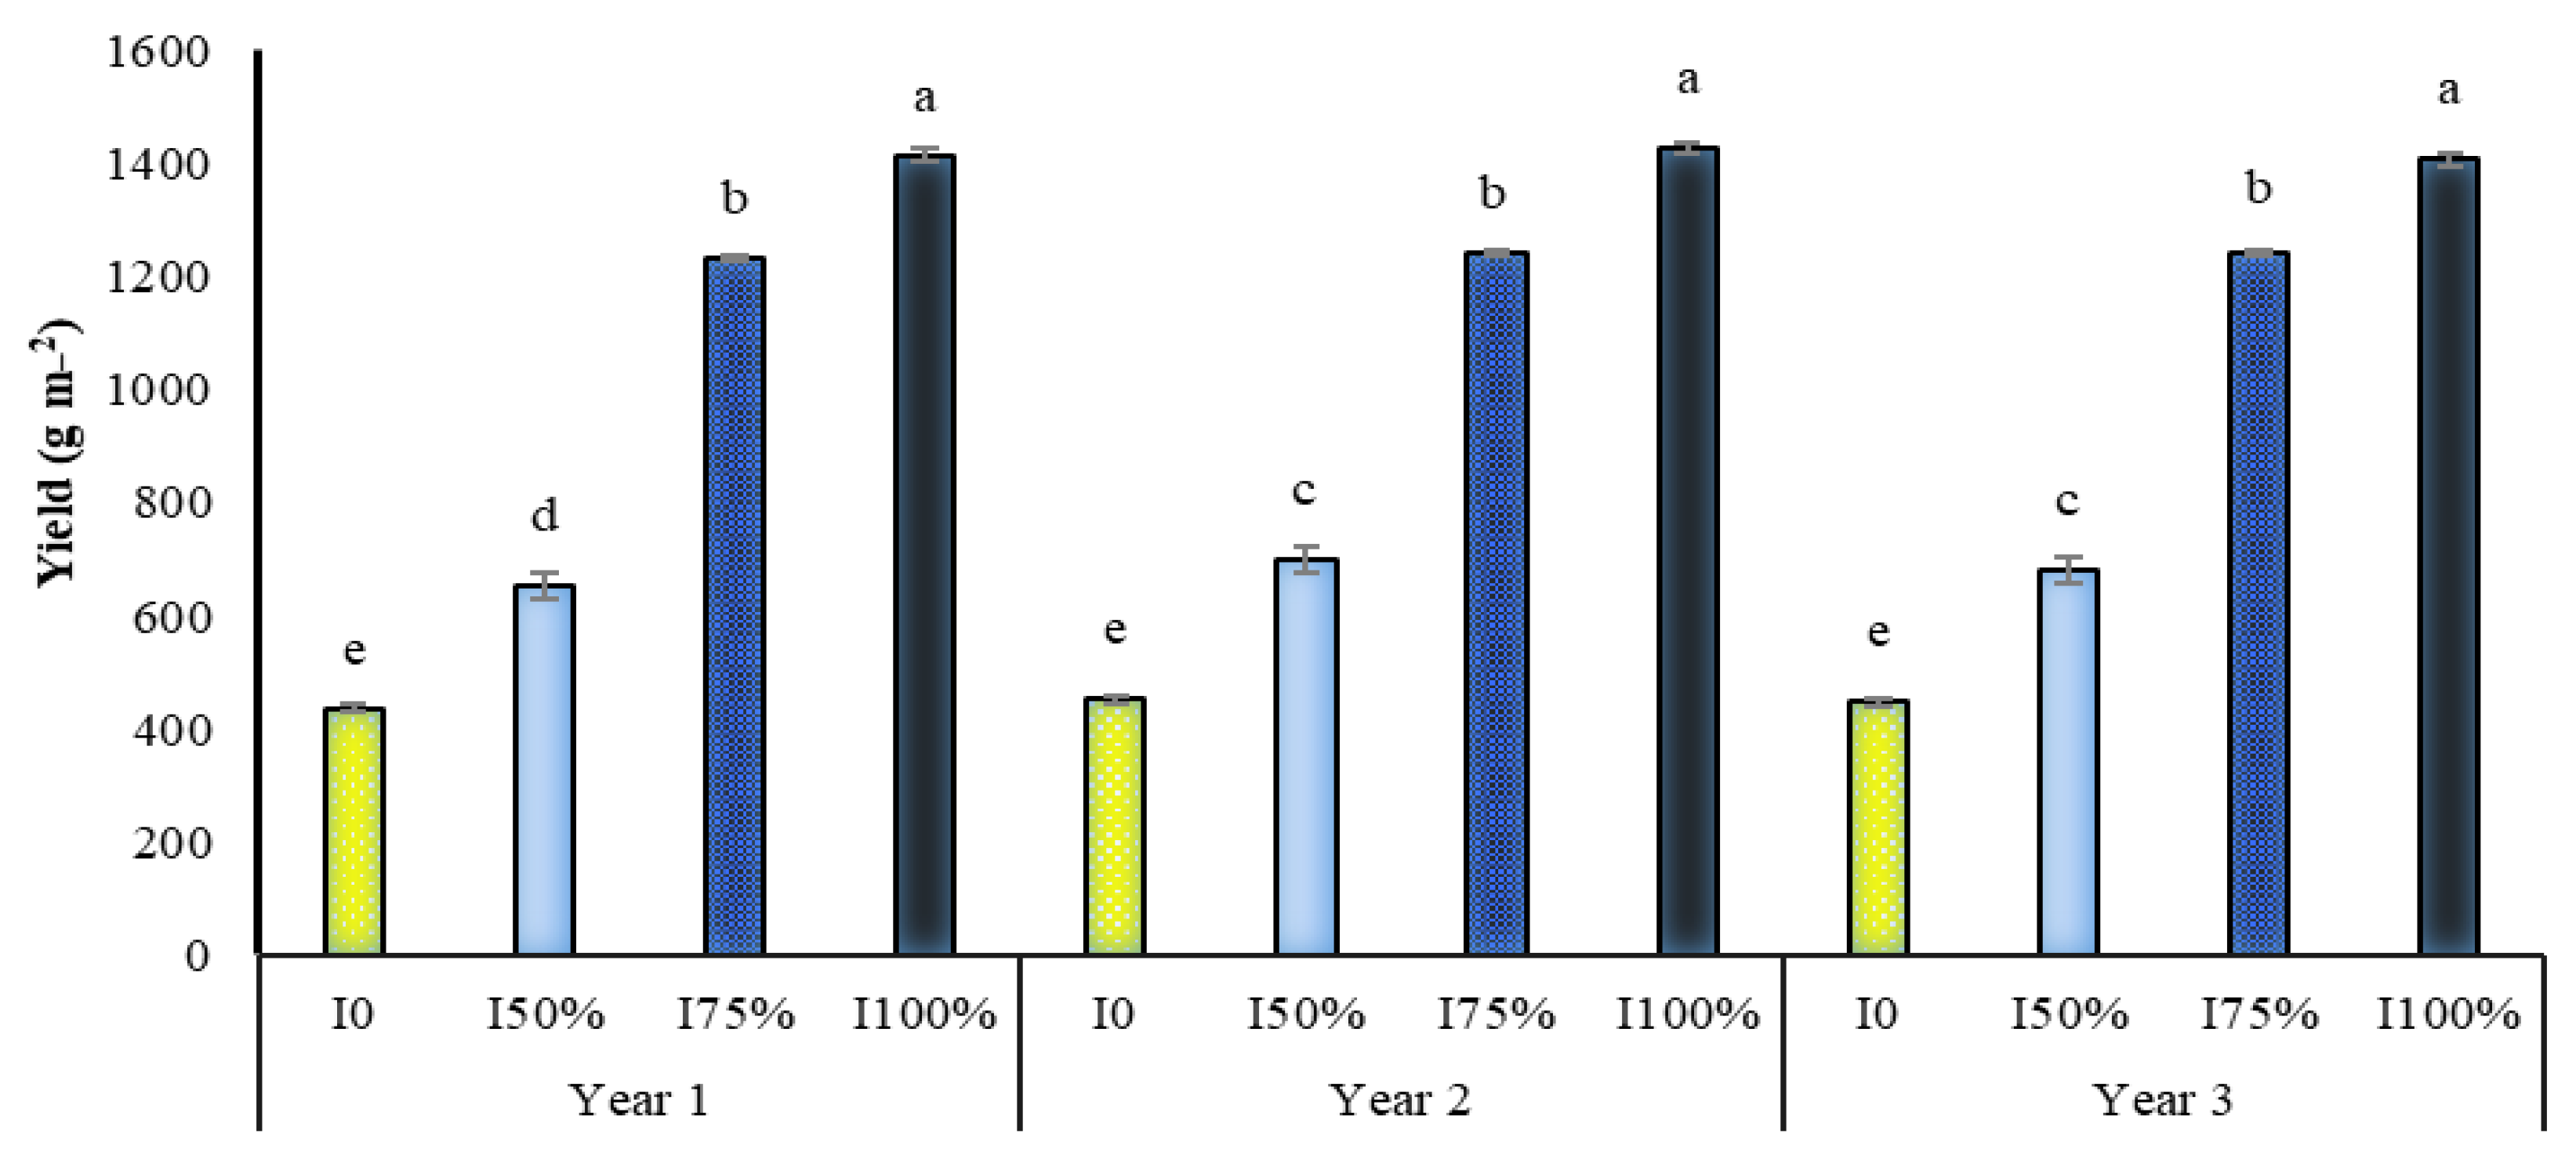
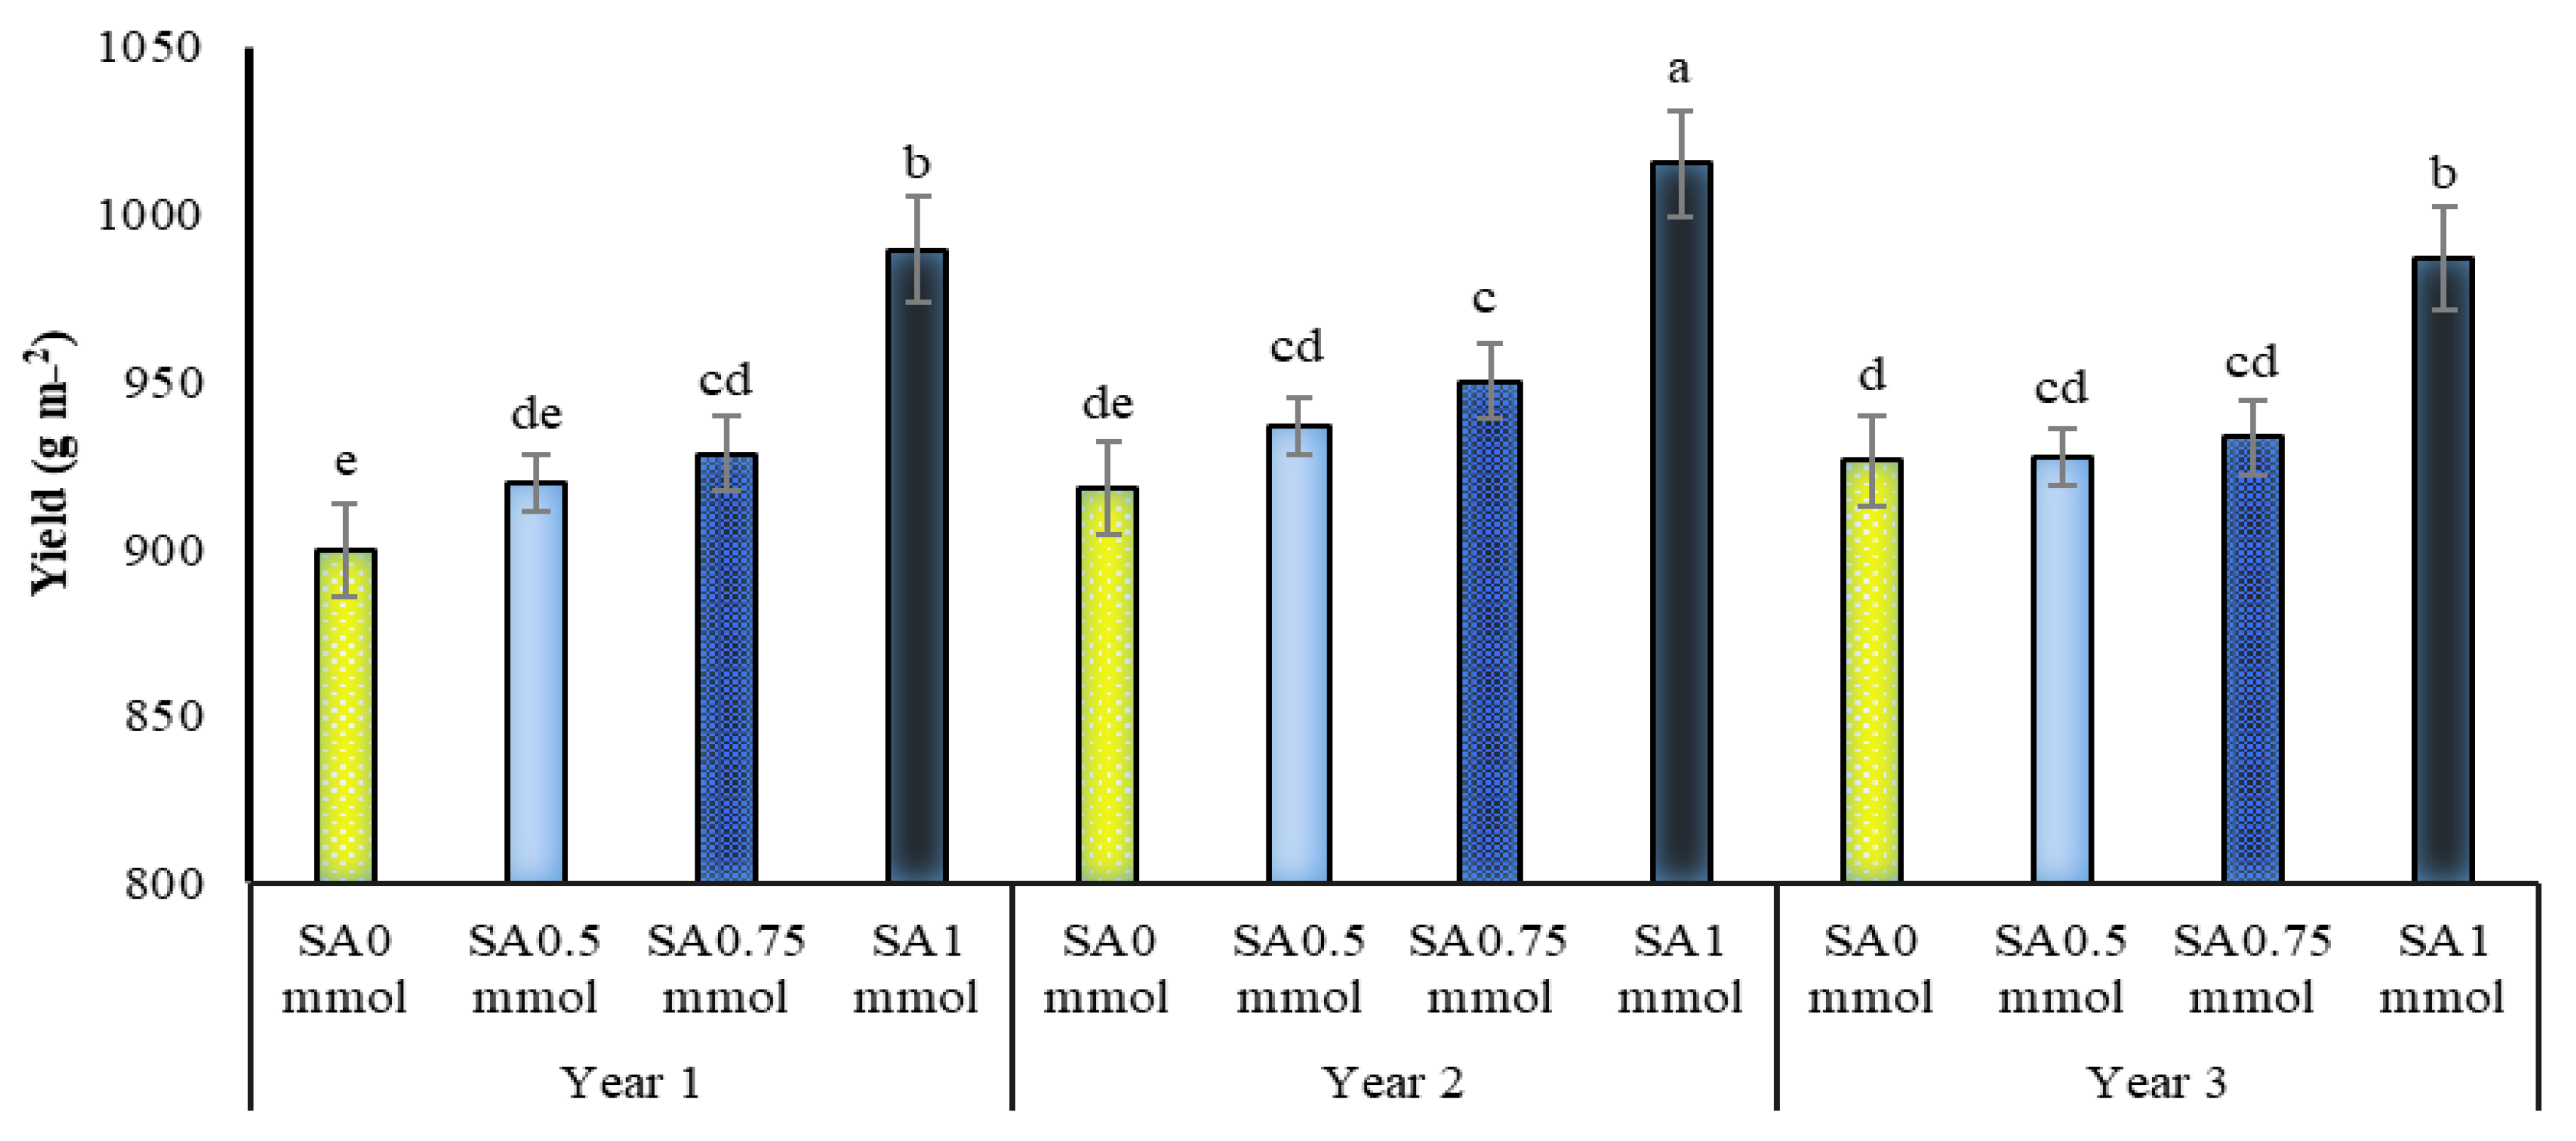
2.7. Yield
2.8. Allicin
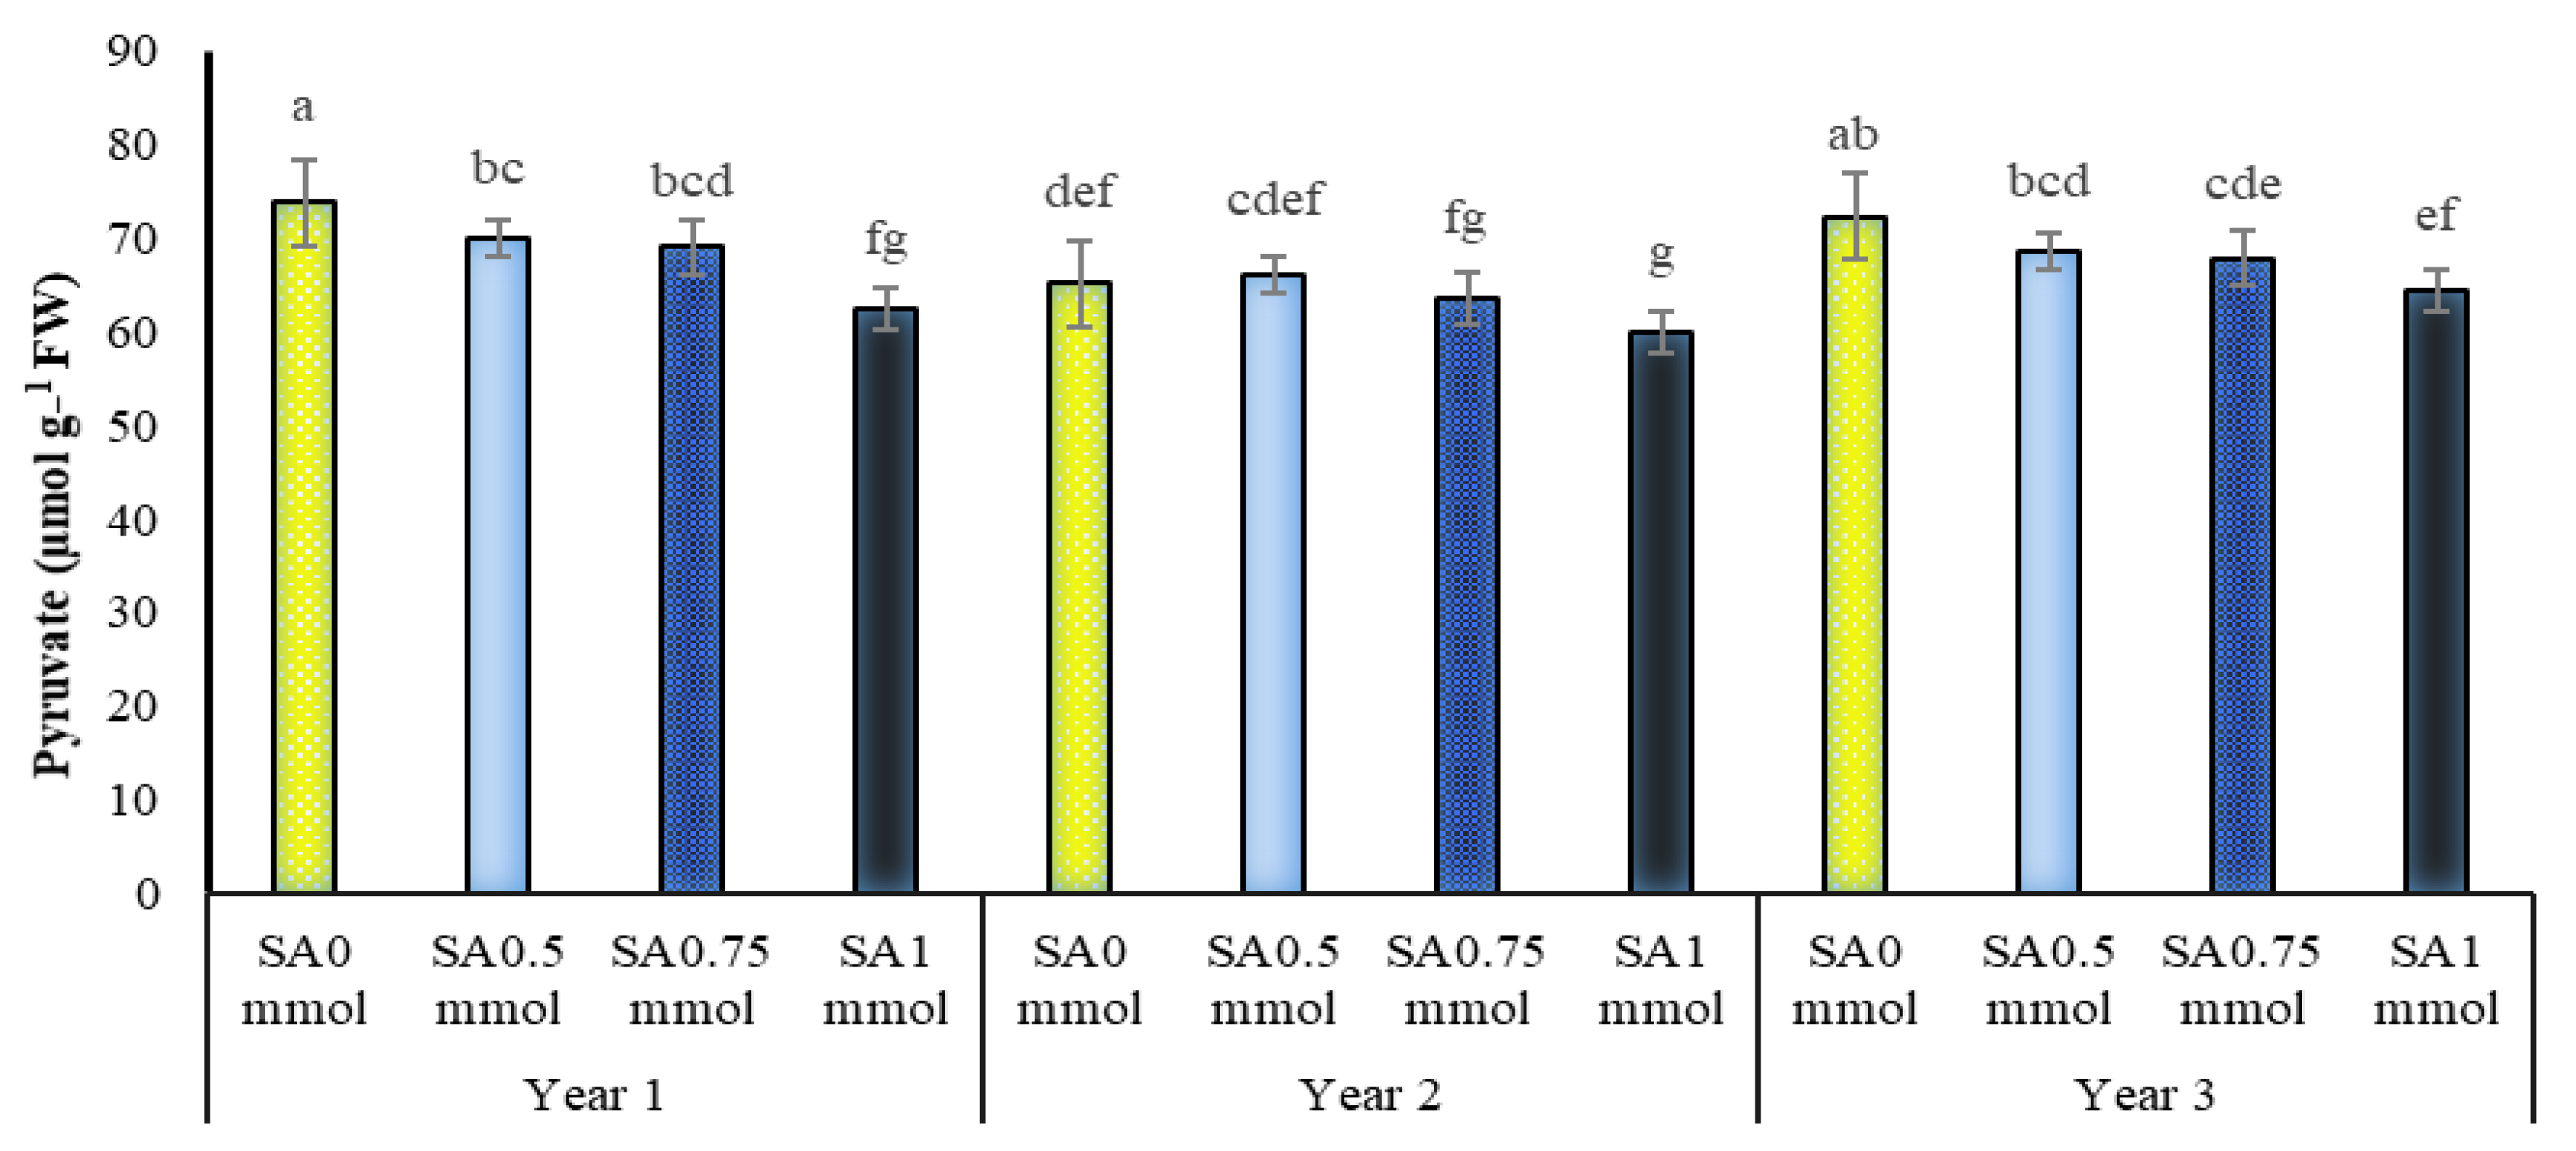
2.9. Pyruvate
3. Discussion
4. Materials and Methods
4.1. Experimental Arrangement
4.2. Irrigation and Treatment
4.3. Relative Water Content (RWC)
4.4. Cell Membrane Stability Index (MSI)
4.5. Proline Content
4.6. Antioxidant Enzyme Activity
4.7. Chlorophyll Content
4.8. Yield
4.9. Level of Allicin and Pyruvate
4.10. Statistical Analysis
5. Conclusions
Author Contributions
Funding
Institutional Review Board Statement
Informed Consent Statement
Data Availability Statement
Conflicts of Interest
Sample Availability
References
- Zargoosh, Z.; Ghavam, M.; Bacchetta, G.; Tavili, A. Effects of ecological factors on the antioxidant potential and total phenol content of Scrophularia striata Boiss. Sci. Rep. 2019, 9, 16021. [Google Scholar] [CrossRef] [Green Version]
- Mastinu, A.; Bonini, S.A.; Premoli, M.; Maccarinelli, G.; Mac Sweeney, E.; Zhang, L.L.; Lucini, L.; Memo, M. Protective effects of Gynostemma pentaphyllum (var. Ginpent) against lipopolysaccharide-induced inflammation and motor alteration in Mice. Molecules 2021, 26, 570. [Google Scholar] [CrossRef]
- Mukhopadhyay, M.J.; Sengupta, P.; Mukhopadhyay, S.; Sen, S. In vitro stable regeneration of onion and garlic from suspension culture and chromosomal instability in solid callus culture. Sci. Hortic. 2005, 104, 1–9. [Google Scholar] [CrossRef]
- Kakolvand, E.; Azizi, K.; Esmaili, A.; Adeli, M. Effects of biological fertilizers and sulfur on the quantitative and qualitative traits of cultivated shallot (Allium altissimum Regal) and comparison of these traits with those ones in the natural habitat. Not. Bot. Horti Agrobot. Cluj-Napoca 2020, 48, 2215–2227. [Google Scholar] [CrossRef]
- Moradi, P.; Aghajanloo, F.; Moosavi, A.; Monfared, H.H.; Khalafi, J.; Taghiloo, M.; Khoshzaman, T.; Shojaee, M.; Mastinu, A. Anthropic Effects on the Biodiversity of the Habitats of Ferula gummosa. Sustainability 2021, 13, 7874. [Google Scholar] [CrossRef]
- Sebnie, W.; Mengesha, M.; Girmay, G.; Feyisa, T. Response of garlic (Allium sativum L.) to nitrogen and phosphorus under irrigation in Lasta district of Amhara Region, Ethiopia. Cogent Food Agric. 2018, 4, 1532862. [Google Scholar] [CrossRef]
- Alghabari, F.; Ihsan, M.Z. Effects of drought stress on growth, grain filling duration, yield and quality attributes of barley (Hordeum vulgare L.). Bangl. J. Bot. 2018, 47, 421–428. [Google Scholar] [CrossRef]
- Lum, M.S.; Hanafi, M.M.; Rafii, Y.M.; Akmar, A.S.N. Effect of drought stress on growth, proline and antioxidant enzyme activities of upland rice. J. Anim Plant Sci. 2014, 24, 1487–1493. [Google Scholar]
- Yousefi, A.R.; Rashidi, S.; Moradi, P.; Mastinu, A. Germination and Seedling Growth Responses of Zygophyllum fabago, Salsola kali L. and Atriplex canescens to PEG-Induced Drought Stress. Environments 2020, 7, 107. [Google Scholar] [CrossRef]
- Ashrafi, M.; Azimi-Moqadam, M.-R.; MohseniFard, E.; Shekari, F.; Jafary, H.; Moradi, P.; Pucci, M.; Abate, G.; Mastinu, A. Physiological and Molecular Aspects of Two Thymus Species Differently Sensitive to Drought Stress. BioTech 2022, 11, 8. [Google Scholar] [CrossRef]
- Biareh, V.; Shekari, F.; Sayfzadeh, S.; Zakerin, H.; Hadidi, E.; Beltrao, J.G.T.; Mastinu, A. Physiological and qualitative response of Cucurbita pepo L. to salicylic acid under controlled water stress conditions. Horticulturae 2022, 8, 79. [Google Scholar] [CrossRef]
- Mahdavi, A.; Moradi, P.; Mastinu, A. Variation in Terpene Profiles of Thymus vulgaris in Water Deficit Stress Response. Molecules 2020, 25, 1091. [Google Scholar] [CrossRef] [Green Version]
- Khaleghnezhad, V.; Yousefi, A.R.; Tavakoli, A.; Farajmand, B.; Mastinu, A. Concentrations-dependent effect of exogenous abscisic acid on photosynthesis, growth and phenolic content of Dracocephalum moldavica L. under drought stress. Planta 2021, 253, 127. [Google Scholar] [CrossRef]
- Hosseinzadeh, S.R.; Amiri, H.; Ismaili, A. Evaluation of photosynthesis, physiological, and biochemical responses of chickpea (Cicer arietinum L. cv. Pirouz) under water deficit stress and use of vermicompost fertilizer. J. Integr. Agric. 2018, 17, 2426–2437. [Google Scholar] [CrossRef] [Green Version]
- Koo, Y.M.; Heo, A.Y.; Choi, H.W. Salicylic Acid as a Safe Plant Protector and Growth Regulator. Plant. Pathol. J. 2020, 36, 1–10. [Google Scholar] [CrossRef]
- Hashempour, A.; Ghasemnezhad, M.; Ghazvini, R.F.; Sohani, M.M. The physiological and biochemical responses to freezing stress of olive plants treated with salicylic acid. Russ. J. Plant Physl. 2014, 61, 443–450. [Google Scholar] [CrossRef]
- Qayyum, A.; Al Ayoubi, S.; Sher, A.; Bibi, Y.; Ahmad, S.; Shen, Z.; Jenks, M.A. Improvement in drought tolerance in bread wheat is related to an improvement in osmolyte production, antioxidant enzyme activities, and gaseous exchange. Saudi J. Biol. Sci. 2021, 28, 5238–5249. [Google Scholar] [CrossRef]
- Sabouri, H.; Kazerani, B.; Fallahi, H.A.; Dehghan, M.A.; Alegh, S.M.; Dadras, A.R.; Katouzi, M.; Mastinu, A. Association analysis of yellow rust, fusarium head blight, tan spot, powdery mildew, and brown rust horizontal resistance genes in wheat. Physiol. Mol. Plant Pathol. 2022, 118, 101808. [Google Scholar] [CrossRef]
- Ullah, F.; Bano, A.; Nosheen, A. Effects of Plant Growth Regulators on Growth and Oil Quality of Canola (Brassica napus L.) under Drought Stress. Pak. J. Bot. 2012, 44, 1873–1880. [Google Scholar]
- Agarwal, S.; Sairam, R.K.; Srivastava, G.C.; Meena, R.C. Changes in antioxidant enzymes activity and oxidative stress by abscisic acid and salicylic acid in wheat genotypes. Biol. Plant. 2005, 49, 541–550. [Google Scholar] [CrossRef]
- Antonić, D.; Milošević, S.; Cingel, A.; Lojić, M.; Trifunović-Momčilov, M.; Petrić, M.; Subotić, A.; Simonović, A. Effects of exogenous salicylic acid on Impatiens walleriana L. grown in vitro under polyethylene glycol-imposed drought. S. Afr. J. Bot. 2016, 105, 226–233. [Google Scholar] [CrossRef]
- Alam, M.N.; Bristi, N.J.; Rafiquzzaman, M. Review on in vivo and in vitro methods evaluation of antioxidant activity. Saudi Pharm. J. 2013, 21, 143–152. [Google Scholar] [CrossRef] [Green Version]
- Naservafaei, S.; Sohrabi, Y.; Moradi, P.; Mac Sweeney, E.; Mastinu, A. Biological response of Lallemantia iberica to brassinolide treatment under different watering conditions. Plants 2021, 10, 496. [Google Scholar] [CrossRef]
- Kumar, A.; Memo, M.; Mastinu, A. Plant behaviour: An evolutionary response to the environment? Plant Biol. 2020, 22, 961–970. [Google Scholar] [CrossRef]
- Nemeth, M.; Janda, T.; Horvath, E.; Paldi, E.; Szalai, G. Exogenous salicylic acid increases polyamine content but may decrease drought tolerance in maize. Plant Sci. 2002, 162, 569–574. [Google Scholar] [CrossRef]
- Liang, X.W.; Zhang, L.; Natarajan, S.K.; Becker, D.F. Proline Mechanisms of Stress Survival. Antioxid Redox Sign. 2013, 19, 998–1011. [Google Scholar] [CrossRef] [Green Version]
- Sakata, Y.; Komatsu, K.; Takezawa, D. ABA as a Universal Plant Hormone. Prog. Bot. 2014, 75, 57–96. [Google Scholar] [CrossRef]
- La, V.H.; Lee, B.R.; Islam, M.T.; Park, S.H.; Jung, H.I.; Bae, D.W.; Kim, T.H. Characterization of salicylic acid-mediated modulation of the drought stress responses: Reactive oxygen species, proline, and redox state in Brassica napus. Environ. Exp. Bot. 2019, 157, 1–10. [Google Scholar] [CrossRef]
- Karimmojeni, H.; Rezaei, M.; Tseng, T.-M.; Mastinu, A. Effects of Metribuzin Herbicide on Some Morpho-Physiological Characteristics of Two Echinacea Species. Horticulturae 2022, 8, 169. [Google Scholar] [CrossRef]
- Mohammadi, H.; Amirikia, F.; Ghorbanpour, M.; Fatehi, F.; Hashempour, H. Salicylic acid induced changes in physiological traits and essential oil constituents in different ecotypes of Thymus kotschyanus and Thymus vulgaris under well-watered and water stress conditions. Ind. Crop. Prod. 2019, 129, 561–574. [Google Scholar] [CrossRef]
- Fayez, K.A.; Bazaid, S.A. Improving drought and salinity tolerance in barley by application of salicylic acid and potassium nitrate. J. Saudi Soc. Agric. Sci. 2014, 13, 45–55. [Google Scholar] [CrossRef] [Green Version]
- Abbas, S.M.; Ahmad, R.; Waraich, E.A.; Qasim, M. Exogenous Application of Salicylic Acid at Different Plant Growth Stages Improves Physiological Processes in Marigold (Tagetes erecta L.). Pak. J. Agric. Sci. 2019, 56, 541–548. [Google Scholar] [CrossRef]
- Mahfouz, S.A.; Sharaf-Eldin, M.A. Effect of mineral vs. biofertilizer on growth, yield, and essential oil content of fennel (Foeniculum vulgare Mill.). Int. Agrophys. 2007, 21, 361–366. [Google Scholar]
- Gharibvandi, A.; Karimmojeni, H.; Ehsanzadeh, P.; Rahimmalek, M.; Mastinu, A. Weed management by allelopathic activity of Foeniculum vulgare essential oil. Plant Biosyst. 2022, 1–9. [Google Scholar] [CrossRef]
- McKersie, B.D.; Murnaghan, J.; Jones, K.S.; Bowley, S.R. Iron-superoxide dismutase expression in transgenic alfalfa increases winter survival without a detectable increase in photosynthetic oxidative stress tolerance. Plant Physiol. 2000, 122, 1427–1437. [Google Scholar] [CrossRef] [Green Version]
- Bayati, P.; Karimmojeni, H.; Razmjoo, J.; Pucci, M.; Abate, G.; Baldwin, T.C.; Mastinu, A. Physiological, biochemical, and Agronomic Trait Responses of Nigella sativa Genotypes to Water Stress. Horticulturae 2022, 8, 193. [Google Scholar] [CrossRef]
- Mittler, R. Oxidative stress, antioxidants and stress tolerance. Trends Plant Sci. 2002, 7, 405–410. [Google Scholar] [CrossRef]
- Fahad, S.; Bajwa, A.A.; Nazir, U.; Anjum, S.A.; Farooq, A.; Zohaib, A.; Sadia, S.; Nasim, W.; Adkins, S.; Saud, S.; et al. Crop Production under Drought and Heat Stress: Plant Responses and Management Options. Front. Plant Sci. 2017, 8, 1147. [Google Scholar] [CrossRef] [Green Version]
- Wang, Y.Y.; Wang, Y.; Li, G.Z.; Hao, L. Salicylic acid-altering Arabidopsis plant response to cadmium exposure: Underlying mechanisms affecting antioxidation and photosynthesis-related processes. Ecotoxicol. Environ. Saf. 2019, 169, 645–653. [Google Scholar] [CrossRef]
- Sankari, M.; Hridya, H.; Sneha, P.; Doss, C.G.P.; Ramamoorthy, S. Effect of UV radiation and its implications on carotenoid pathway in Bixa orellana L. J. Photoch. Photobio. B 2017, 176, 136–144. [Google Scholar] [CrossRef]
- Kolupaev Iu, E.; Iastreb, T.O.; Shvidenko, N.V.; Karpets Iu, V. Induction of heat resistance in wheat coleoptiles by salicylic and succinic acids: Connection of the effect with the generation and neutralization of active oxygen forms. Prikl. Biokhimiia Mikrobiol. 2012, 48, 550–556. [Google Scholar] [CrossRef]
- Dong, C.-J.; Li, L.; Shang, Q.-M.; Liu, X.-Y.; Zhang, Z.-G. Endogenous salicylic acid accumulation is required for chilling tolerance in cucumber (Cucumis sativus L.) seedlings. Planta 2014, 240, 687–700. [Google Scholar] [CrossRef]
- Safari, M.; Mousavi-Fard, S.; Rezaei Nejad, A.; Sorkheh, K.; Sofo, A. Exogenous salicylic acid positively affects morpho-physiological and molecular responses of Impatiens walleriana plants grown under drought stress. Int. J. Environ. Sci. Technol. 2021, 19, 969–984. [Google Scholar] [CrossRef]
- Ashraf, M.; Shabaz, M.; Mahmood, S.; Rasul, E. Relationships between growth and photosynthetic characteristics in pearl millet (Pennisetum glaucum) under limited water deficit conditions with enhanced nitrogen supplies. Belg. J. Bot. 2001, 134, 131–144. [Google Scholar]
- Hassan, F.A.S.; Ali, E.F. Protective effects of 1-methylcyclopropene and salicylic acid on senescence regulation of gladiolus cut spikes. Sci. Hortic. 2014, 179, 146–152. [Google Scholar] [CrossRef]
- Batista, V.C.V.; Pereira, I.M.C.; de Oliveira Paula-Marinho, S.; Canuto, K.M.; de Cássia Alves Pereira, R.; Rodrigues, T.H.S.; de Menezes Daloso, M.; Gomes-Filho, E.; de Carvalho, H.H. Salicylic acid modulates primary and volatile metabolites to alleviate salt stress-induced photosynthesis impairment on medicinal plant Egletes viscosa. Environ. Exp. Bot. 2019, 167, 103870. [Google Scholar] [CrossRef]
- Brito, C.; Dinis, L.T.; Ferreira, H.; Coutinho, J.; Moutinho-Pereira, J.; Correia, C.M. Salicylic acid increases drought adaptability of young olive trees by changes on redox status and ionome. Plant Physiol. Biochem. 2019, 141, 315–324. [Google Scholar] [CrossRef]
- Koobaz, P.; Reza Ghaffari, M.; Heidari, M.; Mirzaei, M.; Ghanati, F.; Amirkhani, A.; Mortazavi, S.E.; Moradi, F.; Hajirezaei, M.R.; Salekdeh, G.H. Proteomic and metabolomic analysis of desiccation tolerance in wheat young seedlings. Plant Physiol. Biochem. 2020, 146, 349–362. [Google Scholar] [CrossRef]
- Costa, M.L.; Civello, P.M.; Chaves, A.R.; Martinez, G.A. Effect of ethephon and 6-benzylaminopurine on chlorophyll degrading enzymes and a peroxidase-linked chlorophyll bleaching during post-harvest senescence of broccoli (Brassica oleracea L.) at 20 degrees C. Postharvest Biol. Technol. 2005, 35, 191–199. [Google Scholar] [CrossRef]
- Khalvandi, M.; Siosemardeh, A.; Roohi, E.; Keramati, S. Salicylic acid alleviated the effect of drought stress on photosynthetic characteristics and leaf protein pattern in winter wheat. Heliyon 2021, 7, e05908. [Google Scholar] [CrossRef]
- Belkhadi, A.; Hediji, H.; Abbes, Z.; Nouairi, I.; Barhoumi, Z.; Zarrouk, M.; Chaïbi, W.; Djebali, W. Effects of exogenous salicylic acid pre-treatment on cadmium toxicity and leaf lipid content in Linum usitatissimum L. Ecotoxicol. Environ. Saf. 2010, 73, 1004–1011. [Google Scholar] [CrossRef]
- Singh, B.; Usha, K. Salicylic acid induced physiological and biochemical changes in wheat seedlings under water stress. Plant Growth Regul. 2003, 39, 137–141. [Google Scholar] [CrossRef]
- Tang, Y.P.; Sun, X.; Wen, T.; Liu, M.J.; Yang, M.Y.; Chen, X.F. Implications of terminal oxidase function in regulation of salicylic acid on soybean seedling photosynthetic performance under water stress. Plant Physiol. Biochem. 2017, 112, 19–28. [Google Scholar] [CrossRef]
- Doupis, G.; Bertaki, M.; Psarras, G.; Kasapakis, I.; Chartzoulakis, K. Water relations, physiological behavior and antioxidant defence mechanism of olive plants subjected to different irrigation regimes. Sci. Hortic. 2013, 153, 150–156. [Google Scholar] [CrossRef]
- Ahammed, G.J.; Li, X.; Liu, A.; Chen, S. Brassinosteroids in Plant Tolerance to Abiotic Stress. J. Plant. Growth Regul. 2020, 39, 1451–1464. [Google Scholar] [CrossRef]
- Hayat, S.; Hasan, S.A.; Fariduddin, Q.; Ahmad, A. Growth of tomato (Lycopersicon esculentum) in response to salicylic acid under water stress. J. Plant Interact. 2008, 3, 297–304. [Google Scholar] [CrossRef]
- Majeed, S.; Akram, M.; Latif, M.; Ijaz, M.; Hussain, M. Mitigation of drought stress by foliar application of salicylic acid and potassium in mungbean (Vigna radiata L.). Legum. Res. 2016, 39, 208–214. [Google Scholar] [CrossRef]
- Shakirova, F.M.; Sakhabutdinova, A.R.; Bezrukova, M.V.; Fatkhutdinova, R.A.; Fatkhutdinova, D.R. Changes in the hormonal status of wheat seedlings induced by salicylic acid and salinity. Plant Sci. 2003, 164, 317–322. [Google Scholar] [CrossRef]
- Shaki, F.; Maboud, H.E.; Niknam, V. Growth enhancement and salt tolerance of Safflower (Carthamus tinctorius L.), by salicylic acid. Curr. Plant Biol. 2018, 13, 16–22. [Google Scholar] [CrossRef]
- Osama, S.; El Sherei, M.; Al-Mahdy, D.A.; Bishr, M.; Salama, O. Effect of Salicylic acid foliar spraying on growth parameters, γ-pyrones, phenolic content and radical scavenging activity of drought stressed Ammi visnaga L. plant. Ind. Crop. Prod. 2019, 134, 1–10. [Google Scholar] [CrossRef]
- Ghahremani-majd, H.; Dashti, F.; Dastan, D.; Mumivand, H.; Hadian, J.; Esna-Ashari, M. Antioxidant and antimicrobial activities of Iranian mooseer (Allium hirtifolium Boiss) populations. Hortic. Environ. Biotechnol. 2012, 53, 116–122. [Google Scholar] [CrossRef]
- Behbahani, B.A.; Fooladi, A.A.I. Evaluation of phytochemical analysis and antimicrobial activities Allium essential oil against the growth of some microbial pathogens. Microb. Pathog. 2018, 114, 299–303. [Google Scholar] [CrossRef]
- Gupta, A.K.; Rather, M.A.; Jha, A.K.; Shashank, A.; Singhal, S.; Sharma, M.; Pathak, U.; Sharma, D.; Mastinu, A. Artocarpus lakoocha Roxb. and Artocarpus heterophyllus Lam. Flowers: New Sources of Bioactive Compounds. Plants 2020, 9, 1329. [Google Scholar] [CrossRef]
- Taha, R.S.; Alharby, H.F.; Bamagoos, A.A.; Medani, R.A.; Rady, M.M. Elevating tolerance of drought stress in Ocimum basilicum using pollen grains extract; a natural biostimulant by regulation of plant performance and antioxidant defense system. S. Afr. J. Bot. 2020, 128, 42–53. [Google Scholar] [CrossRef]
- Estrada, B.; Pomar, F.; Diaz, J.; Merino, F.; Bernal, M.A. Pungency level in fruits of the Padron pepper with different water supply. Sci. Hortic. 1999, 81, 385–396. [Google Scholar] [CrossRef]
- Alizadeh, A.; Kamali, G.H. Water Needs of Plants in Iran, 1st ed.; Astan Quds Razavi Publications: Mashhad, Iran, 2007; p. 228. [Google Scholar]
- Ritchie, S.W.; Nguyen, H.T. Leaf water content and gas exchange parameters of two wheat genotypes differing in drought resistance. J. Crop Sci. 1990, 30, 105–111. [Google Scholar] [CrossRef]
- Sairam, R.K.; Srivastava, G.C. Changes in antioxidant activity in sub-cellular fractions of tolerant and susceptible wheat genotypes in response to long term salt stress. Plant Sci. 2002, 162, 897–904. [Google Scholar] [CrossRef]
- Bates, L.S.; Waldren, R.P.; Teare, I.D. Rapid Determination of Free Proline for Water-Stress Studies. Plant Soil. 1973, 39, 205–207. [Google Scholar] [CrossRef]
- Giannopolitis, C.N.; Ries, S.K. Superoxide dismutases: I. occurrence in higher plants. Plant Physiol. 1977, 59, 309–314. [Google Scholar] [CrossRef]
- Nickel, R.S.; Cunningham, B.A. Improved peroxidase assay method using Ieuco 2,3,6- trichloroindophenol and application to comparative measurements of peroxidase catalysis. Ann. Biomed. Eng. 1969, 27, 292–299. [Google Scholar]
- Chance, B.; Maehly, A. Assay of catalase and peroxidase. Methods Enzymol. 1955, 2, 764–817. [Google Scholar]
- Lichtenthaler, H.K.; Buschmann, C. Chlorophylls and Carotenoids: Measurement and Characterization by UV-VIS Spectroscopy. Curr. Protoc. Food Anal. Chem. 2001, 1, F4.3.1–F4.3.8. [Google Scholar] [CrossRef]
- Schwimmer, S.; Weston, W.J. Onion flavor and odor, enzymatic development of pyruvic acid in onion as a measure of pungency. J. Sci. Food Agric. 1961, 9, 301–304. [Google Scholar] [CrossRef]


| Source | df | RWC | MSI | Proline | SOD | GPX | POD | |
|---|---|---|---|---|---|---|---|---|
| Year (Y) | 2 | 98.404 ** | 362.73 ** | 6.26 ** | 5933.58 ** | 187.77 ** | 1680.09 ** | |
| Block | 9 | 6.31 ns | 8.59 ns | 0.35 ns | 113.53 ns | 37.34 ns | 73.81 ns | |
| Irrigation (I) | 3 | 2616.89 ** | 24,546.21 ** | 12.53 ** | 157,559.21 ** | 1912.15 ** | 92,875.41 ** | |
| Y×I | 6 | 4.19 ns | 49.32 ** | 0.93 ns | 1531.52 ** | 24.61 ns | 144.81 ** | |
| Error I | 27 | 3.25 | 7.71 | 0.38 | 152.25 | 31.41 | 75.37 | |
| Salicylic Acid (SA) | 3 | 132.38 ** | 109.51 ** | 1.708 ns | 5131.206 ** | 64.03 ns | 143.68 ** | |
| I×SA | 9 | 68.31 ** | 61.504 ** | 2.95 ** | 1586.32 ** | 77.47 ns | 316.06 ** | |
| Y×SA | 6 | 2.313 ns | 6.69 ns | 0.27 ns | 80.64 ns | 35.27 ns | 85.36 * | |
| Y×I×SA | 18 | 7.03 ** | 14.13 ** | 0.24 ns | 179.64 ns | 42.32 ns | 100.95 ** | |
| Error Total | 108 | 2.101 | 6.68 | 0.2203 | 143.08 | 32.73 | 34.03 | |
| CV% | 2.62 | 3.53 | 4.1 | 3.46 | 6.97 | 2.13 | ||
| Source | df | Chl a | Chl b | Total Chl | Carotenoid | Yield | Allicin | Pyruvate |
| Year (Y) | 2 | 0.018 ** | 0.01001 ** | 0.063 ** | 0.0087 ** | 6838.31 ** | 0.892 ** | 508.37 ** |
| Block | 9 | 0.0038 ns | 0.00035 * | 0.0048 ** | 0.00014 ns | 449.386 ns | 0.0328 ns | 21.34 ns |
| Irrigation (I) | 3 | 0.385 ** | 0.073 ** | 0.714 ** | 0.047 ** | 10,074,753.42 ** | 24.45 ** | 2564.34 ** |
| Y×I | 6 | 0.00314 ns | 0.0024 ** | 0.0058 ns | 0.0015 ** | 1715.57 ** | 0.034 ns | 15.73 ns |
| Error I | 27 | 0.0026 | 0.00015 | 0.0031 | 0.000092 | 449.977 | 0.025 | 14.03 |
| Salicylic Acid (SA) | 3 | 0.0131 ** | 0.00195 ** | 0.014 ** | 0.0023 ** | 63,956.69 ** | 1.304 ** | 570.05 ** |
| I×SA | 9 | 0.0032 ns | 0.00039 ** | 0.0026 ns | 0.000807 ** | 14,625.449 ** | 0.38 ** | 80.9 ** |
| Y×SA | 6 | 0.0044 * | 0.00032 ** | 0.0042 * | 0.00083 ** | 1091.11 * | 0.051 ns | 35.92 ** |
| Y×I×SA | 18 | 0.0013 ns | 0.00041 ** | 0.0015 ns | 0.00068 ** | 490.12 ns | 0.083 ** | 12.20 ns |
| Error Total | 108 | 0.00166 | 0.000066 | 0.0017 | 0.000081 | 374.85 | 0.036 | 10.55 |
| CV% | 7.04 | 4.29 | 5.37 | 3.17 | 2.05 | 7.42 | 4.85 | |
| RWC (%) | MSI (%) | Proline (µmol g−1 FW) | Enzyme Activity | Pigments Concentration | Yield g m−2 | Allicin (mg g−1 FW) | Pyruvate (µmol g−1 FW) | ||||||
|---|---|---|---|---|---|---|---|---|---|---|---|---|---|
| SOD | GPX | POD | Chl a | Chl b | Chl T | Carotenoid | |||||||
| (unit mg−1 Protein) | (mg g−1 FW) | ||||||||||||
| (µmol min−1) | |||||||||||||
| Year1 | 55.64 a | 72.85 b | 11.77 a | 346.65 b | 83.96 a | 276.49 a | 0.563 a | 0.184 b | 0.748 b | 0.289 a | 934.3 b | 2.65 a | 68.77 a |
| Year2 | 56.20 a | 75.72 a | 11.35 b | 335.18 c | 81.07 b | 267.07 b | 0.596 a | 0.204 a | 0.806 a | 0.291 a | 954.9 a | 2.44 b | 63.66 b |
| Year3 | 53.83 b | 71.00 b | 11.16 b | 354.32 a | 80.93 b | 275.29 a | 0.573 a | 0.181 b | 0.755 b | 0.270 b | 943.3 b | 2.63 a | 68.27 a |
| I100% | 61.96 a | 93.12 a | 11.01 c | 291.37 d | 74.36 d | 227.39 d | 0.668 a | 0.243 a | 0.912 a | 0.282 b | 1416 a | 1.87 d | 61.05 c |
| I75% | 60.24 b | 86.57 b | 11.02 c | 310.07 c | 79.95 c | 248.07 c | 0.608 b | 0.195 b | 0.804 b | 0.322 a | 1239 b | 2.12 c | 61.54 c |
| I50% | 52.81 c | 70.74 c | 11.60 b | 360.95 b | 84.51 b | 290.43 b | 0.579 b | 0.166 c | 0.744 c | 0.285 b | 677.3 c | 2.88 b | 68.35 b |
| I0 | 45.89 d | 42.33 d | 12.07 a | 419.14 a | 89.12 a | 325.90 a | 0.455 c | 0.155 d | 0.619 d | 0.244 c | 444.9 d | 3.43 a | 76.66 a |
| SA1 | 56.98 a | 75.37 a | 11.59 a | 353.45 a | 82.50 a | 276.43 a | 0.601 a | 0.194 a | 0.793 a | 0.293 a | 997.2 a | 2.38 c | 62.26 c |
| SA0.75 | 55.02 b | 72.56 b | 11.15 b | 349.57 a | 82.74 a | 276.22 a | 0.575 ab | 0.194 a | 0.770 ab | 0.283 b | 937.2 b | 2.59 b | 66.74 b |
| SA0.5 | 55.85 b | 72.91 b | 11.46 a | 348.28 a | 82.45 a | 274.27 a | 0.571 b | 0.192 a | 0.764 b | 0.276 c | 927.8 a | 2.53 b | 68.18 b |
| SA0 | 53.05 c | 71.91 b | 11.50 a | 330.23 b | 80.27 a | 264.86 b | 0.563 b | 0.181 b | 0.752 b | 0.281 bc | 914.6 c | 2.78 a | 70.42 a |
| Experiment Treatments | ||||||||
|---|---|---|---|---|---|---|---|---|
| Year | Irrigation Levels | Salycilic Acid Concentration | RWC | MSI | POD Activity (µmol min−1) (mg−1 Protein) | Chl b | Carotenoid | Allicin |
| (%) | (mg g−1 FW) | |||||||
| Y1 | 100% | 0 | 64.23 a | 95.50 ab | 227.9 stuvwx | 0.253 a | 0.313 cdefg | 2.12 klmnop |
| 0.5 | 62.42 abc | 92.46 abcde | 237.1 opqrstuv | 0.239 abc | 0.331 bc | 1.88 lnmop | ||
| 0.75 | 60.35 abcde | 91.51 abcde | 232.7 qrstuvw | 0.252 a | 0.325 bcd | 1.95 lnmop | ||
| 1 | 63.64 ab | 96.48 a | 226.4 tuvwx | 0.253 a | 0.327 bcd | 1.86 mnop | ||
| 75% | 0 | 60.14 abcde | 80.27 fgh | 238.3 opqrstuv | 0.181 de | 0.312 cdefgh | 2.12 klmnop | |
| 0.5 | 59.58 bcde | 87.54 cdef | 253.8 mno | 0.184 d | 0.278 jklmno | 2.20 ijklmno | ||
| 0.75 | 60.48 abcde | 87.29 cdef | 264.3 lm | 0.183 de | 0.274 klmnop | 2.10 klmnop | ||
| 1 | 61.16 abc | 88.28 bcde | 249.6 mnopq | 0.173 defgh | 0.303 defghij | 2.16 jklmnop | ||
| 50% | 0 | 50.50 hijk | 71.53 ijk | 278.5 jkv | 0.152 hij | 0.280 jklmn | 3.20 cdef | |
| 0.5 | 54.80 fgh | 66.71 k | 296.1 fghijk | 0.164 defghi | 0.285 hijklmn | 2.95 defgh | ||
| 0.75 | 52.52 ghij | 70.44 jk | 290.0 ghijk | 0.163 defghi | 0.286 ghijklmn | 2.97 defgh | ||
| 1 | 54.60 fghi | 72.43 ijk | 301.4 efgh | 0.158 efghij | 0.288 fghijklmn | 2.59 hijk | ||
| dryland | 0 | 40.05 op | 40.90 no | 327.1 abc | 0.137 j | 0.234 qrs | 3.96 ab | |
| 0.5 | 47.8 klm | 41.46 mno | 330.7 a | 0.154 ghij | 0.249 pqrs | 3.42 bcd | ||
| 0.75 | 48.01 klm | 40.49 no | 328.3 ab | 0.154 ghij | 0.264 lmnop | 3.65 abc | ||
| 1 | 50.28 ijk | 42.38 mno | 342.1 a | 0.153 ghij | 0.279 jklmno | 3.21 cdef | ||
| Y2 | 100% | 0 | 63.22 ab | 95.79 ab | 219.3 wx | 0.259 a | 0.346 b | 1.91 lmnop |
| 0.5 | 61.80 abc | 92.59 abcde | 213.3 x | 0.251 a | 0.314 cdef | 1.61 p | ||
| 0.75 | 61.04 abc | 86.66 defg | 224.4 uvwx | 0.248 ab | 0.314 cdef | 1.64 op | ||
| 1 | 63.22 ab | 97.14 a | 222.8 vwx | 0.246 ab | 0.377 a | 1.75 mnop | ||
| 75% | 0 | 60.67 abcd | 87.38 cdef | 239.1 opqrstuv | 0.187 d | 0.311 cdefgh | 2.06 klmnop | |
| 0.5 | 59.72 bcde | 89.45 abcde | 243.1 nopqrst | 0.236 abc | 0.281 jklmn | 1.95 lmnop | ||
| 0.75 | 61.68 abc | 91.18 abcde | 250.9 mnop | 0.242 ab | 0.289 fghijklm | 2.00 lmnop | ||
| 1 | 62.42 abc | 89.96 abcde | 249.1 mnopqr | 0.247 ab | 0.305 cdefghij | 2.08 klmnop | ||
| 50% | 0 | 50.56 hijk | 71.65 ijk | 278.4 kv | 0.168 defghi | 0.285 hijklmn | 2.96 defgh | |
| 0.5 | 56.55 defg | 74.67 hij | 282.8 ijk | 0.180 def | 0.287 fghijklmn | 2.74 fghi | ||
| 0.75 | 53.52 ghij | 72.12 ijk | 287.2 hijk | 0.180 def | 0.286 hijklmn | 2.73 fghij | ||
| 1 | 56.24 efg | 74.60 hij | 296.1 fghij | 0.183 de | 0.289 fghijklm | 2.44 hijkl | ||
| dryland | 0 | 39.68 p | 41.29 mno | 305.9 defg | 0.136 j | 0.222 s | 3.46 bcd | |
| 0.5 | 49.46 jkl | 48.92 lm | 320.5 bcd | 0.167 defghi | 0.228 rs | 3.27 cdef | ||
| 0.75 | 49.82 jkl | 47.79 lmn | 318.4 bcde | 0.173 defgh | 0.252 opqr | 3.33 cde | ||
| 1 | 49.69 jkl | 50.47 l | 322 bcd | 0.167 defghi | 0.270 klmnop | 3.05 defg | ||
| Y3 | 100% | 0 | 62.73 abc | 93.60 abcd | 230.5 suvwx | 0.225 bc | 0.296 efghijkl | 2.26 ijklmn |
| 0.5 | 60.84 abcd | 90.63 abcde | 226.8 stuvwx | 0.236 abc | 0.291 efghijkl | 1.91 lmnop | ||
| 0.75 | 58.66 cdef | 90.29 abcde | 236.0 pqrstuvw | 0.237 abc | 0.317 cde | 1.70 nop | ||
| 1 | 61.62 abc | 94.83 abc | 231.8 rstuvw | 0.216 c | 0.309 cdefghi | 1.81 mnop | ||
| 75% | 0 | 59.64 bcde | 78.90 ghi | 240.8 opqrstu | 0.173 defgh | 0.233 rs | 2.10 klmnop | |
| 0.5 | 58.34 cdef | 86.27 defg | 244.4 nopqrs | 0.177 defg | 0.263 mnop | 2.10 klmnop | ||
| 0.75 | 58.64 cdef | 85.61 efg | 259.7 mn | 0.180 def | 0.266 lmnop | 2.25 ijklmn | ||
| 1 | 60.47 abcde | 86.77 def | 243.8 nopqrst | 0.185 d | 0.261 nopq | 2.31 ijklm | ||
| 50% | 0 | 44.16 mno | 69.73 jk | 282.1 ijk | 0.145 ij | 0.279 jklmno | 3.20 cdef | |
| 0.5 | 54.58 fghi | 64.97 k | 299.6 fghi | 0.164 defghi | 0.283 ijklmno | 2.90 defgh | ||
| 0.75 | 50.63 hijk | 68.55 jk | 292.1 ghijk | 0.167 defghi | 0.285 hijklmn | 3.10 cdefg | ||
| 1 | 55.11 fg | 71.55 ijk | 301.0 efgh | 0.172 defgh | 0.288 fghijklmn | 2.77 efghi | ||
| dryland | 0 | 41.05 nop | 36.51 o | 310.6 cdef | 0.152 hij | 0.234 qrs | 4.05 a | |
| 0.5 | 44.41 mno | 39.37 o | 343.1 a | 0.153 ghij | 0.232 rs | 3.47 bcd | ||
| 0.75 | 44.88 mn | 38.90 o | 331.1 ab | 0.156 fghij | 0.235 qrs | 3.67 abc | ||
| 1 | 45.60 lm | 39.60 o | 331.2 ab | 0.164 defghi | 0.248 pqrs | 2.60 ghijk | ||
| Texture | Fe | Mn | Cu | Zn | K(av.) | P(av.) | pH | EC | Organic Carbon | Organic Matter | Sand | Silt | Clay | Year |
|---|---|---|---|---|---|---|---|---|---|---|---|---|---|---|
| mg/kg | ds/m | % | ||||||||||||
| Silty clay loam | 2.21 | 4.06 | 0.48 | 0.75 | 242.8 | 17.9 | 7.14 | 1.21 | 1.52 | 1.62 | 18 | 52 | 30 | 2016–2017 |
| Silty clay loam | 2.44 | 3.98 | 0.66 | 0.71 | 255.4 | 19.1 | 7.25 | 1.04 | 1.38 | 1.42 | 13 | 55 | 32 | 2017–2018 |
| Silty clay loam | 1.96 | 4.11 | 0.59 | 0.69 | 247.6 | 18.7 | 7.06 | 1.11 | 1.42 | 1.55 | 20 | 42 | 38 | 2018–2019 |
| Month | Year | Average Temperature (°C) | Relative Humidity (%) | Maximum Wind Speed (m s−1) | Rainfall (mm) | |
|---|---|---|---|---|---|---|
| Monthly | Monthly | Monthly | Maximum | Monthly | ||
| Aban | 2017 | 12.1 | 45.9 | 15 | 20 | 12.3 |
| 2018 | 11.9 | 44.5 | 12 | 20 | 10.3 | |
| 2019 | 10.3 | 55 | 15 | 20 | 109.7 | |
| Azar | 2017 | 4 | 57.9 | 11 | 30 | 53.6 |
| 2018 | 4.9 | 61.7 | 17 | 30 | 39.7 | |
| 2019 | 6.1 | 72.8 | 14 | 30 | 123.7 | |
| Dey | 2017 | 4.2 | 66.4 | 13 | 20 | 115.2 |
| 2018 | 4.6 | 62.4 | 16 | 20 | 52.1 | |
| 2019 | 3.5 | 66.2 | 20 | 20 | 126.5 | |
| Bahman | 2017 | −0.1 | 71 | 10 | 21 | 101.1 |
| 2018 | 4.5 | 64.8 | 21 | 21 | 81.4 | |
| 2019 | 3.7 | 68.9 | 21 | 21 | 128.3 | |
| Esfand | 2017 | 5.4 | 62.2 | 18 | 30 | 72.9 |
| 2018 | 8.2 | 63.8 | 17 | 30 | 43.2 | |
| 2019 | 4.1 | 69.1 | 17 | 30 | 102.4 | |
| Farvardin | 2017 | 3.3 | 66.1 | 14 | 23 | 114.1 |
| 2018 | 12 | 61.2 | 21 | 23 | 70.7 | |
| 2019 | 9.1 | 68.2 | 21 | 23 | 319.2 | |
| Ordibehesht | 2017 | 16.5 | 55.6 | 11 | 28 | 35.8 |
| 2018 | 13.4 | 71.3 | 23 | 28 | 208.5 | |
| 2019 | 13.8 | 59 | 98 | 28 | 12.4 | |
| Khordad | 2017 | 19 | 46.5 | 10 | 21 | 0.1 |
| 2018 | 19.2 | 55.5 | 18 | 21 | 6.7 | |
| 2019 | 20.1 | 51.4 | 17 | 21 | 0 | |
Publisher’s Note: MDPI stays neutral with regard to jurisdictional claims in published maps and institutional affiliations. |
© 2022 by the authors. Licensee MDPI, Basel, Switzerland. This article is an open access article distributed under the terms and conditions of the Creative Commons Attribution (CC BY) license (https://creativecommons.org/licenses/by/4.0/).
Share and Cite
Yousefvand, P.; Sohrabi, Y.; Heidari, G.; Weisany, W.; Mastinu, A. Salicylic Acid Stimulates Defense Systems in Allium hirtifolium Grown under Water Deficit Stress. Molecules 2022, 27, 3083. https://doi.org/10.3390/molecules27103083
Yousefvand P, Sohrabi Y, Heidari G, Weisany W, Mastinu A. Salicylic Acid Stimulates Defense Systems in Allium hirtifolium Grown under Water Deficit Stress. Molecules. 2022; 27(10):3083. https://doi.org/10.3390/molecules27103083
Chicago/Turabian StyleYousefvand, Peyman, Yousef Sohrabi, Gholamreza Heidari, Weria Weisany, and Andrea Mastinu. 2022. "Salicylic Acid Stimulates Defense Systems in Allium hirtifolium Grown under Water Deficit Stress" Molecules 27, no. 10: 3083. https://doi.org/10.3390/molecules27103083