
Synthesis of Silica-Based Quaternized Adsorption Material and Study on Its Adsorption Behavior for Pu(IV)


Abstract
:1. Introduction
2. Material and Methods
2.1. Materials
2.2. Preparation of Silica-Based Quaternized Adsorption Material
2.3. Characterization of Silicon-Based Quaternized Material
2.4. Calculation Method of Grafting Experiment and Adsorption Experiment
2.5. Optimization Batch Experiments of Graft Polymerization
- (i).
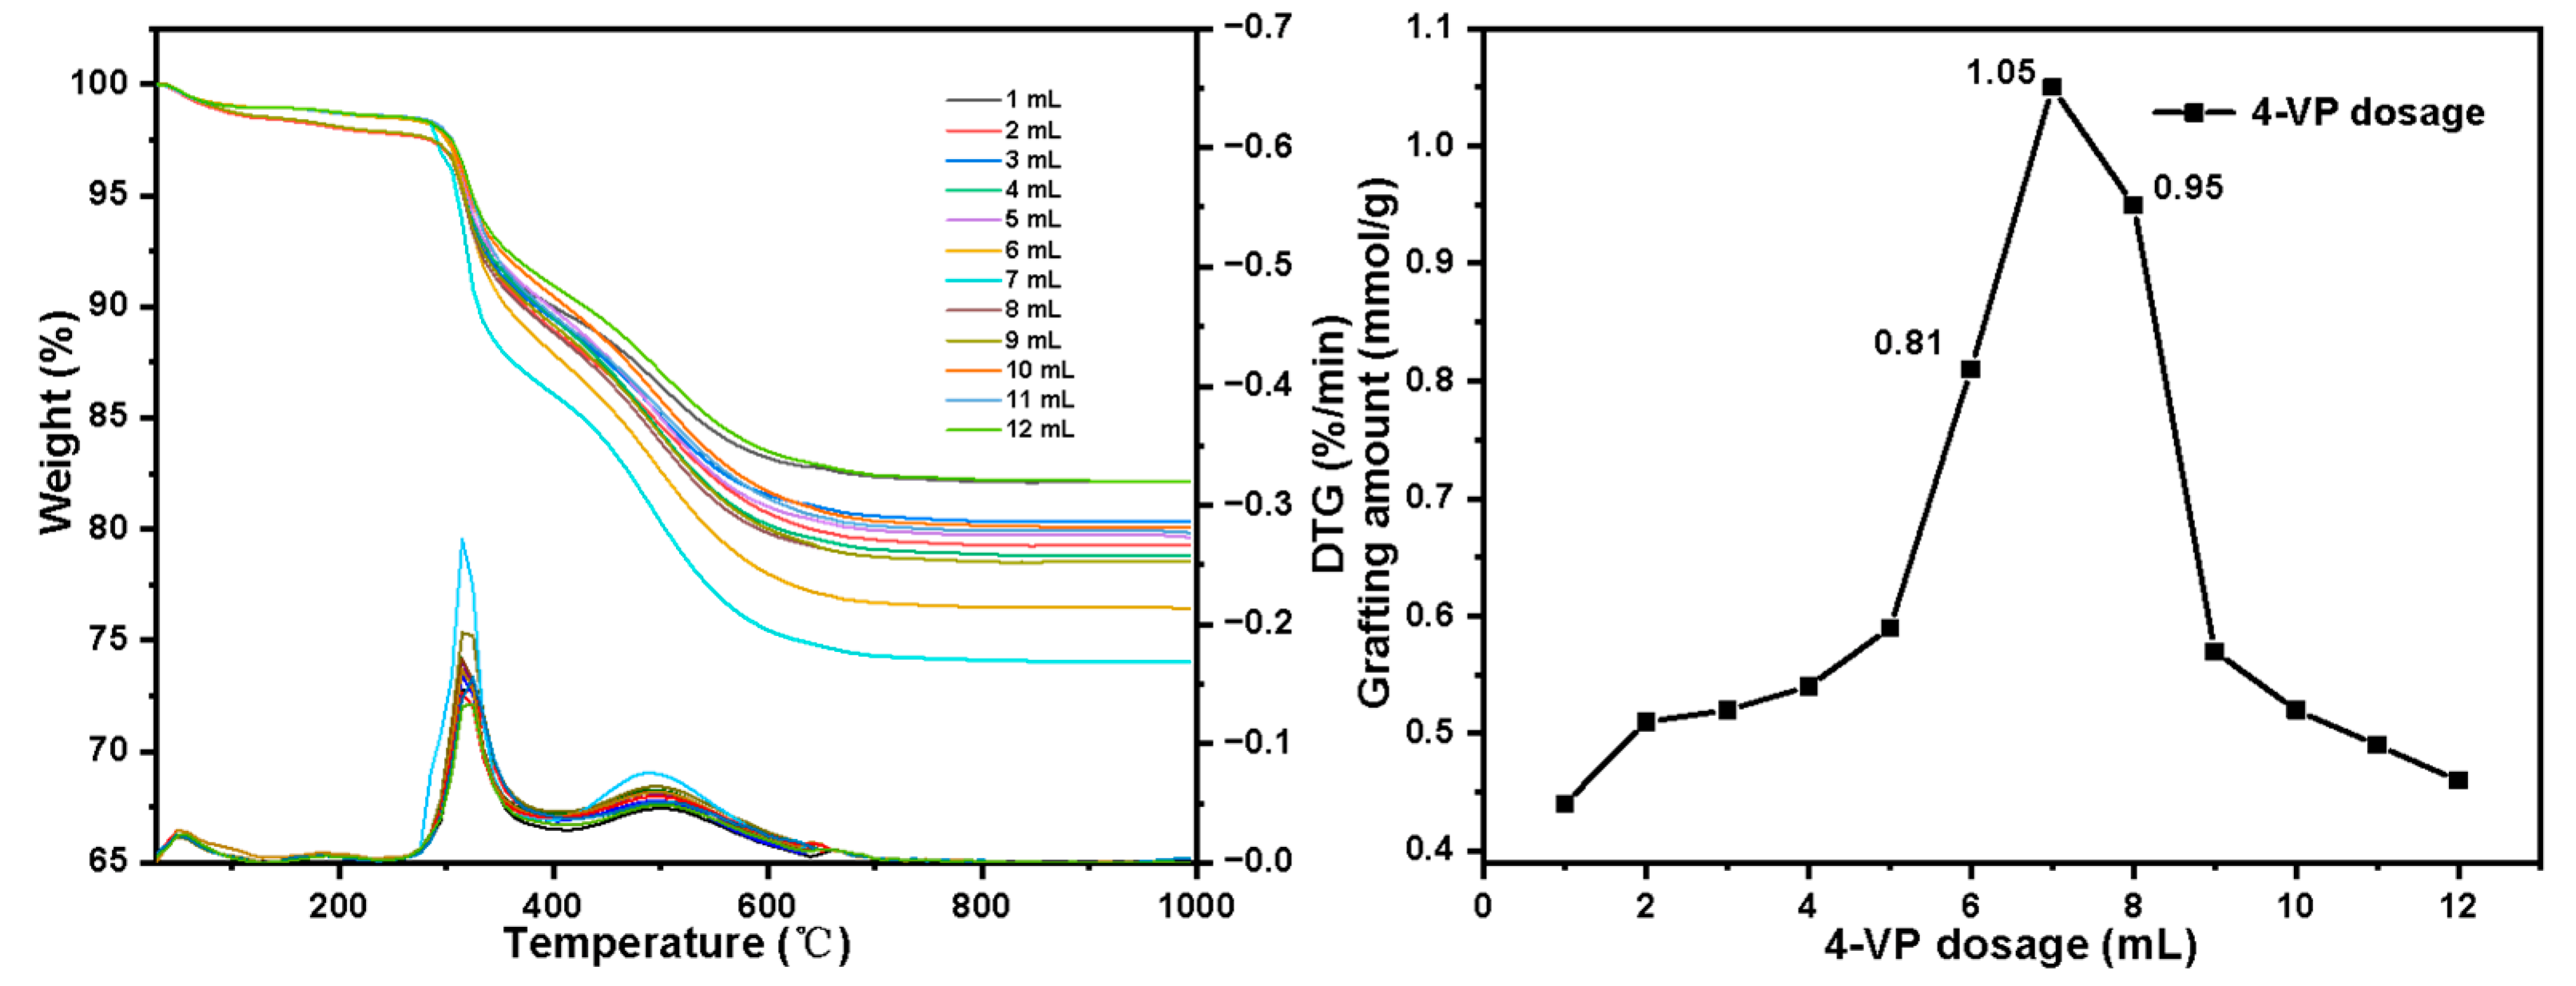
- Set the 4-VP dosage (molarity): 1 mL (0.31 mol·L−1), 2 mL (0.59 mol·L−1), 3 mL (0.86 mol·L−1), 4 mL (1.11 mol·L−1), 5 mL (1.35 mol·L−1), 6 mL (1.57 mol·L−1), 7 mL (1.78 mol·L−1), 8 mL (1.98 mol·L−1), 9 mL (2.17 mol·L−1), 10 mL (2.35 mol·L−1), 11 mL (2.53 mol·L−1), 12 mL (2.69 mol·L−1), 13 mL (2.85 mol·L−1), 14 mL (2.99 mol·L−1), 15 mL (3.14 mol·L−1). Other conditions: initiator dosage 30 mg, reaction temperature 80 °C.
- (ii).
- Set the reaction temperature: 65 °C, 70 °C, 75 °C, 80 °C, 85 °C, 90 °C, 95 °C. Other conditions: initiator dosage 30 mg, 4-VP dosage 7 mL.
- (iii).
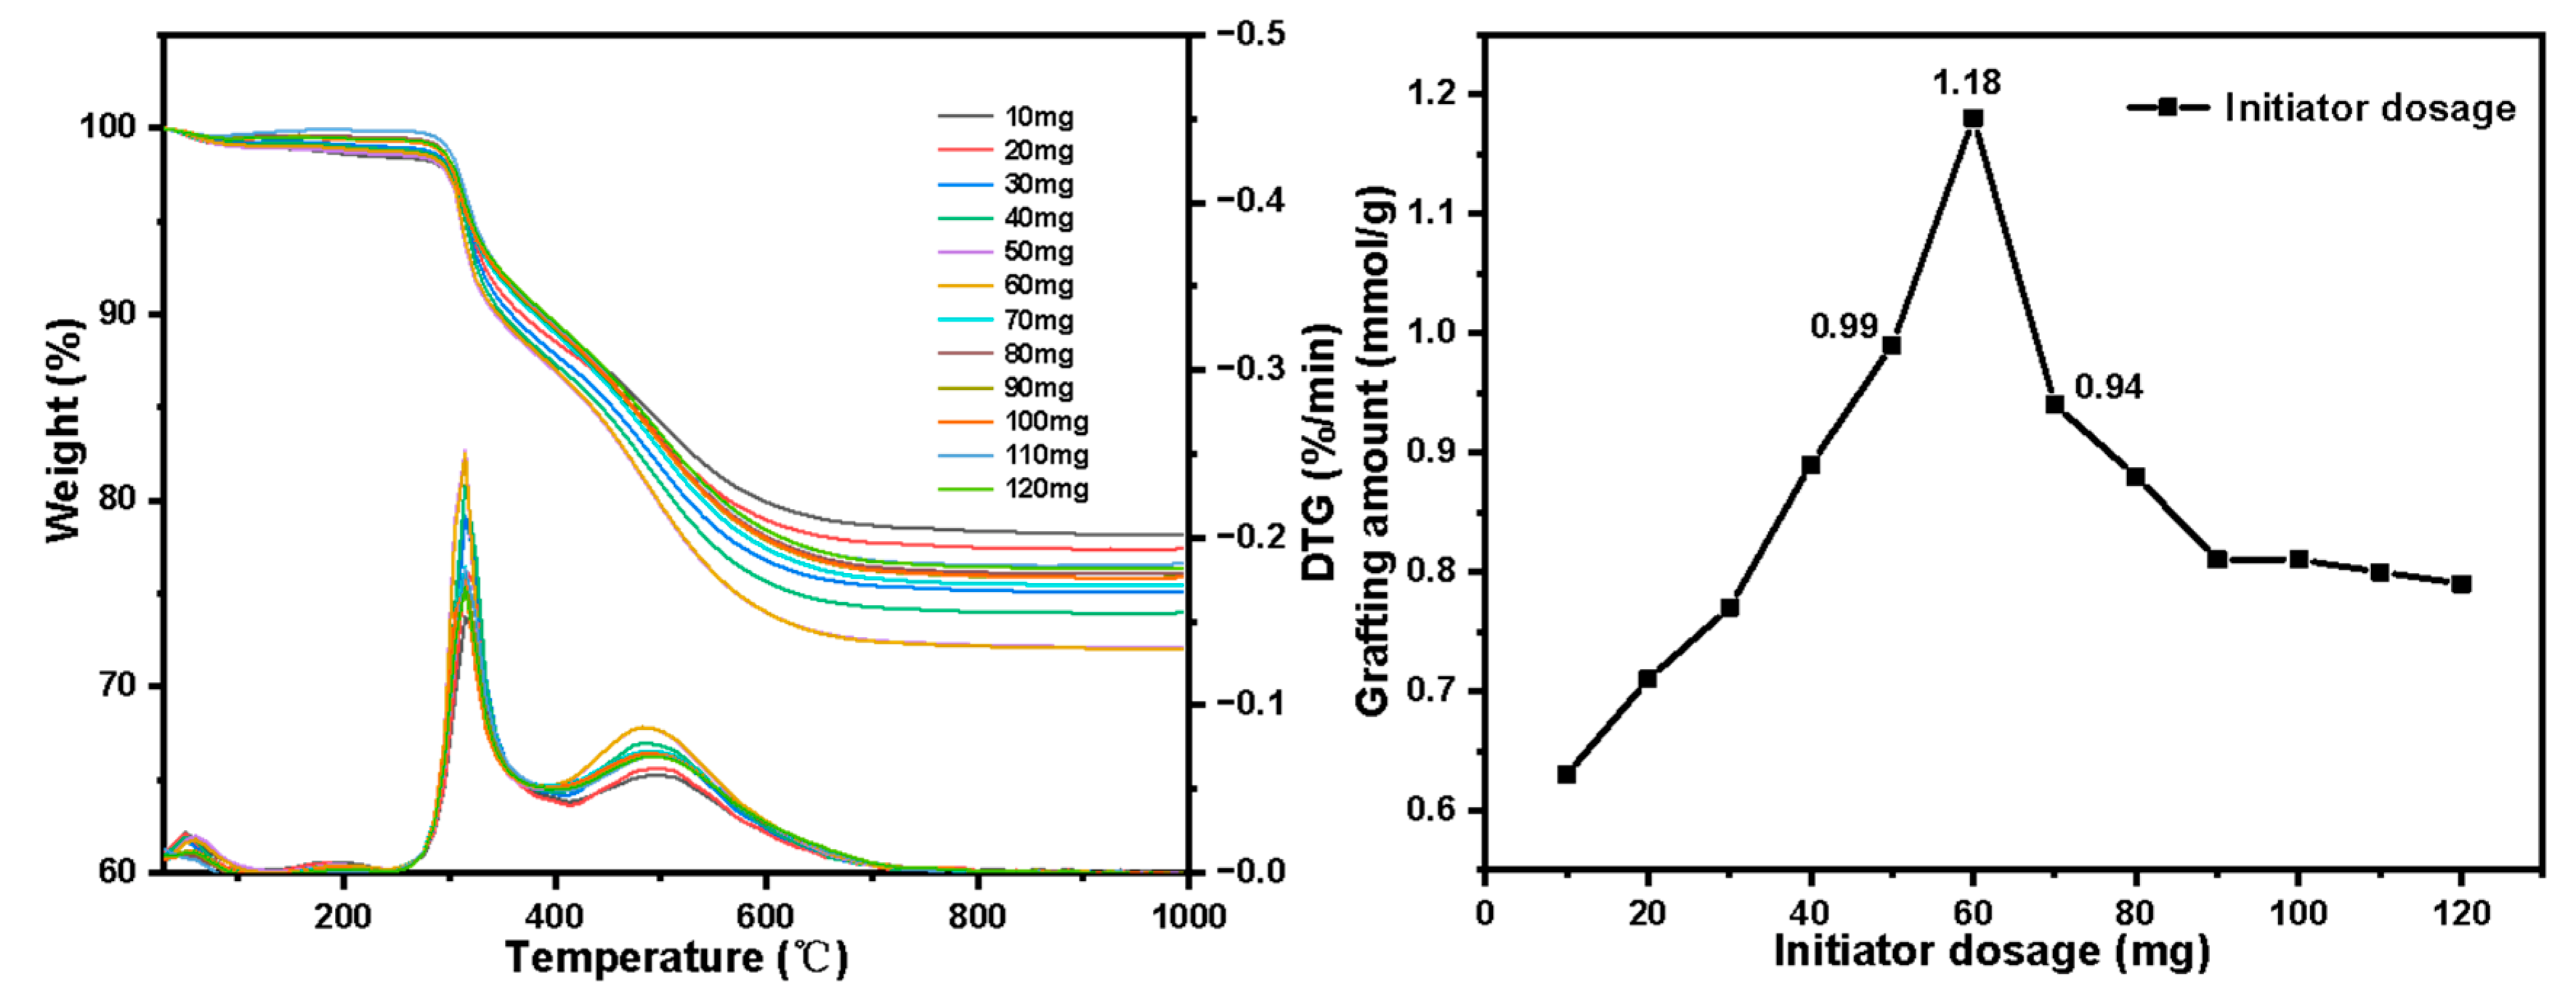
- Set the initiator AIBN dosage: 1 mg, 2 mg, 3 mg, 4 mg, 5 mg, 6 mg, 7 mg, 8 mg, 9 mg, 10 mg, 11 mg, 12 mg. Other conditions: reaction temperature 85 °C, 4-VP dosage 7 mL.
- (1)
- Factor selection:
- (2)
- Horizontal selection:
2.6. Adsorption Experiment of Pu(IV) on Silicon-Based Quaternized Material
3. Results and Discussion
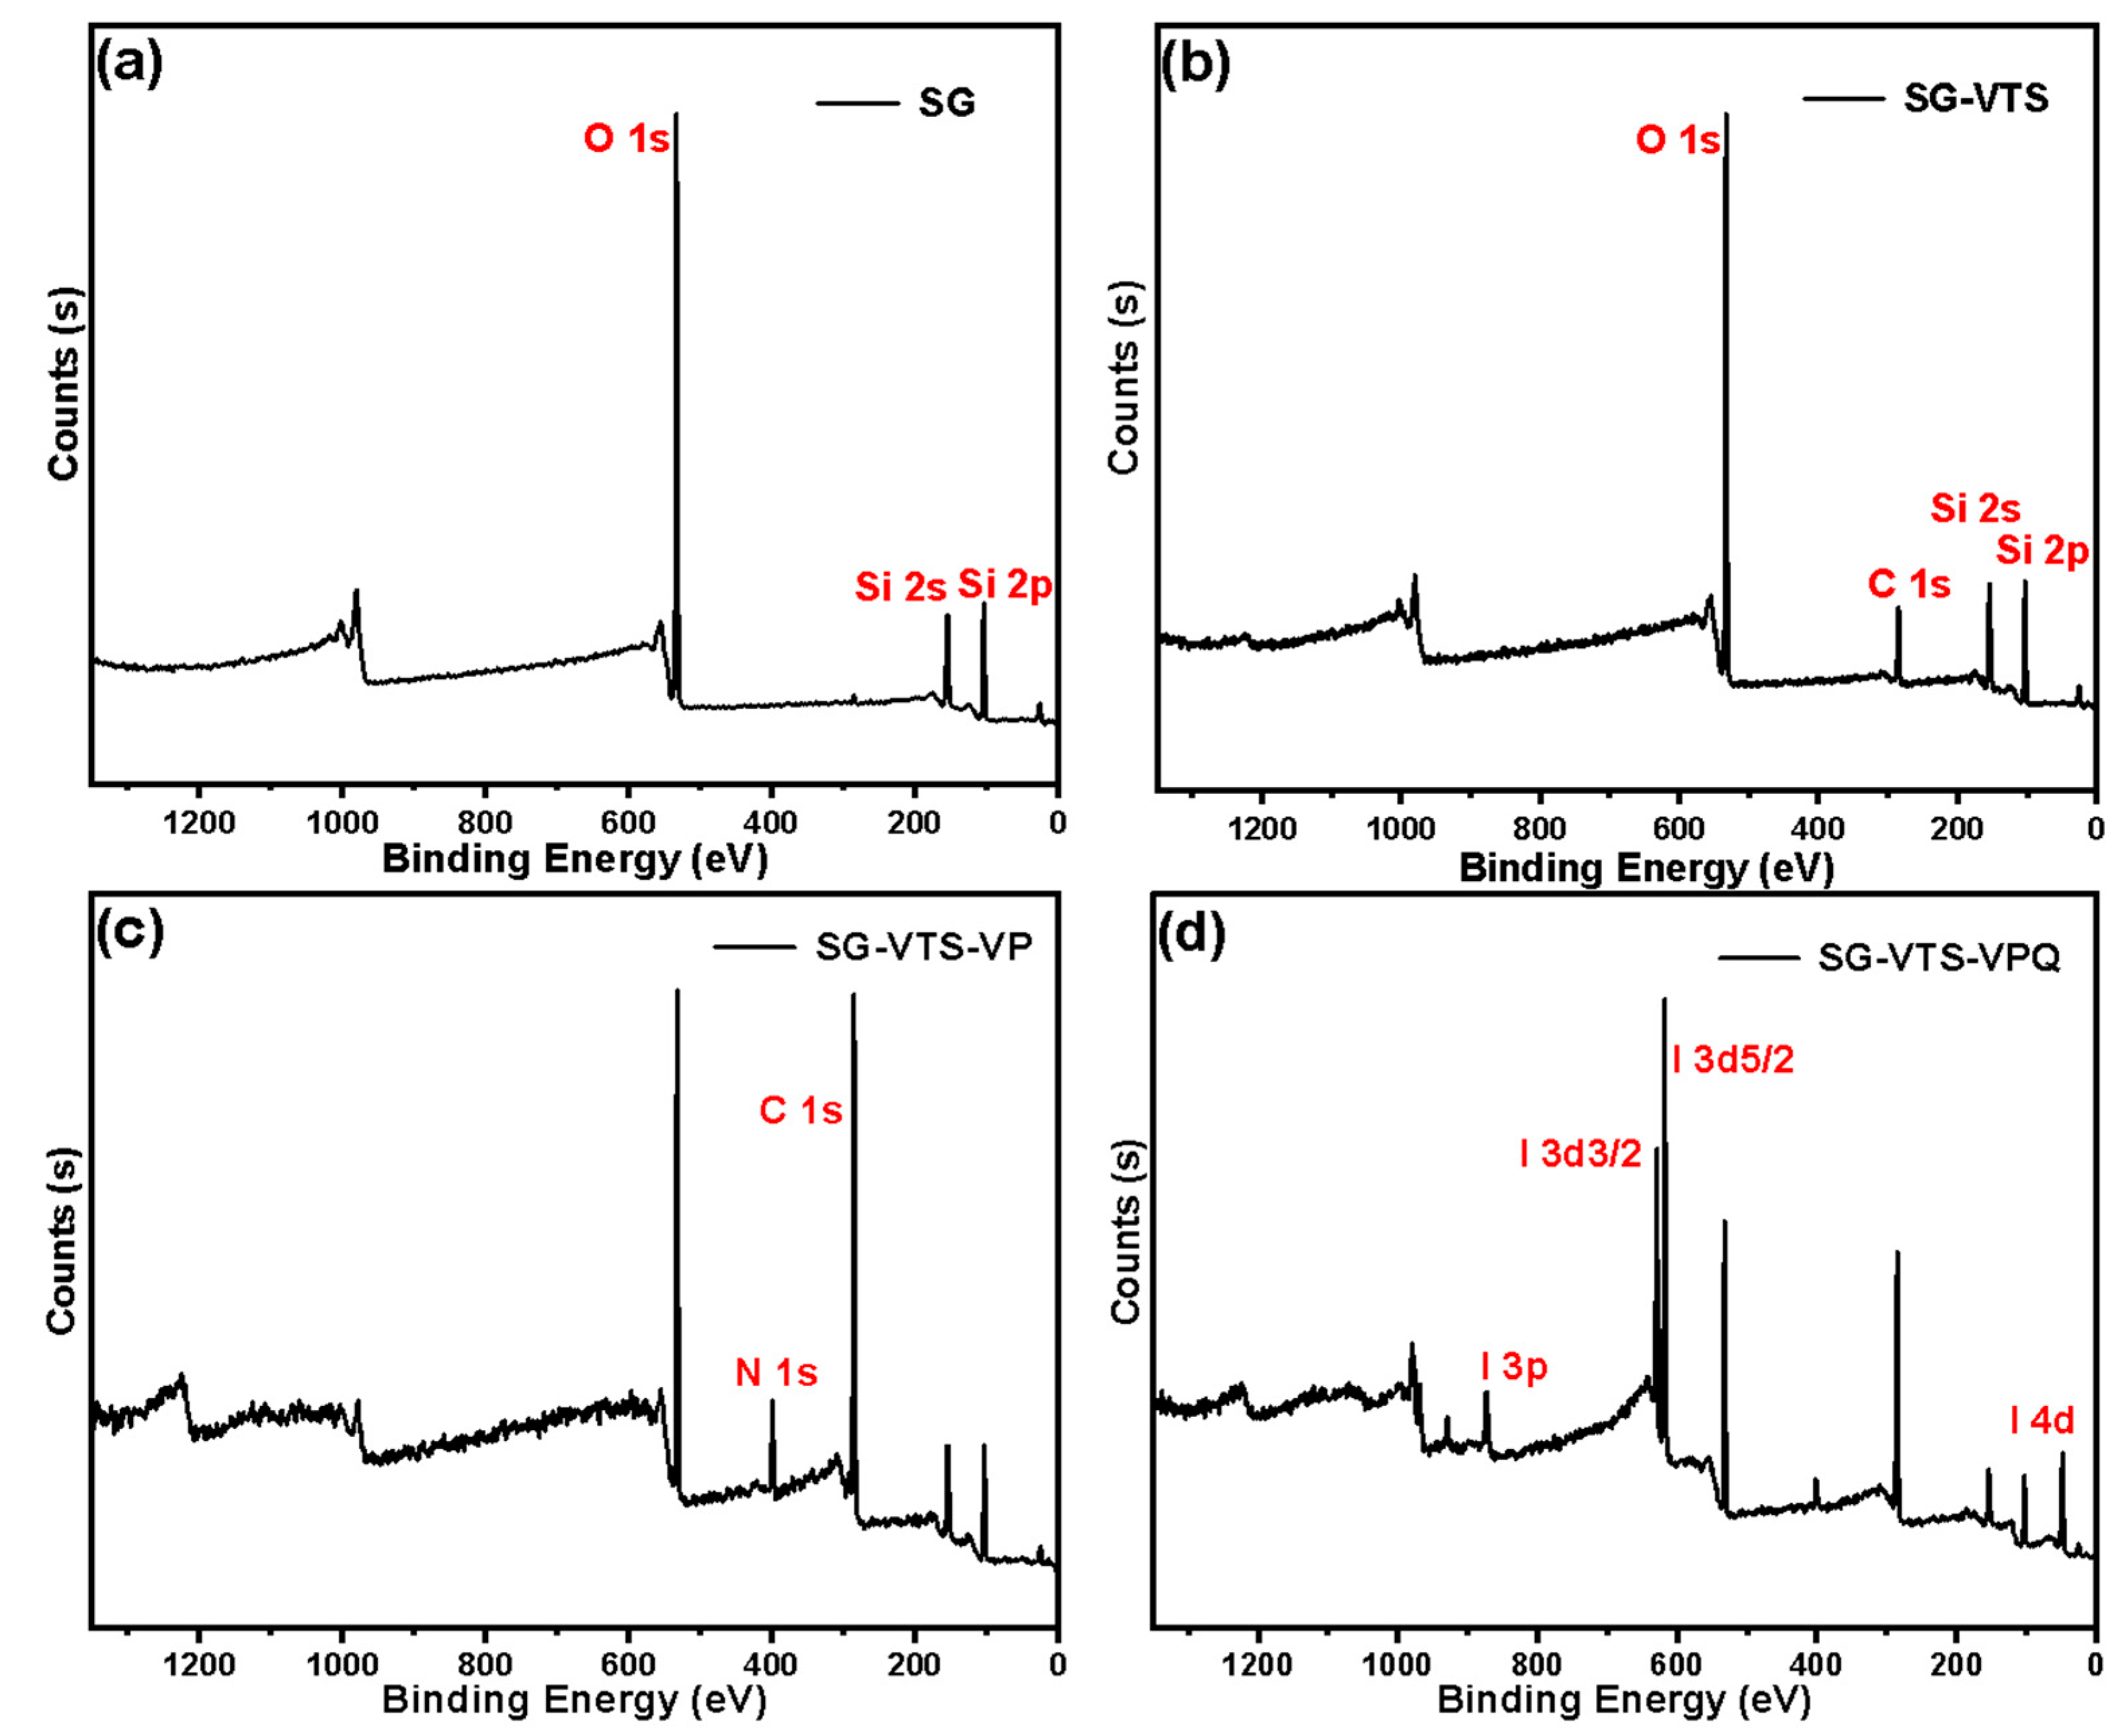
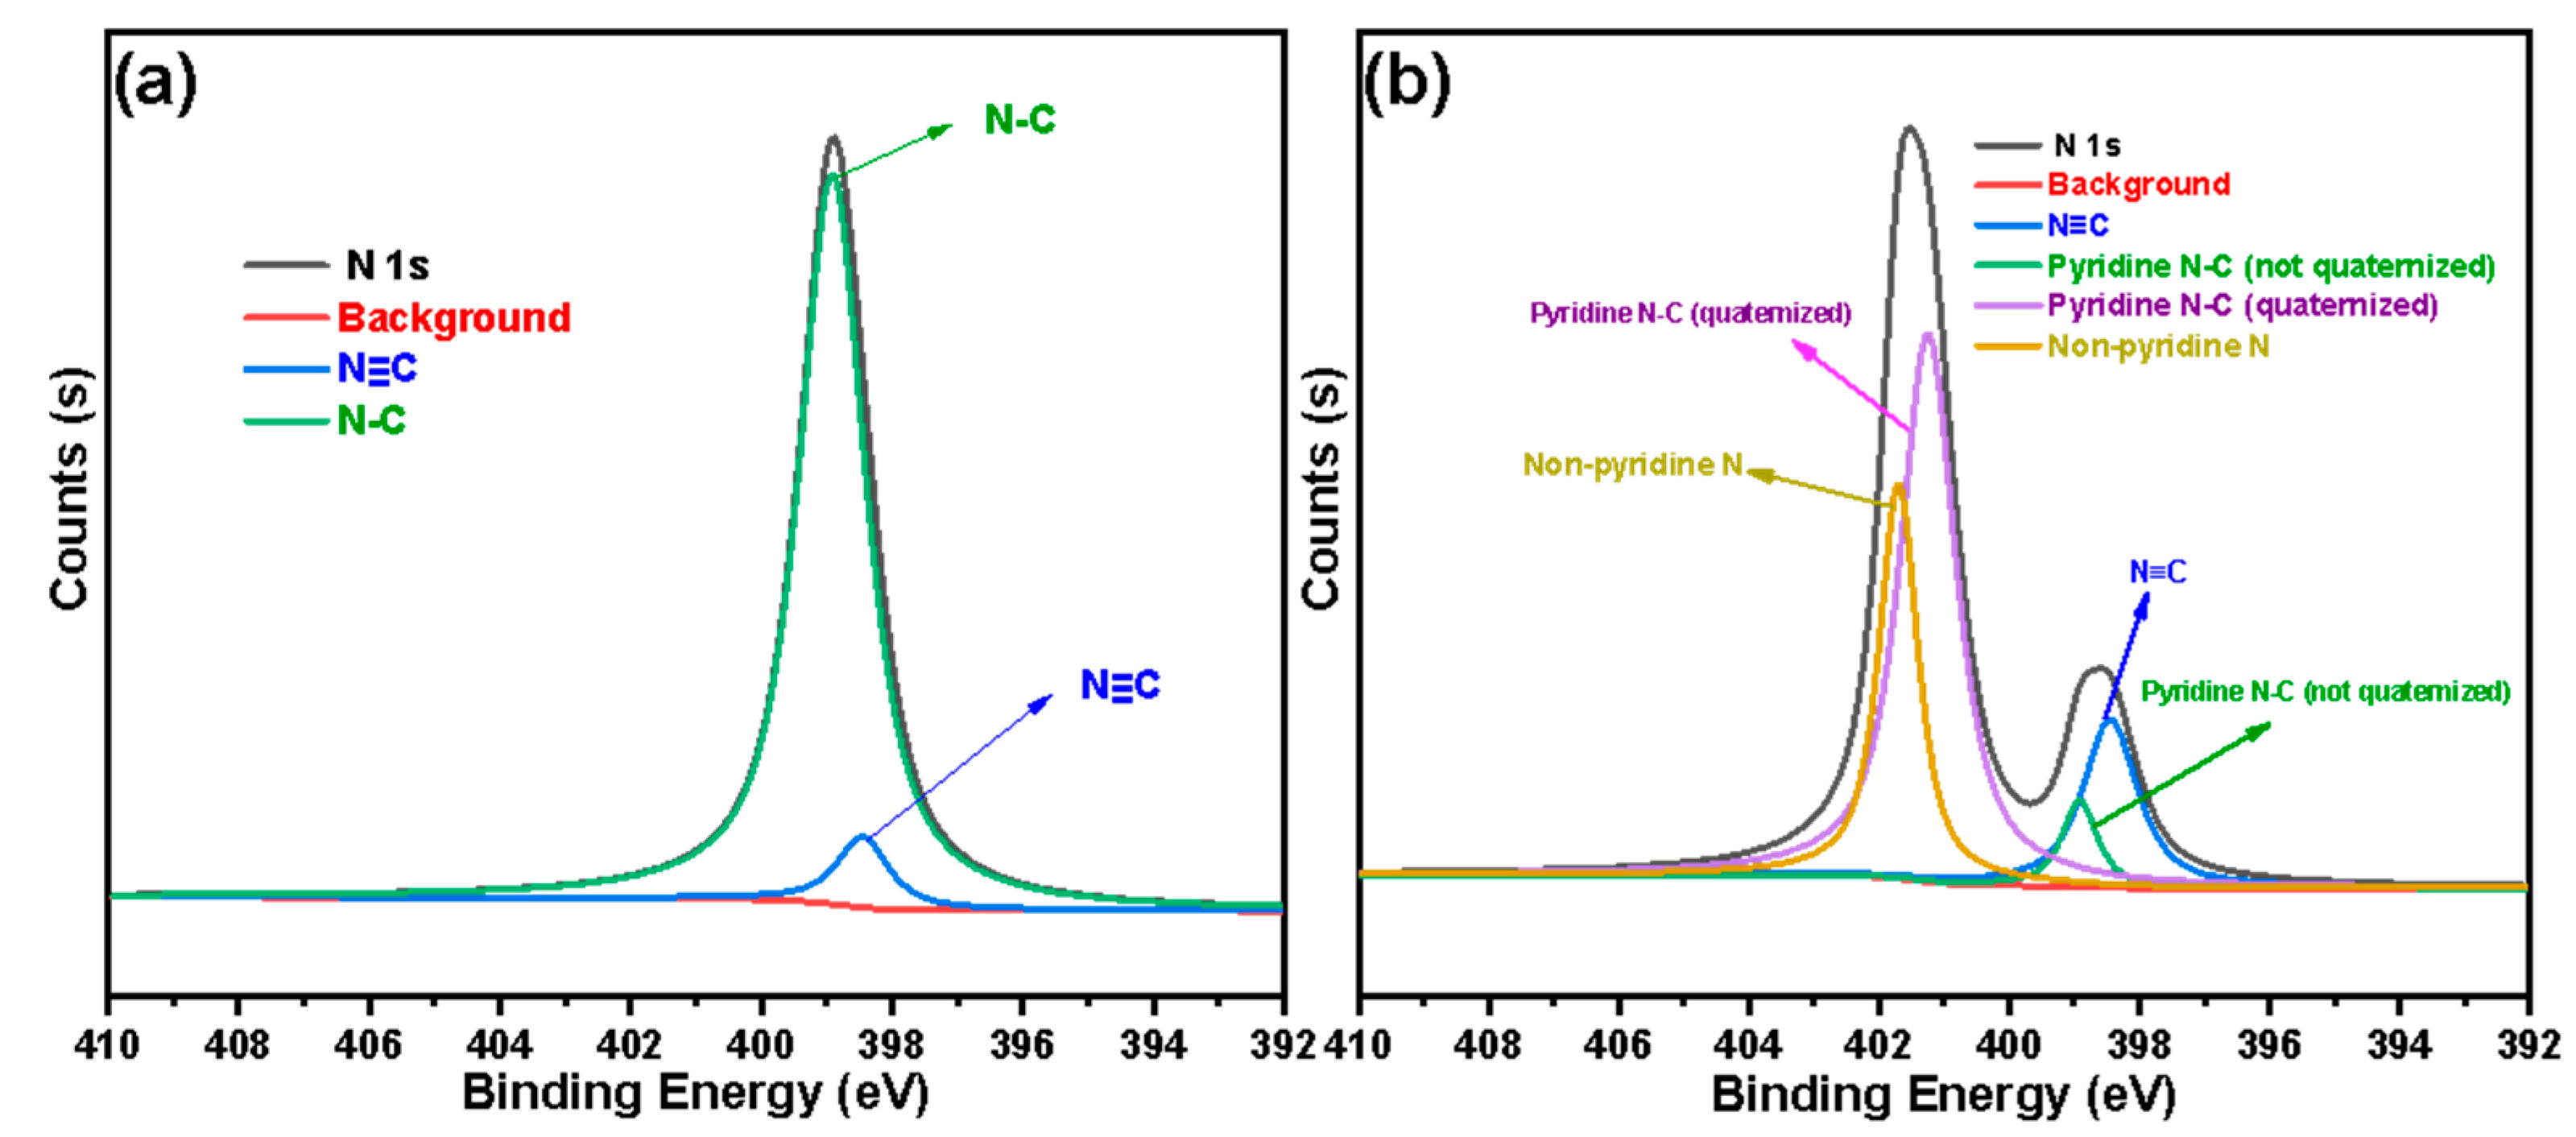
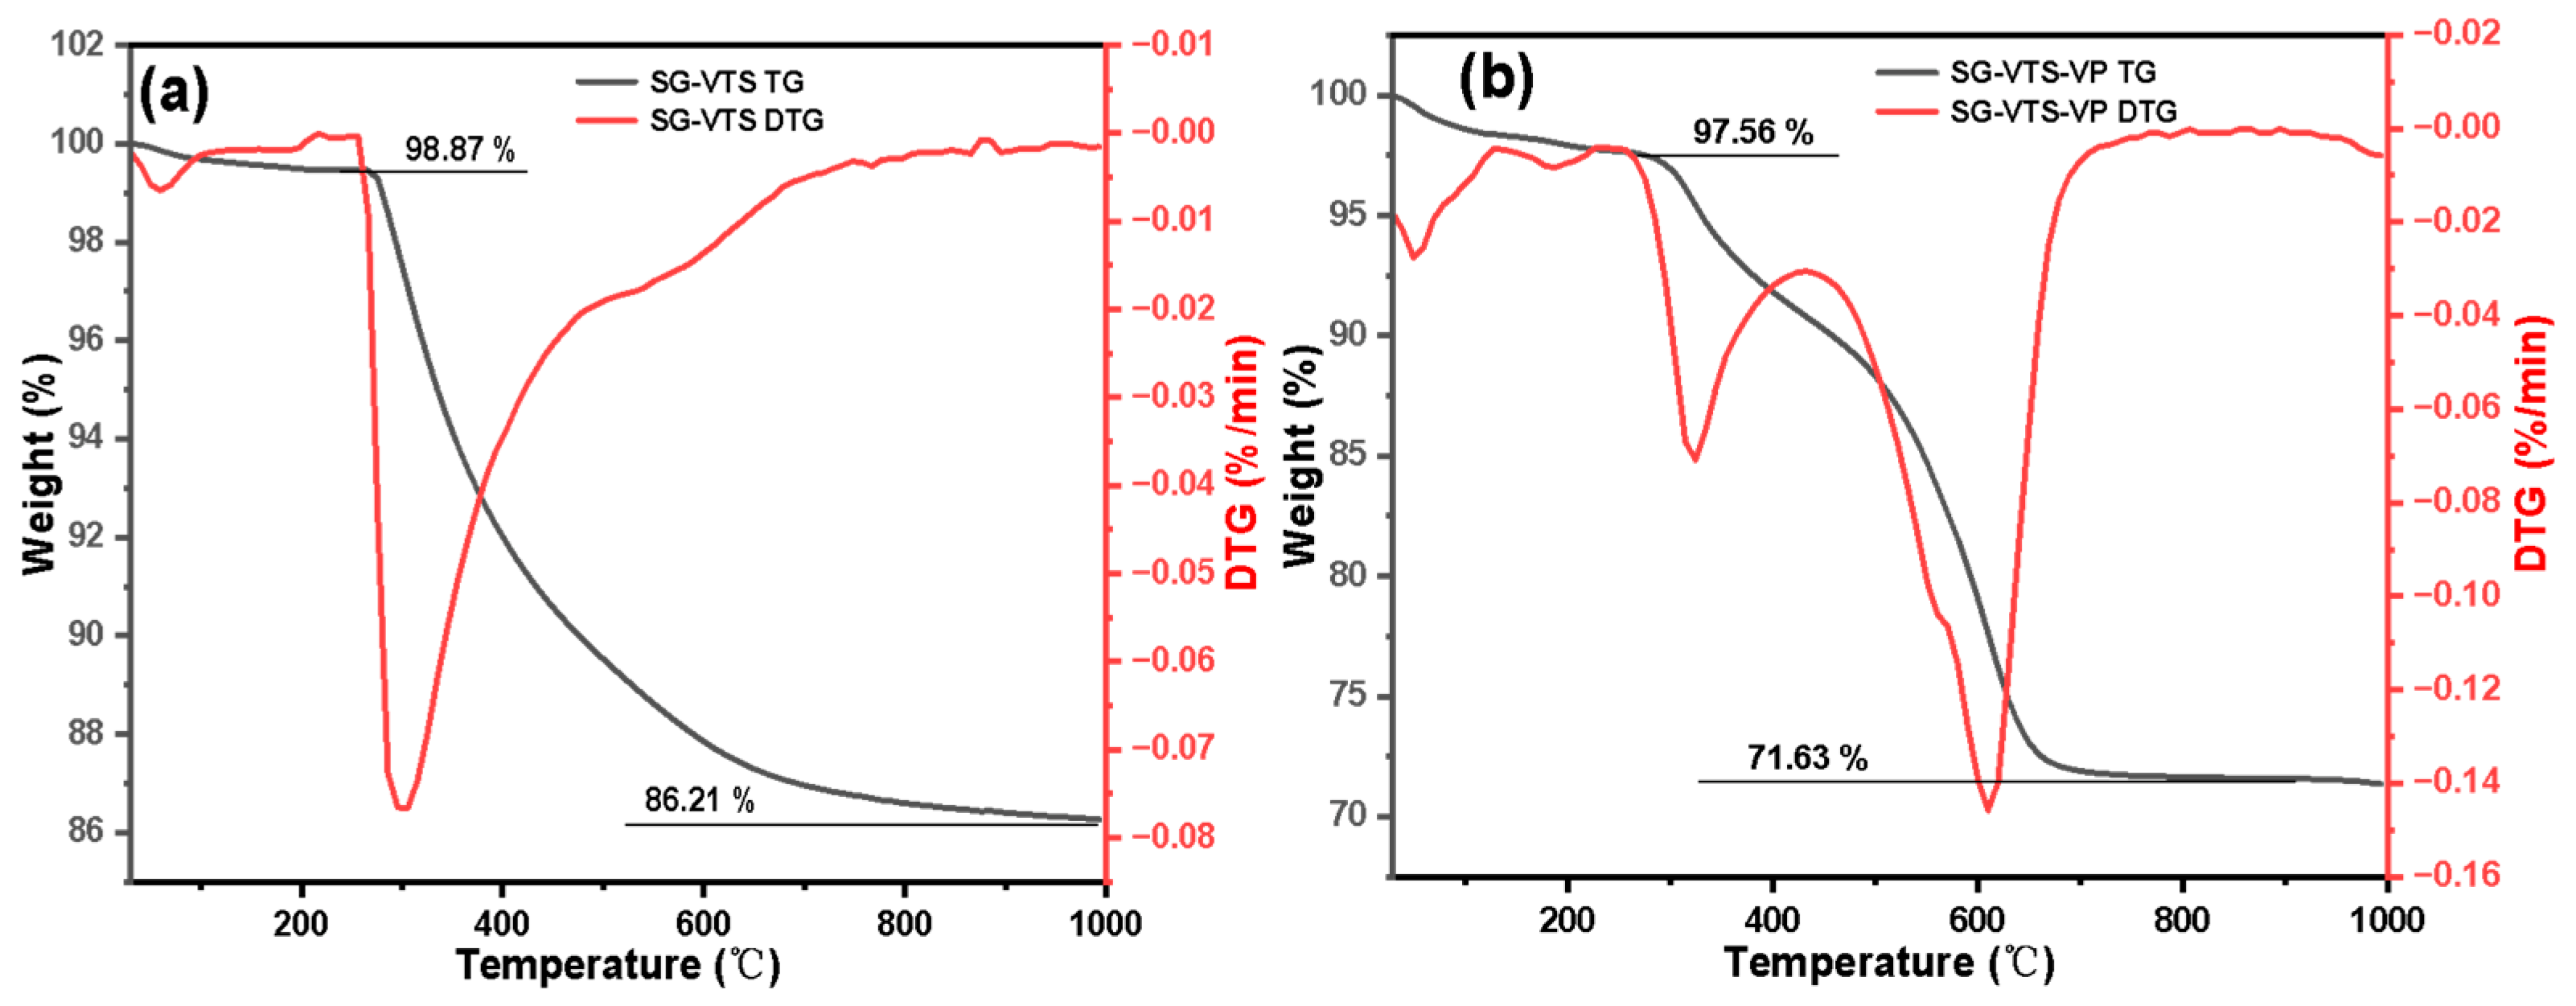
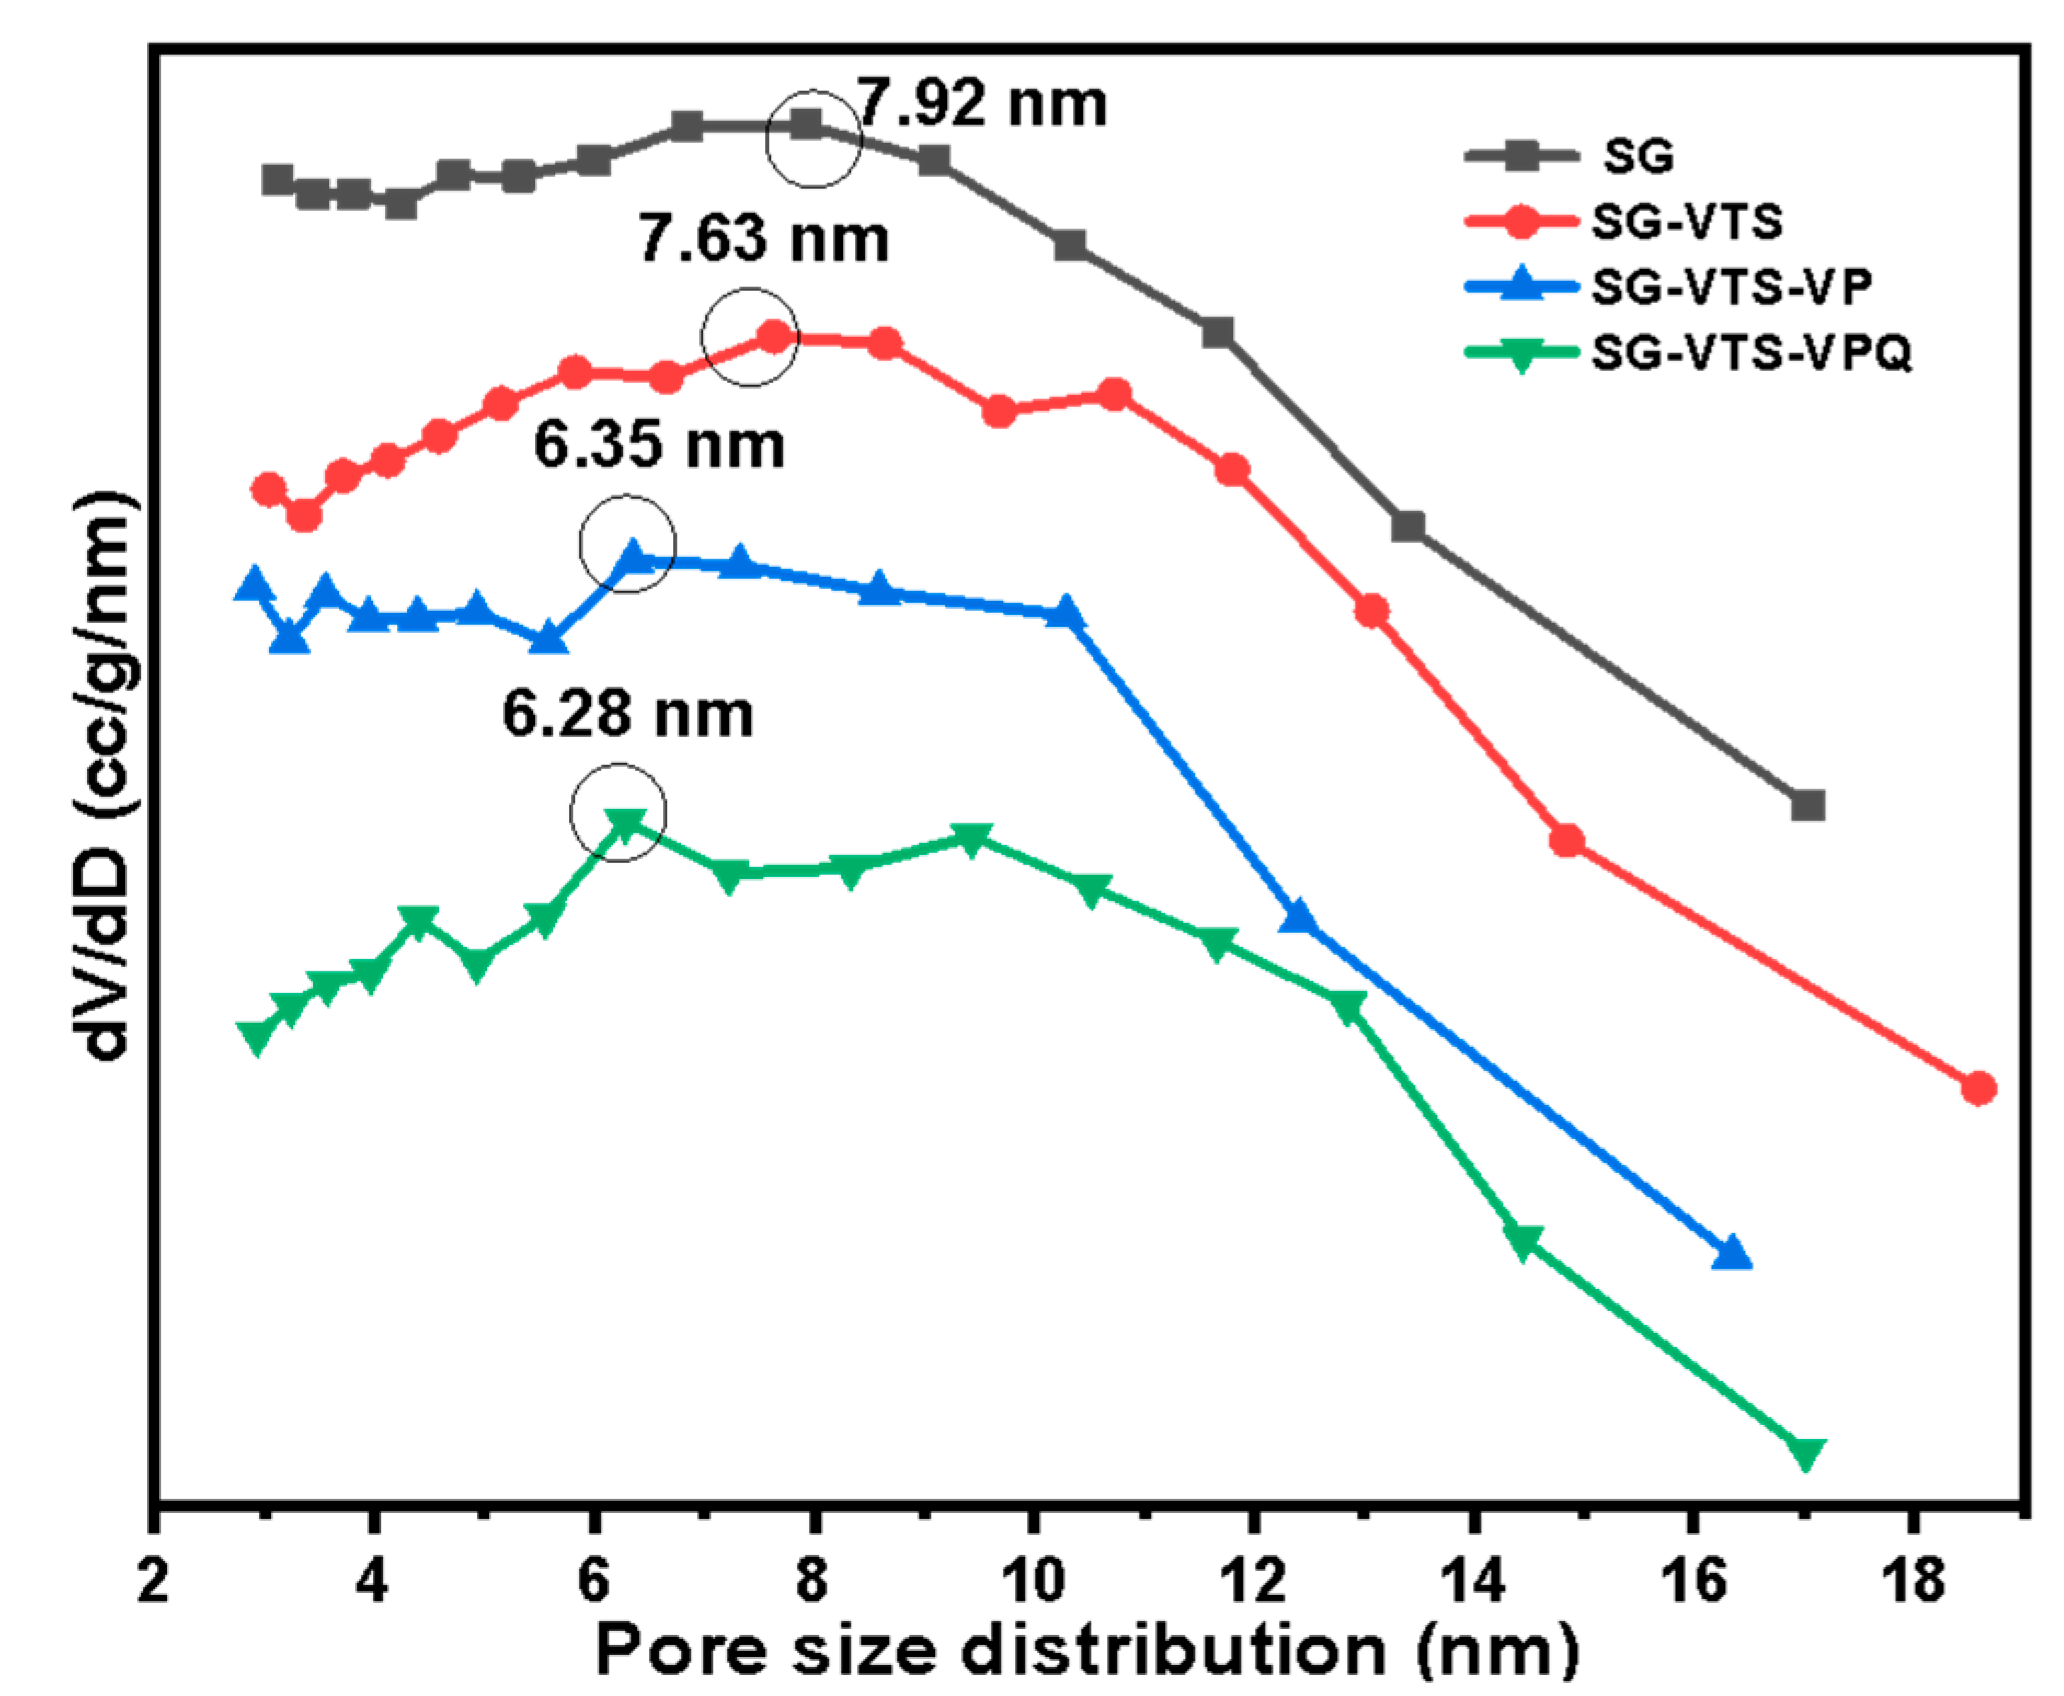
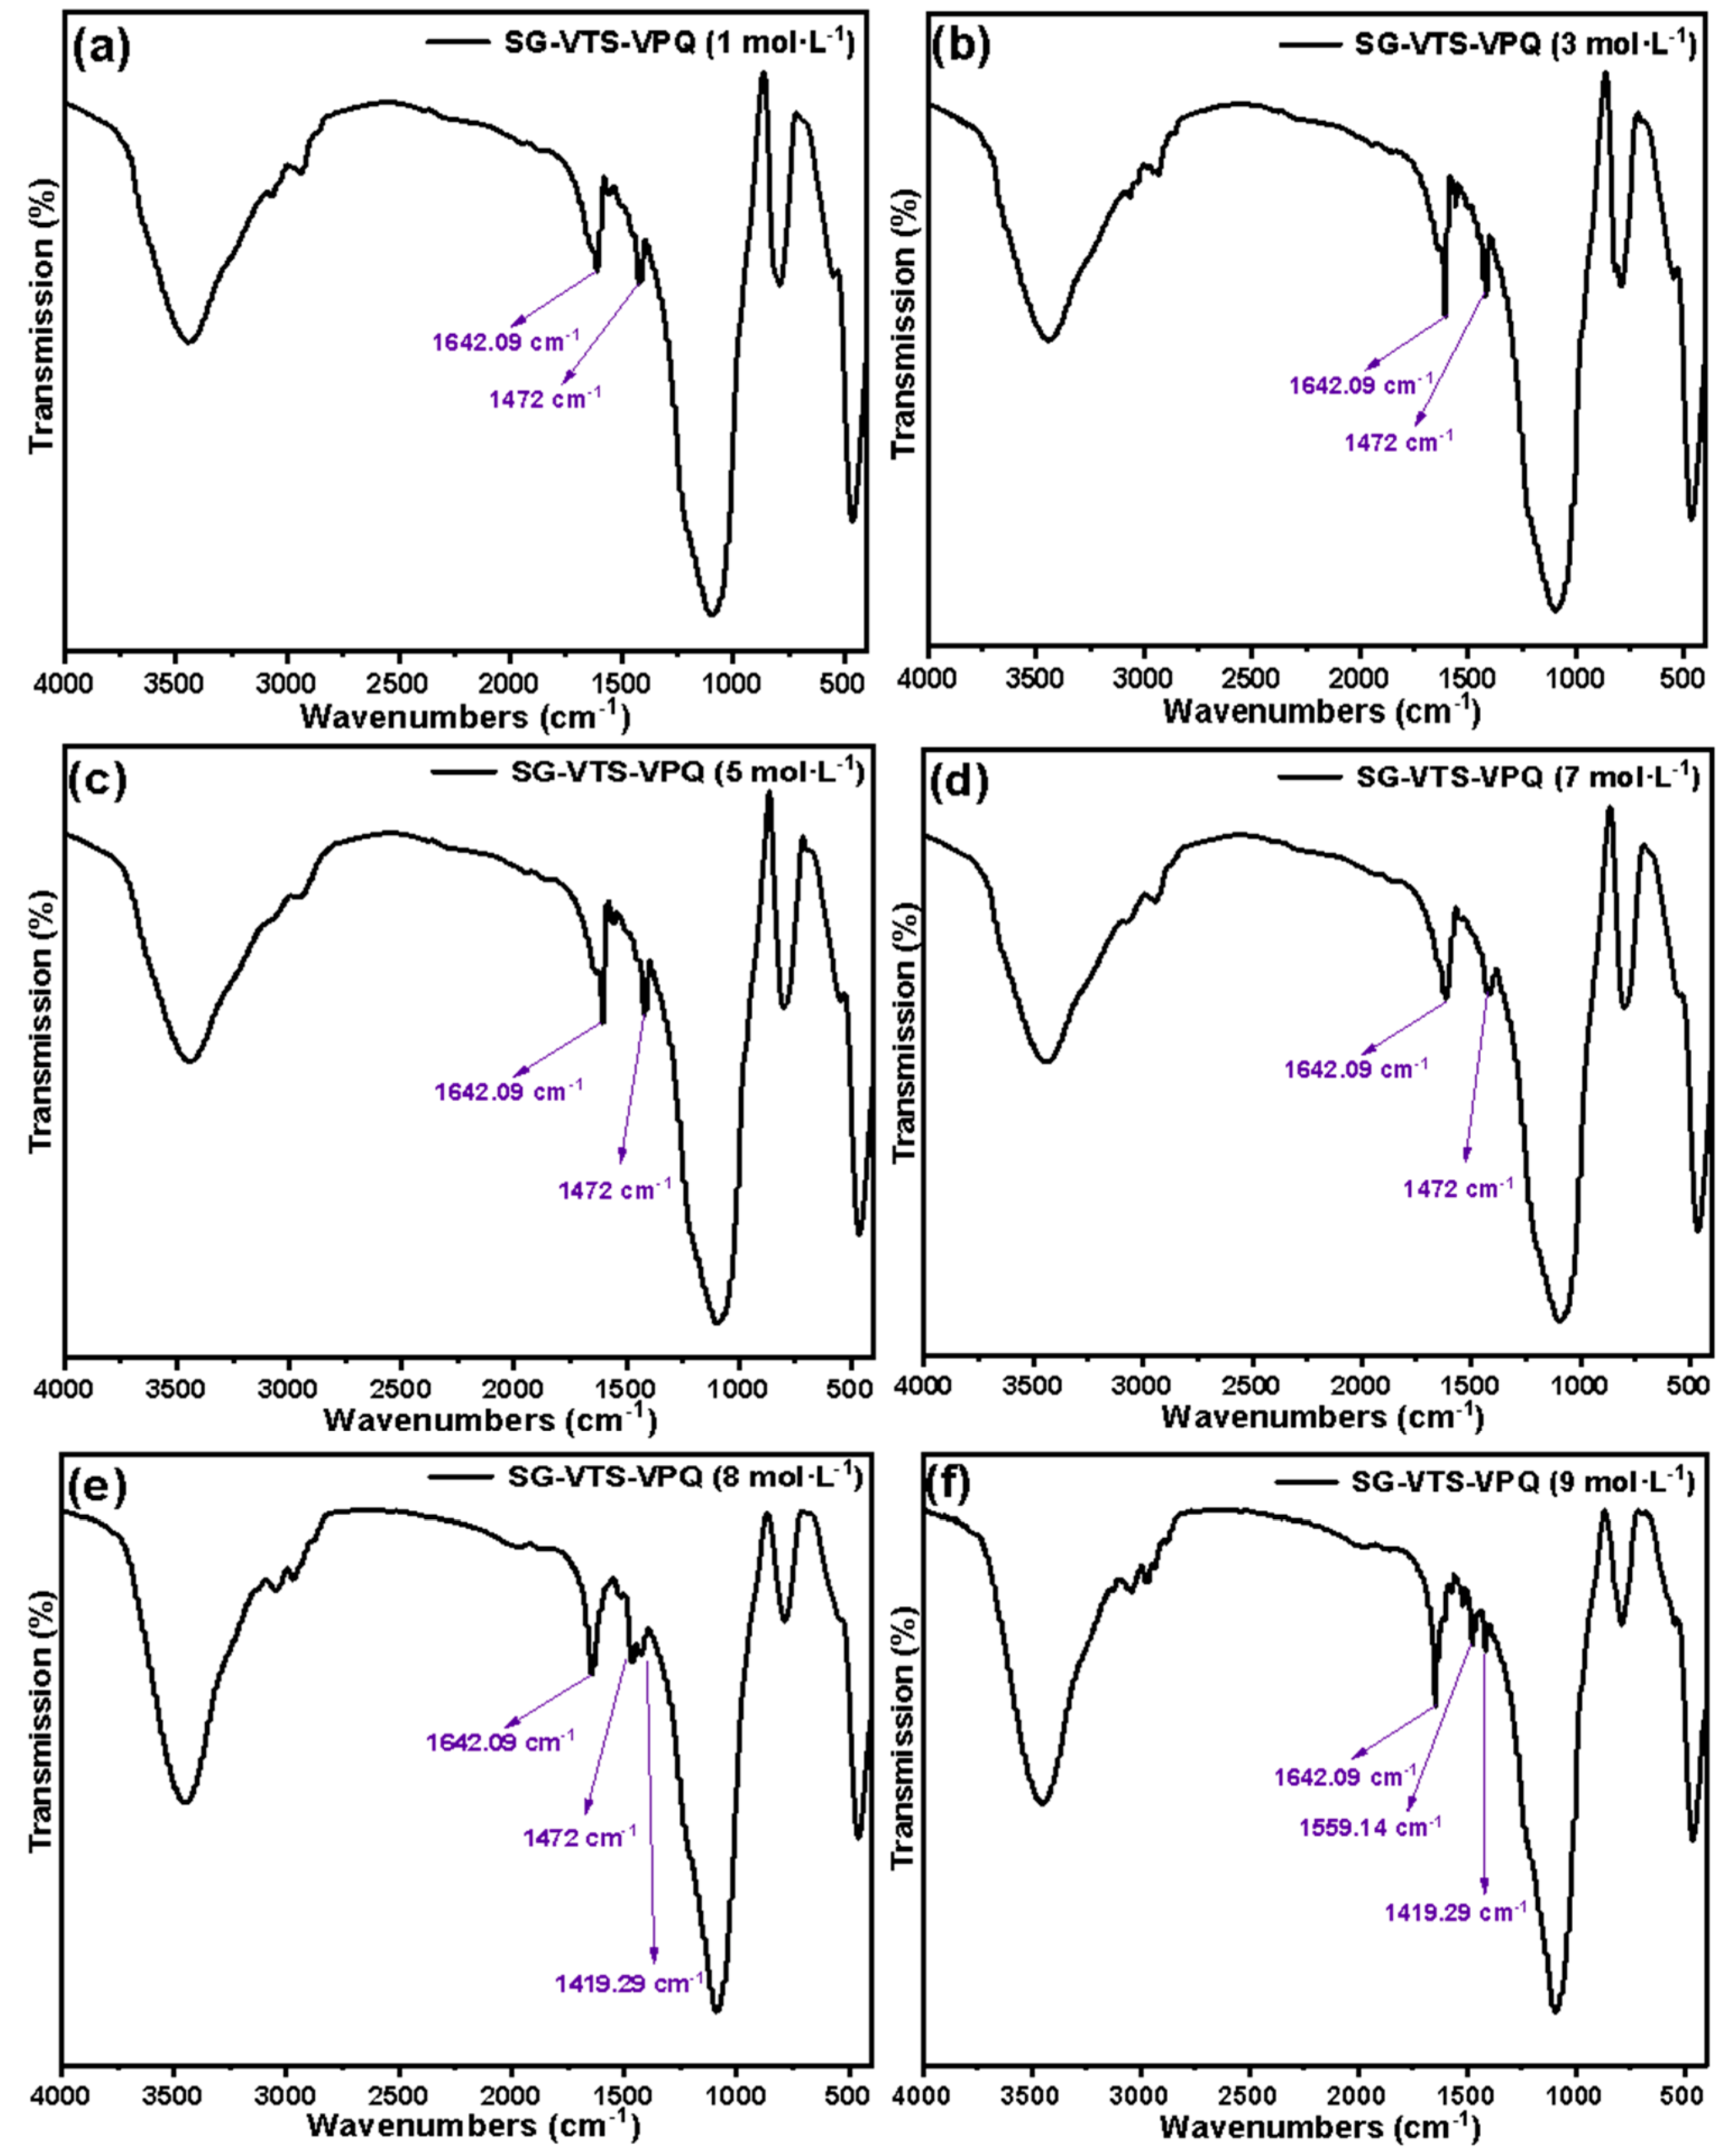
3.1. Characterization of Silicon-Based Quaternized Material
3.2. Optimal Experimental Results of Graft Polymerization
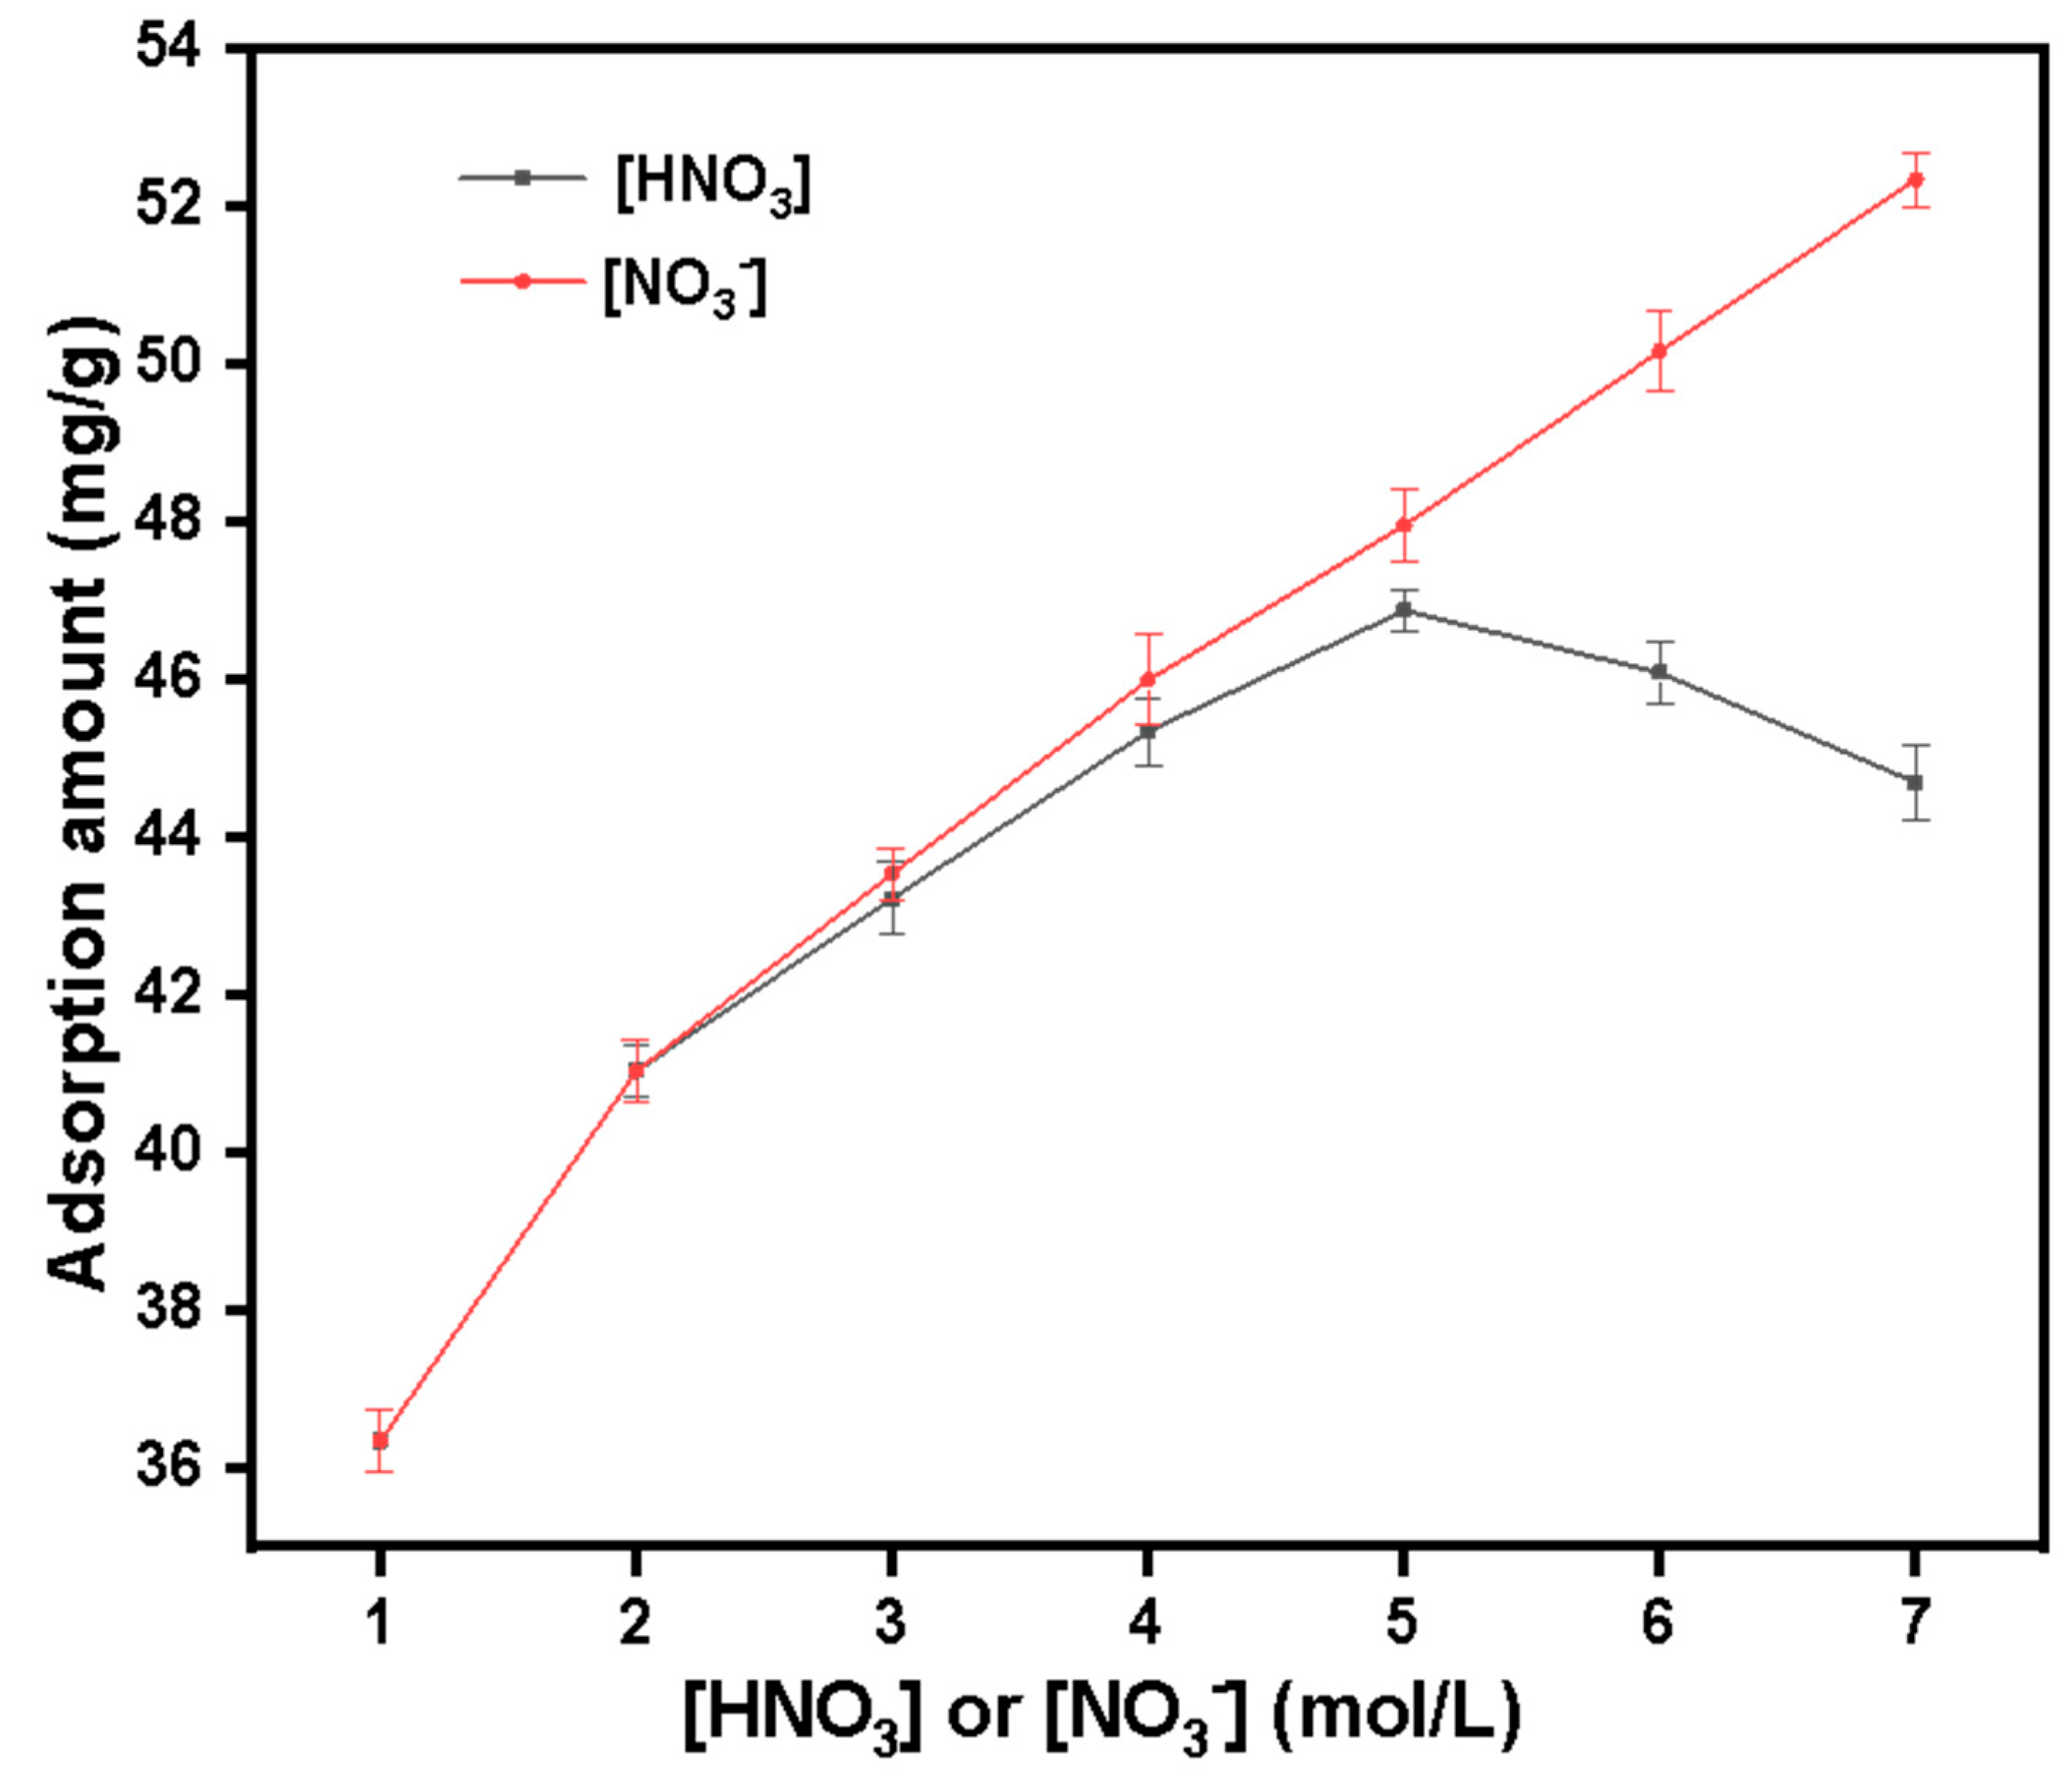
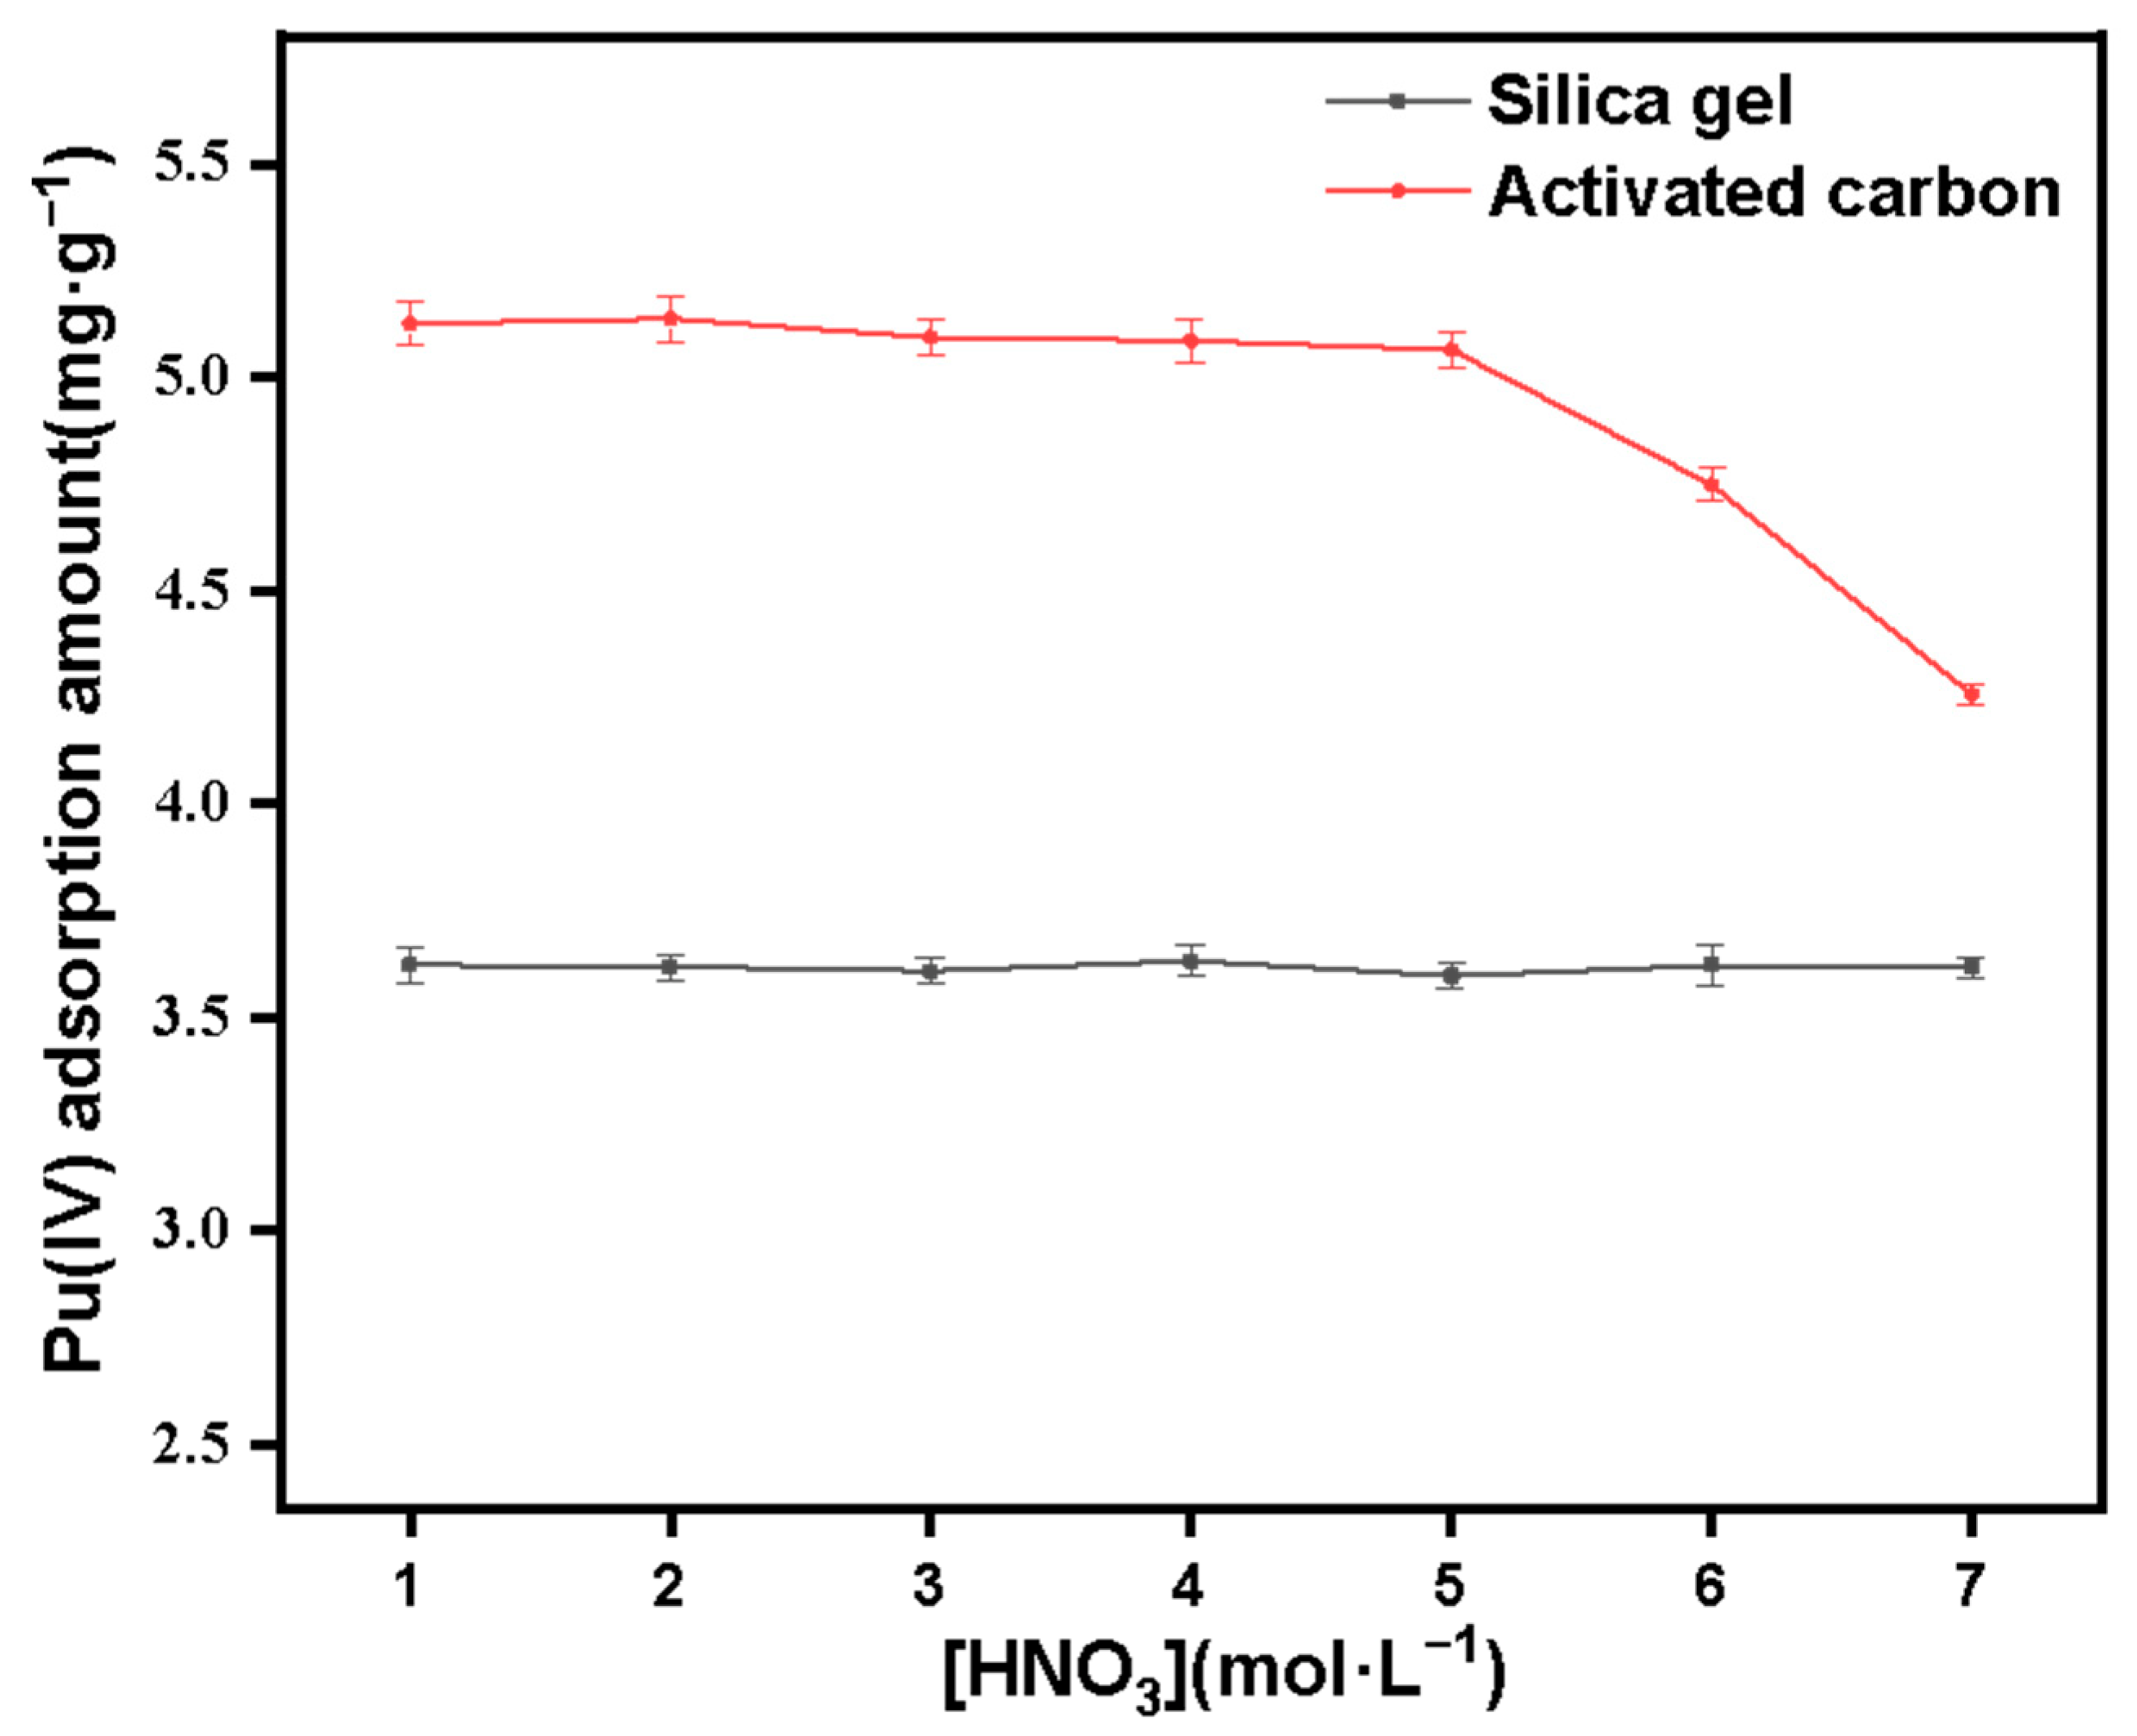
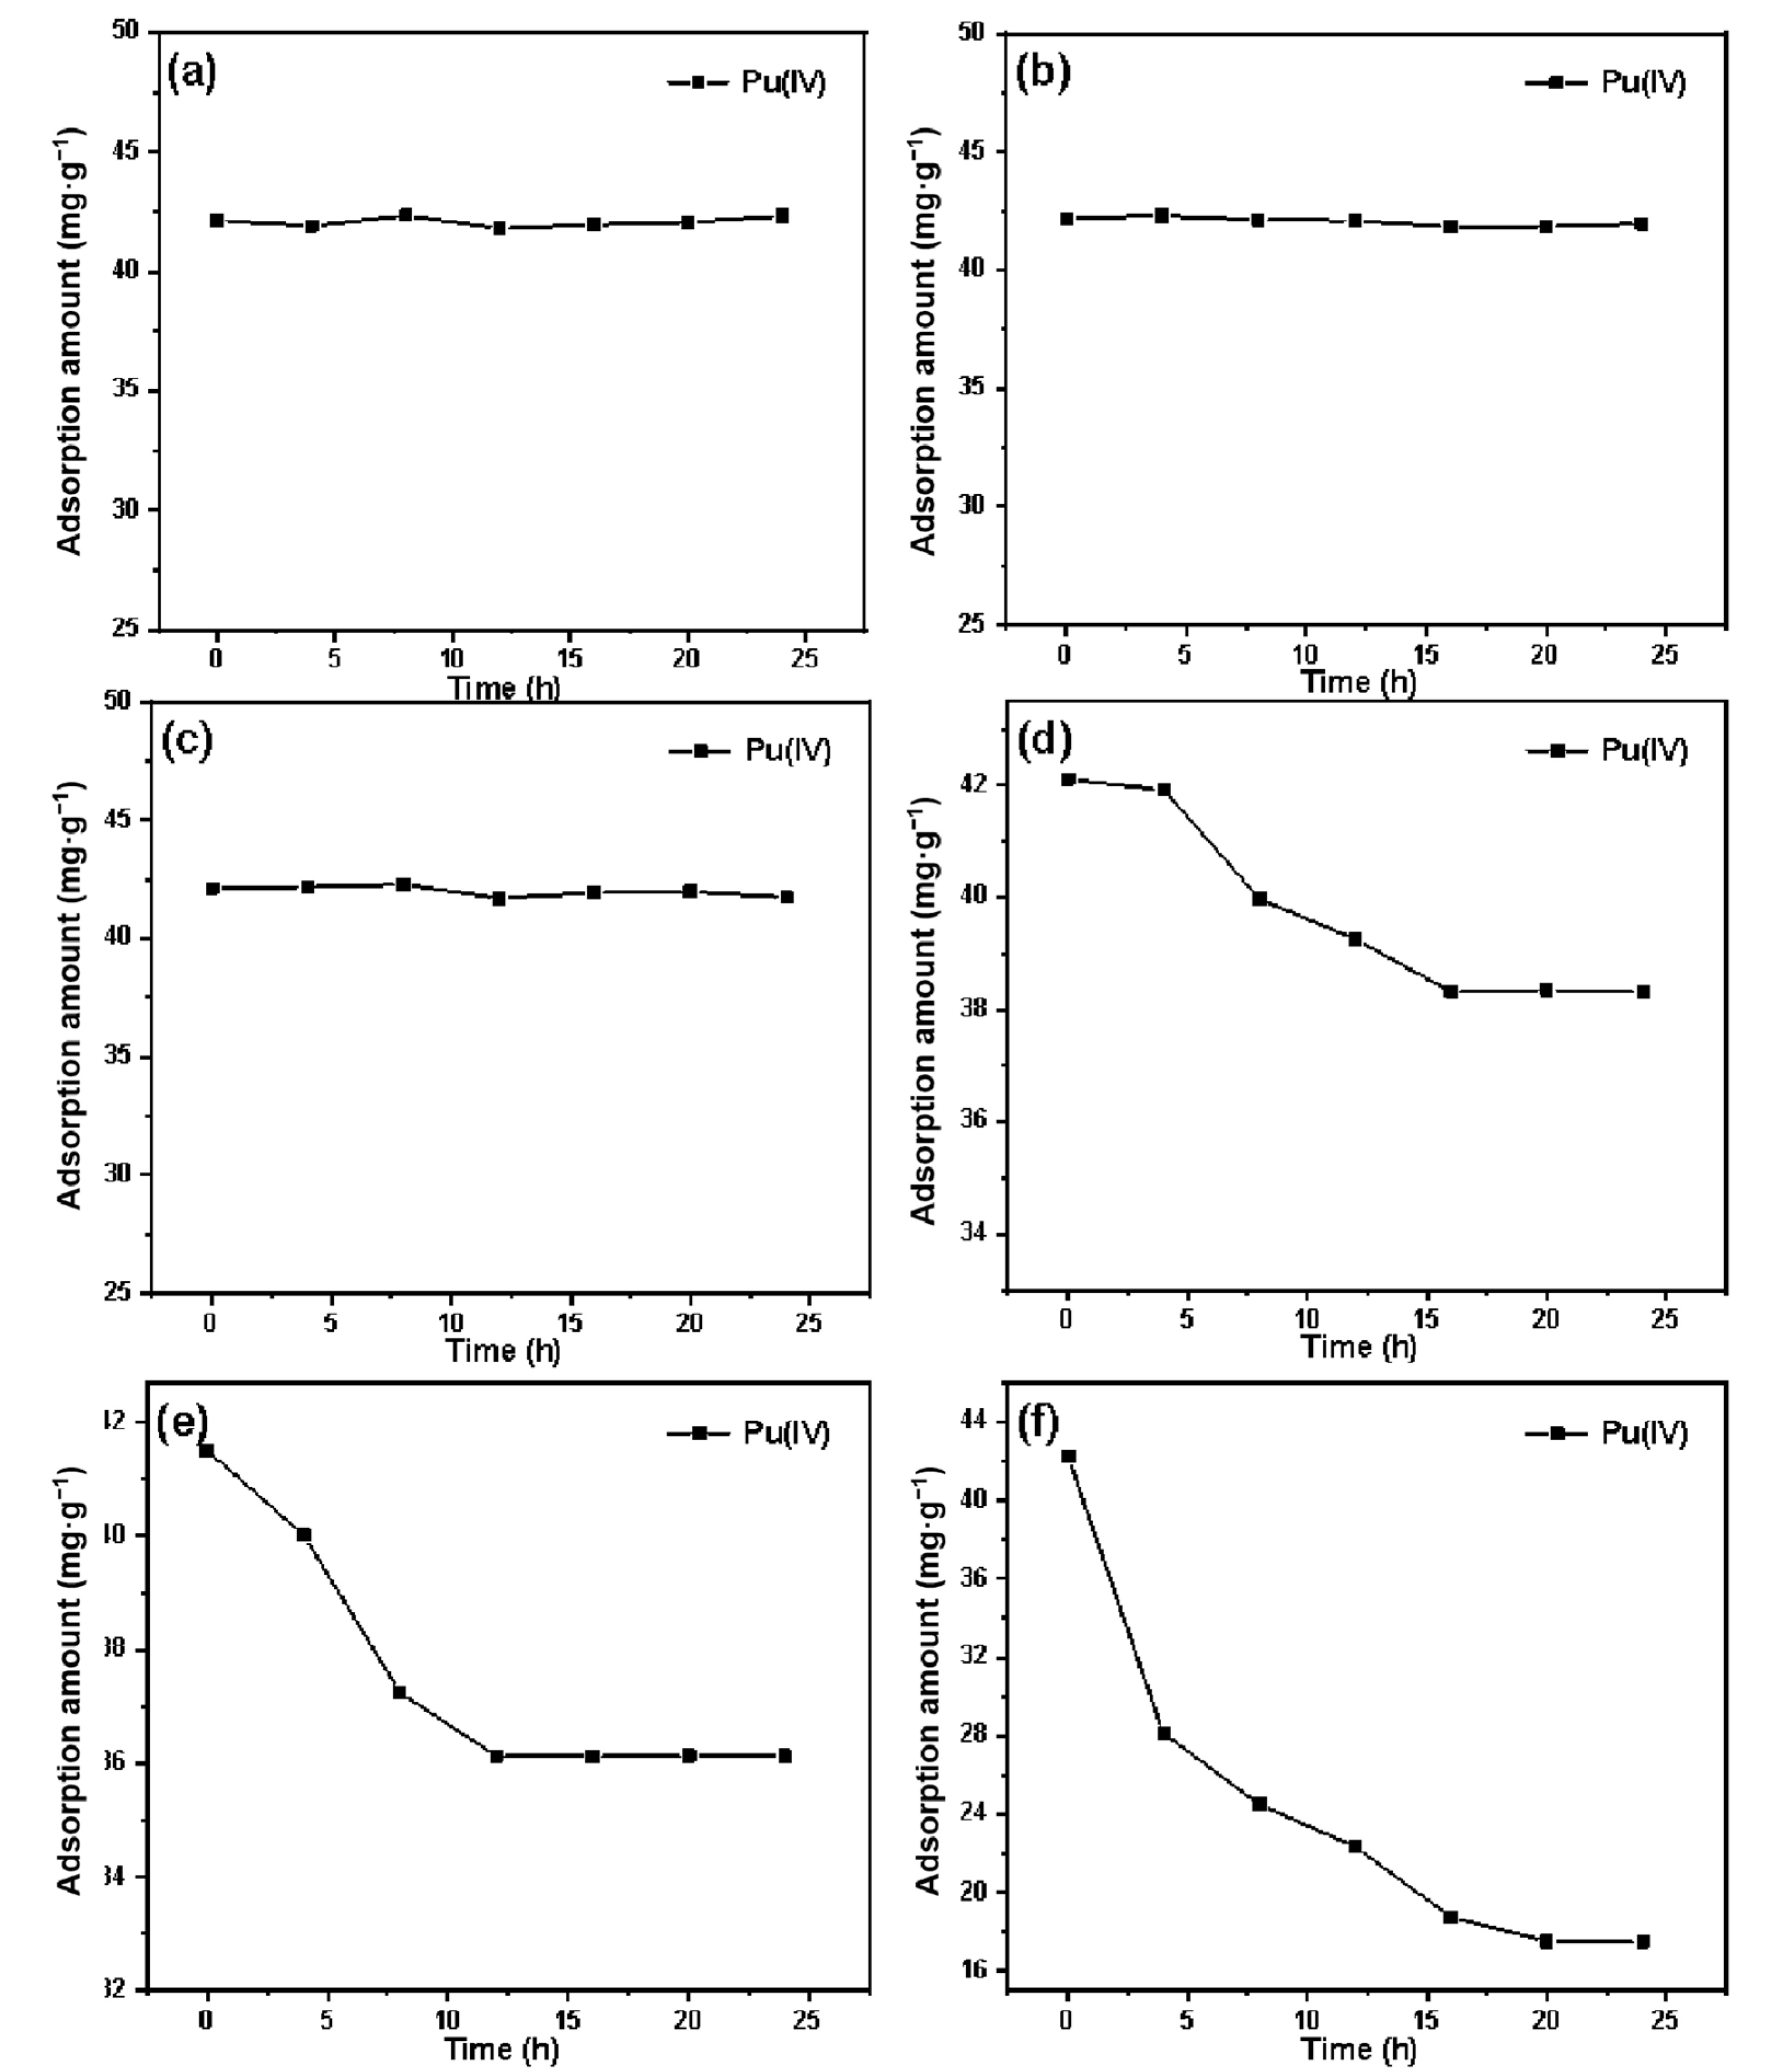
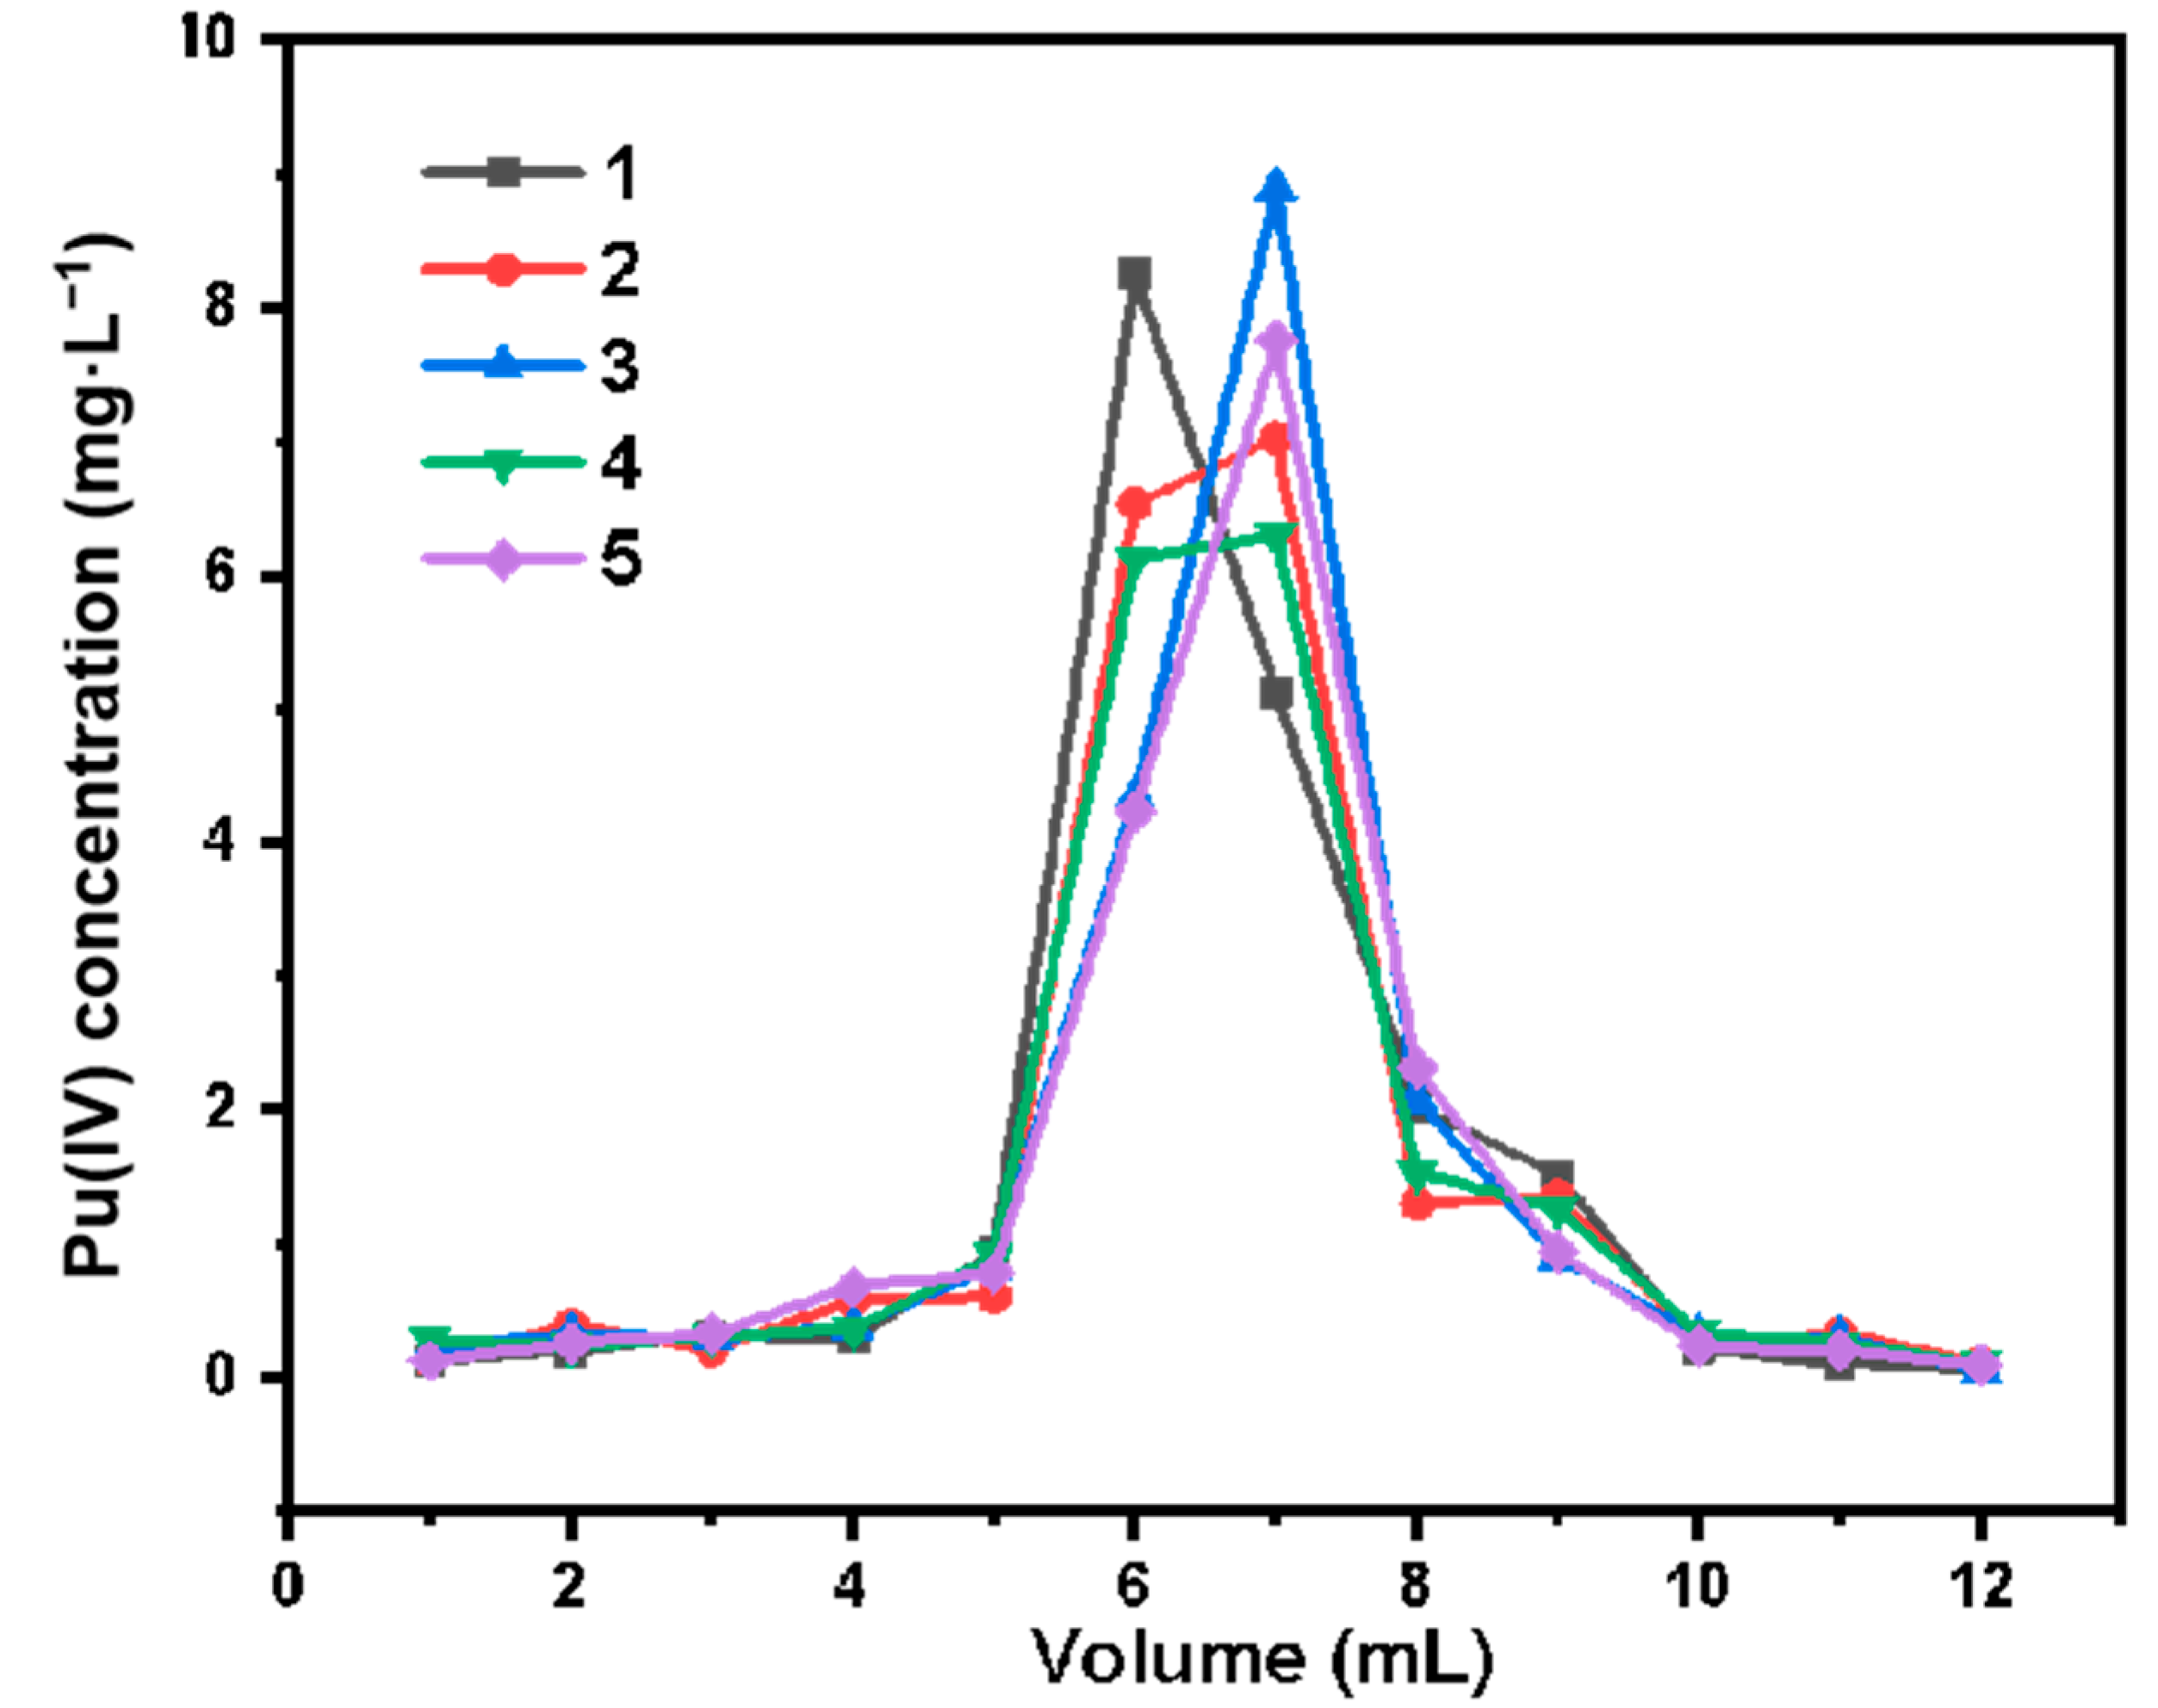
3.3. Study on the Adsorption Performance of Silicon-Based Quaternized Material for Pu(IV)
4. Conclusions
Author Contributions
Funding
Institutional Review Board Statement
Informed Consent Statement
Data Availability Statement
Acknowledgments
Conflicts of Interest
Sample Availability
References
- Topin, S.; Aupiais, J. The pentavalent actinide solution chemistry in the environment. J. Environ. Radioact. 2016, 153, 237–244. [Google Scholar] [CrossRef] [PubMed]
- Govindan, P.; Vijayan, K.; Kumar, G. Recovery and purification of plutonium in lean plutonium product stream obtained during reprocessing of fast reactor spent fuels. J. Radioanal. Nucl. Chem. 2013, 295, 307–313. [Google Scholar] [CrossRef]
- Pathak, S.; Pius, I.; Mukerjee, S. Studies on sorption of plutonium from carbonate medium on polyacrylhydroxamic acid resin. J. Radioanal. Nucl. Chem. 2013, 293, 483–488. [Google Scholar] [CrossRef]
- Eitrheim, E.; Knight, A.; Andrew, B. Separation of gallium and actinides in plutonium nuclear materials by extraction chromatography. J. Radioanal. Nucl. Chem. 2014, 303, 123–130. [Google Scholar] [CrossRef]
- Ryan, J. Concentration and final purification of neptunium by anion exchange. Off. Sci. Tech. Inf. 1959, 6, 13–29. [Google Scholar]
- Kuwabara, J.; Yamamoto, M.; Oikawa, S. Measurements of 99Tc, 137Cs, 237Np, Pu isotopes and 241Am in sediment cores from intertidal coastal and estuarine regions in the Irish Sea. J. Radioanal. Nucl. Chem. 1999, 240, 593–601. [Google Scholar] [CrossRef]
- Jakopic, R.; Tavcar, P.; Benedik, L. Sequential determination of Pu and Am radioisotopes in environmental samples; a comparison of two separation procedures. Appl. Radiat. Isot. 2007, 65, 504. [Google Scholar] [CrossRef]
- Bo, Y.; Wen, M.; Chen, J. Synthesis, structure characterization, and ion exchange properties of a novel open-framework ecomaterial silicotitanate. Rare Met. 2002, 21, 170–174. [Google Scholar]
- Kim, H.; Lim, J.; Chung, K. Analytical method for the determination of gross beta, 90Sr, 226Ra and Pu isotopes in environmental samples. J. Radioanal. Nucl. Chem. 2017, 11, 219–225. [Google Scholar] [CrossRef]
- Lee, M.; Park, T.; Park, J. Radiochemical separation of Pu, U, Am and Sr isotopes in environmental samples using extraction chromatographic resins. J. Radioanal. Nucl. Chem. 2013, 295, 1419–1422. [Google Scholar] [CrossRef]
- Maxwell, S.; Culligan, B.; Jones, V. Determination of 237Np and Pu isotopes in large soil samples by inductively coupled plasma mass spectrometry. Anal. Chim. Acta 2010, 682, 130–136. [Google Scholar] [CrossRef] [PubMed] [Green Version]
- Pant, A.; Ruhela, R.; Tomar, B. Determination of 90Sr in environmental samples using solid phase extraction chromatography. J. Radioanal. Nucl. Chem. 2019, 322, 49–55. [Google Scholar] [CrossRef]
- Puanngam, M.; Unob, F. Preparation and use of chemically modified MCM-41 and silica gel as selective adsorbents for Hg(II) ions. J. Hazard. Mater. 2008, 154, 578–587. [Google Scholar] [CrossRef] [PubMed]
- Emami, M.; Bikas, R.; Noshiranzadeh, N. Cu(II)-Hydrazide Coordination Compound Supported on Silica Gel as an Efficient and Recyclable Heterogeneous Catalyst for Green Click Synthesis of βHydroxy-1,2,3-triazoles in Water. ACS Omega 2020, 5, 13344–13357. [Google Scholar] [CrossRef]
- Voort, P.; Gillis-D’Hamers, I.; Vansant, E. Estimation of the distribution of surface hydroxyl groups on silica gel, using chemical modification with trichlorosilane. J. Chem. Soc. Faraday Trans. 1990, 86, 3751–3763. [Google Scholar] [CrossRef]
- Ying, Z.; Qu, R.; Sun, C. Chemical modification of silica-gel with diethylenetriamine via an end-group protection approach for adsorption to Hg(II). Appl. Surf. Sci. 2009, 255, 5818–5826. [Google Scholar]
- Incili, G.; Ayc, K. Chemical modification of silica gel with synthesized Schiff base hydrazone derivative and application for preconcentration and separation of U(VI) ions from aqueous solutions. J. Radioanal. Nucl. Chem. 2014, 301, 417–426. [Google Scholar] [CrossRef]
- Wang, S.; Ning, S.; Zhang, W. Synthesis of carboxyl group functionalized silica composite resin for strontium removal. Mater. Des. 2019, 185, 108–121. [Google Scholar] [CrossRef]
- Chen, L.; Ning, S.; Huang, Y. Effects of speciation on uranium removal efficiencies with polyamine-functionalized silica composite adsorbent in groundwater. J. Clean. Prod. 2020, 256, 120–134. [Google Scholar] [CrossRef]
- Wang, Z.; Liu, M.; Chang, Z. Study on the graft modification mechanism of macroporous silica gel surface based on silane coupling agent vinyl triethoxysilane. RSC Adv. 2021, 11, 25158–25169. [Google Scholar] [CrossRef]
- Wang, A.; Li, H.; Xiao, J. Integration of Theory and Experiment on Mesoporous Nickel Sulfide Microsphere for Hydrogen Evolution Reaction. Sustain. Chem. Eng. 2018, 7, 692–706. [Google Scholar] [CrossRef]
- Wang, A.; Lu, Y.; Yi, Z. Selective production of γ-valerolactone and valeric acid in one-pot bifunctional metal catalysts. ChemistrySelect 2018, 3, 1097–1101. [Google Scholar] [CrossRef]
- Mckay, Y. Pseudo-second order model for sorption processes. Process Biochem. 1999, 34, 451–465. [Google Scholar]
- Lagergren, S. About the theory of so-called adsorption of solution substances. K. Sven. Vetensk. Handl. Band 1998, 24, 147–156. [Google Scholar]
- Low, M. Kinetics of Chemisorption of Gases on Solids. Chem. Rev. 1960, 60, 267–312. [Google Scholar] [CrossRef]
- Qiu, R.; Wang, X.; Cheng, F. Adsorption kinetics and isotherms of ammonia-nitrogen on steel slag. Desalination Water Treat. 2015, 55, 142–150. [Google Scholar] [CrossRef]
- Tian, Y.; Wu, M.; Lin, X.; Huang, P. Synthesis of magnetic wheat straw for arsenic adsorption. J. Hazard. Mater. 2011, 193, 10–16. [Google Scholar] [CrossRef]
- Rao, R.; Khan, M. Removal and recovery of Cu(II), Cd(II) and Pb(II) ions from single and multimetal systems by batch and column operation on neem oil cake (NOC). Sep. Purif. Technol. 2007, 57, 394–402. [Google Scholar] [CrossRef]
- Xu, Y.; Kim, S.; Ito, T. Adsorption behavior of platinum group metals onto a silica-based (Crea+Dodec)/SiO2-P extraction resin from simulated high level liquid waste. Sep. Sci. Technol. 2015, 50, 260–266. [Google Scholar] [CrossRef]
- Jermakowicz-Bartkowiak, D.; Kolarz, B. Poly(4-vinylpyridine) resins towards perrhenate sorption and desorption. React. Funct. Polym. 2011, 21, 573–589. [Google Scholar] [CrossRef]
- Afonin, A.; Ushakov, I.; Simonenko, D. 1H and 13C NMR study of bifurcated intramolecular hydrogen bonds in 2,6-bis(2-pyrrolyl)pyridine and 2,6-bis(1-vinyl-2-pyrrolyl)pyridine. Russ. J. Org. Chem. 2005, 40, 1516–1521. [Google Scholar] [CrossRef]
- Öztürk, S. Synthesis and corrosion inhibition effects of quinazolin-(3H)-4-one derivatives containing long-chain pyridinium salts on carbon steel in 1.5 M HCl. Prot. Met. Phys. Chem. Surf. 2017, 53, 920–927. [Google Scholar] [CrossRef]
- Patel, M.; Patel, R.; Chi, W. Antibacterial behaviour of quaternized poly(vinyl chloride)-g-poly(4-vinyl pyridine) graft copolymers. Polym. Sci. 2015, 33, 265–274. [Google Scholar] [CrossRef]
- Xiong, L.; Hu, Y.; Zheng, Z. Chloromethylation and quaternization of poly(aryl ether ketone sulfone)s with clustered electron-rich phenyl groups for anion exchange membranes. Chin. J. Polym. Sci. 2020, 38, 95–104. [Google Scholar] [CrossRef]
- Park, E.; Lee, S.; Canlier, A. Controlled dehydrochlorination of poly(vinyl chloride) for fabrication of membranes with polyacetylene-like structure: XPS analysis and ion exchange membrane discussion. Macromol. Res. 2019, 27, 152–160. [Google Scholar] [CrossRef]
- Lin, Q.; Zhang, Y.; Lin, H. Effect of modified iodine on defect structure and antibacterial properties of ZnO in visible light. Res. Chem. Intermed. 2017, 43, 629–643. [Google Scholar] [CrossRef]
- Sunday, D.; Curras-Medina, S.; Green, D. Impact of initiator spacer length on grafting polystyrene from silica nanoparticles. Macromolecules 2010, 43, 355–356. [Google Scholar] [CrossRef]
- Zhang, W.; Duan, S.; Zhang, Y. Enhanced selectivity in the conversion of acrolein to 3-picoline over bimetallic catalyst 4.6%Cu-1.0%Ru/HZSM-5 (38) with hydrogen as carrier gas. React. Kinet. Mech. Catal. 2019, 41, 927–941. [Google Scholar] [CrossRef]
- Cu, J.; Wei, Y.; Ye, M. Preparation of a new anion exchanger by pre-irradiation grafting technique and its adsorptive removal of rhenium (VII) as analogue to 99Tc. Nucl. Technol. 2015, 1, 65–71. [Google Scholar]
- Wang, W.; Tang, J.; Jia, Z. Grafting of amphiphilic polymers containing quaternary ammonium group on SiO2 surface via surface-initiated ATRP. J. Polym. Res. 2012, 19, 9804–9827. [Google Scholar] [CrossRef]
- Xu, X.; Zeng, Y.; Yu, C. Controlled RAFT polymerization of MMA in confined space of various pore sizes of SBA-15. J. Porous Mater. 2020, 27, 95–105. [Google Scholar] [CrossRef]
- Ryzhinsky, M.; Stepanov, A. Standard reference materials in analytical chemistry of uranium and plutonium. J. Radioanal. Nucl. Chem. 1991, 147, 27–32. [Google Scholar] [CrossRef]
- Sivakumar, P.; Meenakshi, S.; Rao, R. Partitioning of plutonium and uranium in aqueous medium using hydroxyurea as reducing agent. J. Radioanal. Nucl. Chem. 2012, 292, 603–608. [Google Scholar] [CrossRef]
- Wang, J.; Guo, X. Adsorption kinetic models: Physical meanings, applications, and solving methodsJournal of Hazardous Materials. J. Hazard. Mater. 2020, 390, 122156. [Google Scholar] [CrossRef] [PubMed]
- Aliabadi, M.; Irani, M.; Ismaeili, J.; Piri, H. Electrospun nanofiber membrane of PEO/Chitosan for the adsorption of nickel, cadmium, lead and copper ions from aqueous solution. Chem. Eng. J. 2013, 220, 237–243. [Google Scholar] [CrossRef]
- Huang, T.; Liu, L.; Zhang, S. Evaluation of electrokinetics coupled with a reactive barrier of activated carbon loaded with a nanoscale zero-valent iron for selenite removal from contaminated soils. J. Hazard. Mater. 2019, 368, 104–114. [Google Scholar] [CrossRef]
- Liu, B.; Shi, K.; Ye, G. Method development for plutonium analysis in environmental water samples using TEVA microextraction chromatography separation and low background liquid scintillation counter measurement. Microchem. J. 2016, 124, 824–830. [Google Scholar] [CrossRef]
- Zhang, X.; Lin, S.; Chen, Z. Kaolinite-supported nanoscale zero-valent iron for removal of Pb2+ from aqueous solution: Reactivity, characterization and mechanism. Water Res. 2011, 45, 3481–3488. [Google Scholar] [CrossRef]
- Jeon, C.; Baek, K.; Park, J. Adsorption characteristics of As(V) on iron-coated zeolite. J. Hazard. Mater. 2009, 163, 804–808. [Google Scholar] [CrossRef]
- Pavoni, B.; Giacometti, A.; Zanette, M. Assessment of organic chlorinated compound removal from aqueous matrices by adsorption on activated carbon. Water Res. 2006, 40, 3571–3579. [Google Scholar] [CrossRef]
- Peyravi, M. Preparation of adsorptive nanoporous membrane using powder activated carbon: Isotherm and thermodynamic studies. Front. Chem. Sci. Eng. 2019, 14, 765–779. [Google Scholar] [CrossRef]
- James, A.; Davis, M. Approaches to surface complexation modeling of Uranium(VI) adsorption on aquifer sediments. Geochim. Cosmochim. Acta 2004, 21, 213–222. [Google Scholar]


| Factor/Level | 1 | 2 | 3 |
|---|---|---|---|
| 4-VP dosage (A)/mL | 6 | 7 | 8 |
| Reaction temperature (B)/°C | 85 | 90 | 95 |
| Initiator AIBN dosage (C)/mg | 50 | 60 | 70 |
| Species | Pore Size (nm) | Specific Surface Area (m2·g−1) |
|---|---|---|
| SG | 7.92 | 540.9 |
| SG-VTS | 7.63 | 503.5 |
| SG-VTS-VP | 6.35 | 427.7 |
| SG-VTS-VPQ | 6.28 | 398.4 |
| Factors | Grafting Amount (mmol/g) | |||
|---|---|---|---|---|
| 4-vp Dosage (mL) | Temperature (°C) | Initiator Dosage (mg) | ||
| 1 | 1 | 1 | 1 | 1.131 |
| 2 | 2 | 2 | 2 | 1.172 |
| 3 | 3 | 3 | 3 | 1.168 |
| 4 | 1 | 2 | 3 | 1.153 |
| 5 | 2 | 3 | 1 | 1.156 |
| 6 | 3 | 1 | 2 | 1.169 |
| 7 | 1 | 3 | 2 | 1.166 |
| 8 | 2 | 1 | 3 | 1.147 |
| 9 | 3 | 2 | 1 | 1.136 |
| K1 | 3.45 | 3.447 | 3.423 | |
| K2 | 3.475 | 3.461 | 3.507 | |
| K3 | 3.473 | 3.49 | 3.468 | |
| K1 | 1.15 | 1.149 | 1.141 | |
| K2 | 1.158 | 1.154 | 1.169 | |
| K3 | 1.157 | 1.163 | 1.156 | |
| R | 0.008 | 0.014 | 0.028 | |
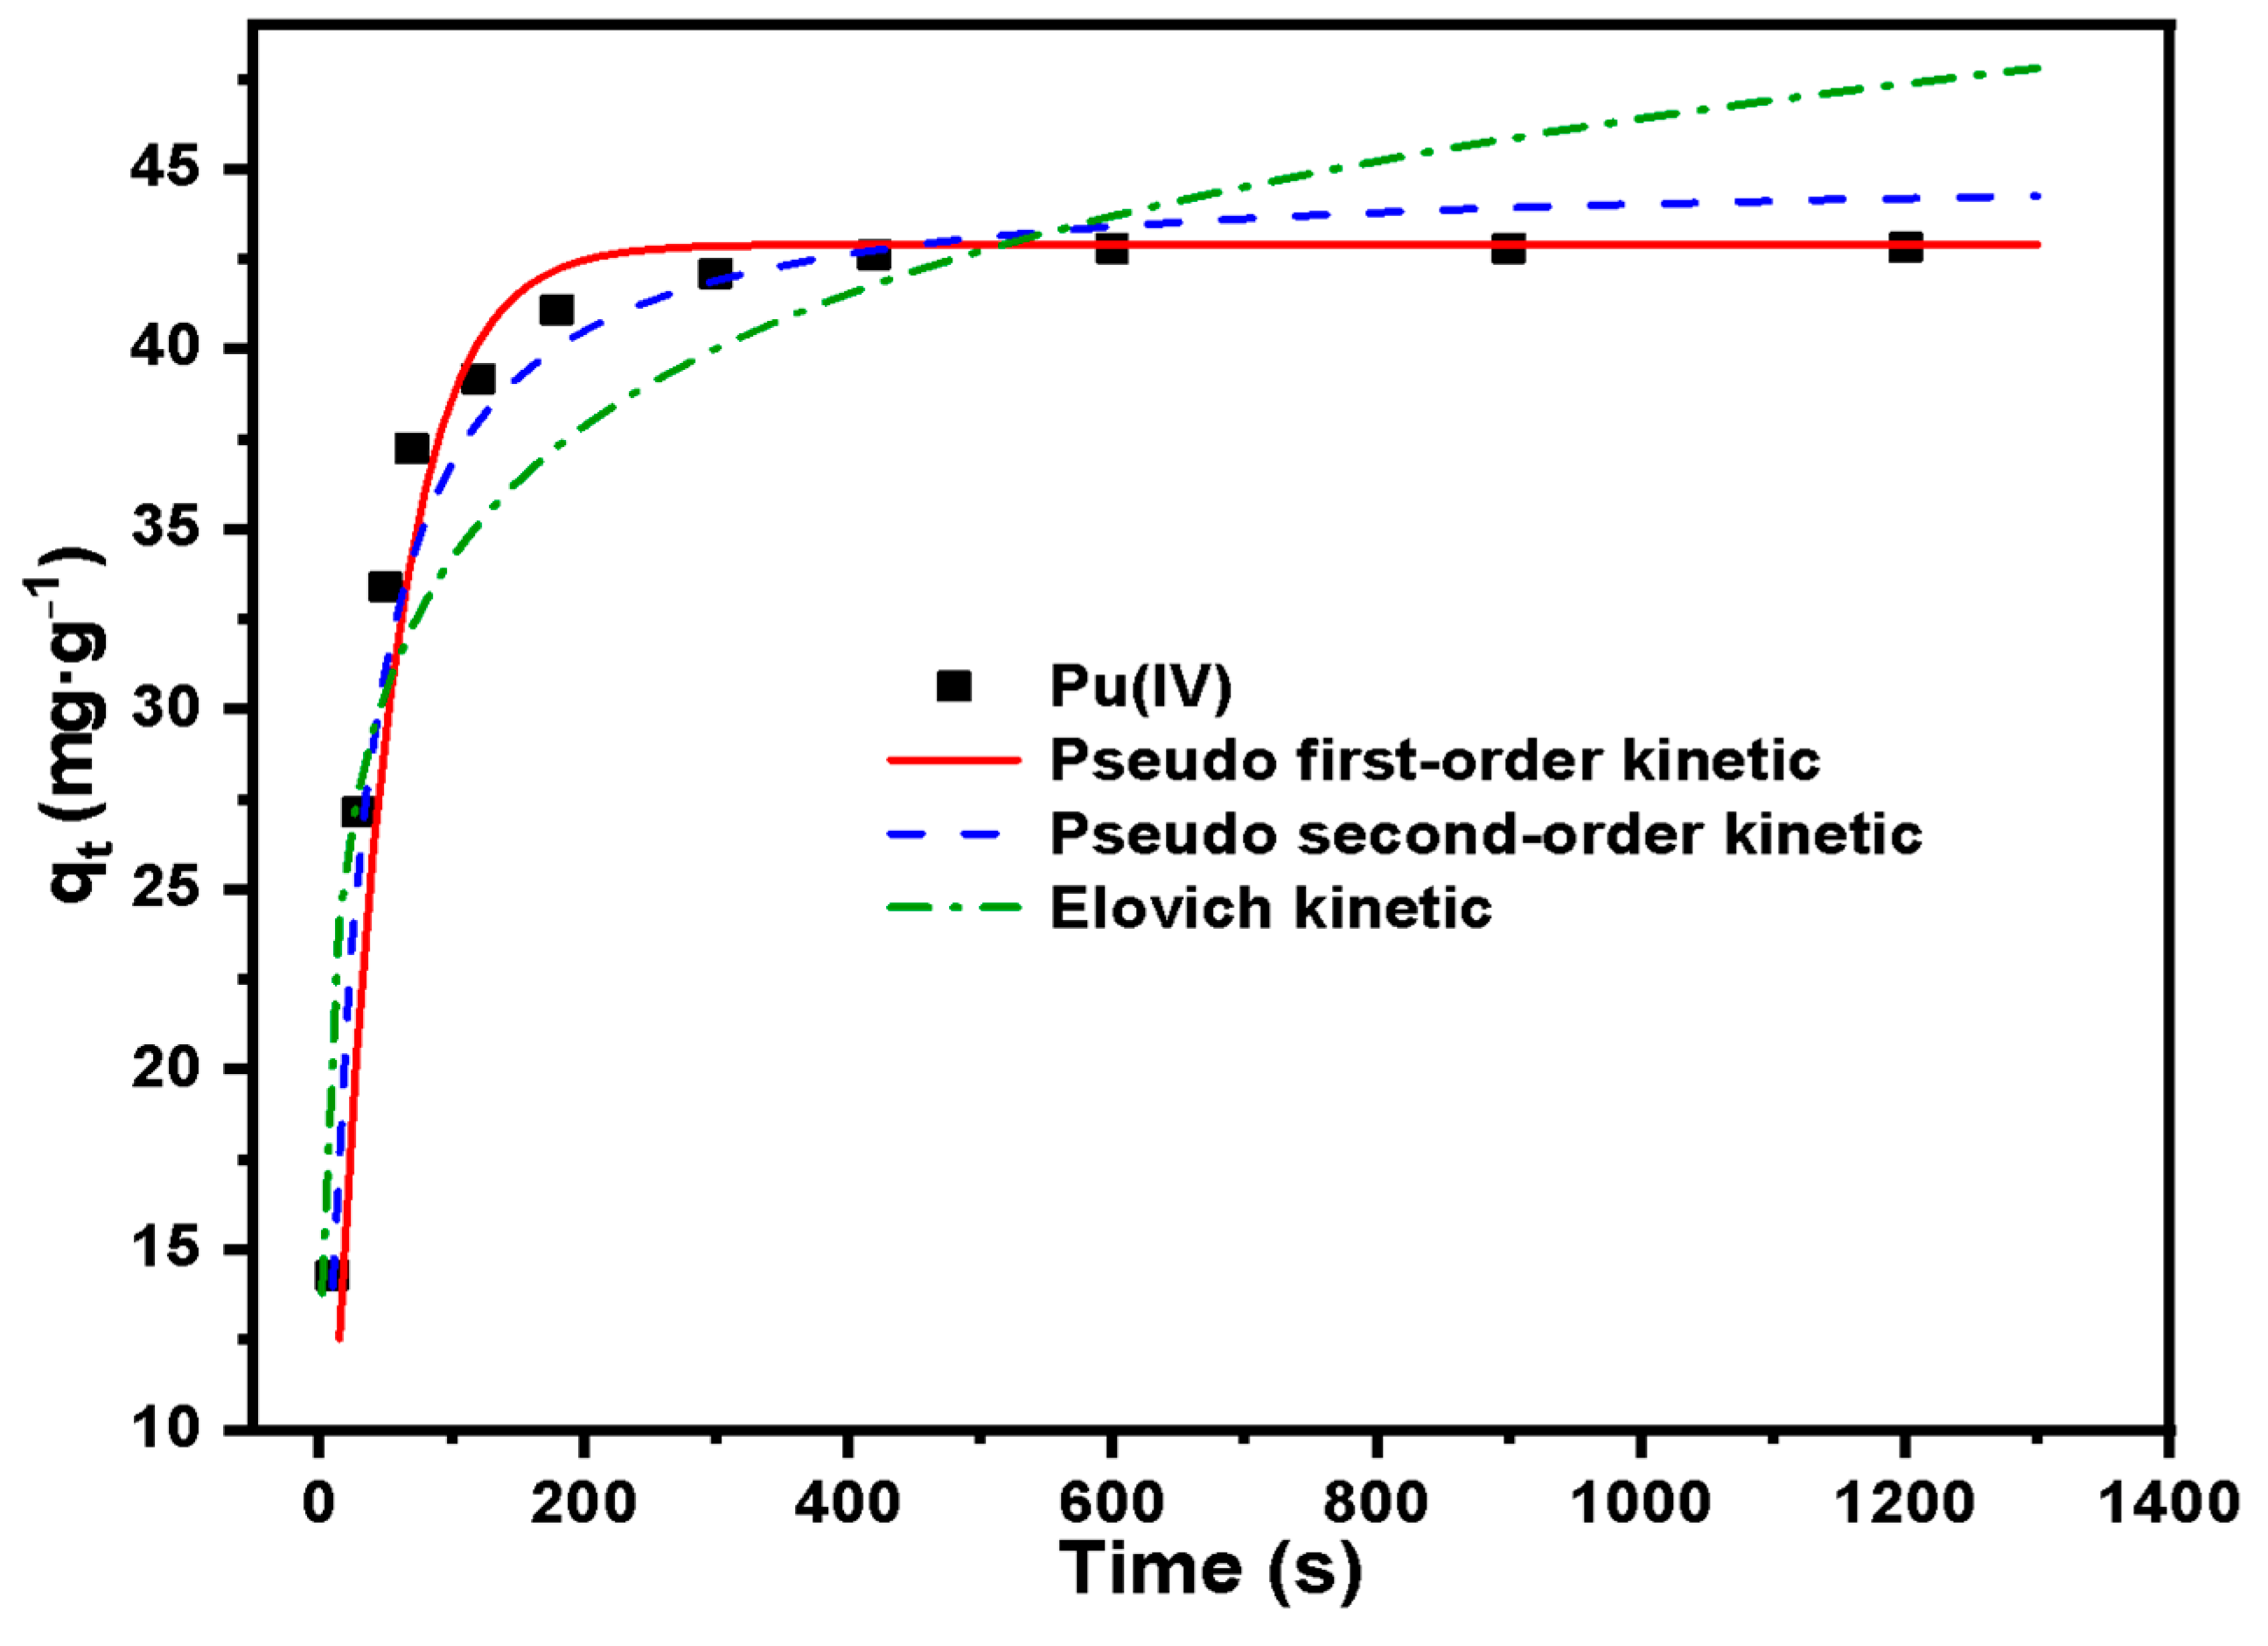
| Adsorption Kinetic Model | Parameters | Pu(IV) |
|---|---|---|
| Pseudo first-order | qe (mg·g−1) | 42.89 |
| K1 (s−1) | 0.023 | |
| R2 | 0.983 | |
| Pseudo second-order | qe (mg·g−1) | 45.07 |
| K2 (g·s·mg−1) | 0.001 | |
| R2 | 0.957 | |
| Elovich | αE (mg·(g·s)−1) | 1.483 |
| βE (g·mg−1) | 4.313 | |
| R2 | 0.930 |
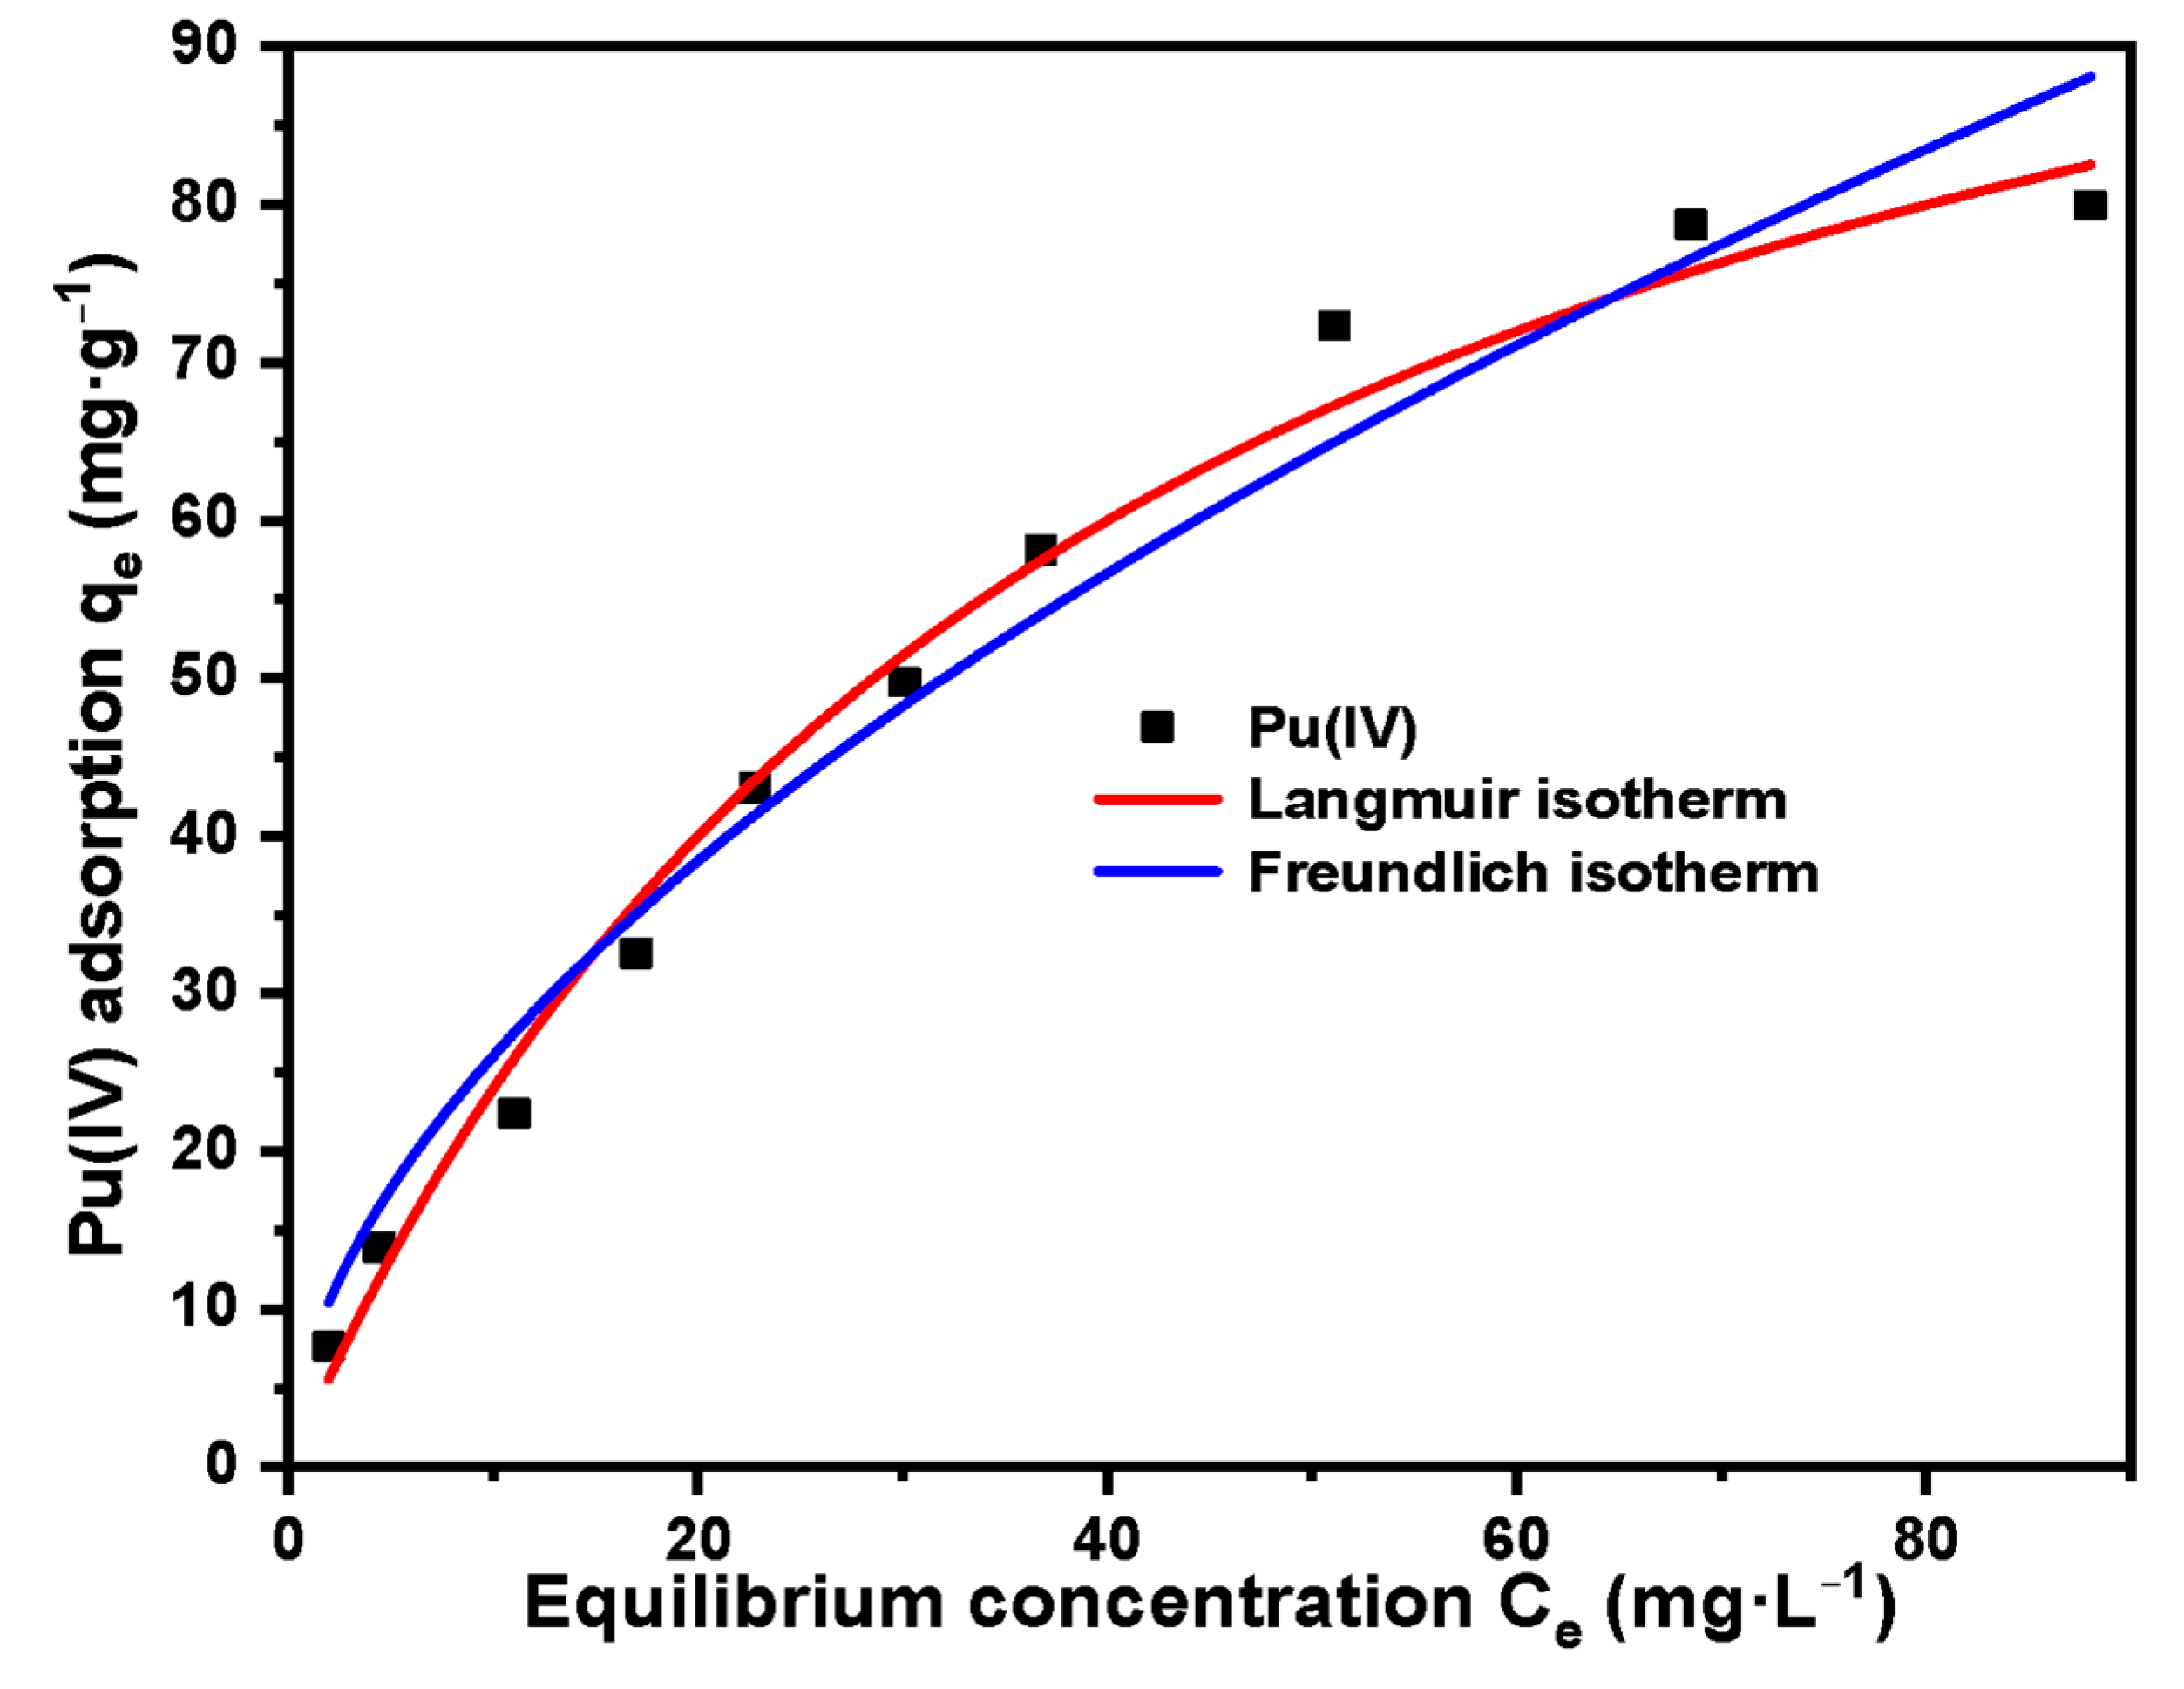
| Adsorption Isotherm Model | Parameters | Pu(IV) |
|---|---|---|
| Langmuir | qmax (mg·g−1) | 119.78 |
| b (L·mg−1) | 0.025 | |
| R2 | 0.981 | |
| Freundlich | Kf | 7.181 |
| nf | 0.562 | |
| R2 | 0.932 |
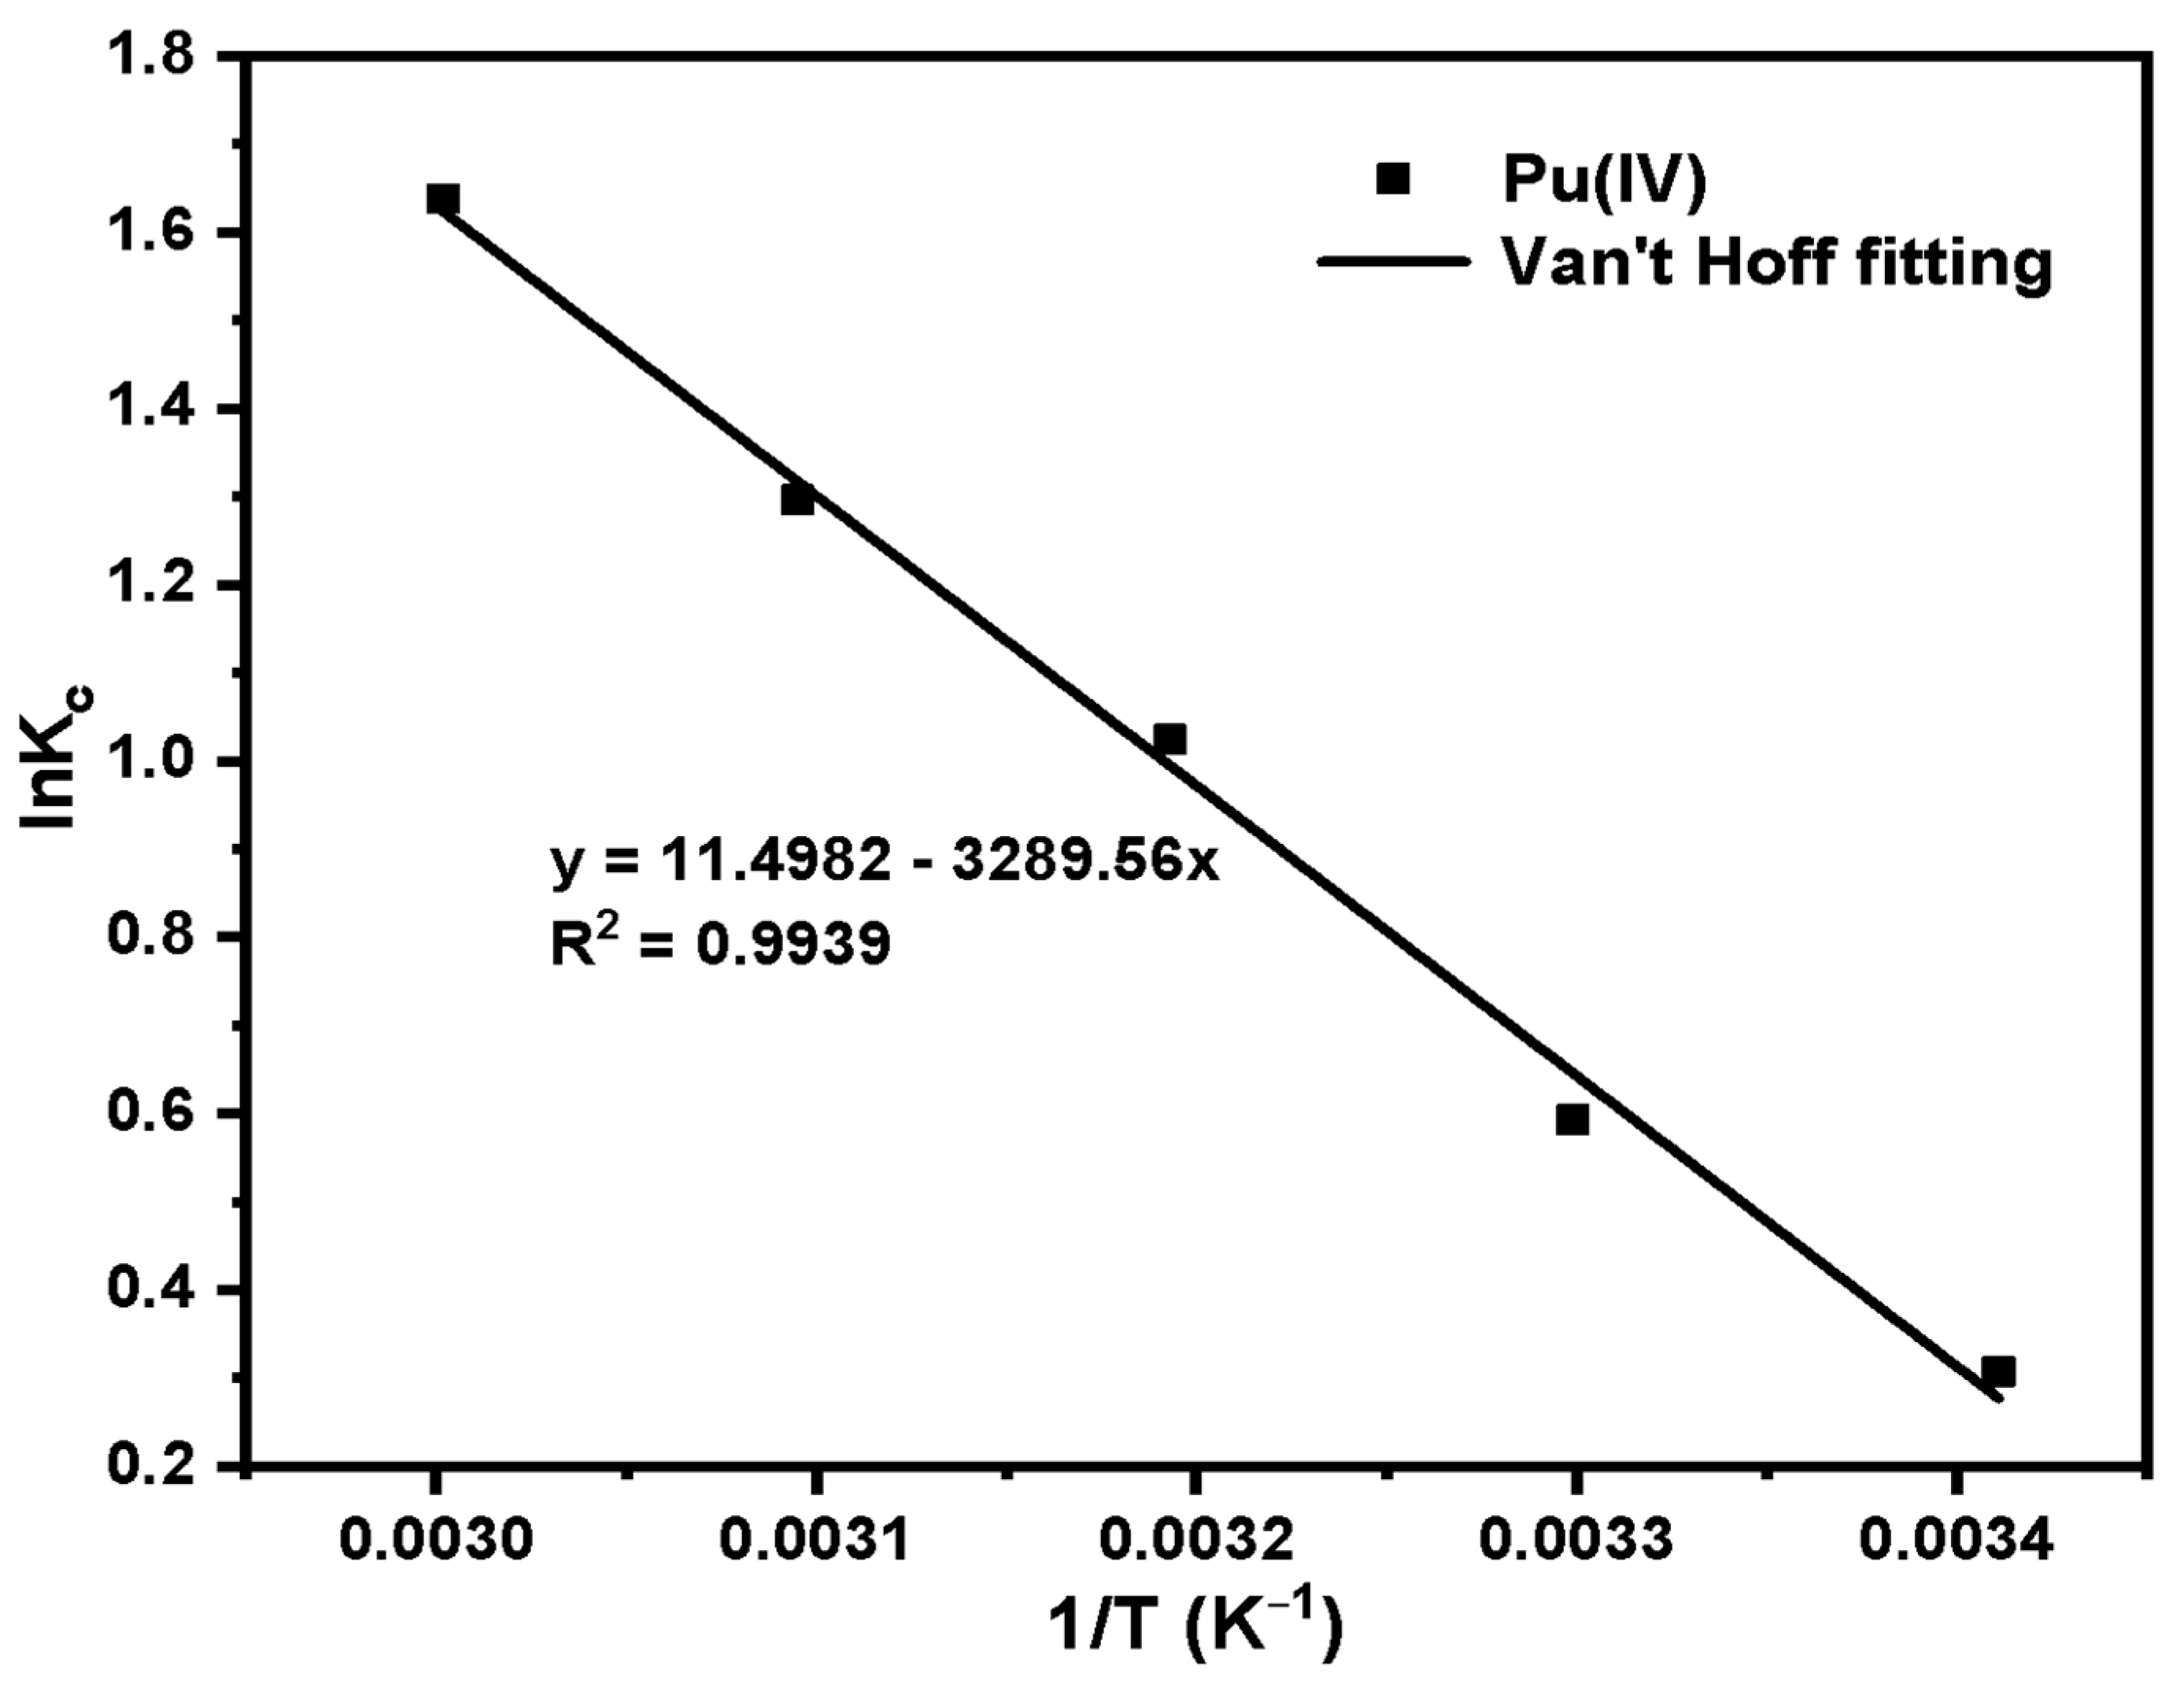
| Species | T (K) | ΔG (KJ·mol−1) | ΔH (KJ·mol−1) | ΔS (J·mol−1·K−1) | R2 |
|---|---|---|---|---|---|
| Pu(IV) | 293.15 | −4.49 | 27.35 | 95.59 | 0.994 |
| 303.15 | −3.54 | ||||
| 313.15 | −2.59 | ||||
| 323.15 | −1.63 | ||||
| 333.15 | −0.67 |
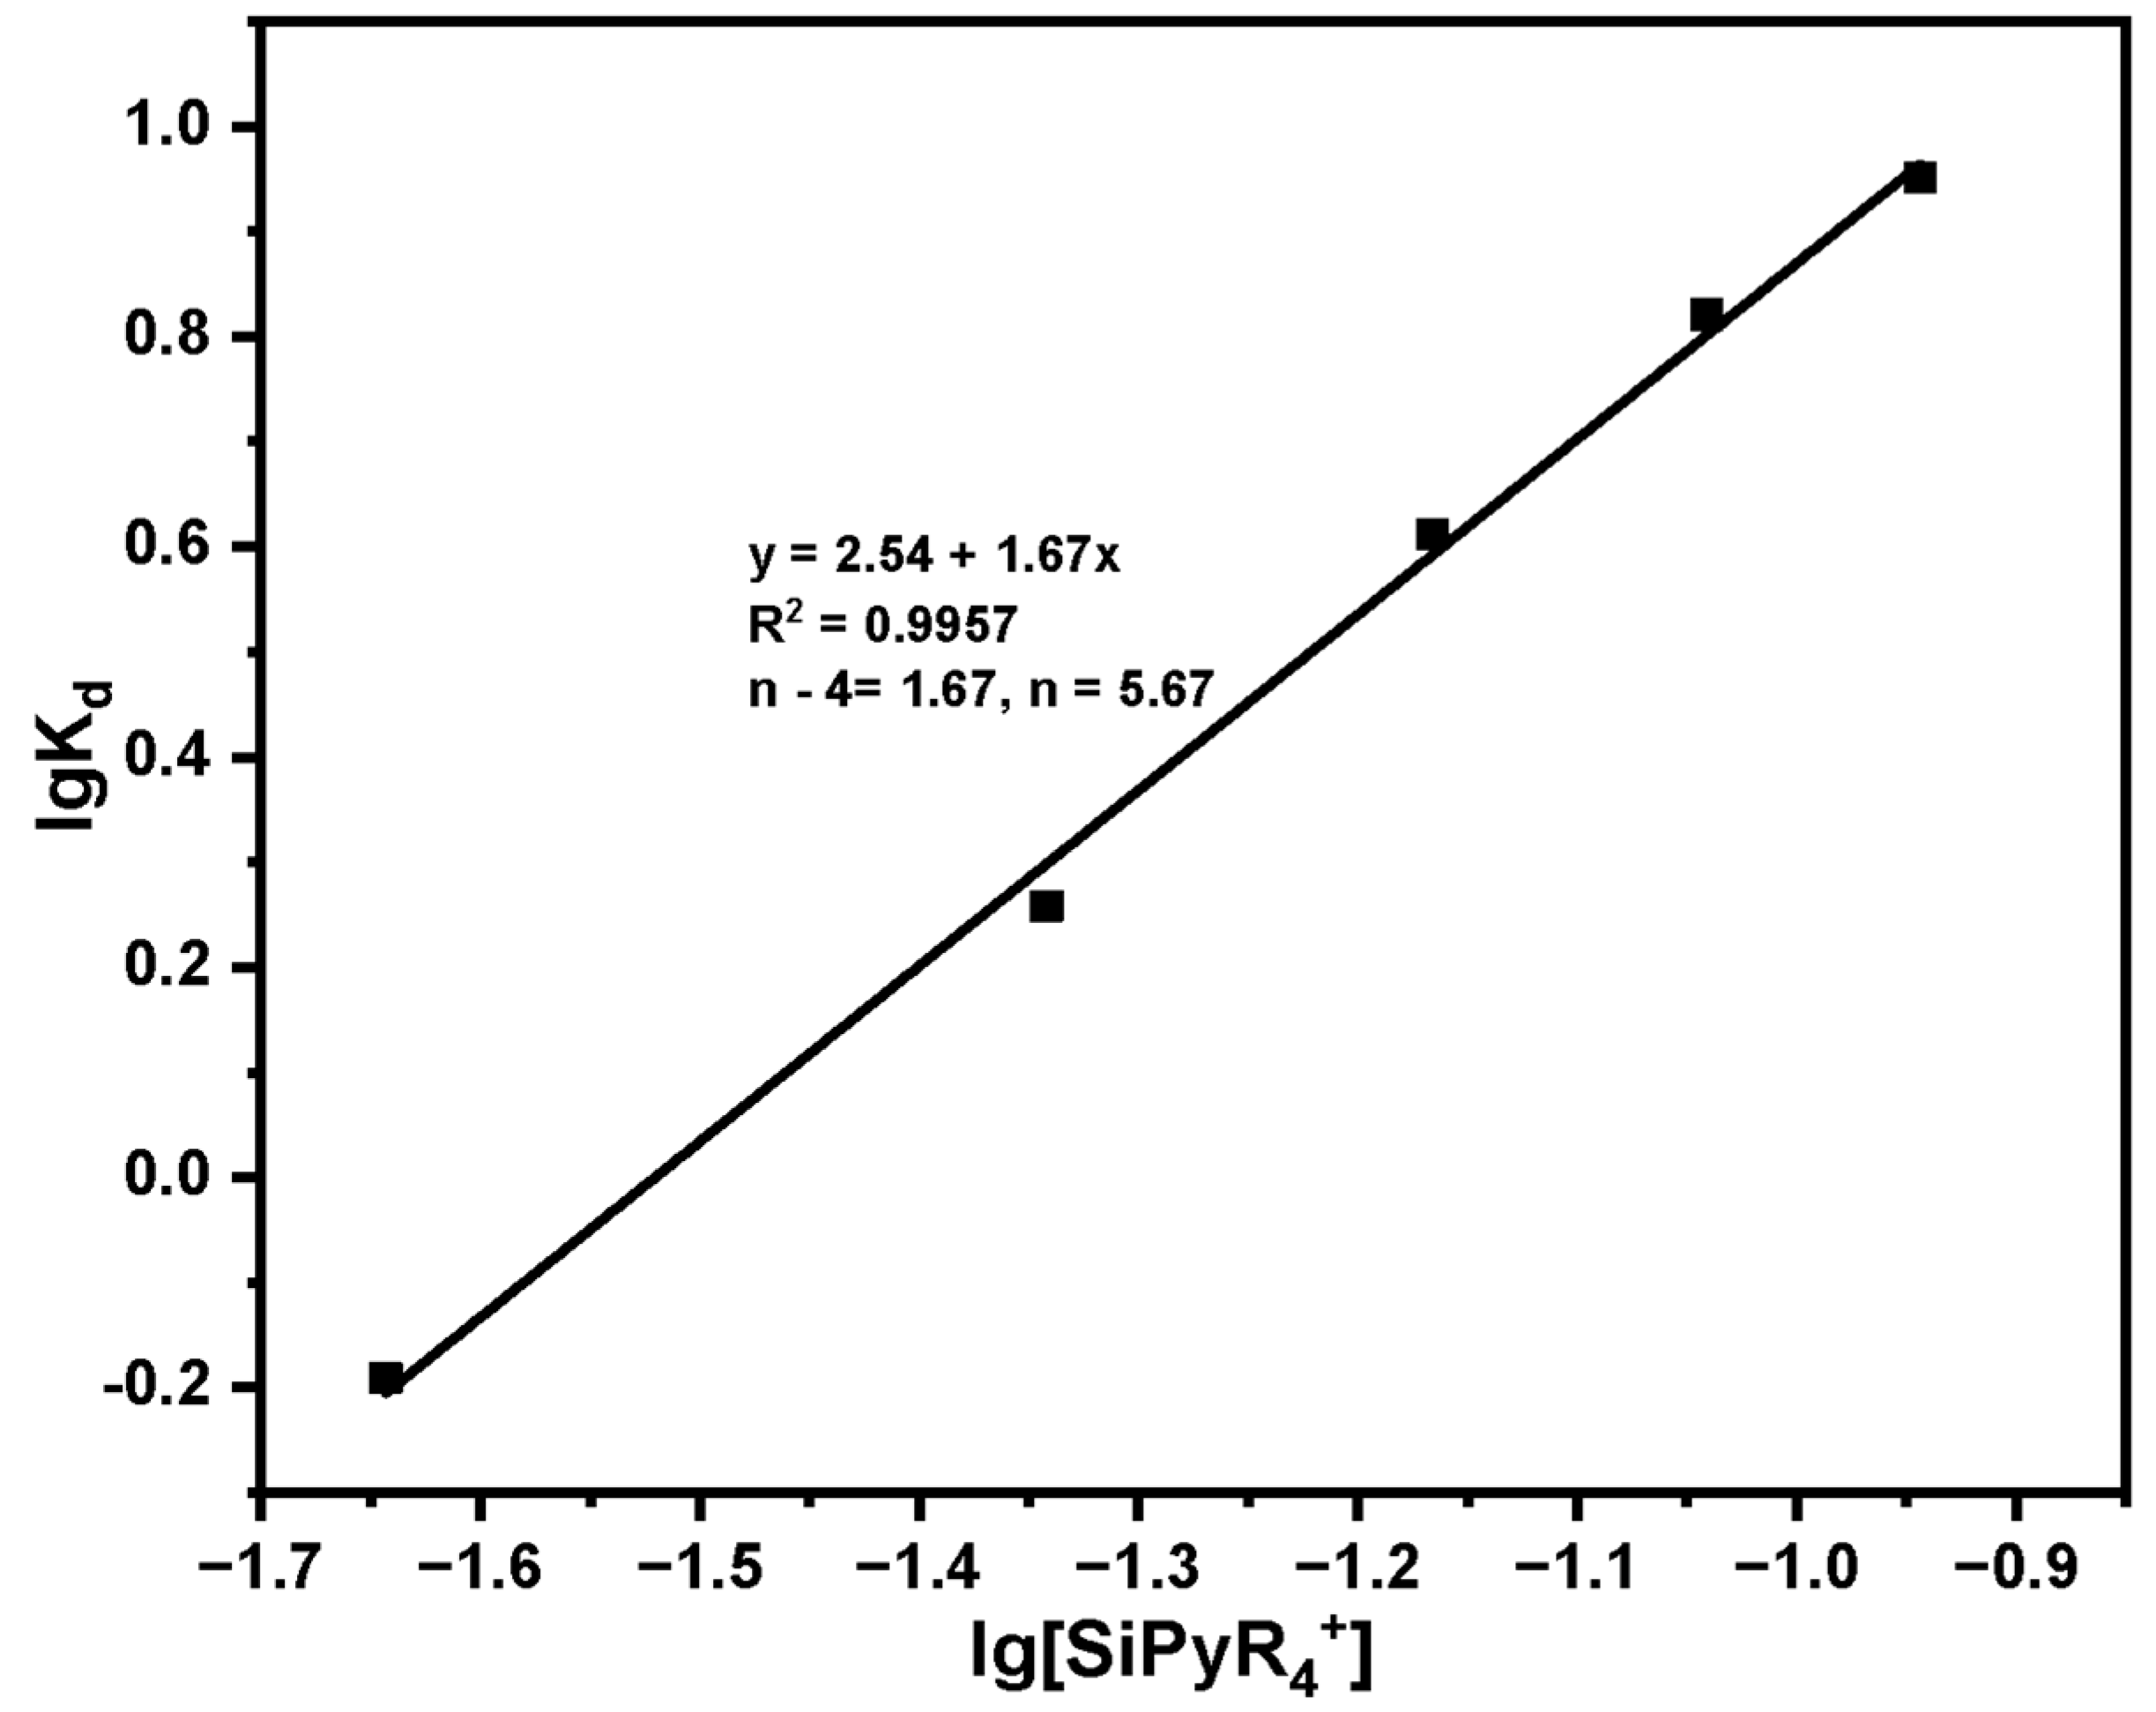
| Dosage (mg) | Ce (mg·L−1) | Qe (mg·g−1) | Kd | lgKd | [SiPyR4+] (mmol) | lg[SiPyR4+] |
|---|---|---|---|---|---|---|
| 20 | 35.42 | 22.90 | 0.646 | −0.191 | 0.0228 | −1.643 |
| 40 | 23.23 | 41.93 | 1.810 | 0.258 | 0.0455 | −1.342 |
| 60 | 11.61 | 47.32 | 4.074 | 0.612 | 0.0683 | −1.166 |
| 80 | 6.36 | 42.05 | 6.607 | 0.821 | 0.0910 | −1.041 |
| 100 | 4.12 | 35.88 | 8.712 | 0.951 | 0.1138 | −0.944 |
Publisher’s Note: MDPI stays neutral with regard to jurisdictional claims in published maps and institutional affiliations. |
© 2022 by the authors. Licensee MDPI, Basel, Switzerland. This article is an open access article distributed under the terms and conditions of the Creative Commons Attribution (CC BY) license (https://creativecommons.org/licenses/by/4.0/).
Share and Cite
Wang, Z.; Liu, M.; Wang, L.; Chang, Z.; Li, H. Synthesis of Silica-Based Quaternized Adsorption Material and Study on Its Adsorption Behavior for Pu(IV). Molecules 2022, 27, 3110. https://doi.org/10.3390/molecules27103110
Wang Z, Liu M, Wang L, Chang Z, Li H. Synthesis of Silica-Based Quaternized Adsorption Material and Study on Its Adsorption Behavior for Pu(IV). Molecules. 2022; 27(10):3110. https://doi.org/10.3390/molecules27103110
Chicago/Turabian StyleWang, Zheng, Meichen Liu, Ling Wang, Zhiyuan Chang, and Huibo Li. 2022. "Synthesis of Silica-Based Quaternized Adsorption Material and Study on Its Adsorption Behavior for Pu(IV)" Molecules 27, no. 10: 3110. https://doi.org/10.3390/molecules27103110
APA StyleWang, Z., Liu, M., Wang, L., Chang, Z., & Li, H. (2022). Synthesis of Silica-Based Quaternized Adsorption Material and Study on Its Adsorption Behavior for Pu(IV). Molecules, 27(10), 3110. https://doi.org/10.3390/molecules27103110