2.6. Adsorption Experiment of Pu(IV) on Silicon-Based Quaternized Material
HNO3 and NO3− concentration gradient setting experiment:
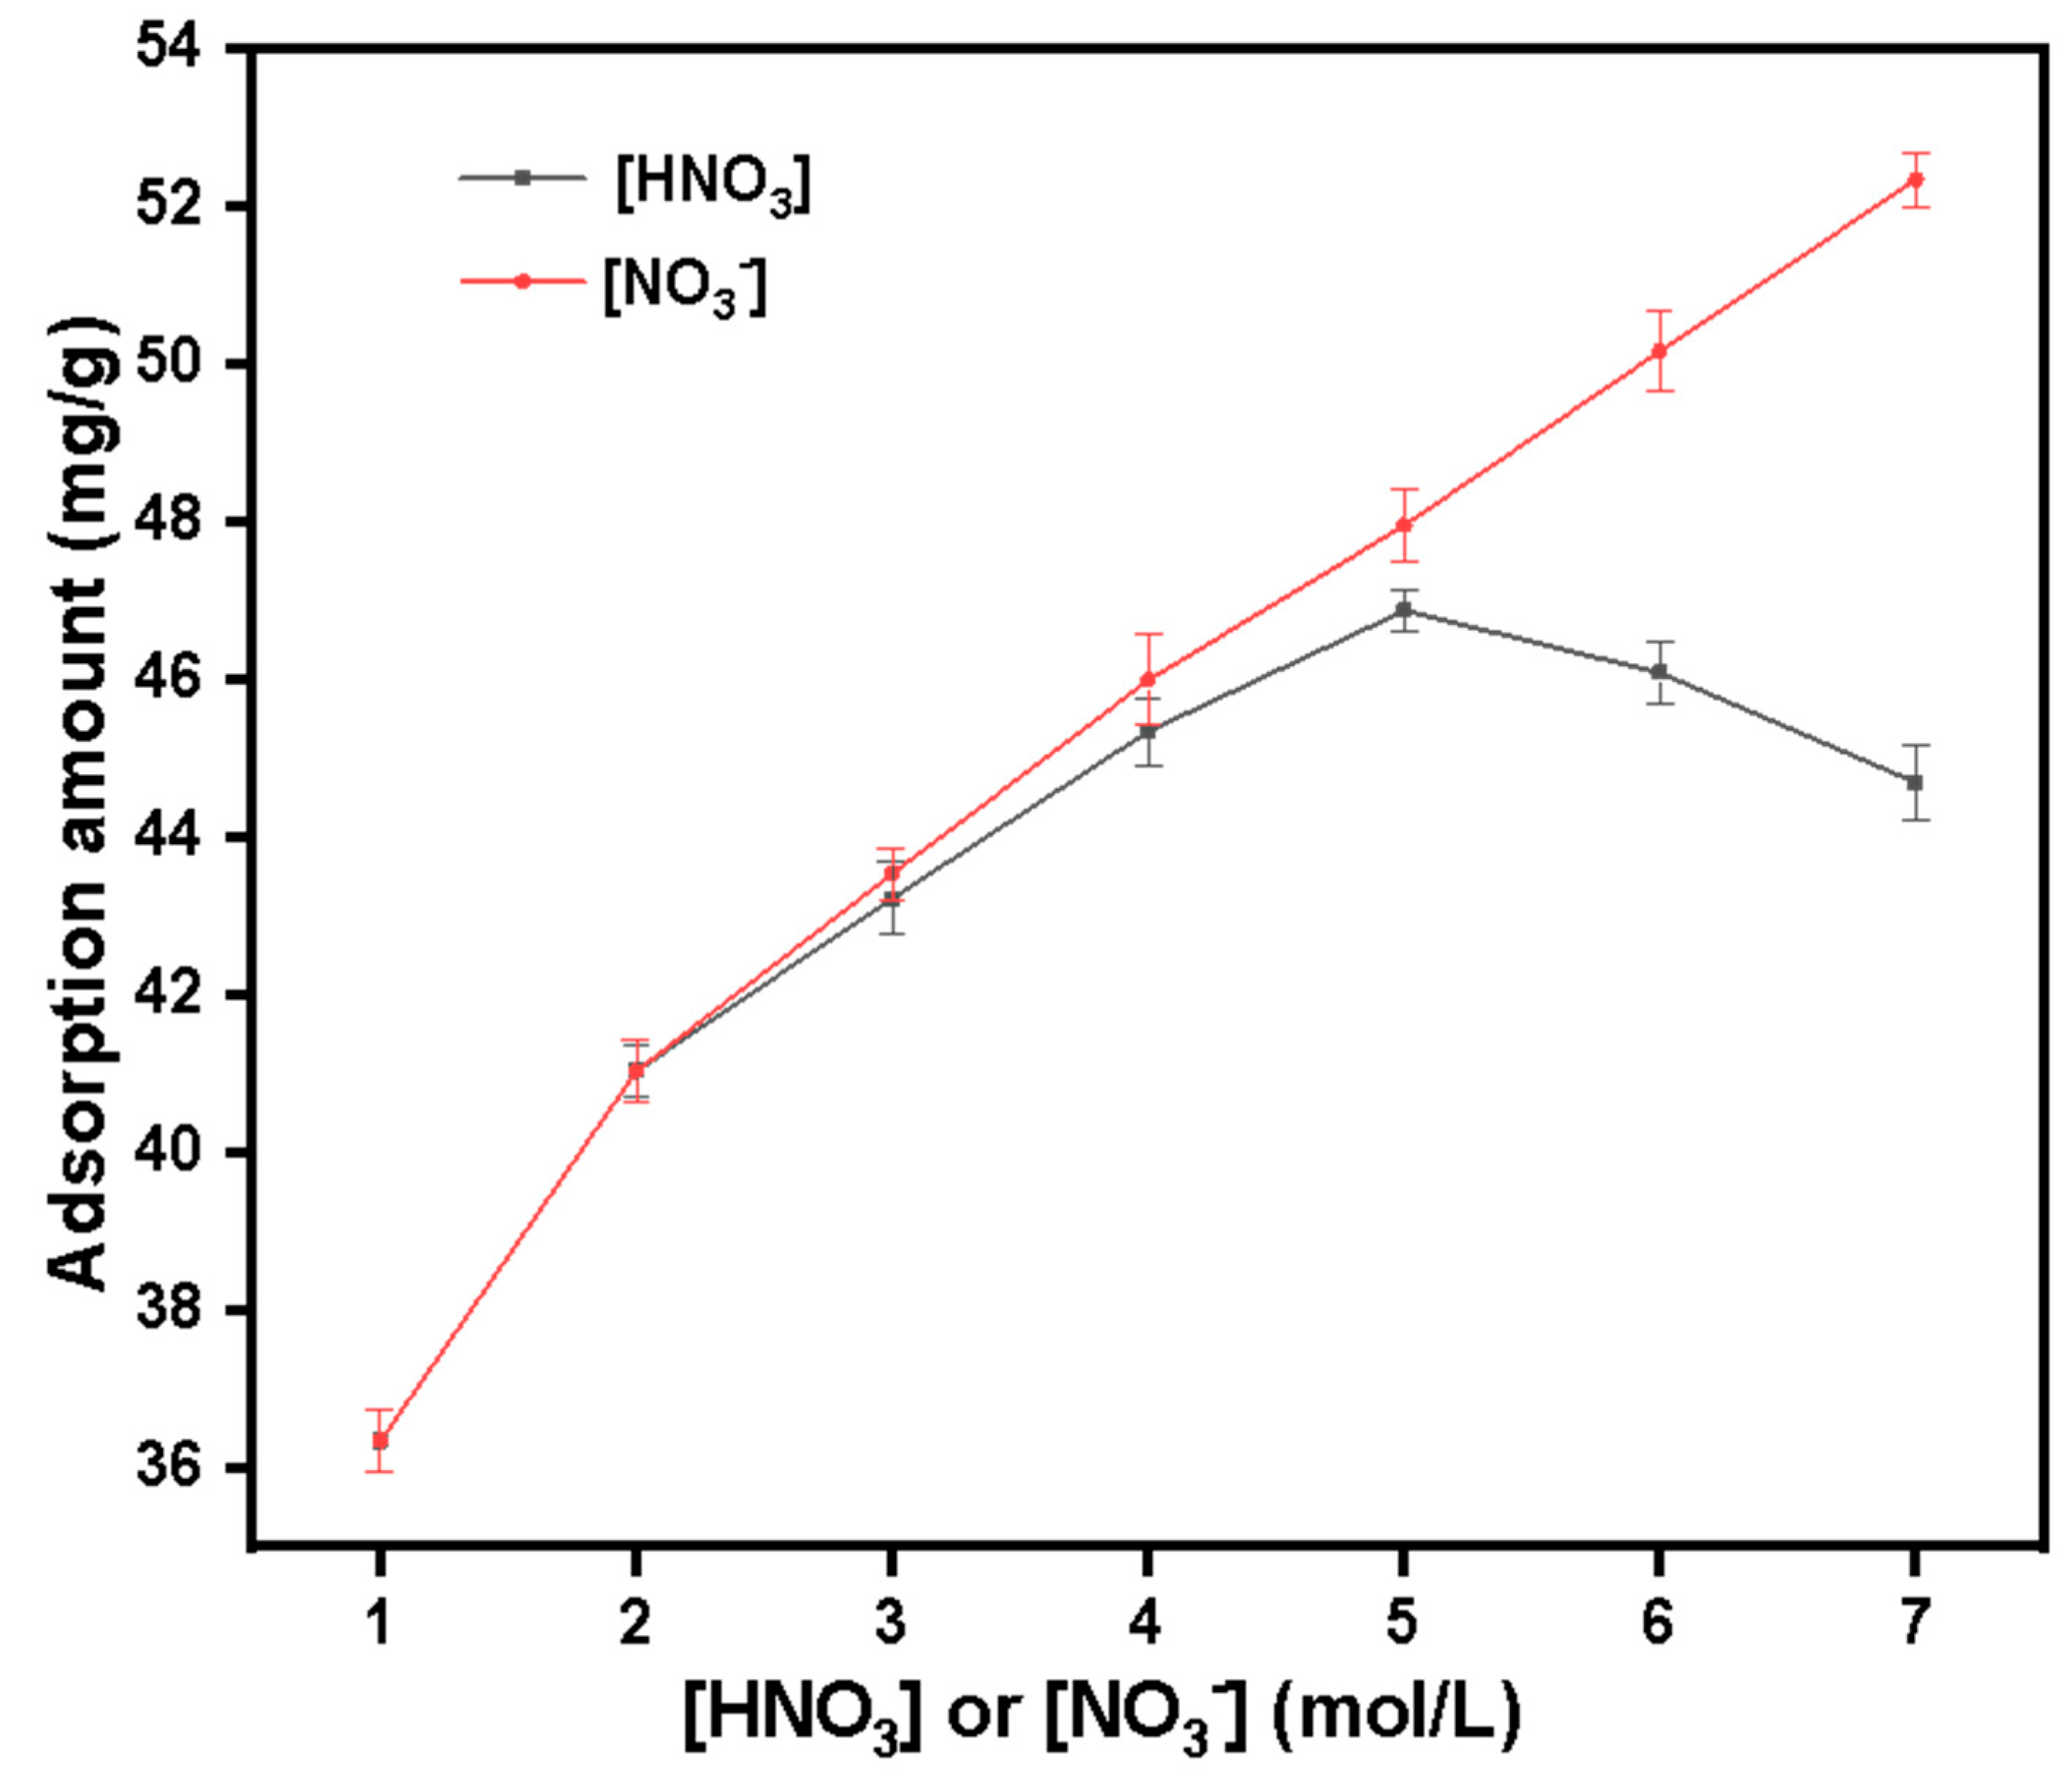
40 mg·L−1 Pu(IV) solution is configured for HNO3 and NO3− concentration gradient experiment. Set HNO3 or NO3− concentration: 1 mol·L−1, 2 mol·L−1, 3 mol·L−1, 4 mol·L−1, 5 mol·L−1, 6 mol·L−1, and 7 mol·L−1. Other conditions include: temperature 30 °C, adsorption time 1 h. After standing for adsorption, filter, measure the equilibrium concentration of Pu(IV) with X fluorescence analyzer and record it as Ce. Equation (1) is used to calculate the adsorption capacity.
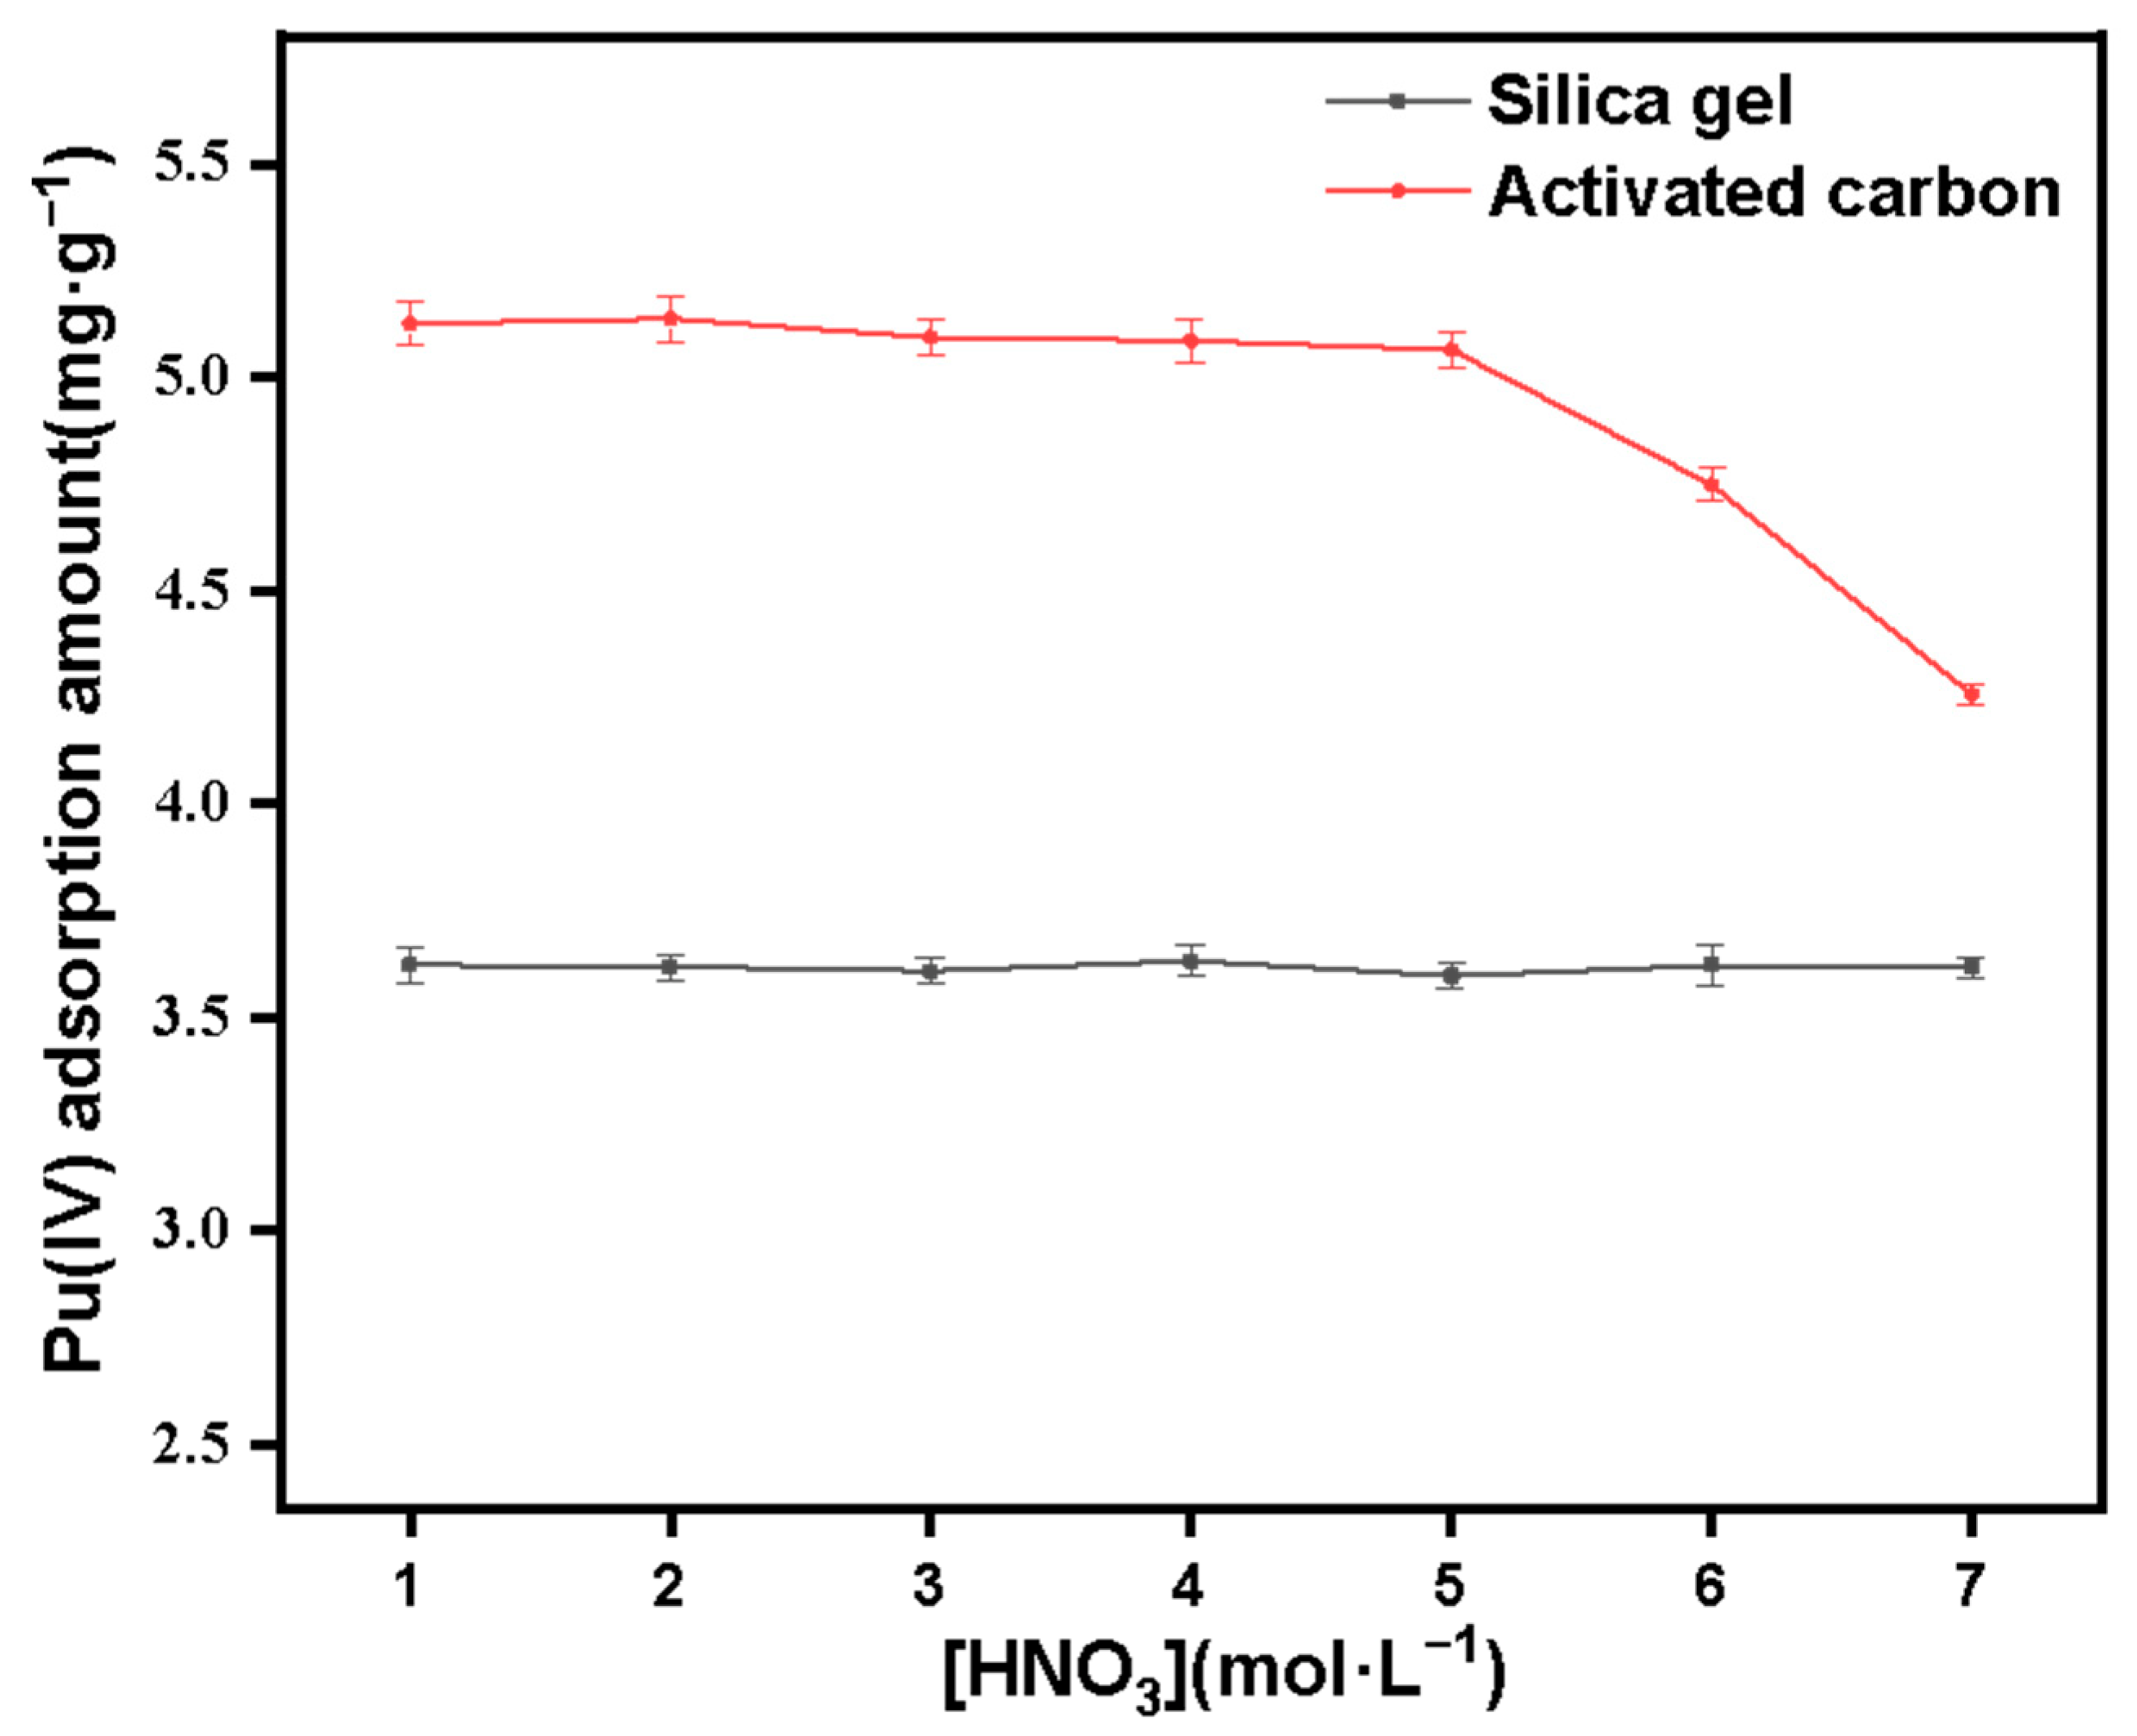
In order to compare the differences between quaternized silicon-based materials and physical adsorption materials, we use unmodified porous silica materials (pore size about 8nm, particle size about 100–200 mesh) and activated carbon (particle size about 100 mesh) to carry out adsorption experiment of Pu(IV) under different acidity, and other experimental conditions were the same as above.
Kinetic adsorption experiment:
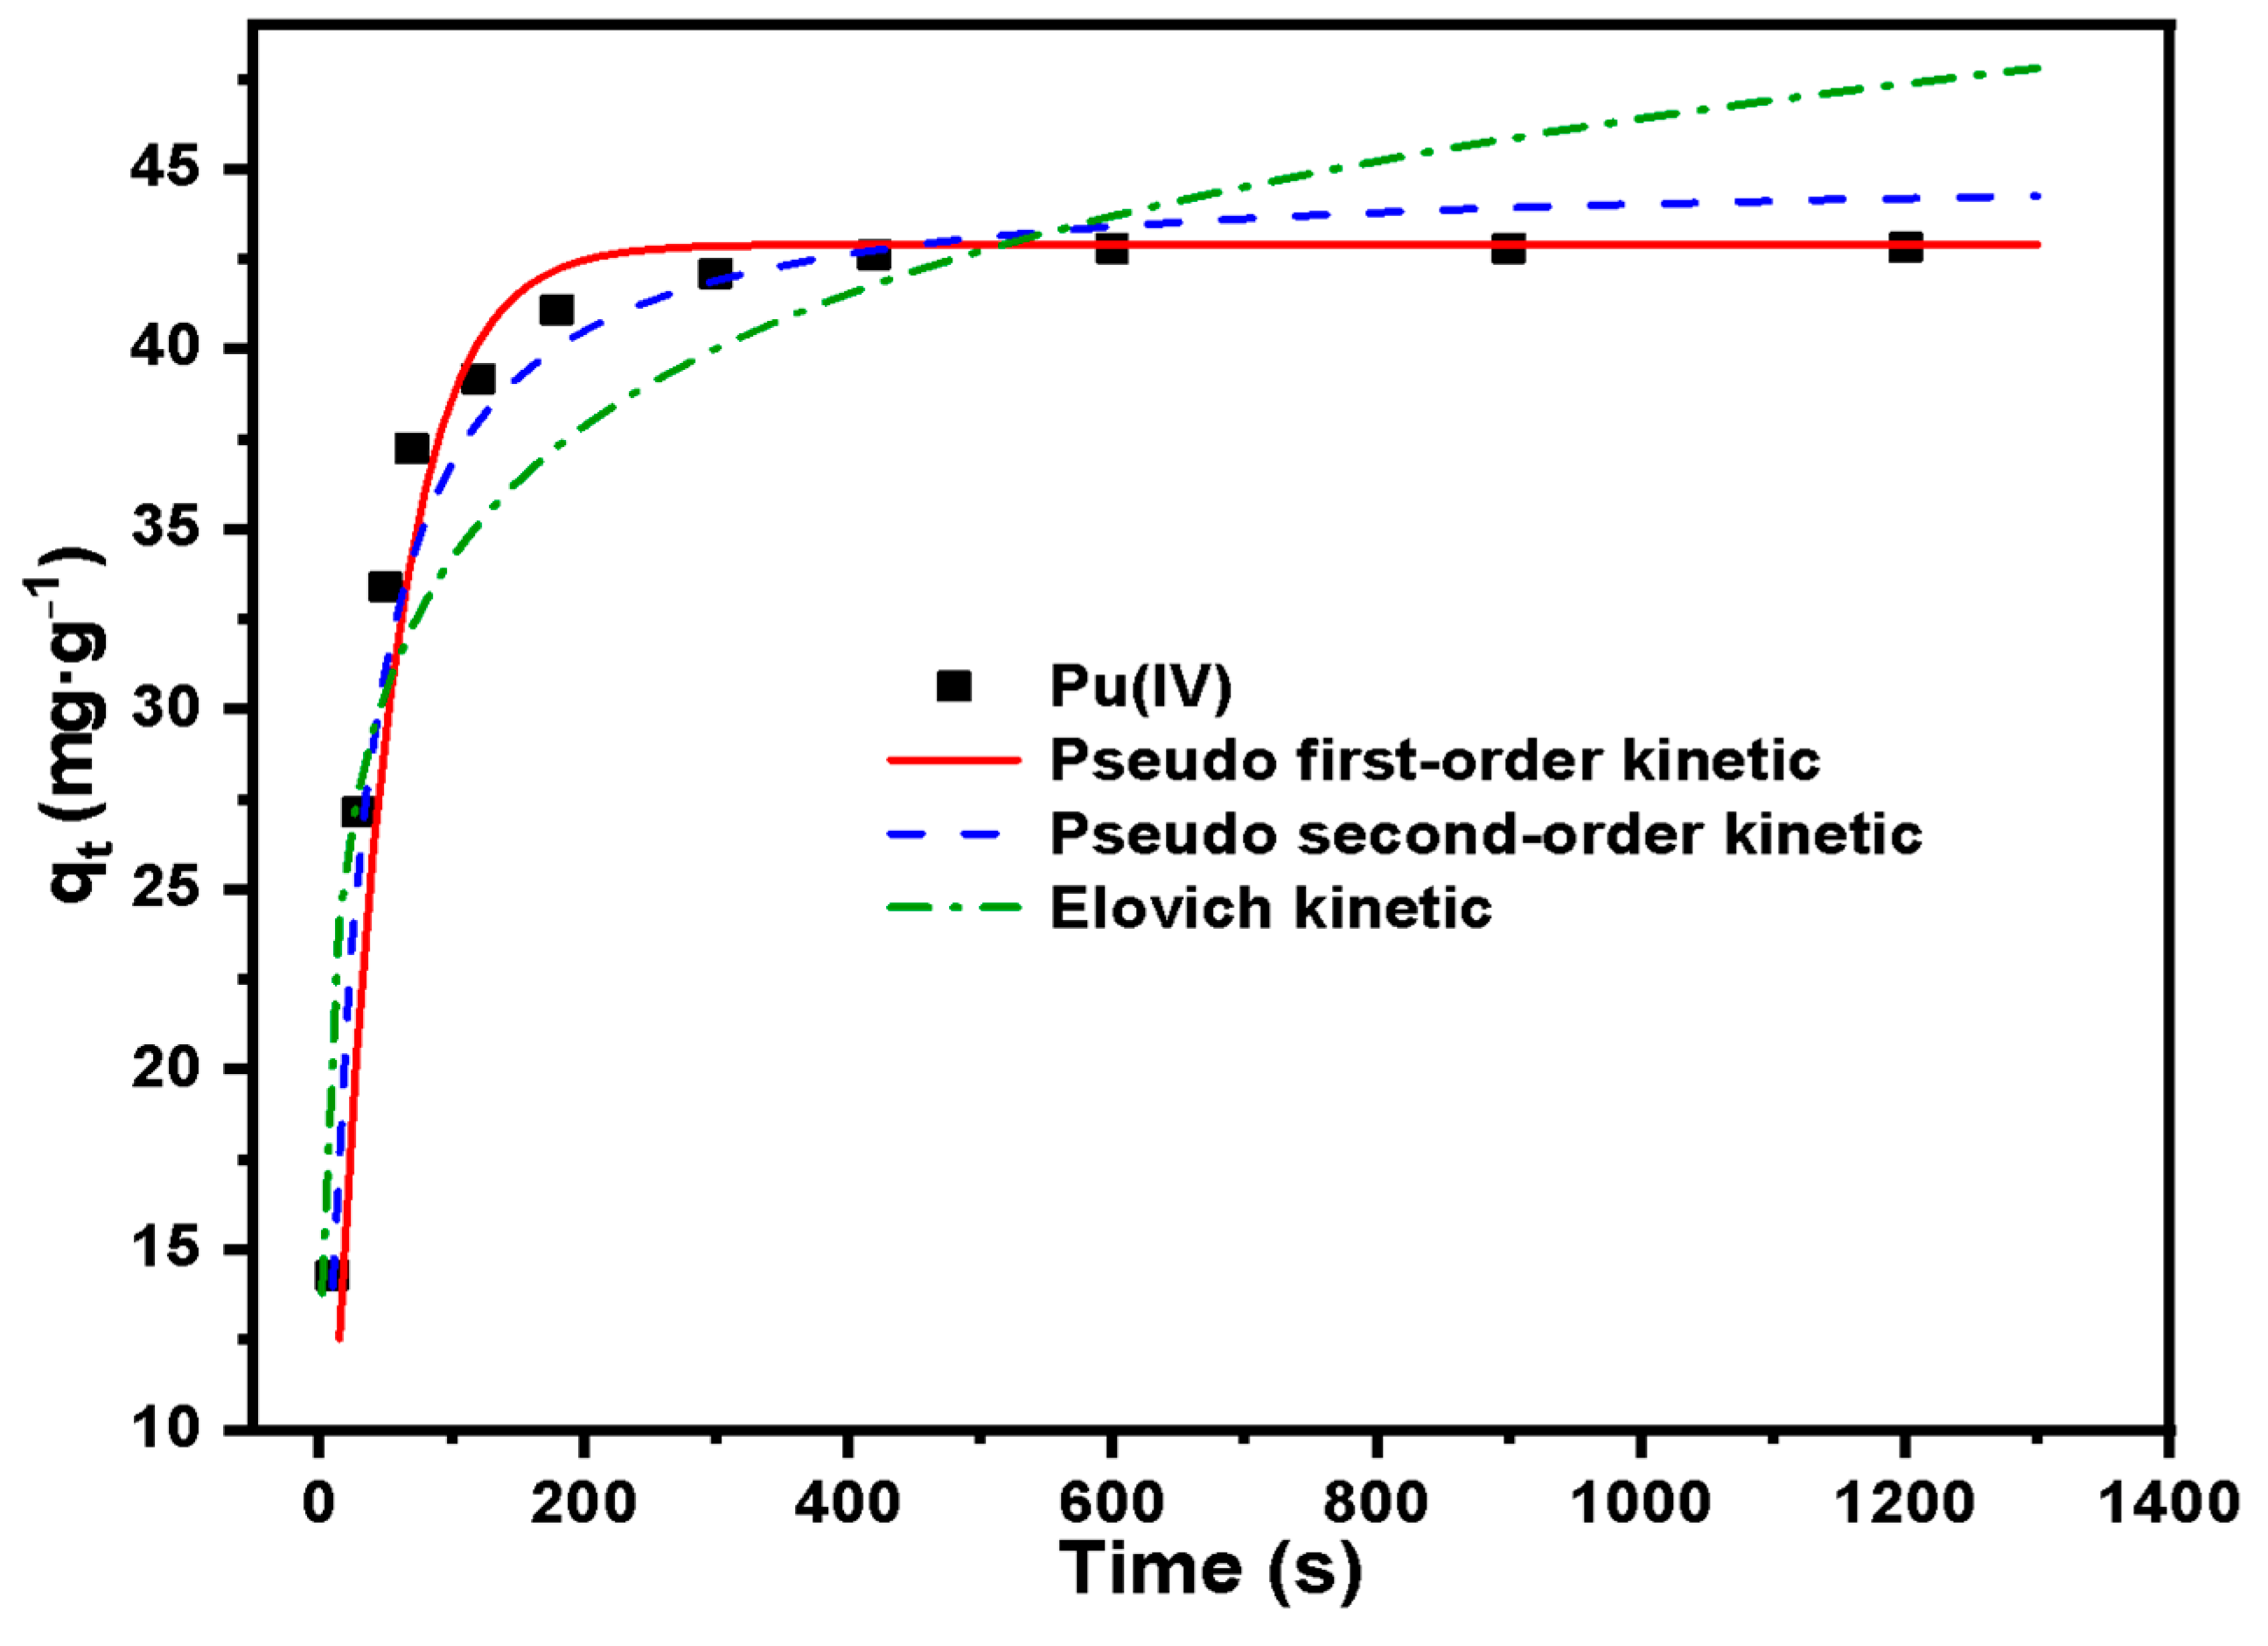
A total of 40 mg·L−1 Pu(IV) solution is configured for adsorption kinetics experiments. Set adsorption time: 10 s, 30 s, 50 s, 70 s, 120 s, 180 s, 300 s, 420 s, 600 s, 900 s, 1200 s. Other conditions include: temperature 30 °C, acidity 2 mol·L−1 HNO3. At each set time, take a small amount of supernatant and filter, measure the concentration of Pu(IV) with X fluorescence analyzer and record it as Ct. The pseudo first-order, pseudo second-order and Elovich kinetic models were used to determine the rate of the adsorption process.
Pseudo first-order and pseudo second-order kinetics models were given as Equations (2) and (3) [
23,
24]:
and
where q
t (mg·g
−1) is the adsorption capacity at time t (s), and q
e (mg·g
−1) is the equilibrium adsorption capacity. Moreover, k
1 (s
−1) was the pseudo first-order kinetic rate constant, and k
2 (g·s·mg
−1) was the pseudo second-order kinetic rate constant.
The Elovich kinetic model was given as Equation (4) [
25]:
where β
E (g·mg
−1) is the desorption constant related to the activation energy of chemisorption and α
E (mg·(g·s)
−1) is the initial adsorption rate.
Adsorption thermodynamic experiment
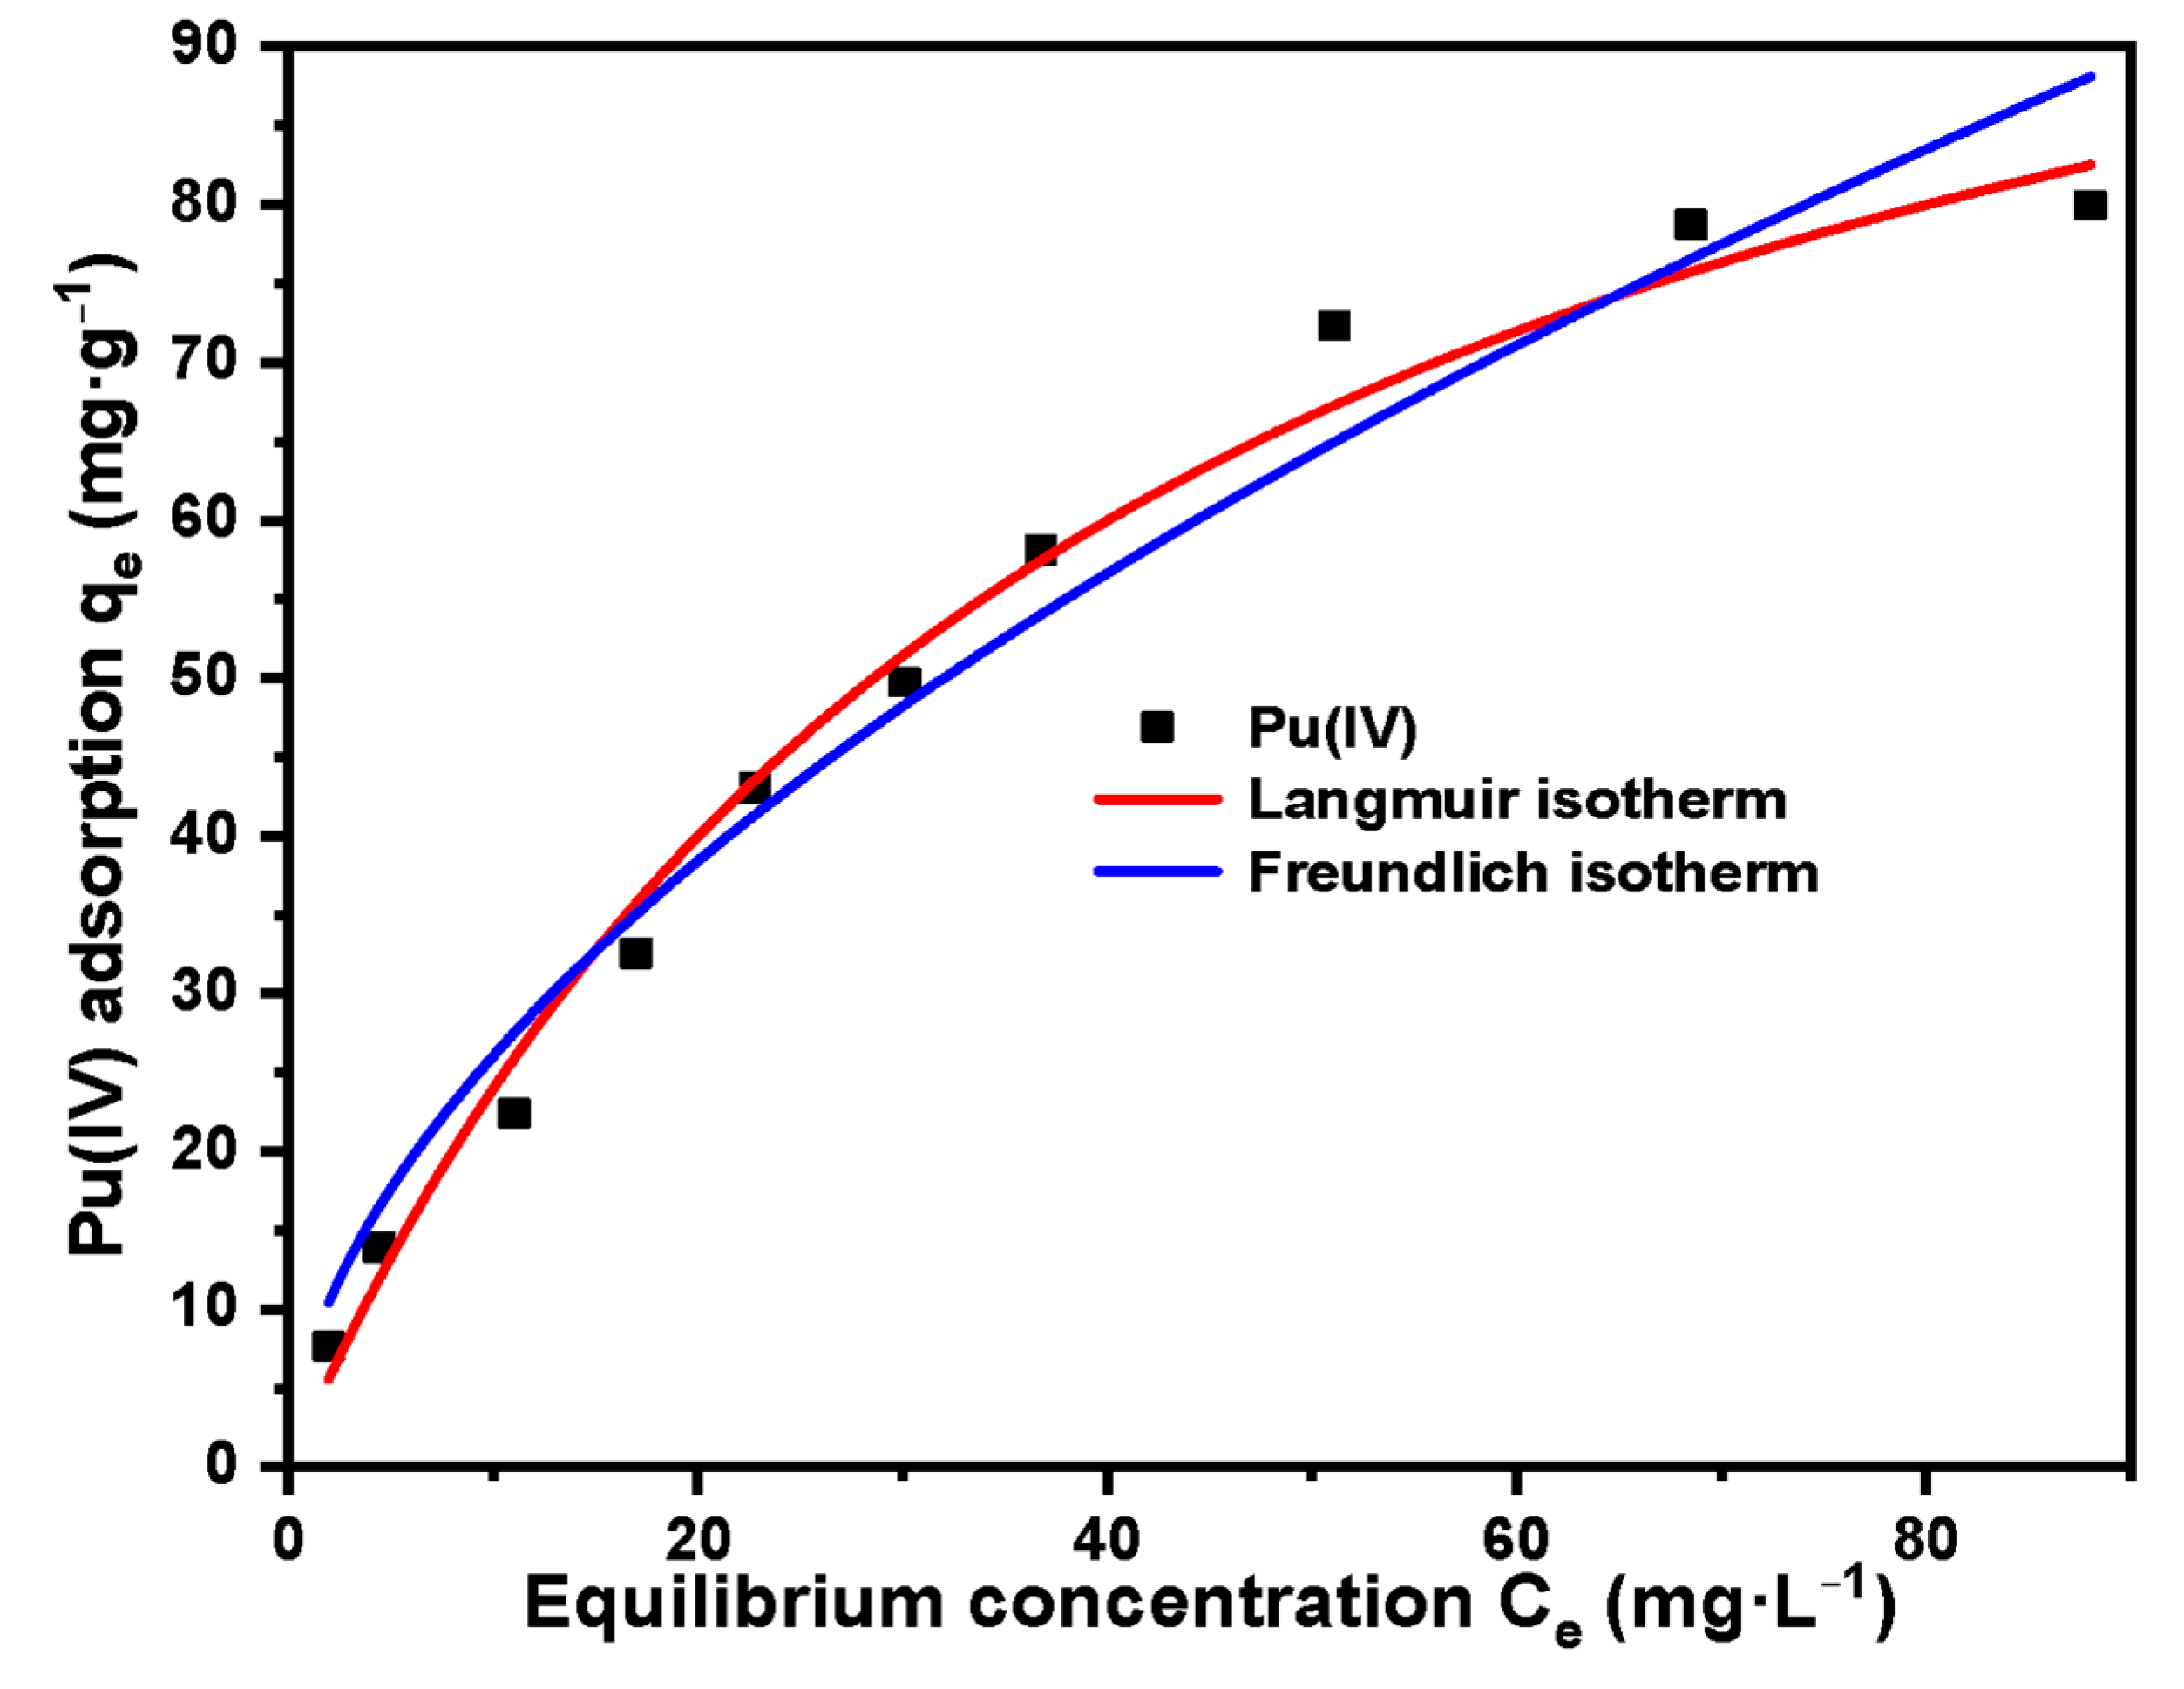
The following Pu(IV) solutions were configured for adsorption isotherm studies: 5 mg·L−1, 10 mg·L−1, 20 mg·L−1, 30 mg·L−1, 40 mg·L−1, 50 mg·L−1, 60 mg·L−1, 80 mg·L−1, 100 mg·L−1, 120 mg·L−1. Other conditions include: temperature 30 °C, acidity 4 mol·L−1 HNO3, adsorption time 1 h. After adsorption, filter, measure the equilibrium concentration of Pu(IV) with X fluorescence analyzer and record it as Ce. Equation (1) is used to calculate the adsorption capacity.
Langmuir and Freundlich adsorption isotherm models were given as Equations (5) and (6) [
26,
27]:
and
where q
e (mg·g
−1) is the equilibrium adsorption capacity, q
max (mg·g
−1) is the maximum adsorption capacity, C
e (mg·g
−1) is the equilibrium concentration, b is the constant, K
f is the Freundlich constant, and n
f is the concentration index.
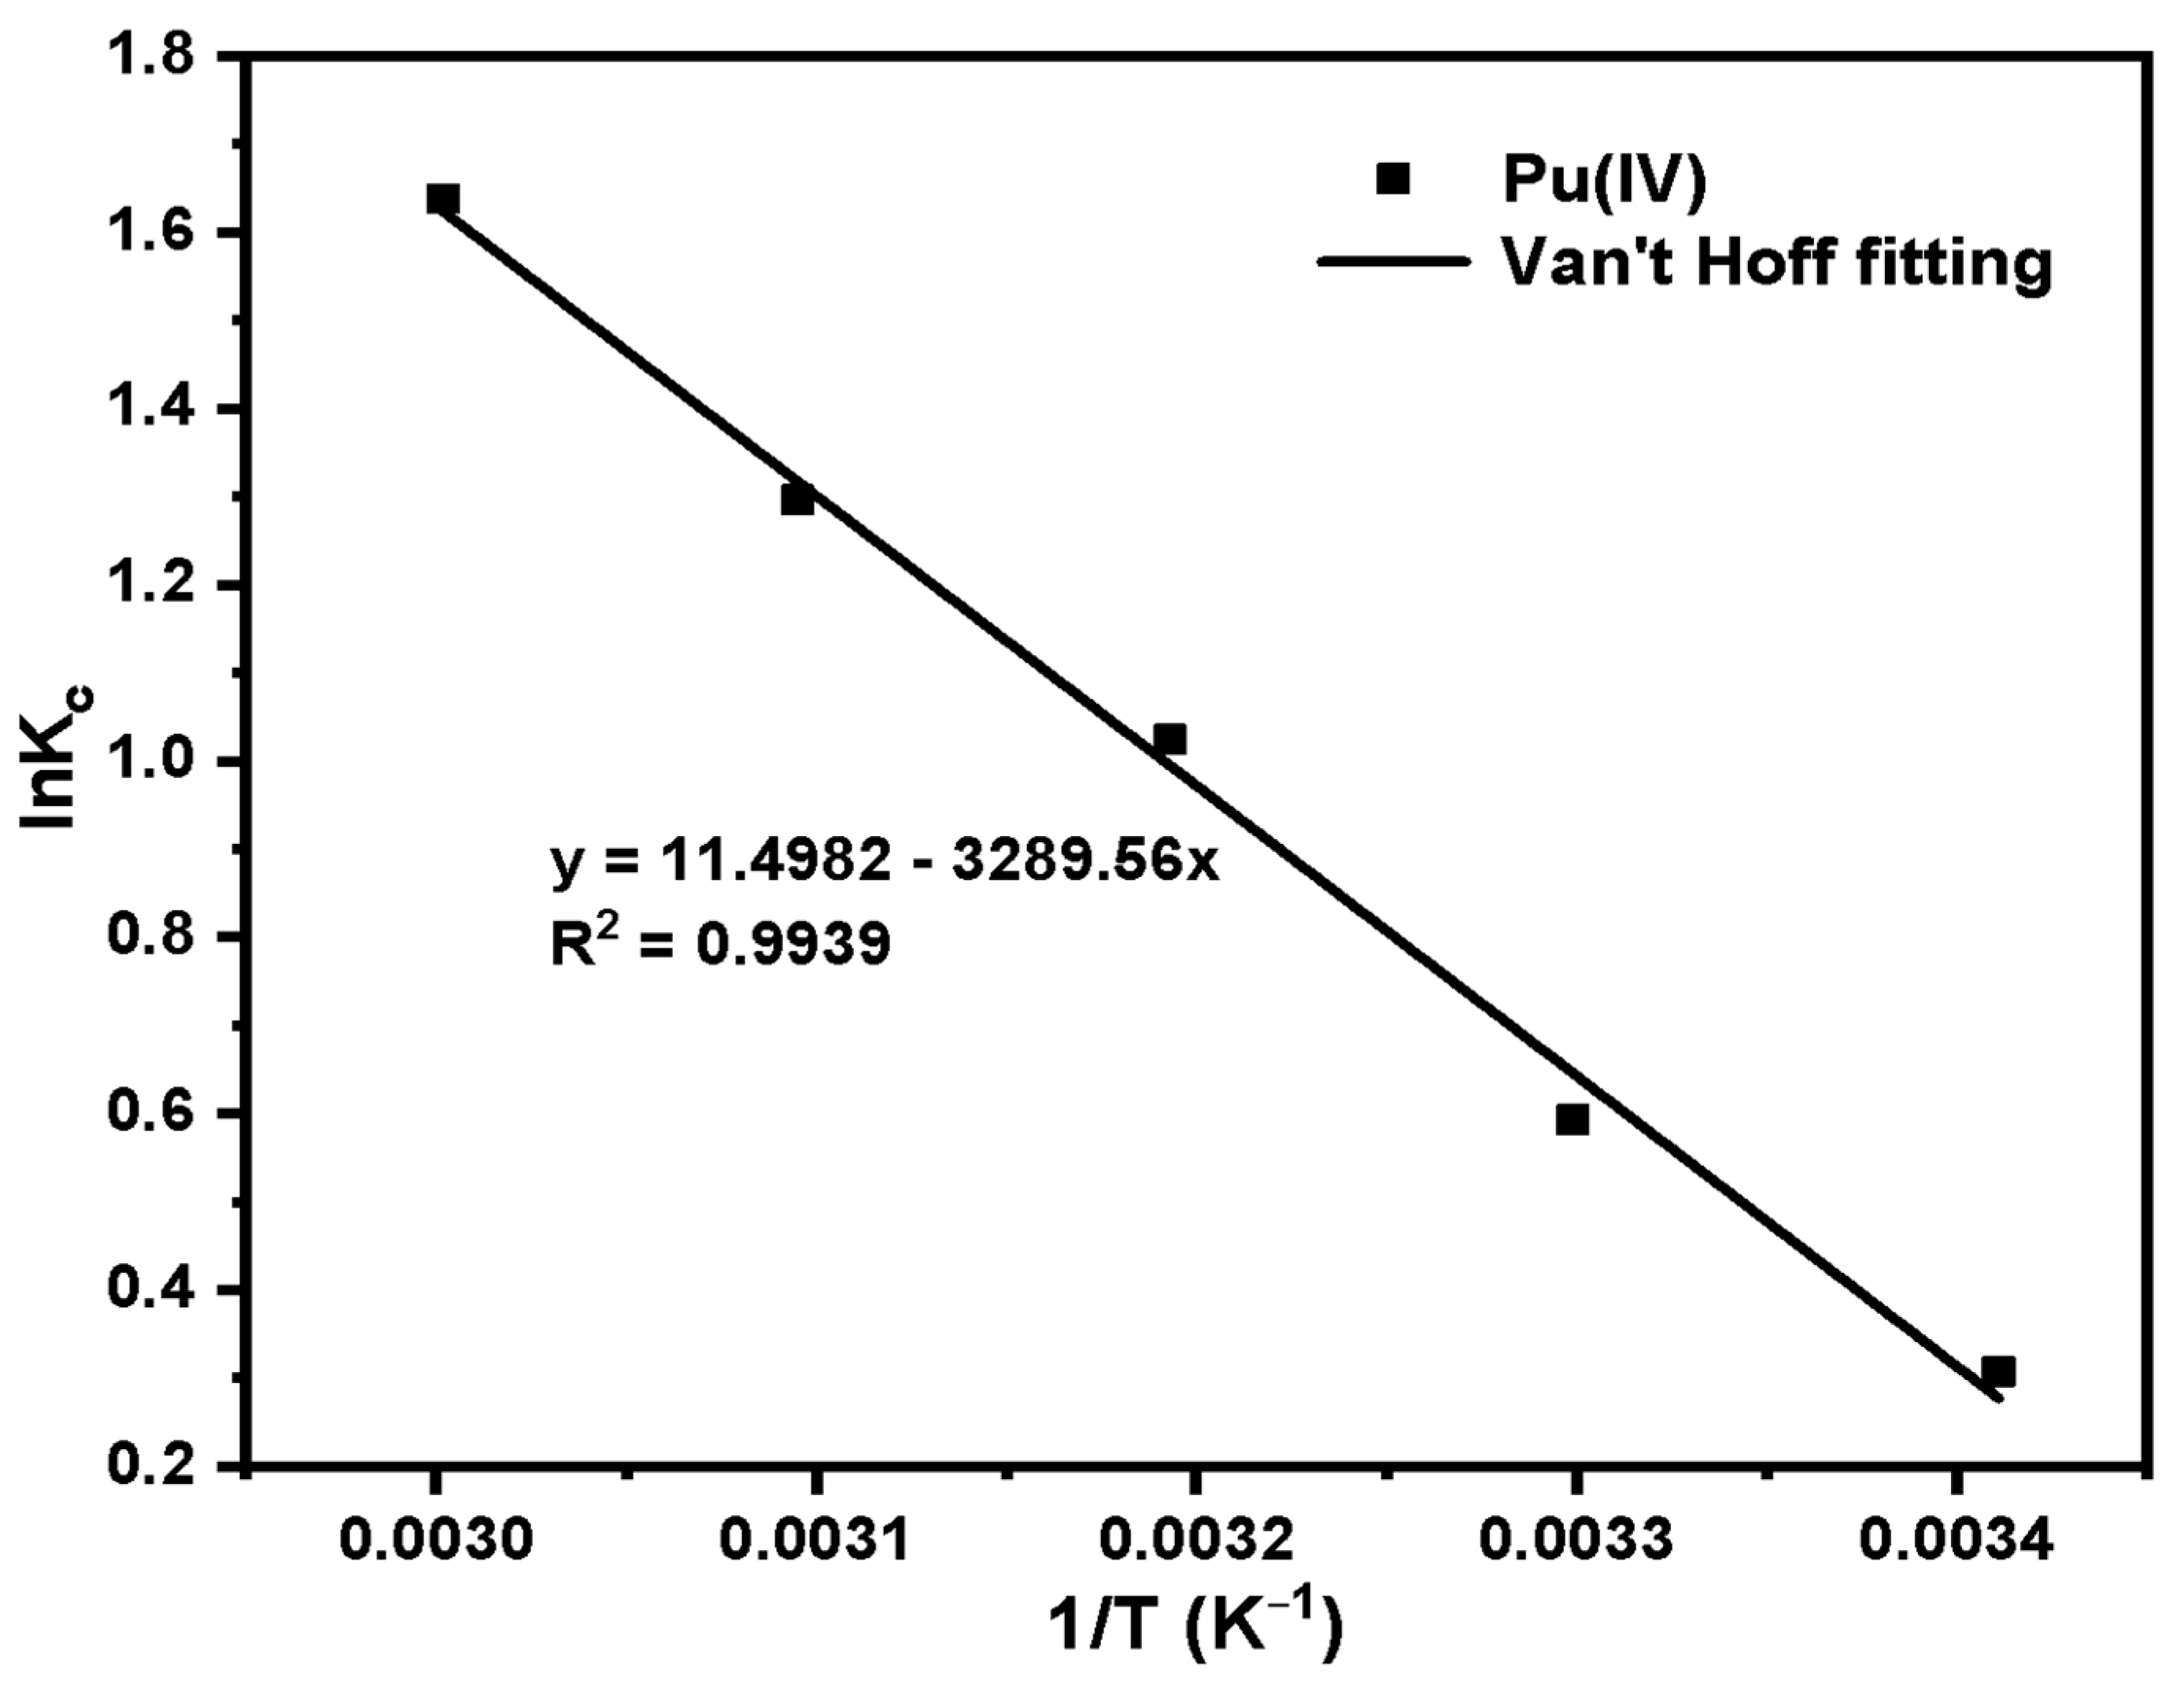
A total of 40 mg·L−1 Pu(IV) solution is configured for the adsorption heat experiment. Set adsorption temperature: 20 °C, 30 °C, 40 °C, 50 °C, 60 °C. Other conditions include: acidity 4 mol·L−1 HNO3, adsorption time 1 h. After adsorption, filter, measure the equilibrium concentration of Pu(IV) with X fluorescence analyzer and record it as Ce. Equation (1) is used to calculate the adsorption capacity.
The Van’t Hoff equation was used to fit the adsorption capacity at different temperatures to obtain the thermodynamic parameters ΔH and ΔS. Calculate ΔG at different temperatures by the Gibbs equation. Van’t Hoff and Gibbs equations were given as Equations (7) and (8) [
28,
29]:
and
where C
s is the concentration of the solid surface at the adsorption equilibrium and C
e is the concentration in the solution at the adsorption equilibrium.
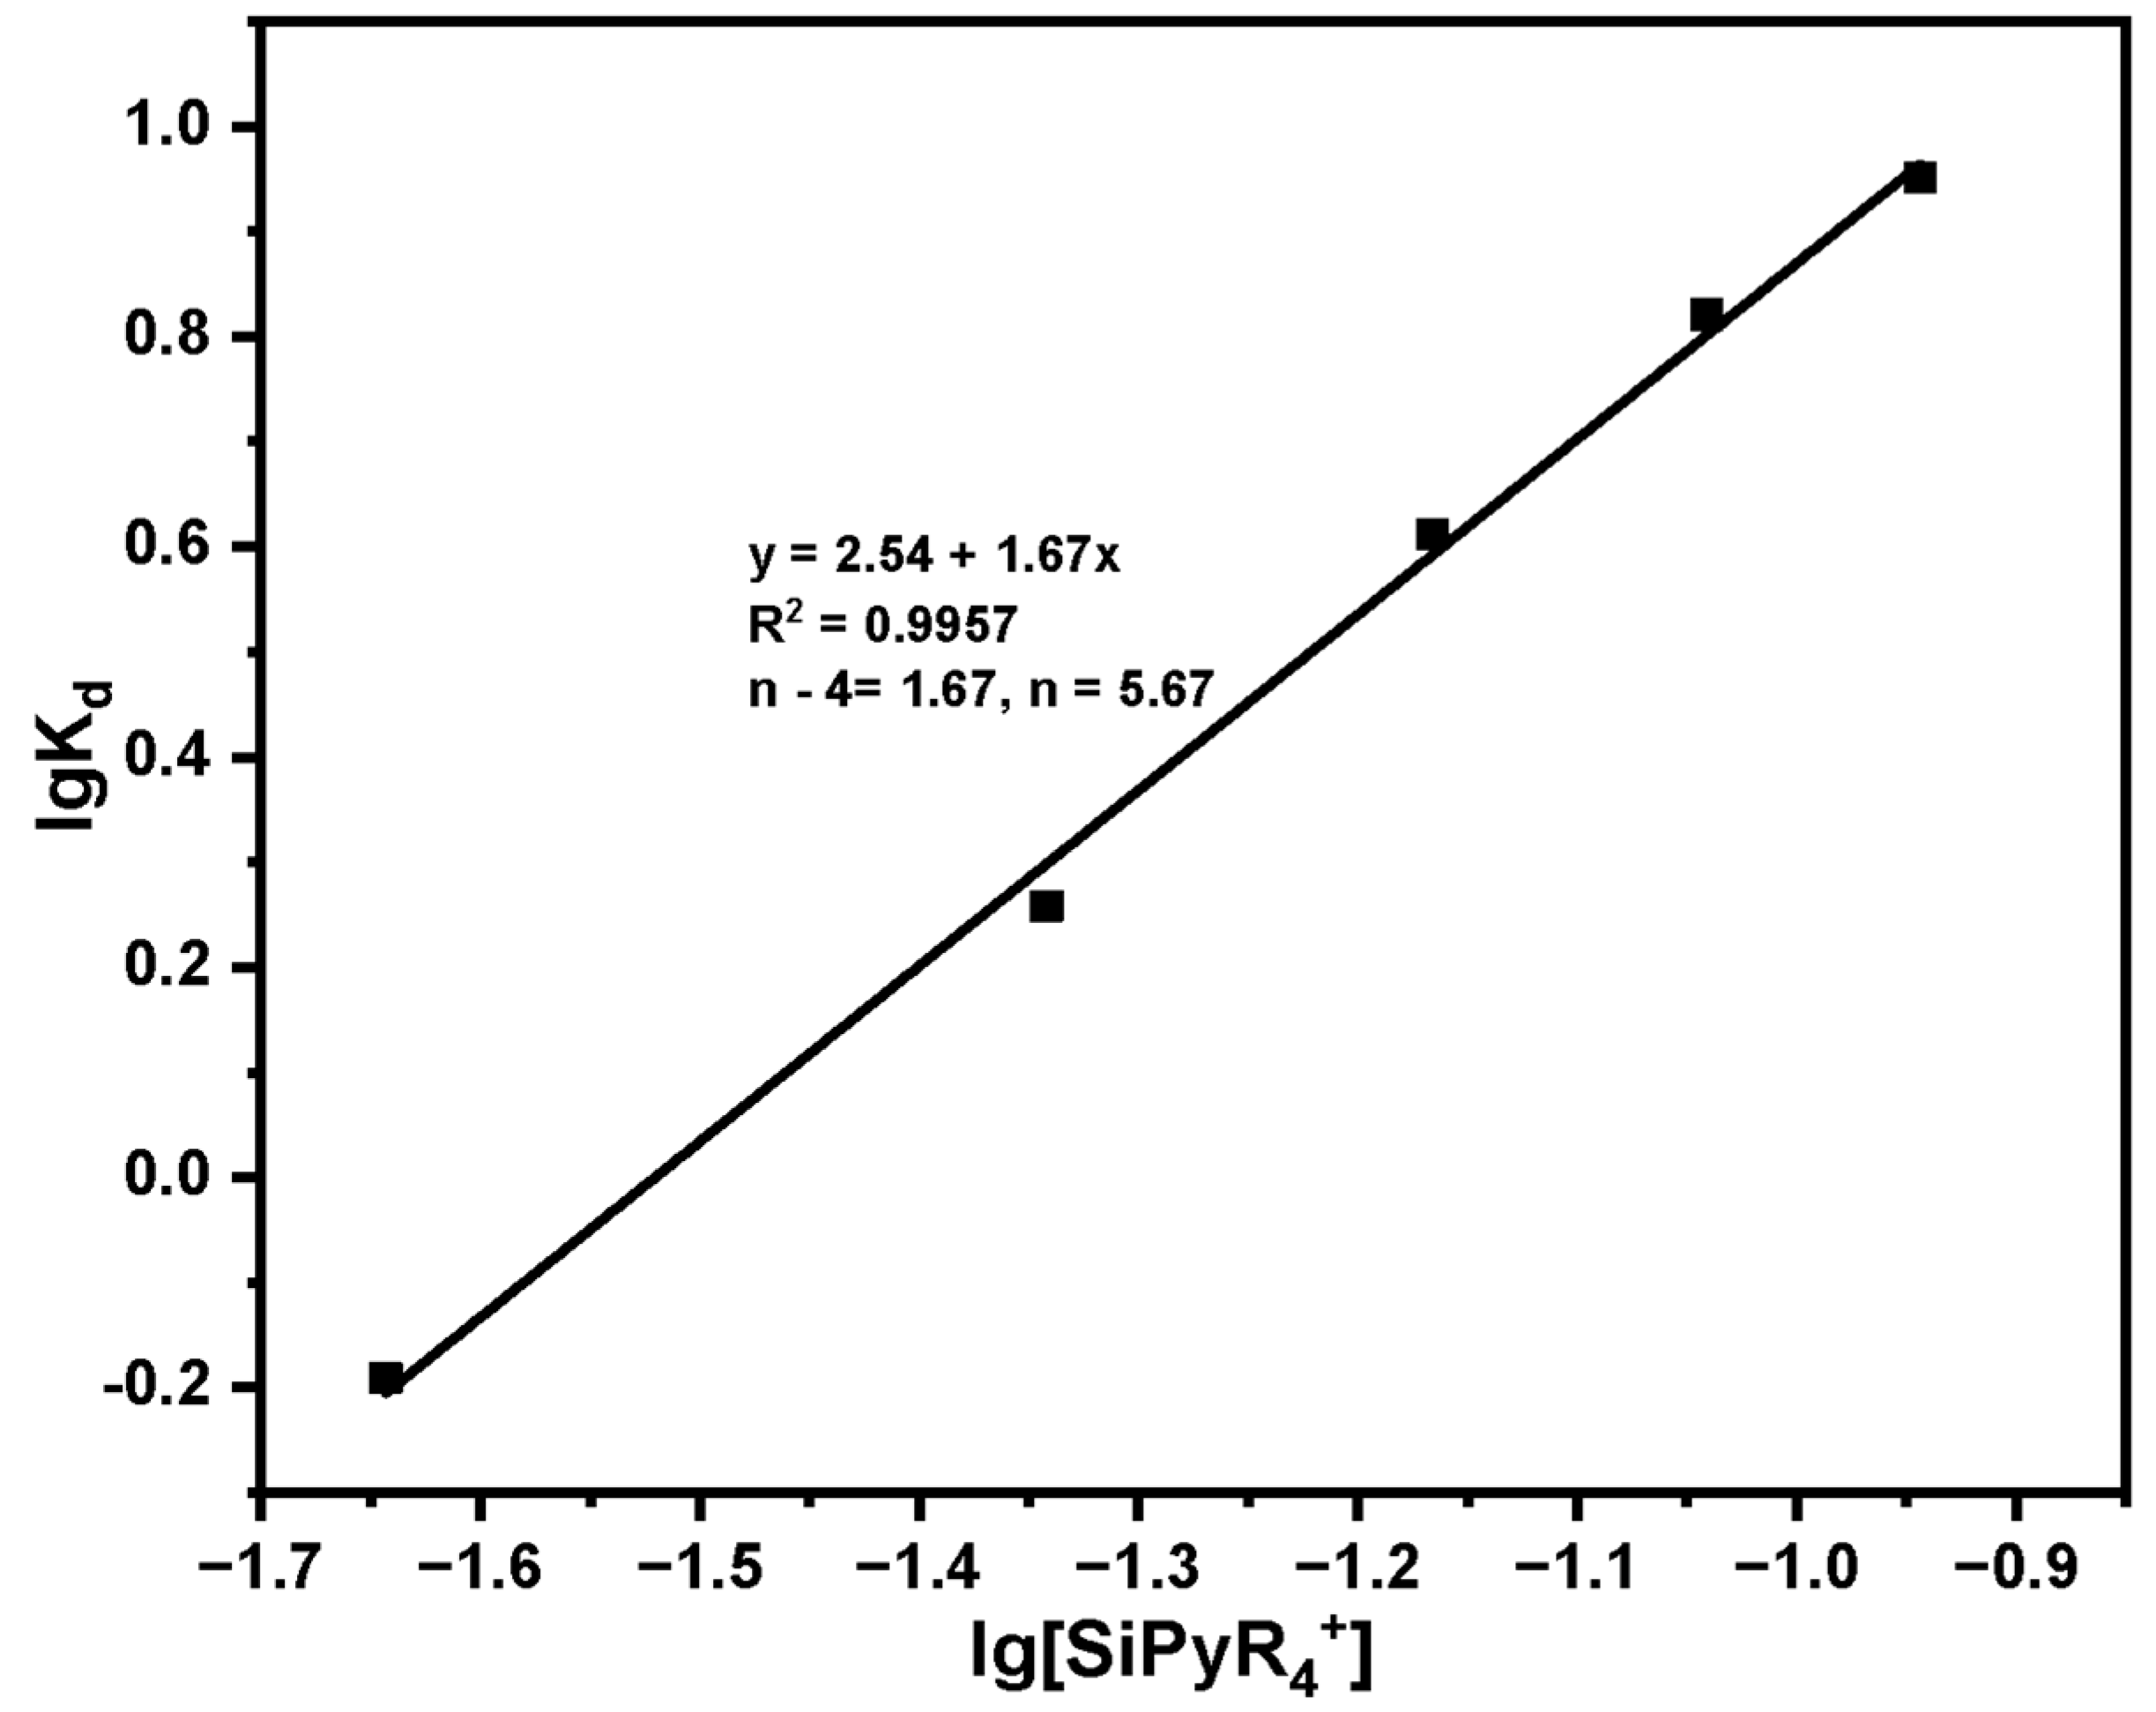
Study on the adsorption mechanism of Pu(IV) by SG-VTS-VPQ:
A total of 40 mg·L−1 Pu(IV) solution was configured to explore the adsorption mechanism of Pu(IV) on SG-VTS-VPQ. Set adsorbent dosage: 20 mg, 40 mg, 60 mg, 80 mg, 100 mg. Other conditions include: temperature 30 °C, acidity 4 mol·L−1 HNO3, adsorption time 1 h. After adsorption, filter, measure the equilibrium concentration of Pu(IV) with X fluorescence analyzer and record it as Ce. Equation (1) is used to calculate the adsorption capacity.
Separation experiment of trace plutonium in uranium matrix:
A certain amount of SG-VTS-VPQ was loaded into a 5-mL extraction chromatography column, and passed through the column with 2 mol·L−1 HNO3 to make it pre-equilibrated for use. The natural flow rate of the chromatographic column is about 0.5–0.6 mL·min−1. Prepare the following U-Pu mixed samples: U concentration 1000 mg·L−1, Pu concentration 20 mg·L−1, HNO3 concentration 2 mol·L−1.
Take 1 mL of the above U-Pu sample and pass it through chromatographic column. A total of 14 mL of 2 mol·L
−1 HNO
3 was used to elute the uranium, and then 13 mL of 0.3 mol·L
−1 HNO
3-0.3 Na
2C
2O
4 was used to elute the plutonium, and the uranium and plutonium eluent were collected separately. The concentrations of uranium and plutonium were measured by X-ray fluorescence analyzer, and the elution curves of uranium and plutonium were prepared. The formula for calculating the decontamination factor of uranium in plutonium is as follows (10):
Acidity stability test:
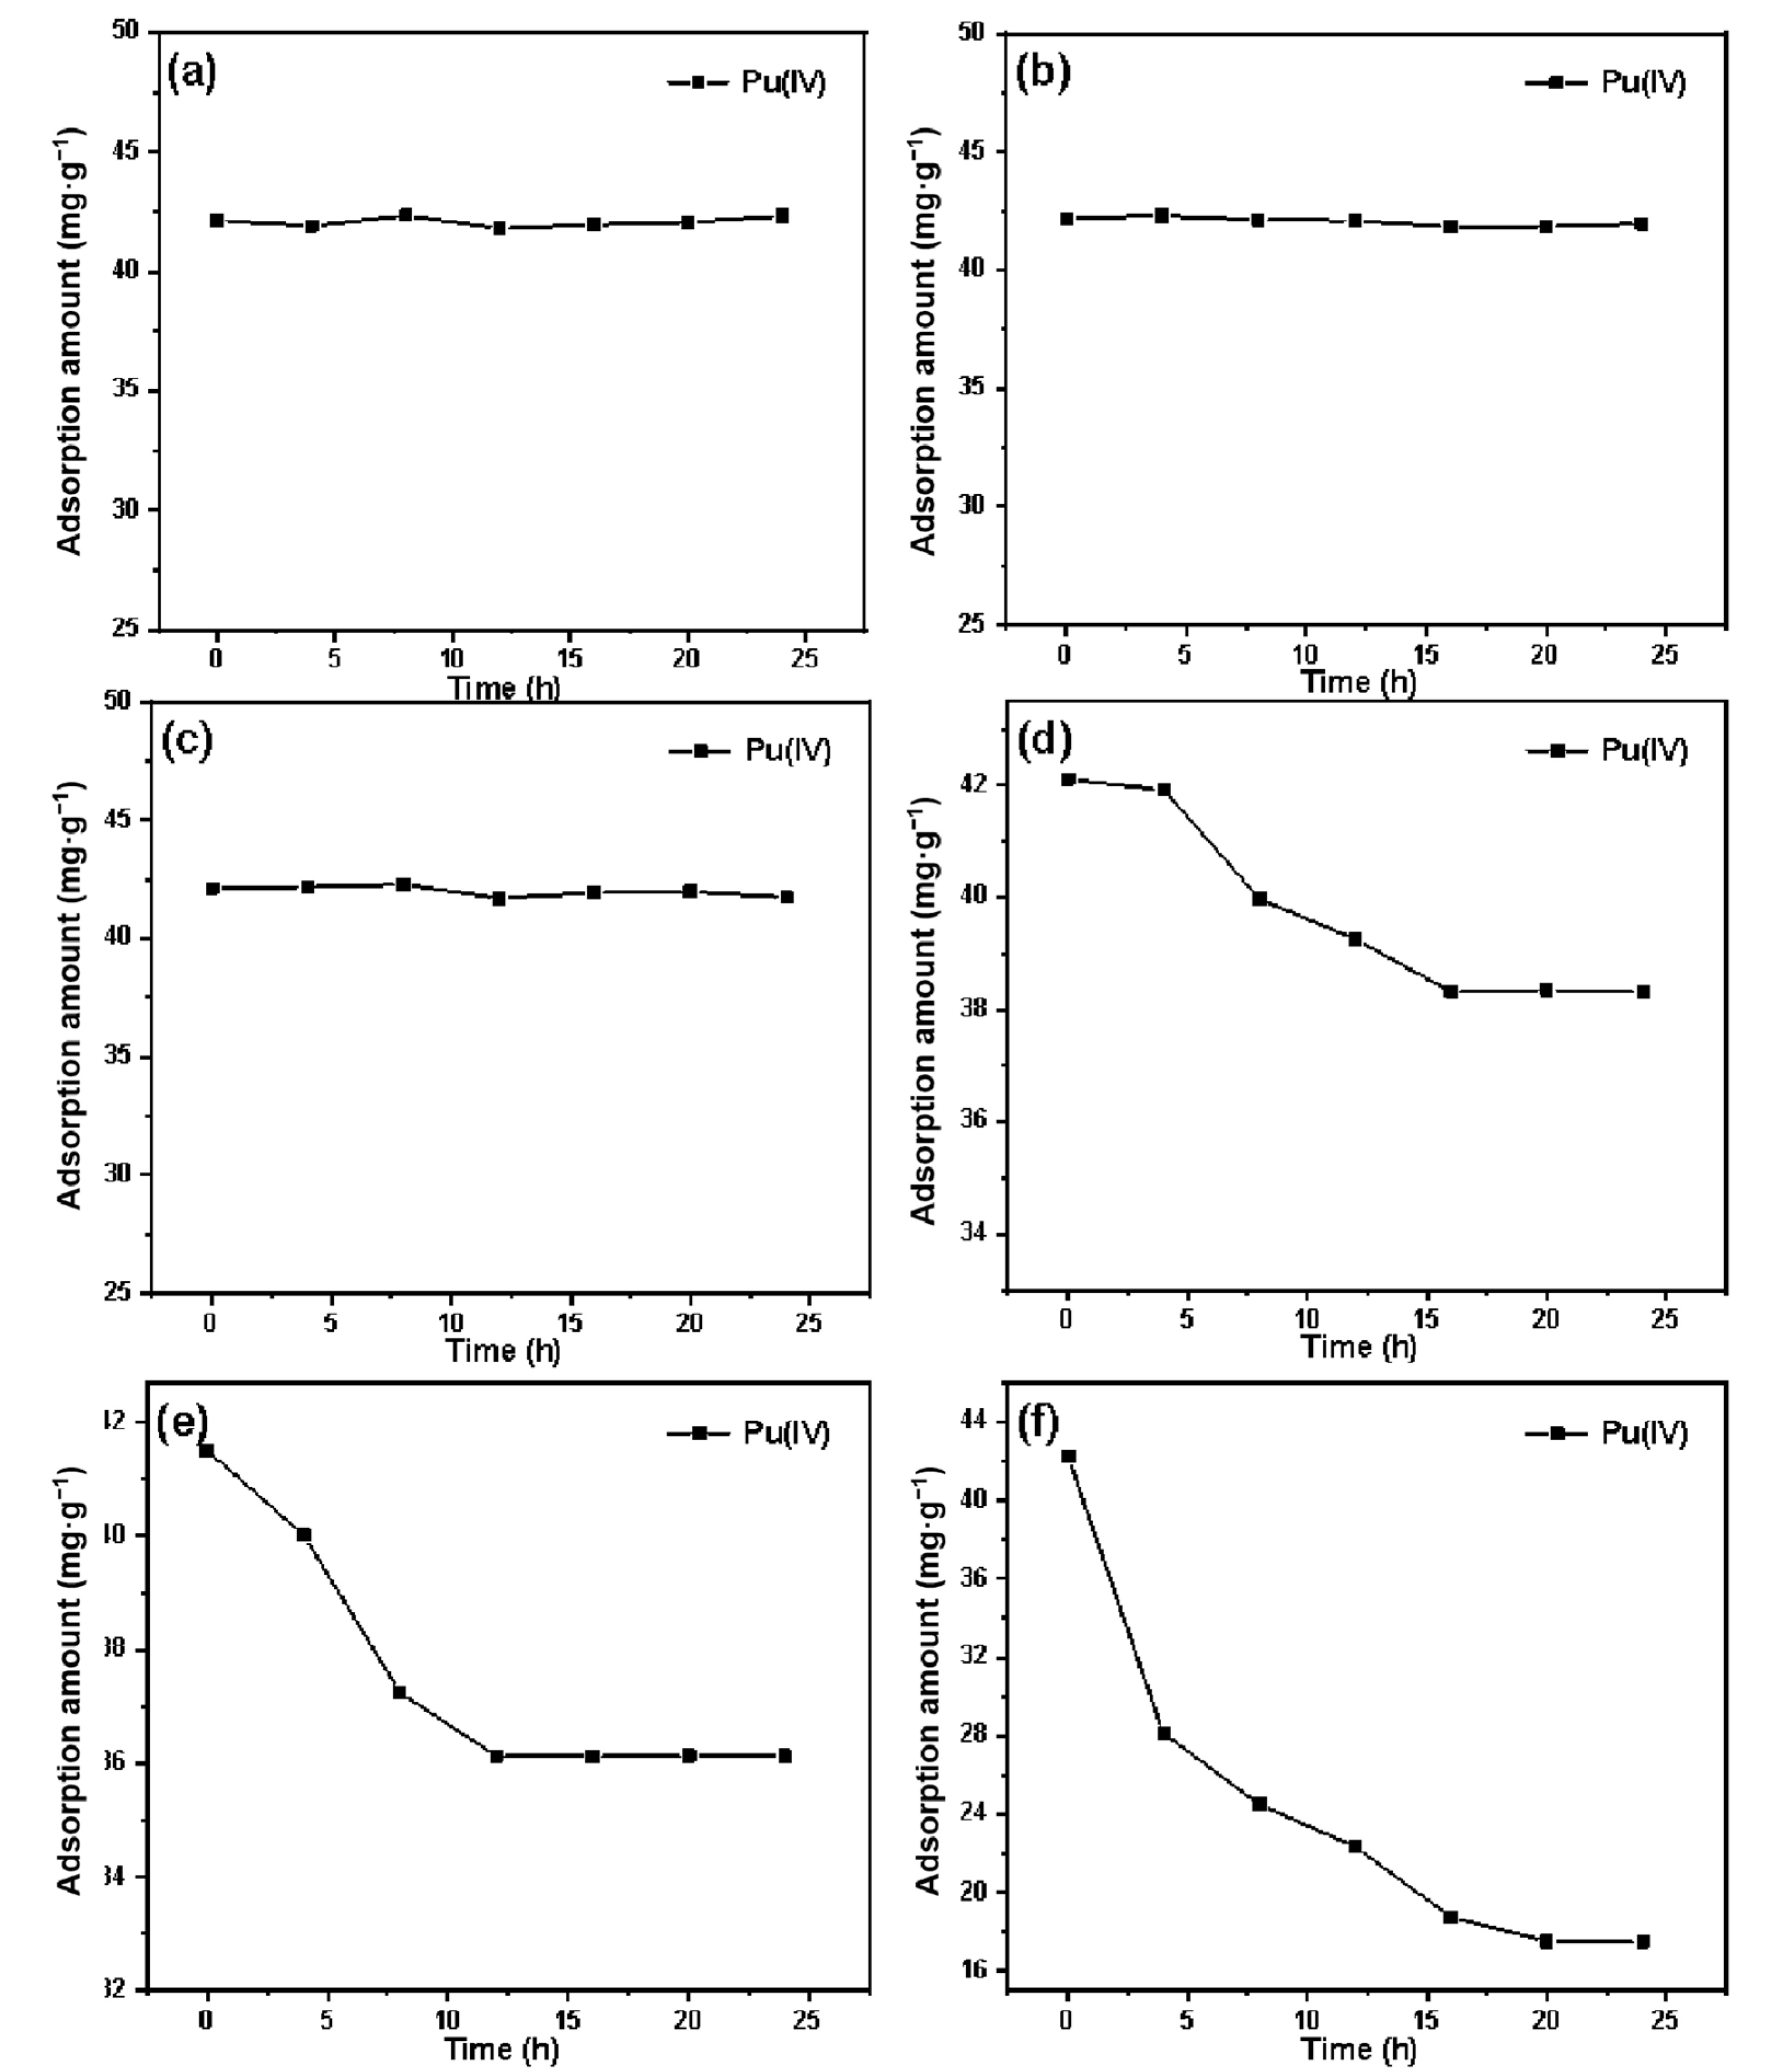
A certain amount of pretreated silicon-based quaternary ammonium material SG-VTS-VPQ was placed in 1 mol·L−1 HNO3, and soaked for 0 h, 4 h, 8 h, 12 h, 16 h, 20 h, and 24 h respectively, and then washed with deionized water until neutral, dried under vacuum at 80 °C and used for the adsorption experiment of Pu(IV). Change the above HNO3 concentration to 1 mol·L−1, 3 mol·L−1, 5 mol·L−1, 7 mol·L−1, 8 mol·L−1, and 9 mol·L−1, respectively. After soaking the material for the above time, it was used for adsorption experiments.
A total of 40 mg·L−1 of Pu(IV) was prepared for the static adsorption experiments of each of the above soaked materials. Other conditions include: temperature 30 °C, acidity 4 mol·L−1 HNO3, adsorption time 1 h. After standing for adsorption and filtering, the equilibrium concentration of Pu(VI) was measured by X-ray fluorescence analyzer, which was recorded as Ce. Equation (1) was used to calculate the adsorption capacity.
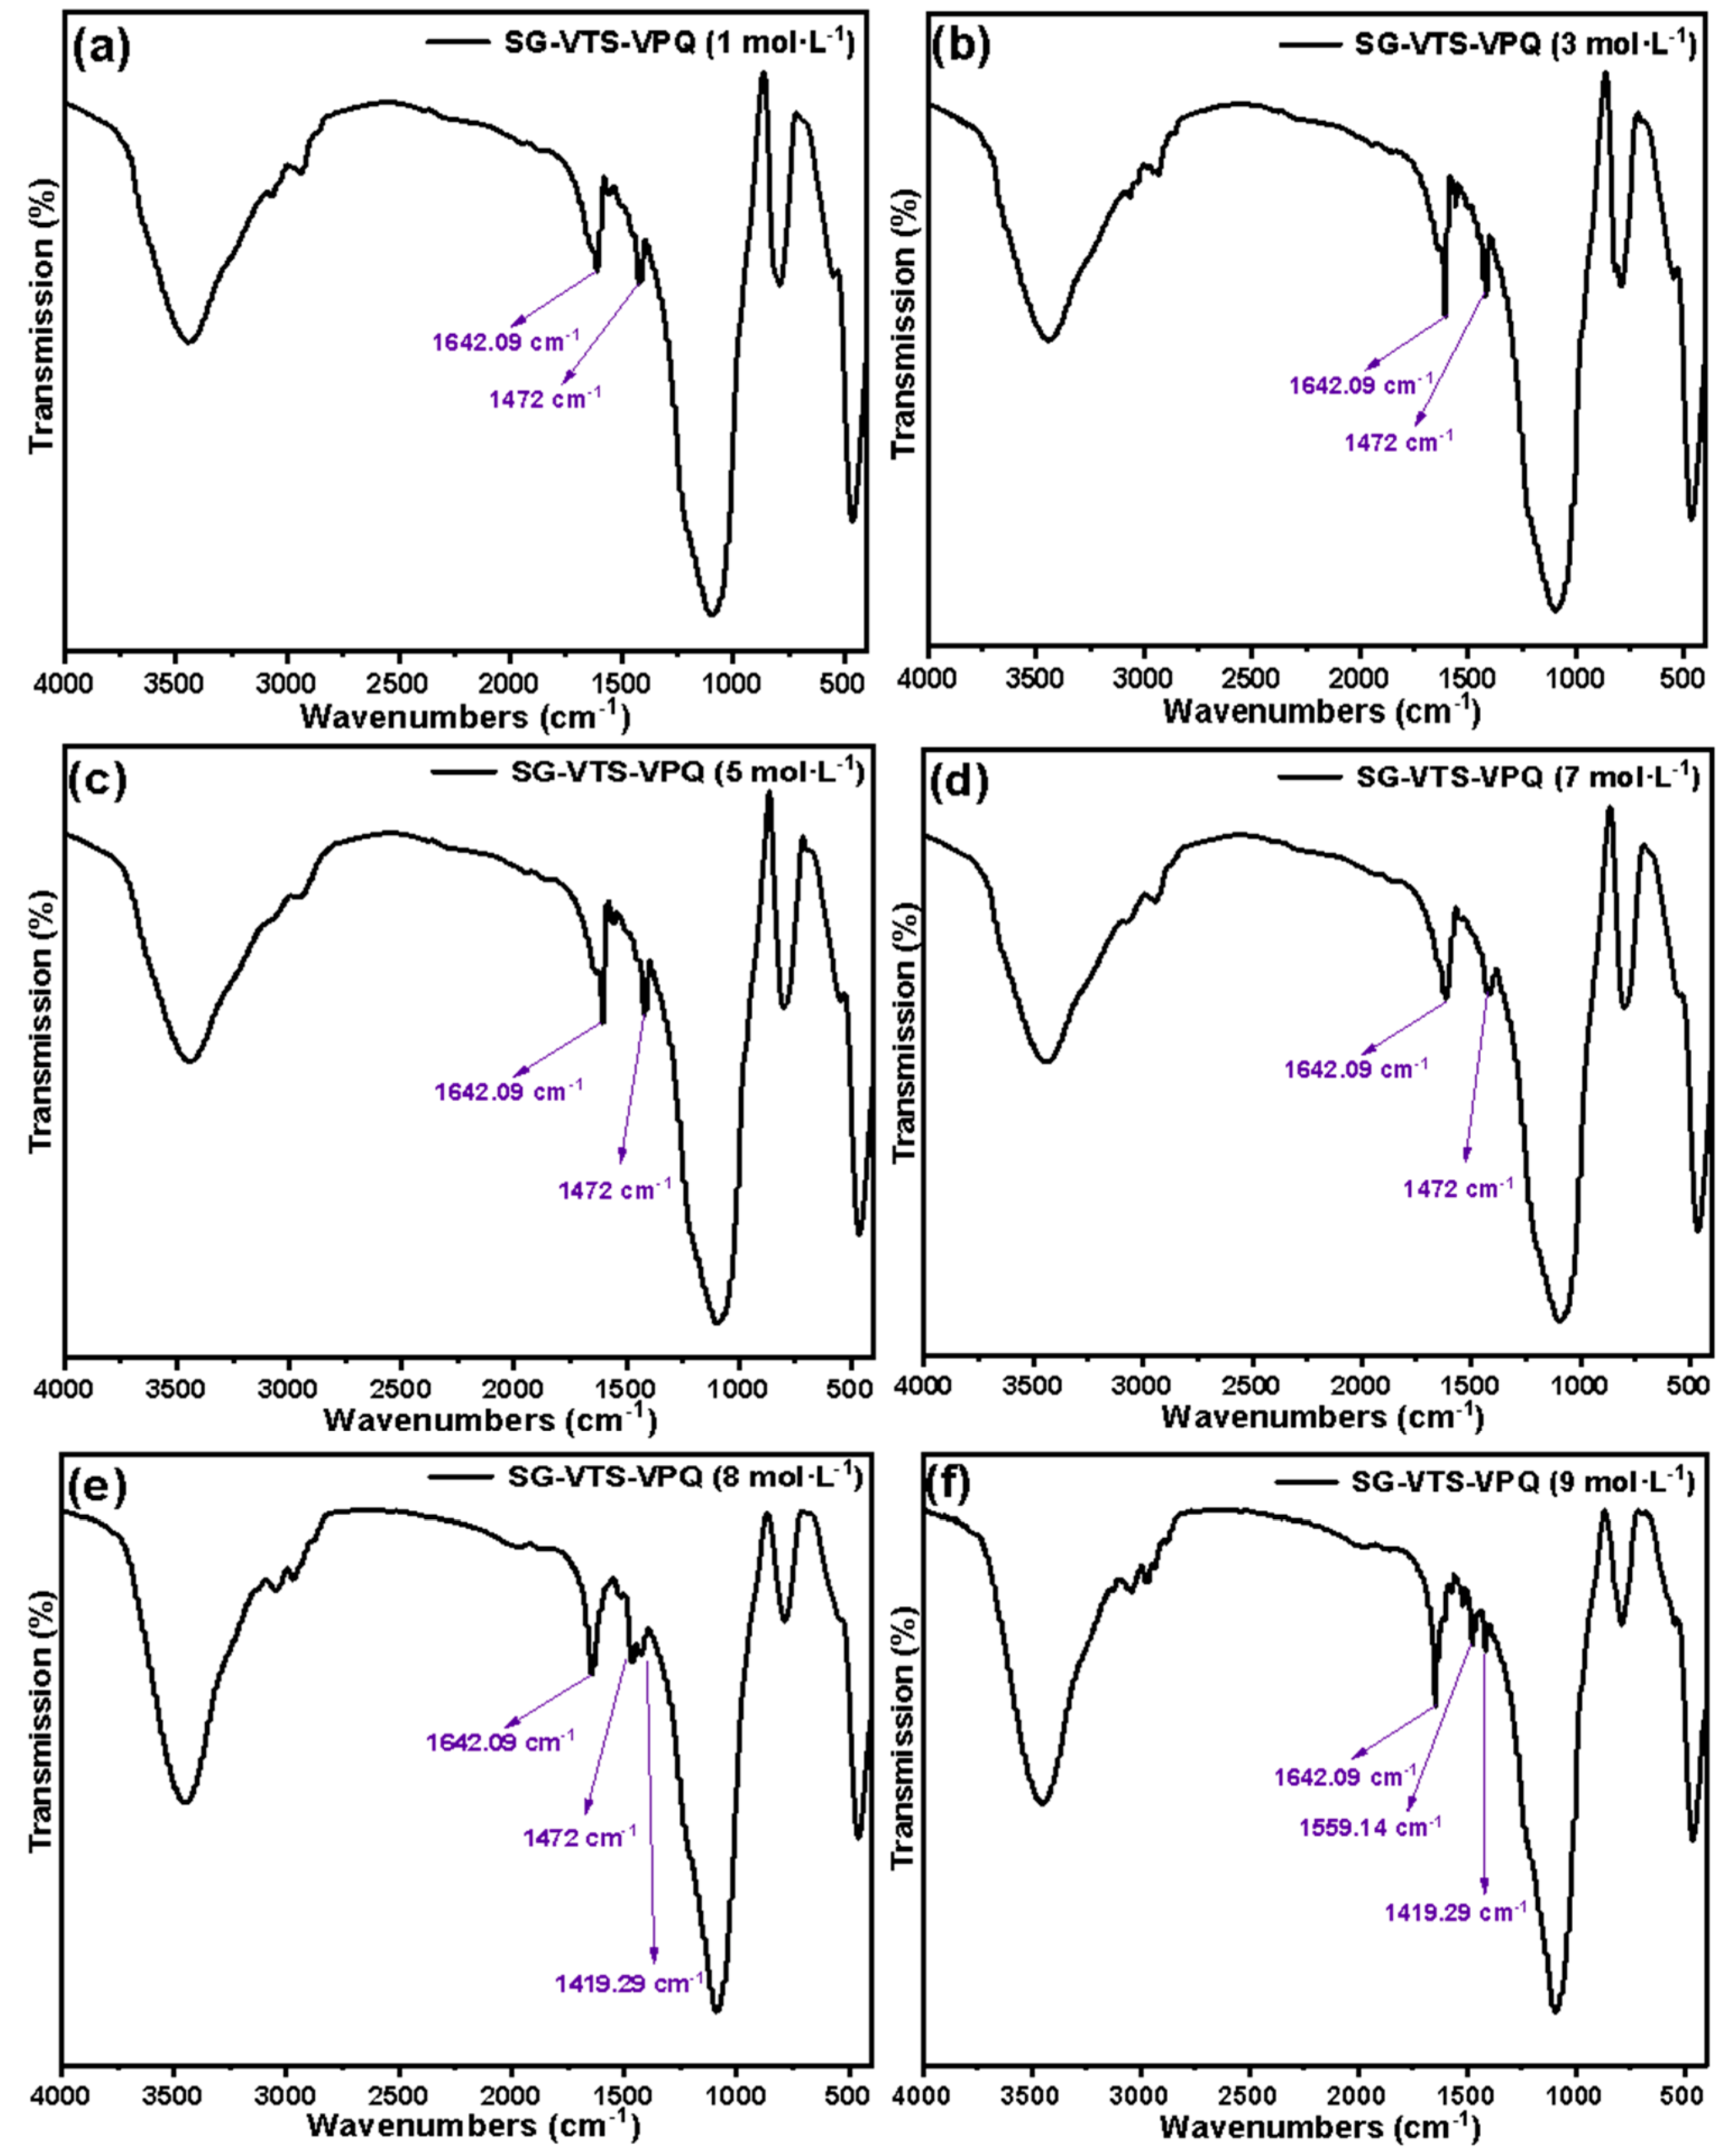
Fourier transform infrared spectrometer was used to measure the infrared spectrum of SG-VTS-VPQ after soaking in different acidity for 24 h. The SG-VTS-VPQ and potassium bromide were mixed uniformly in a ratio of 1:100 and placed on a manual tablet machine to make flakes. The test is carried out under the following conditions: the resolution is 4 cm−1, the scanning range is 4000–500 cm−1, and the scanning is performed 16 times.
Adsorption stability research experiment:
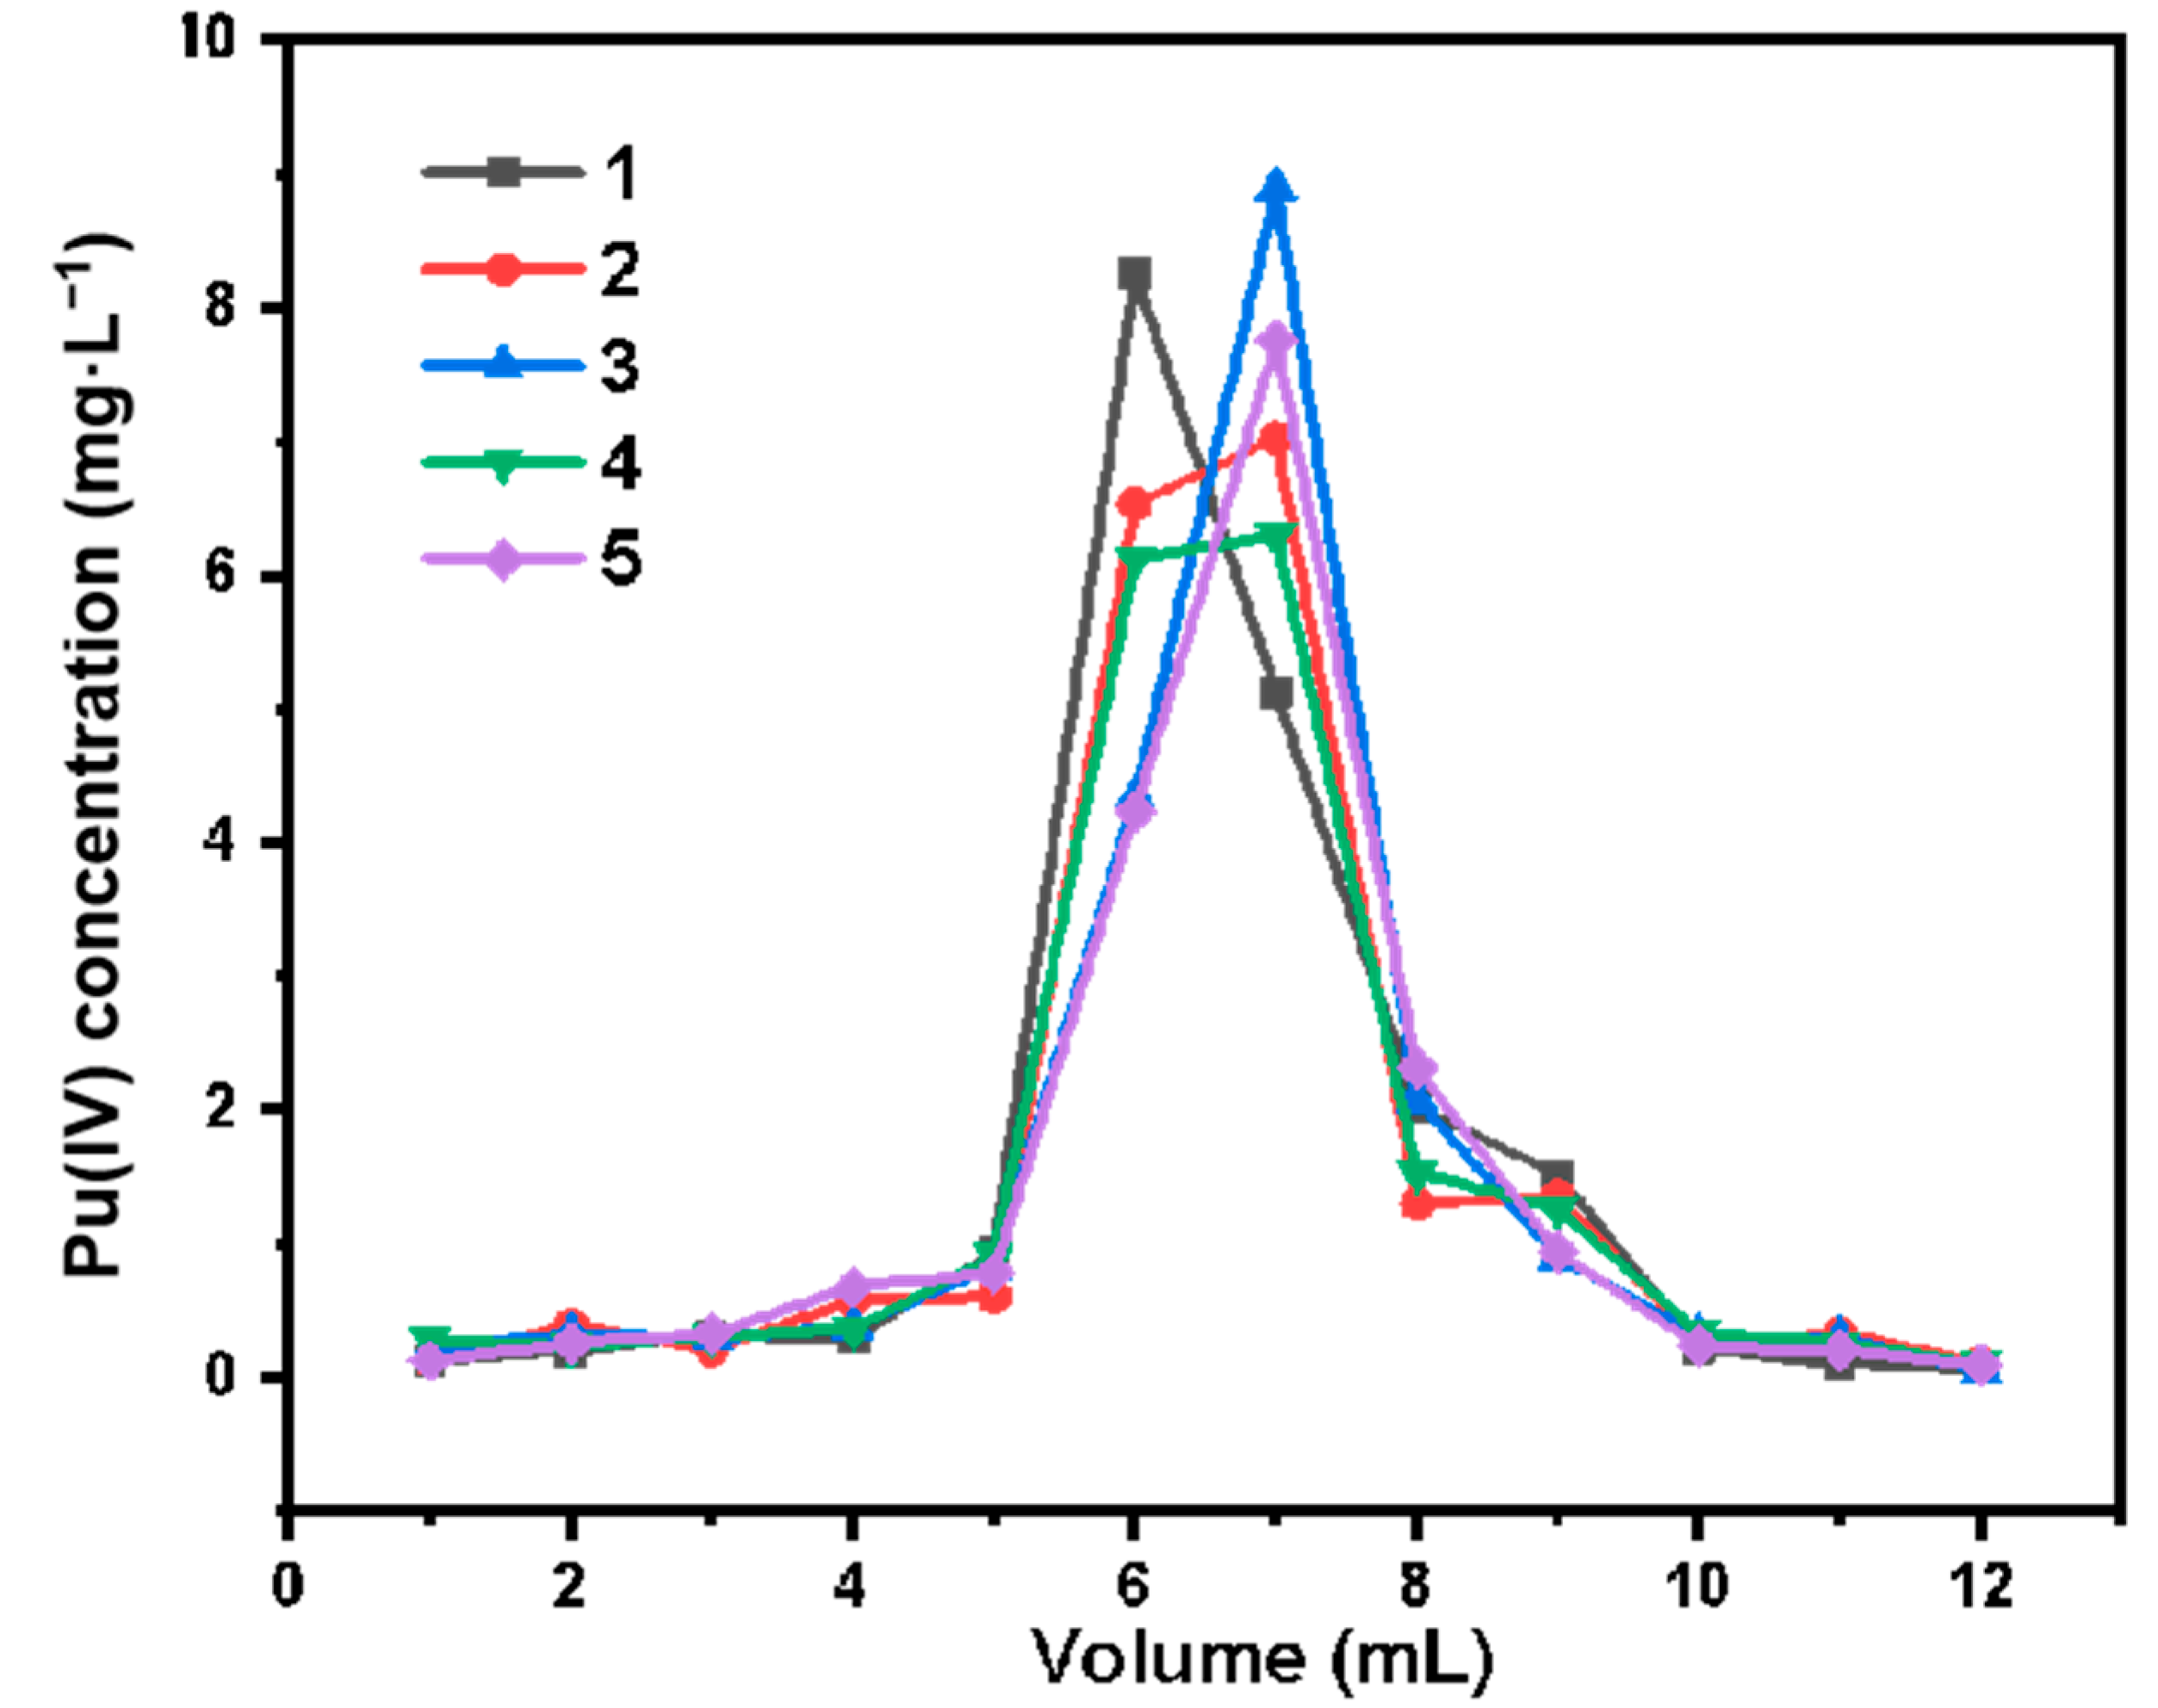
The following Pu(IV) samples were prepared: Pu concentration 20 mg·L−1, HNO3 concentration 4 mol·L−1. First, take 1 mL of the above sample and pass it through the chromatographic column, then wash the column with 15 mL of 4 mol·L−1 HNO3, and then use 12 mL of 0.3 mol·L−1 HNO3–0.3 mol·L−1 Na2C2O4 to elute Pu, and collect the eluent of Pu. The concentration of the eluent of Pu was measured by X-ray fluorescence analyzer, and the elution curve of Pu was prepared.
The eluted chromatographic column was washed with a large amount of deionized water, and then passed through the column with 4 mol·L−1 HNO3 to make it pre-equilibrated. The above experiment was repeated 5 times, and the elution curve of Pu was made.
Establishment of Pu standard curve:
Basic information of the self-made X-ray fluorescence analyzer: X-ray tube model Varian OEG-83J; transformer 50 KV, 100 mA; measuring unit PSX-16; controller CTX-16.
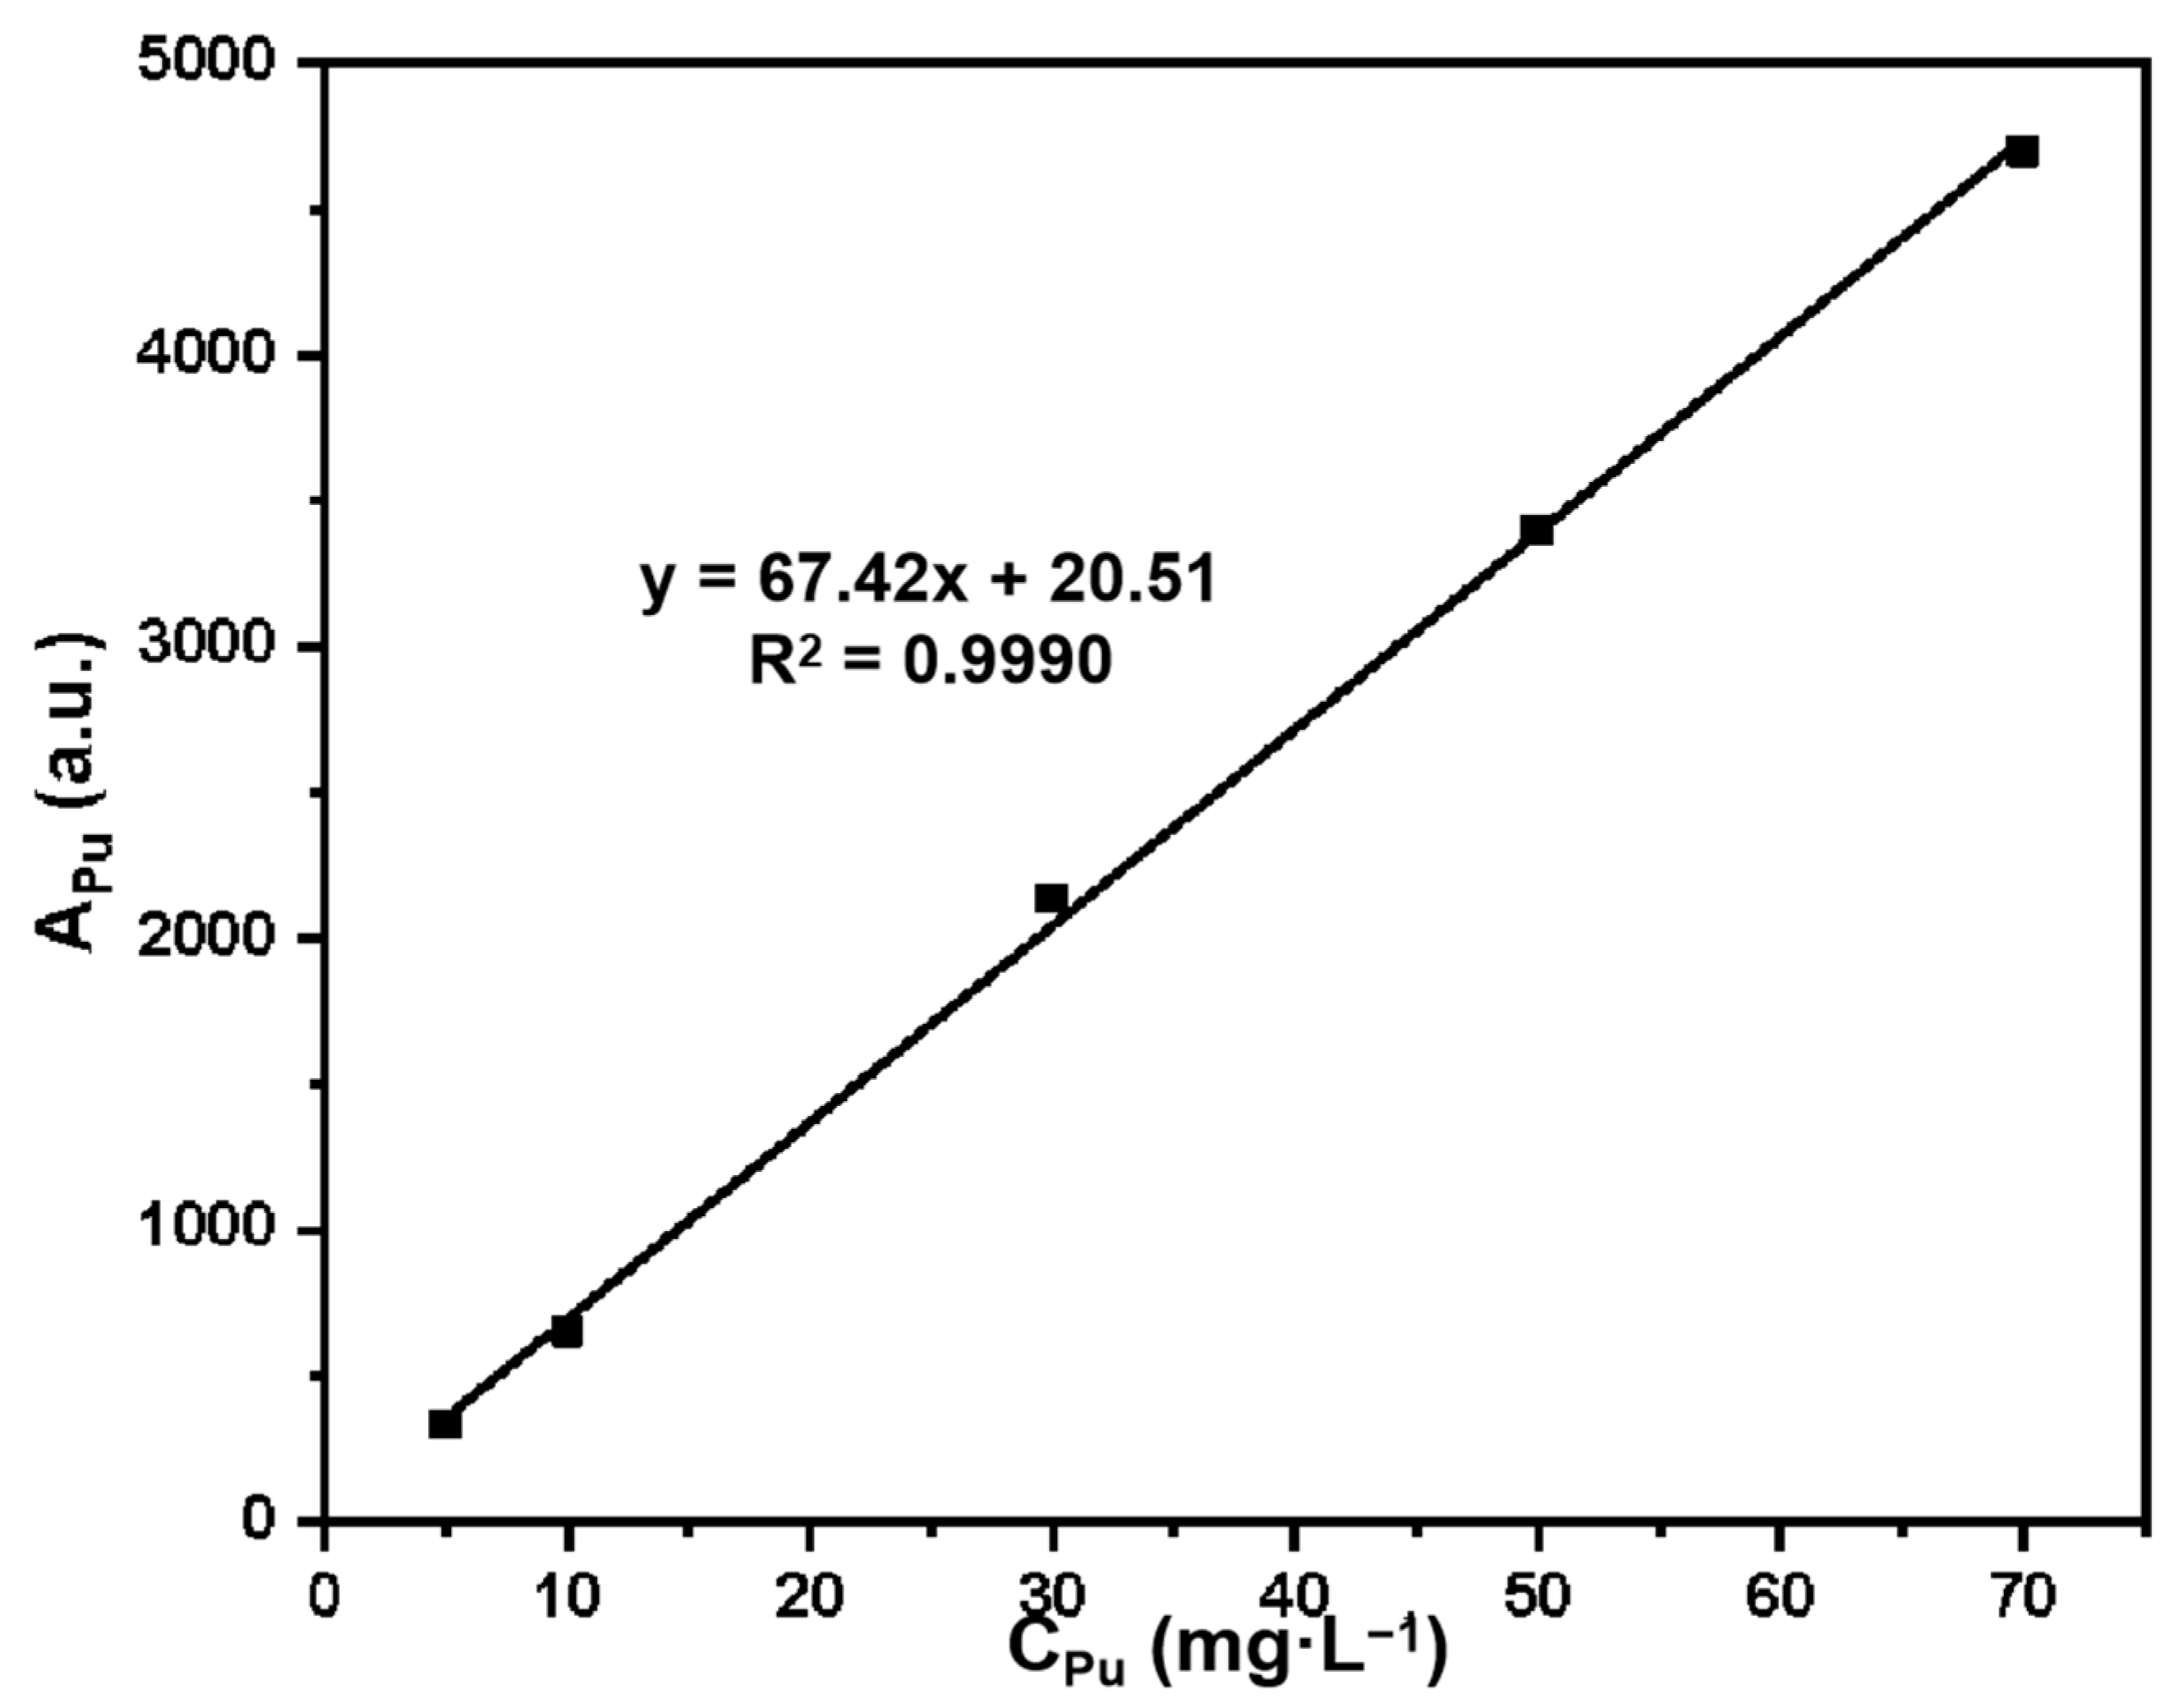
Plutonium standard series solutions with mass concentrations of 5 mg·L−1, 10 mg·L−1, 30 mg·L−1, 50 mg·L−1, and 70 mg·L−1 were prepared with 1 g·L−1 of Pu(IV) standard solution. The fluorescence intensity APu (au) of the standard series solution was determined by X-ray fluorescence spectroscopy, and the standard curve was drawn as APu versus CPu (Pu concentration).
Measurement conditions: measurement mode: cyclic measurement; number of measurements 3; internal standard Agcom; background subtraction method: direct stripping; XRF measurement time 180s; interval time 180 s.
The standard curve equation for Pu is: y = 67.42x + 20.51, R
2 = 0.9990. The standard curve is shown in
Figure 1, and the linear relationship is good in the mass concentration range of 5–70 mg·L
−1.
The preparation process of SG-VTS-VPQ and the adsorption process of Pu(IV) are shown in
Figure 2.


