
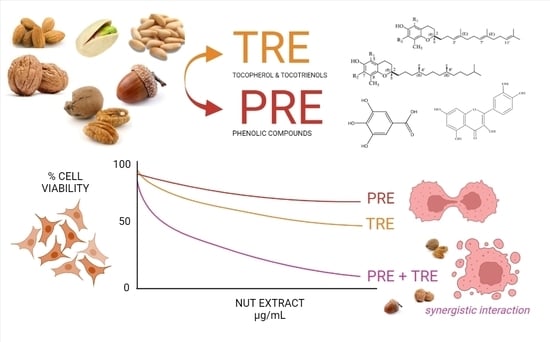
Synergistic Interactions between Tocol and Phenolic Extracts from Different Tree Nut Species against Human Cancer Cell Lines


 , , , , and
Abstract
:
1. Introduction
2. Results and Discussion
2.1. Antiproliferative Activity of Pure Tocopherols and Phenolic Compounds in Cancer Cell Lines
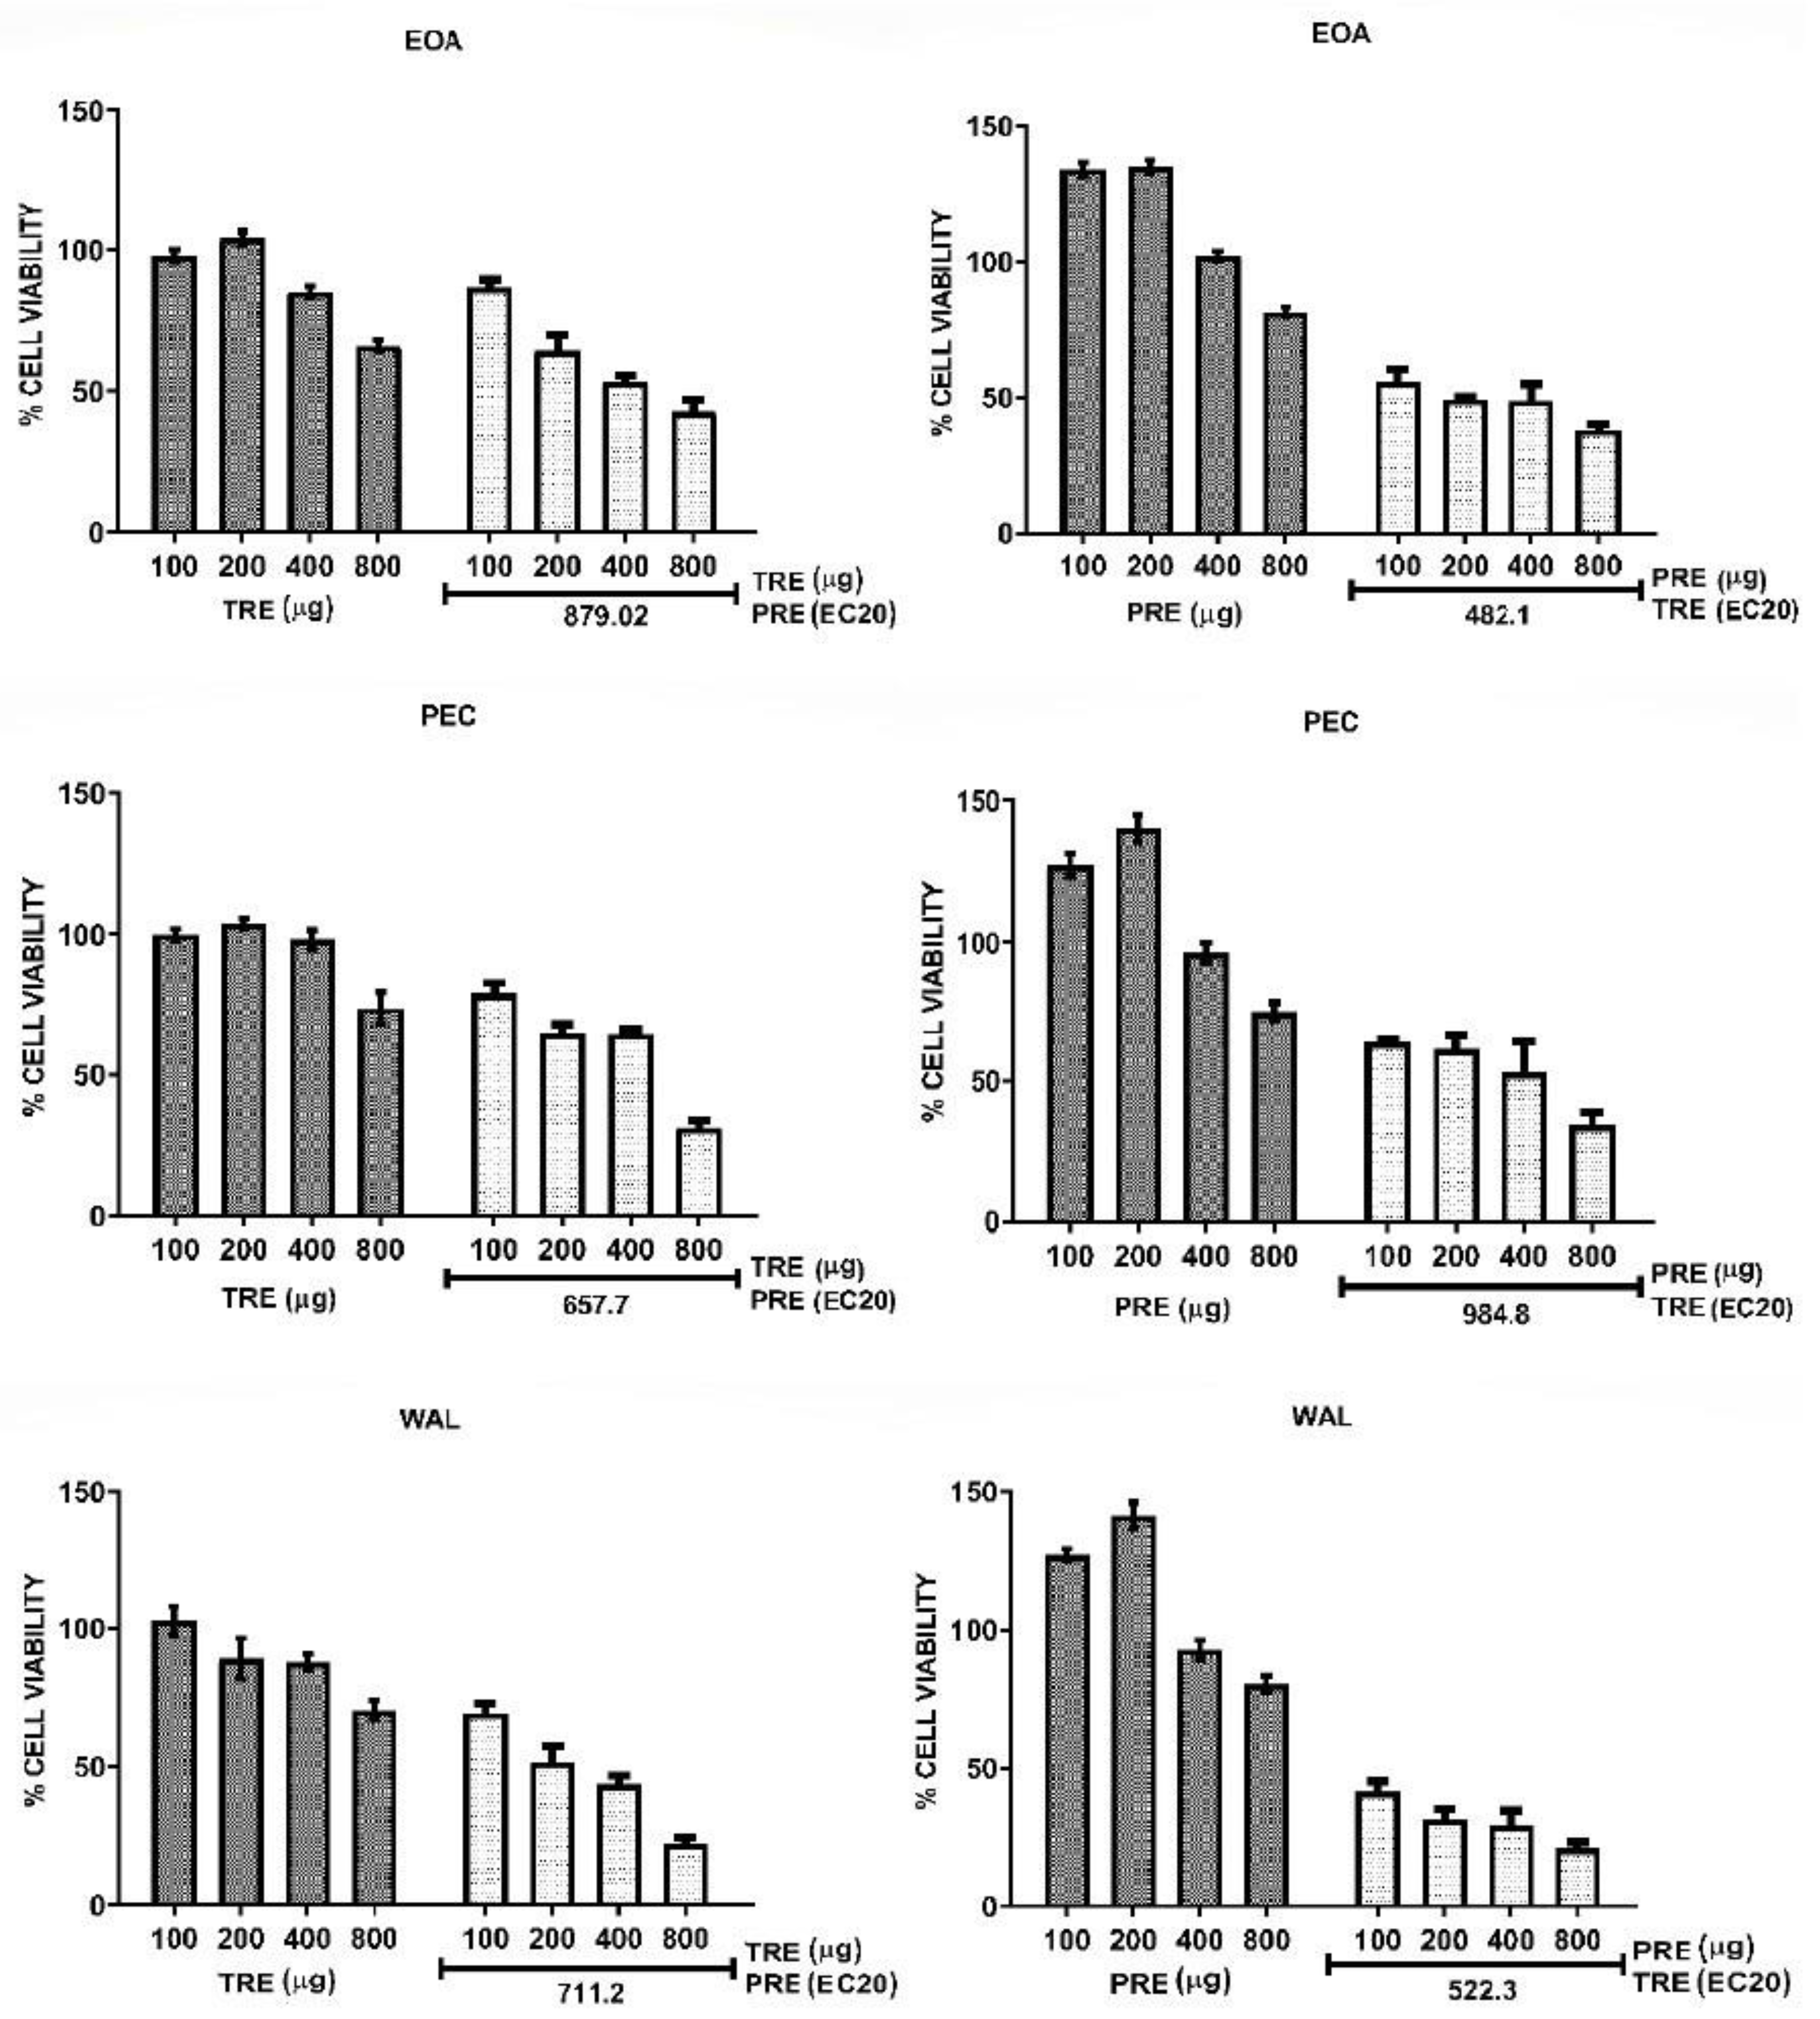
2.2. Antiproliferative Activity of Tree Nut TRE and PRE
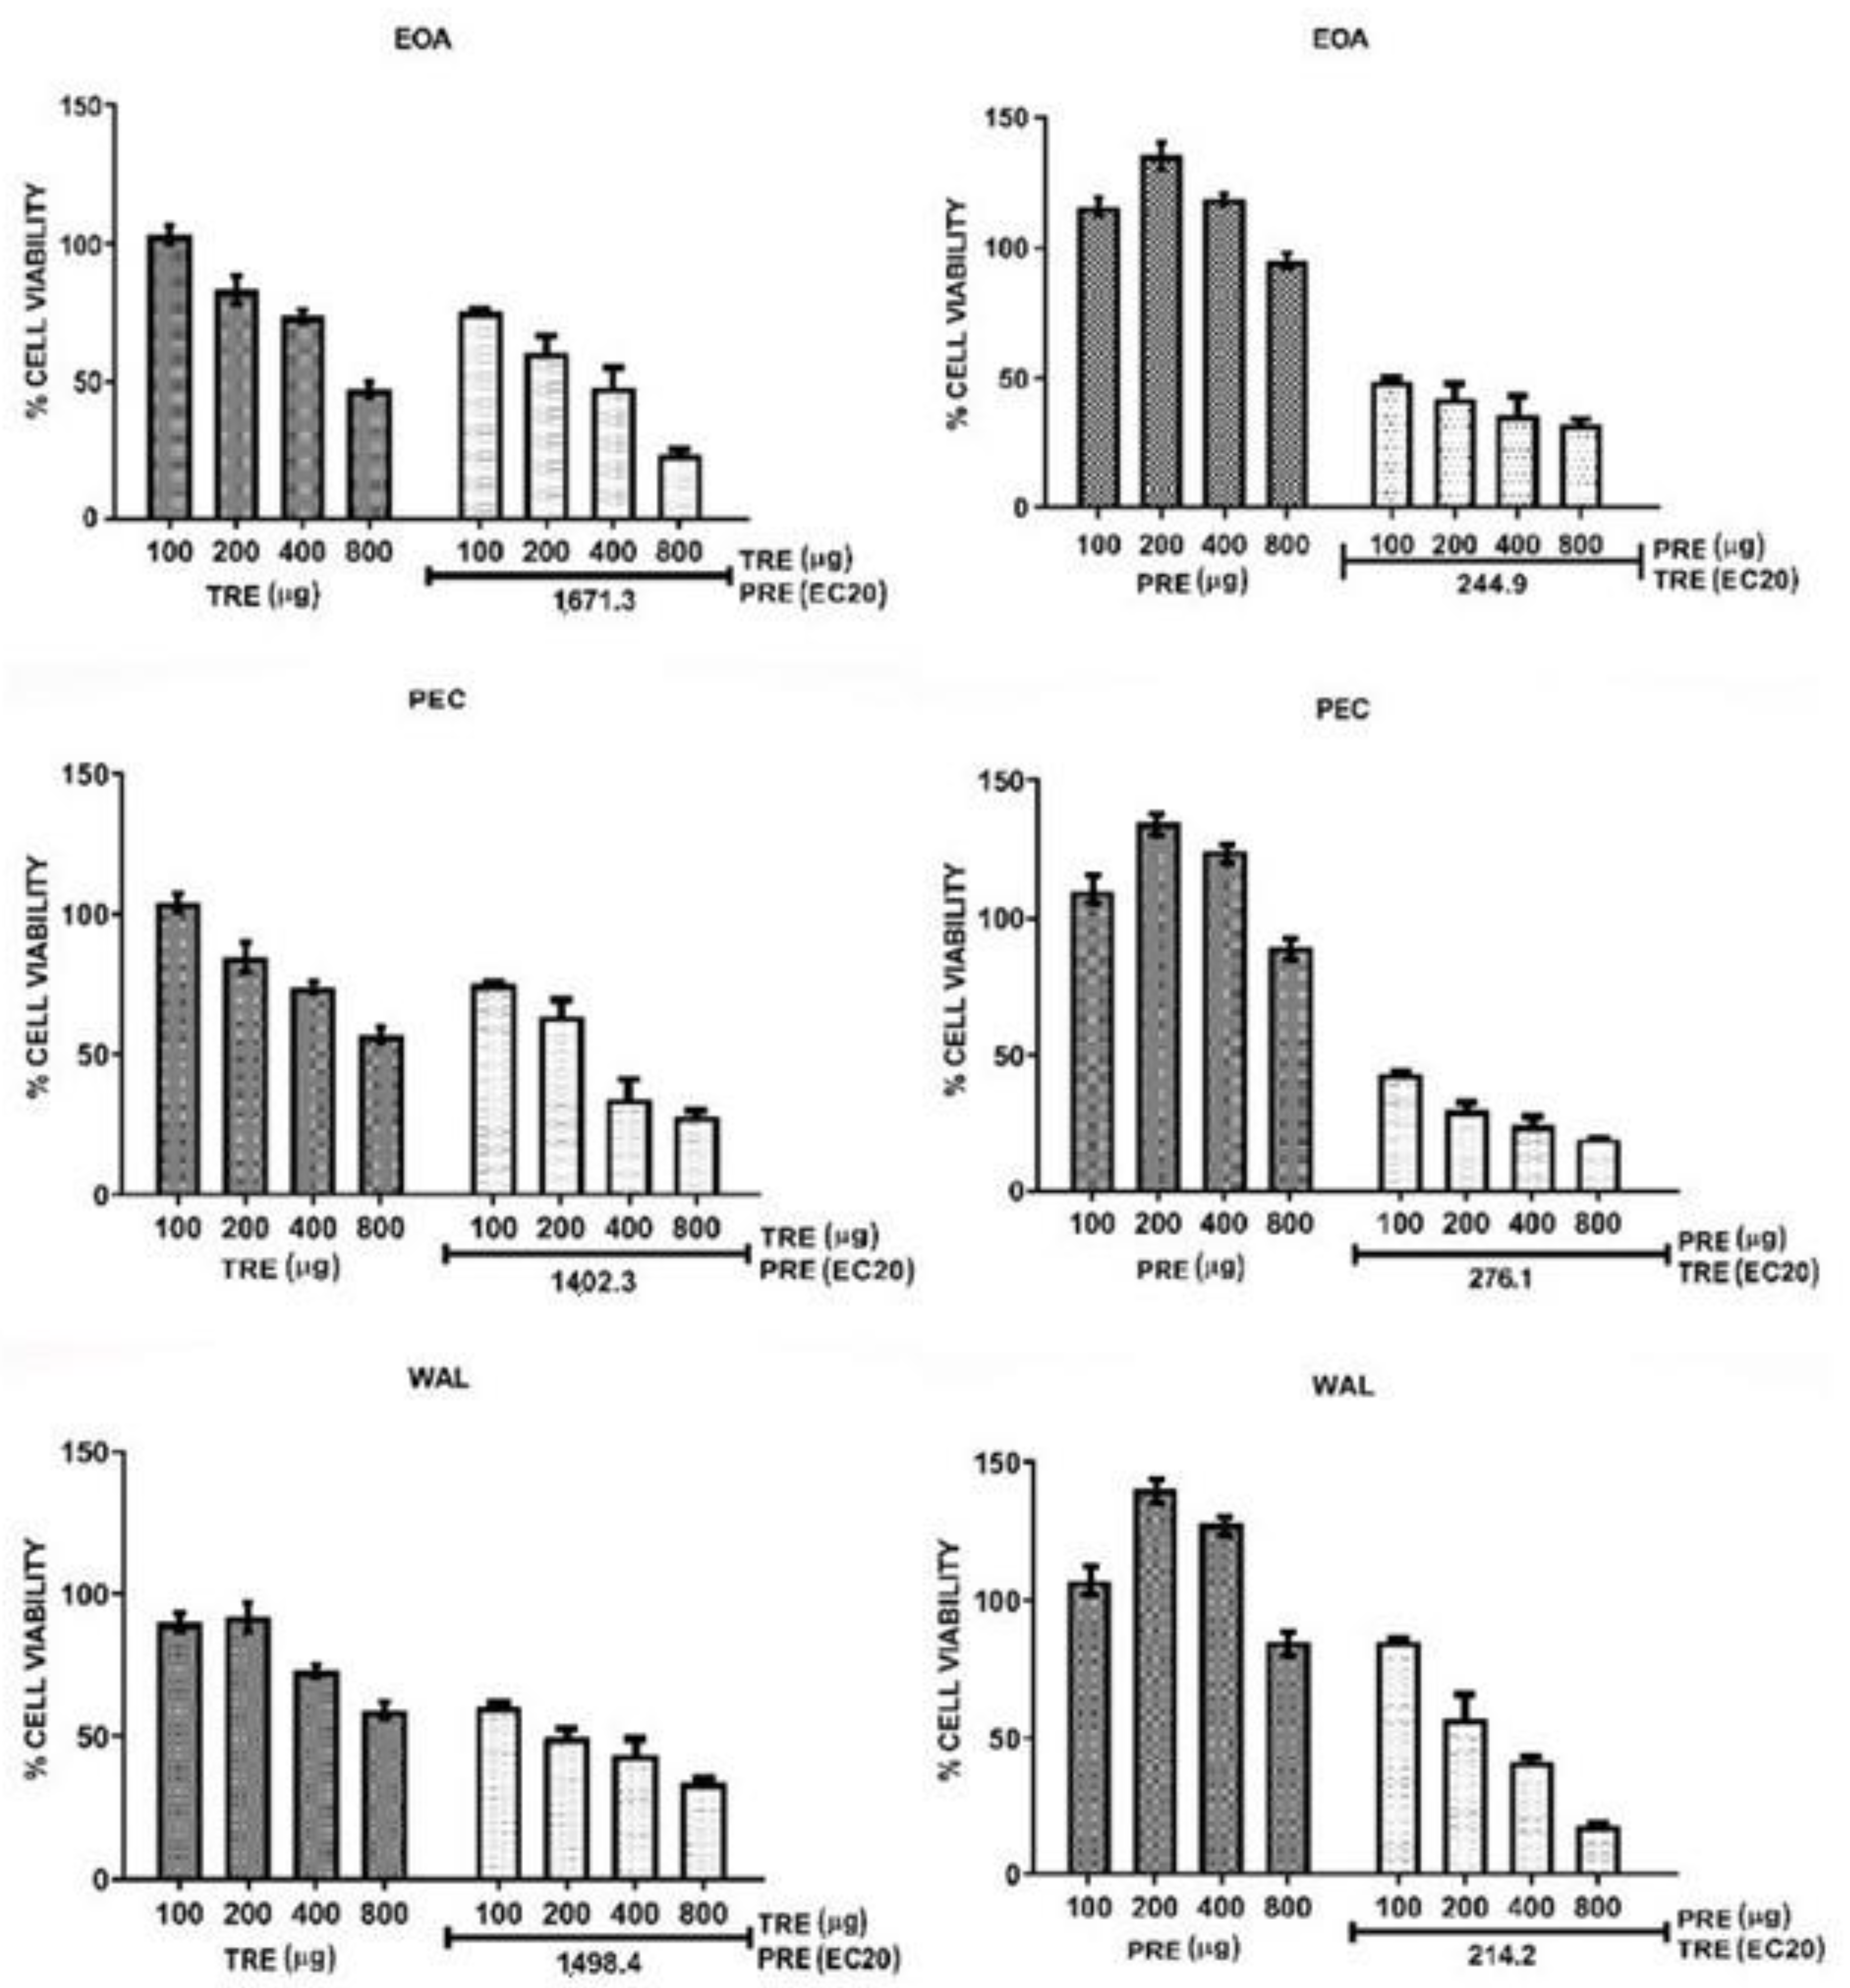
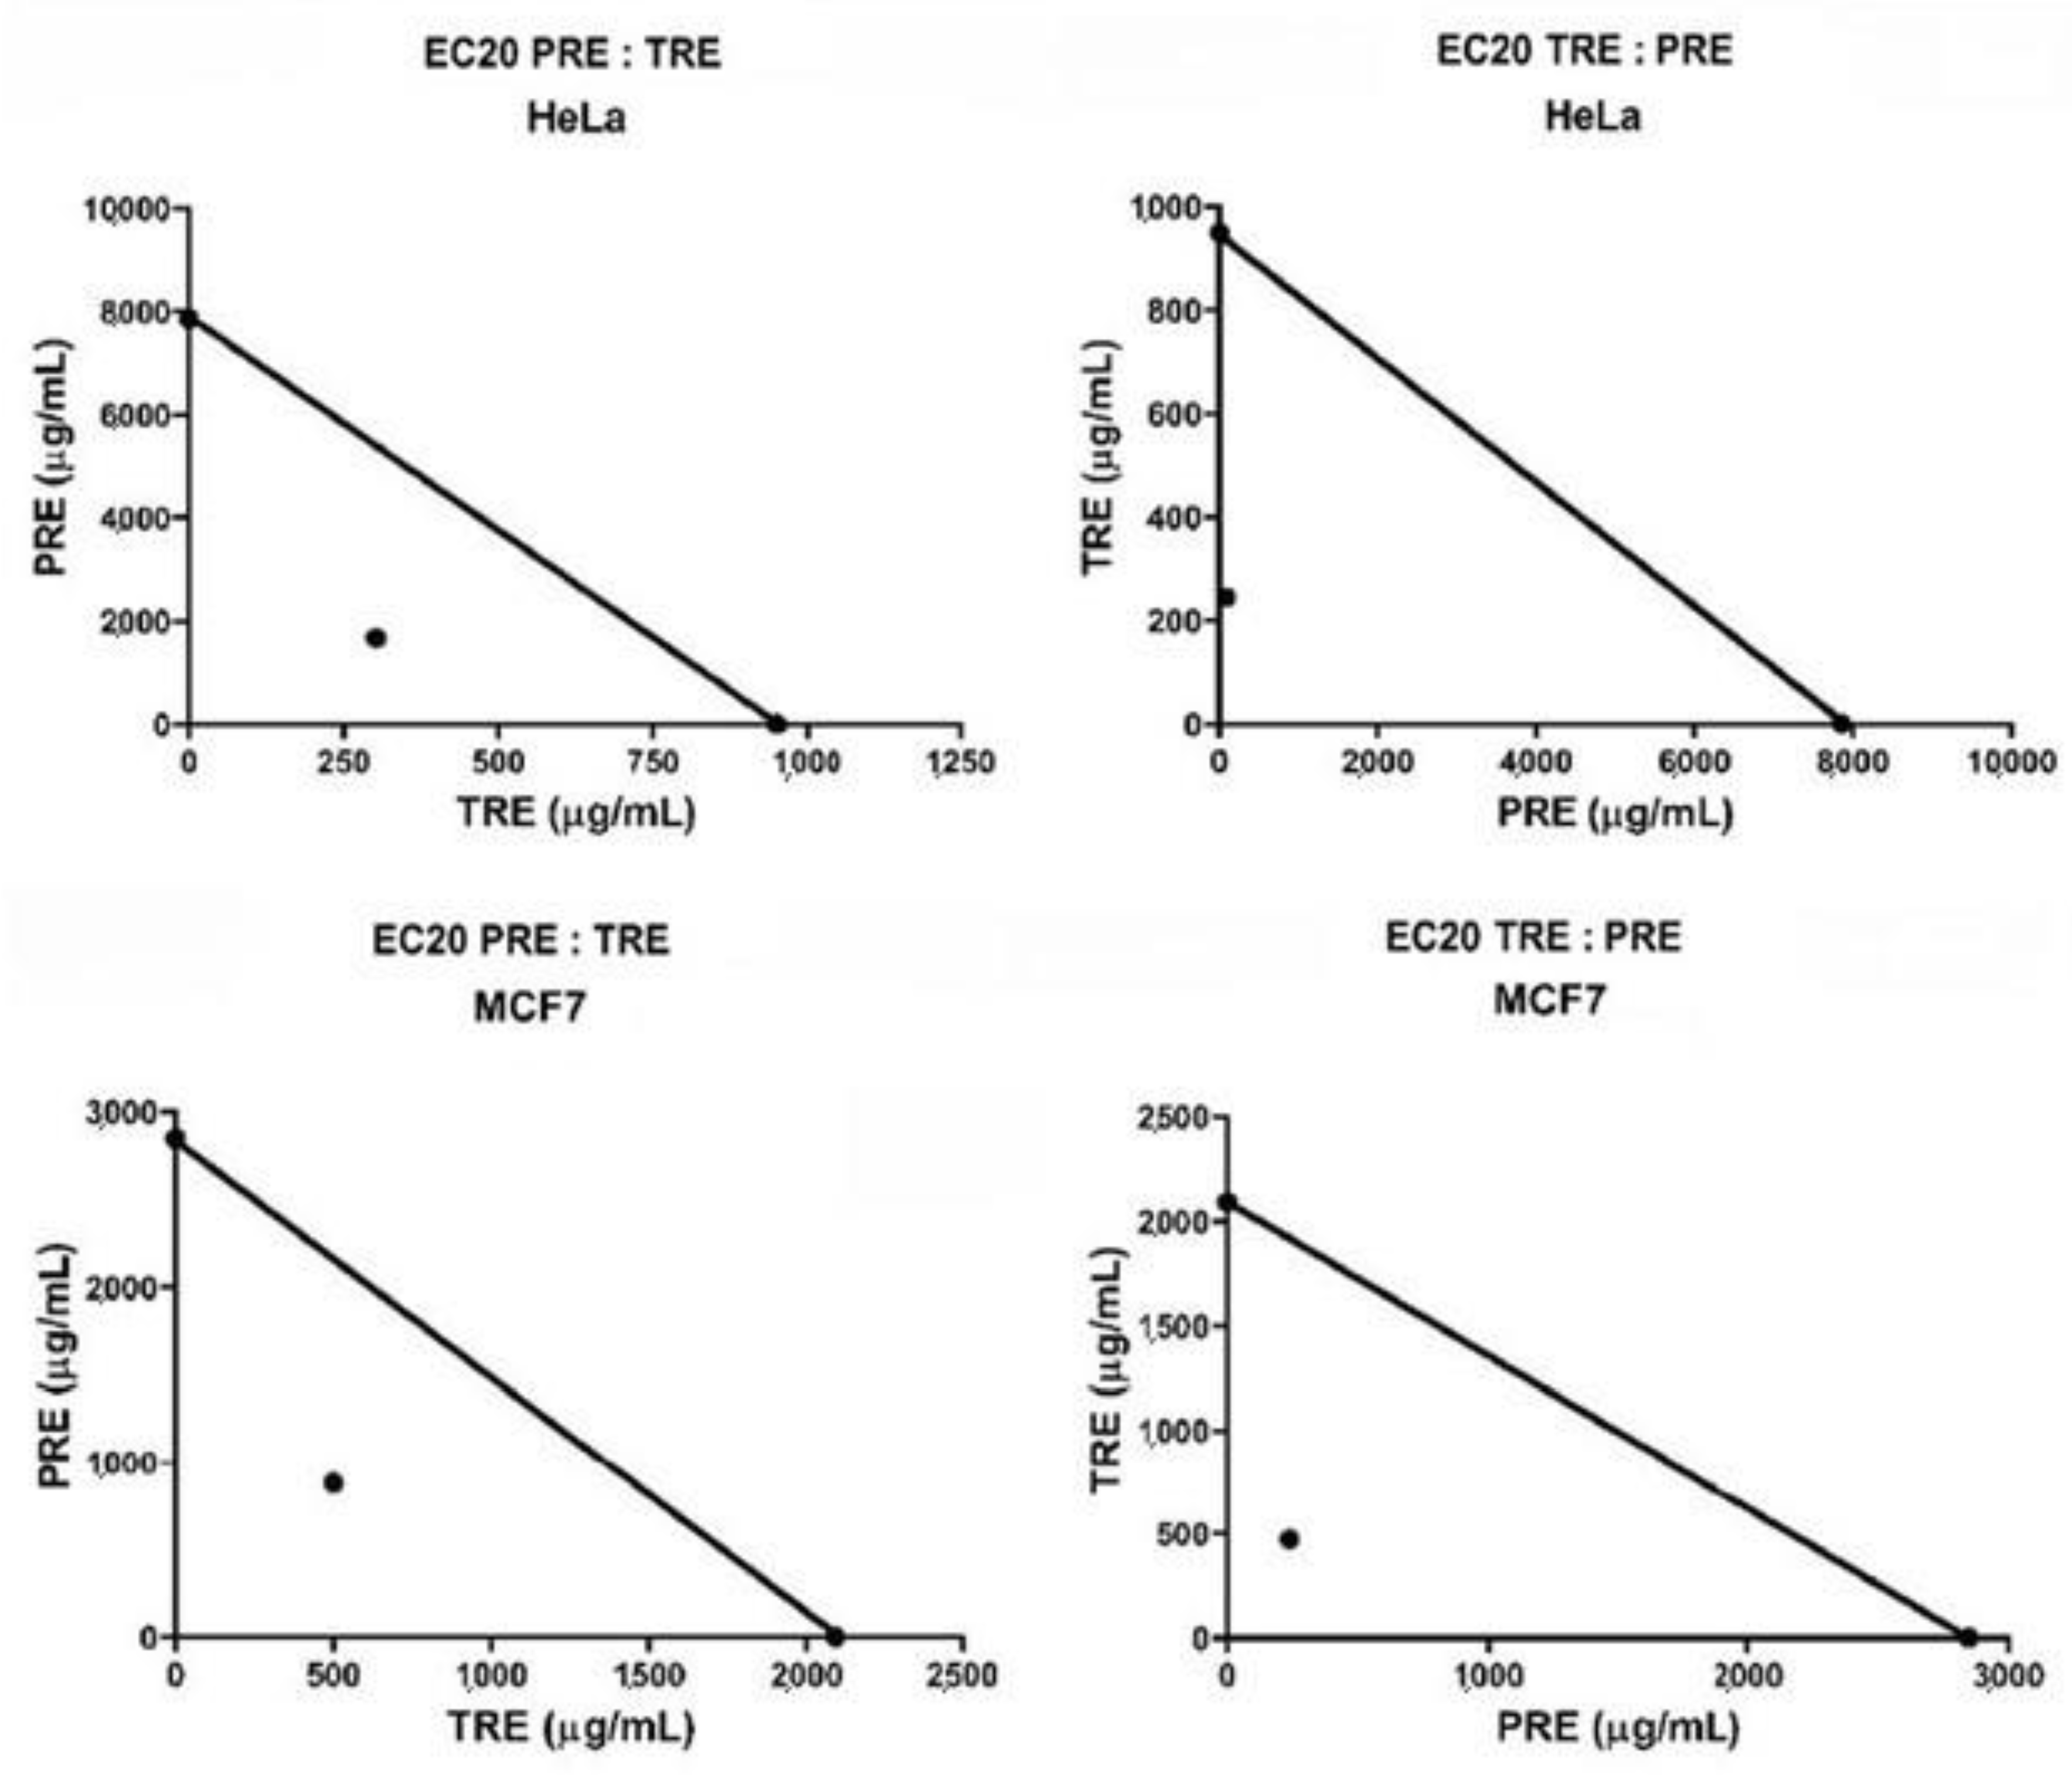
2.3. Analysis of TRE and PCE Combinations on HeLa and MCF7 Cell Viability
3. Materials and Methods
3.1. Samples and Reagents
3.2. Preparation and Characterization of Tocol- and Phenolic-Rich Extracts (TRE, PRE)
3.3. Cell Cultures
3.4. Antiproliferative Activity of Pure Compounds and Extracts
3.5. Experimental Design for Combinations and Analysis of the Pharmacological Interaction between TRE and PRE
3.6. Statistical Analysis
4. Conclusions
Supplementary Materials
Author Contributions
Funding
Institutional Review Board Statement
Informed Consent Statement
Data Availability Statement
Conflicts of Interest
Sample Availability
References
- World Health Organization. A Report about Cancer. Available online: https://www.who.int/es/news-room/fact-sheets/detail/cancer (accessed on 10 January 2022).
- Islam, S.M.R.; Siddiqua, T.J. Functional foods in cancer prevention and therapy: Recent epidemiological findings. In Functional Foods in Cancer Prevention and Therapy; Kabir, Y., Ed.; Academic Press: Cambridge, MA, USA, 2020; pp. 405–433. ISBN 9780128161517. [Google Scholar]
- Long, J.; Ji, Z.; Yuan, P.; Long, T.; Liu, K.; Li, J.; Cheng, L. Nut consumption and risk of cancer: A Meta-Analysis of prospective studies. Cancer Epidemiol. Biomark. Prev. 2020, 29, 565–573. [Google Scholar] [CrossRef] [PubMed]
- Wu, L.; Wang, Z.; Zhu, J.; Murad, A.L.; Prokop, L.J.; Murad, M.H. Nut consumption and risk of cancer and type 2 diabetes: A Systematic Review and Meta-Analysis. Nutr. Rev. 2015, 73, 409–425. [Google Scholar] [CrossRef] [PubMed] [Green Version]
- Falasca, M.; Casari, I.; Maffucci, T. Cancer chemoprevention with nuts. J. Natl. Cancer Inst. 2014, 106, 1–10. [Google Scholar] [CrossRef] [PubMed]
- Mené-Saffrané, L. Vitamin E biosynthesis and its regulation in plants. Antioxidants 2018, 7, 2. [Google Scholar] [CrossRef] [Green Version]
- Smolarek, A.K.; So, J.Y.; Burgess, B.; Kong, A.T.; Reuhl, K.; Lin, Y.; Shih, W.J.; Li, G.; Lee, M.; Chen, Y. Dietary administration of δ- and γ-tocopherol inhibits tumorigenesis in the animal model of estrogen receptor—positive, but not HER-2 breast cancer. J. Agric. Food Chem. 2012, 5, 1310–1321. [Google Scholar] [CrossRef] [Green Version]
- Bak, M.J.; das Gupta, S.; Wahler, J.; Lee, H.J.; Li, X.; Lee, M.J.; Yang, C.S.; Suh, N. Inhibitory effects of γ- and δ-Tocopherols on estrogen-stimulated breast cancer in vitro and in vivo. Cancer Prev. Res. 2017, 10, 188–197. [Google Scholar] [CrossRef] [Green Version]
- Peh, H.Y.; Tan, W.S.D.; Liao, W.; Wong, W.S.F. Vitamin E therapy beyond cancer: Tocopherol versus Tocotrienol. Pharmacol. Ther. 2016, 162, 152–169. [Google Scholar] [CrossRef]
- Kunnumakkara, A.B.; Sung, B.; Ravindran, J.; Diagaradjane, P.; Deorukhkar, A.; Dey, S.; Koca, C.; Yadav, V.R.; Tong, Z.; Gelovani, J.G.; et al. Γ-Tocotrienol inhibits pancreatic tumors and sensitizes them to gemcitabine treatment by modulating the inflammatory microenvironment. Cancer Res. 2010, 70, 8695–8705. [Google Scholar] [CrossRef] [Green Version]
- Sun, W.; Wang, Q.; Chen, B.; Liu, J.; Liu, H.; Xu, W. Γ-Tocotrienol induced apoptosis in human gastric cancer SGC-7901 cells is associated with a suppression in mitogen-activated protein kinase signalling. Br. J. Nutr. 2008, 99, 1247–1254. [Google Scholar] [CrossRef] [Green Version]
- Tiwari, R.V.; Parajuli, P.; Sylvester, P.W. Γ-Tocotrienol-induced autophagy in malignant mammary cancer cells. Exp. Biol. Med. 2014, 239, 33–44. [Google Scholar] [CrossRef]
- Bolling, B.W.; McKay, D.L.; Blumberg, J.B. The phytochemical composition and antioxidant actions of tree nuts. Asia Pac. J. Clin. Nutr. 2010, 19, 117–123. [Google Scholar] [PubMed]
- Park, W.H. Gallic acid induces HeLa cell death via increasing GSH depletion rather than ROS levels. Oncol. Rep. 2017, 37, 1277–1283. [Google Scholar] [CrossRef] [PubMed] [Green Version]
- Pandurangan, A.K.; Mohebali, N.; Norhaizan, M.E.; Looi, C.Y. Gallic acid attenuates dextran sulfate sodium-induced experimental colitis in BALB/c Mice. Drug Des. Dev. Ther. 2015, 9, 3923–3934. [Google Scholar] [CrossRef] [PubMed] [Green Version]
- Wang, K.; Zhu, X.; Zhang, K.; Zhu, L.; Fanfan, Z. Investigation of gallic acid induced anticancer effect in human breast carcinoma MCF-7 cells. J. Biochem. Mol. Toxicol. 2014, 28, 387–393. [Google Scholar] [CrossRef]
- Tallarida, R.J. Drug synergism: Its detection and applications. J. Pharmacol. Exp. Ther. 2001, 298, 865–872. [Google Scholar]
- Chou, T.C. Drug combination studies and their synergy quantification using the Chou-Talalay method. Cancer Res. 2010, 70, 440–446. [Google Scholar] [CrossRef] [Green Version]
- Lee, J.J.; Kong, M.; Ayers, G.D.; Lotan, R. Interaction index and different methods for determining drug interaction in combination therapy. J. Biopharm. Stat. 2007, 17, 461–480. [Google Scholar] [CrossRef]
- Galati, G.; Sabzevari, O.; Wilson, J.X.; O’Brien, P.J. Prooxidant activity and cellular effects of the phenoxyl radicals of dietary flavonoids and other polyphenolics. Toxicology 2002, 177, 91–104. [Google Scholar] [CrossRef]
- Bouayed, J.; Bohn, T. Exogenous Antioxidants—Double-edged swords in cellular redox state: Health beneficial effects at physiologic doses versus deleterious effects at high doses. Oxidative Med. Cell. Longev. 2010, 3, 228–237. [Google Scholar] [CrossRef]
- Heidarian, E.; Keloushadi, M.; Ghatreh-samani, K.; Valipour, P. Signaling pathways and invasion activity by gallic acid in prostate cancer PC3 cells. Biomed. Pharmacother. 2018, 84, 264–269. [Google Scholar] [CrossRef]
- Saffari-Chaleshtori, J.; Heidari-Sureshjanad, E.; Moradi, F.; Jazi, H.M.; Heidarian, E. The study of apoptosis-inducing effects of three pre-apoptotic factors by gallic acid, using simulation analysis and the comet assay technique on the prostatic cancer cell line PC3. Malays. J. Med. Sci. 2017, 24, 18–29. [Google Scholar] [CrossRef] [PubMed]
- You, B.R.; Park, W.H. Gallic Acid-Induced Human Pulmonary Fibroblast Cell Death is Accompanied by Increases in ROS Level and GSH Depletion. Drug Chem. Toxicol. 2011, 34, 38–44. [Google Scholar] [CrossRef] [PubMed]
- Yang, C.S.; Li, G.; Yang, Z.; Guan, F.; Chen, A.; Ju, J. Cancer Prevention by Tocopherols and Tea Polyphenols. Cancer Lett. 2013, 334, 79–85. [Google Scholar] [CrossRef] [PubMed] [Green Version]
- Figueroa, D.; Asaduzzaman, M.; Young, F. Effect of Chemotherapeutics and Tocopherols on MCF-7 Breast Adenocarcinoma and KGN Ovarian Carcinoma Cell Lines In Vitro. BioMed Res. Int. 2019. [Google Scholar] [CrossRef] [Green Version]
- Hong, J.L.; Ju, J.; Paul, S.; So, J.Y.; DeCastro, A.; Smolarek, A.; Lee, M.J.; Yang, C.S.; Newmark, H.L.; Suh, N. Mixed Tocopherols Prevent Mammary Tumorigenesis by Inhibiting Estrogen Action and Activating PPAR-γ. Clin. Cancer Res. 2009, 15, 4242–4249. [Google Scholar] [CrossRef] [Green Version]
- Jiang, Q.; Wong, J.; Fyrst, H.; Saba, J.D.; Ames, B.N. γ-Tocopherol or combinations of vitamin e forms induce cell in human cells by interrupting sphingolipid synthesis. Proc. Natl. Acad. Sci. USA 2004, 101, 17825–17830. [Google Scholar] [CrossRef] [PubMed] [Green Version]
- Das Gupta, S.; Sae-Tan, S.; Wahler, J.; So, J.Y.; Bak, M.J.; Cheng, L.C.; Lee, M.J.; Lin, Y.; Shih, W.J.; Shull, J.D.; et al. Dietary γ-tocopherol-rich mixture inhibits estrogen-induced mammary tumorigenesis by modulating estrogen metabolism, antioxidant response, and PPARγ. Cancer Prev. Res. 2015, 8, 807–816. [Google Scholar] [CrossRef] [Green Version]
- Ju, J.; Picinich, S.C.; Zhihong, Y.; Yang, Z.; Nanjoo, S.; Kong, A.-N.; Yang, C.S. cancer preventive activities of tocopherols and tocotrienols. Carcinogenesis 2010, 31, 533–542. [Google Scholar] [CrossRef] [Green Version]
- Comitato, R.; Leoni, G.; Canali, R.; Ambra, R.; Nesaretnam, K.; Virgili, F. Tocotrienols Activity in MCF-7 Breast Cancer Cells: Involvement of ERbeta signal transduction. Mol. Nutr. Food Res. 2010, 54, 669–678. [Google Scholar] [CrossRef]
- Thorn, C.F.; Oshiro, C.; Marsh, S.; Hernandez-Boussard, T.; McLeod, H.; Klein, T.E.; Altman, R.B. Doxorubicin pathways. Pharm. Genom. 2011, 21, 440–446. [Google Scholar] [CrossRef]
- Stevens-Barron, J.C.; de la Rosa, L.A.; Wall-Medrano, A.; Rodriguez-Ramirez, R.; Parrilla, E.A.; Robles-Zepeda, R.; Astiazarán-garcia, H. Chemical composition and in vitro bioaccessibility of antioxidant phytochemicals from selected edible nuts. Nutrients 2019, 11, 2303. [Google Scholar] [CrossRef] [PubMed] [Green Version]
- Robbins, K.S.; Shin, E.; Shewfelt, R.L.; Eitenmiller, R.R.; Pegg, R.B. Update on the healthful lipid constituents of commercially important tree nuts. J. Agric. Food Chem. 2011, 12083–12092. [Google Scholar] [CrossRef] [PubMed]
- Ozrenk, K.; Javidipour, I.; Yarilgac, T.; Balta, F.; Gündogdu, M. Fatty acids, tocopherols, selenium and total carotene of pistachios (P. Vera L.) from Diyarbakir (Southestern Turkey) and walnuts (J. Regia L.) from Erzincan (Eastern Turkey). Food Sci. Technol. Int. 2012, 18, 55–62. [Google Scholar] [CrossRef] [PubMed]
- Prayong, P.; Barusrux, S.; Weerapreeyakul, N. Cytotoxic Activity Screening of Some Indigenous Thai Plants. Fitoterapia 2008, 79, 598–601. [Google Scholar] [CrossRef]
- García-Martínez, O.; de Luna-Bertos, E.; Ramos-Torrecillas, J.; Ruiz, C.; Milia, E.; Lorenzo, M.L.; Jimenez, B.; Sánchez-Ortiz, A.; Rivas, A. Phenolic compounds in extra virgin olive oil stimulate human osteoblastic cell proliferation. PLoS ONE 2016, 11, 1–15. [Google Scholar] [CrossRef] [PubMed] [Green Version]
- Yang, J.; Liu, R.H.; Halim, L. Antioxidant and antiproliferative activities of common edible nut seeds. LWT Food Sci. Technol. 2009, 42, 1–8. [Google Scholar] [CrossRef]
- Eitsuka, T.; Tatewaki, N.; Nishida, H.; Kurata, T.; Nakagawa, K.; Miyazawa, T. synergistic inhibition of cancer cell proliferation with a combination of δ-Tocotrienol and ferulic acid. Biochem. Biophys. Res. Commun. 2014, 453, 606–611. [Google Scholar] [CrossRef] [PubMed]
- Akl, M.R.; Ayoub, N.M.; Abuasal, B.S.; Kaddoumi, A.; Sylvester, P.W. Sesamin synergistically potentiates the anticancer effects of γ-tocotrienol in mammary cancer cell lines. Fitoterapia 2013, 84, 347–359. [Google Scholar] [CrossRef] [PubMed]
- Li, G.; Lee, M.; Liu, A.B.; Yang, Z.; Lin, Y.; Shih, W.J. Δ-tocopherol is more active than α- or γ-tocopherol in inhibiting lung tumorigenesis in vivo. Cancer Prev. Res 2011, 4, 404–414. [Google Scholar] [CrossRef] [PubMed] [Green Version]
- Abaza, M.S.; Al-Attiyah, R.; Bhardwaj, R.; Abbadi, G.; Koyippally, M.; Afzal, M. Syringic acid from tamarix aucheriana possesses antimitogenic and chemo-sensitizing activities in human colorectal cancer cells. Pharm. Biol. 2013, 51, 1110–1124. [Google Scholar] [CrossRef] [Green Version]
- Miraliakbari, H.; Shahidi, F. Antioxidant activity of minor components of tree nut oils. Food Chem. 2008, 111, 421–427. [Google Scholar] [CrossRef] [PubMed]
- De la Rosa, L.A.; Alvarez-Parrilla, E.; Shahidi, F. Phenolic compounds and antioxidant activity of kernels and shells of Mexican Pecan (Carya Illinoinensis). J. Agric. Food Chem. 2011, 59, 152–162. [Google Scholar] [CrossRef] [PubMed]
- Meneses-Sagrero, S.E.; Navarro-Navarro, M.; Ruiz-Bustos, E.; Del-Toro-Sánchez, C.L.; Jiménez-Estrada, M.; Robles-Zepeda, R.E. Antiproliferative activity of spinasterol isolated of stegnosperma halimifolium (benth, 1844). Saudi Pharm. J. 2017, 25, 1137–1143. [Google Scholar] [CrossRef] [PubMed]
 ), Emory oak acorn (EOA
  ), Pecans (PEC
  ), Pine nut pink (PPN
  ), Pine nut white (PNW
  ), Pistachio (PIS
  ), Walnut (WN
  ).
), Emory oak acorn (EOA ), Pecans (PEC ), Pine nut pink (PPN ), Pine nut white (PNW ), Pistachio (PIS ), Walnut (WN ).
).
), Emory oak acorn (EOA ), Pecans (PEC ), Pine nut pink (PPN ), Pine nut white (PNW ), Pistachio (PIS ), Walnut (WN ).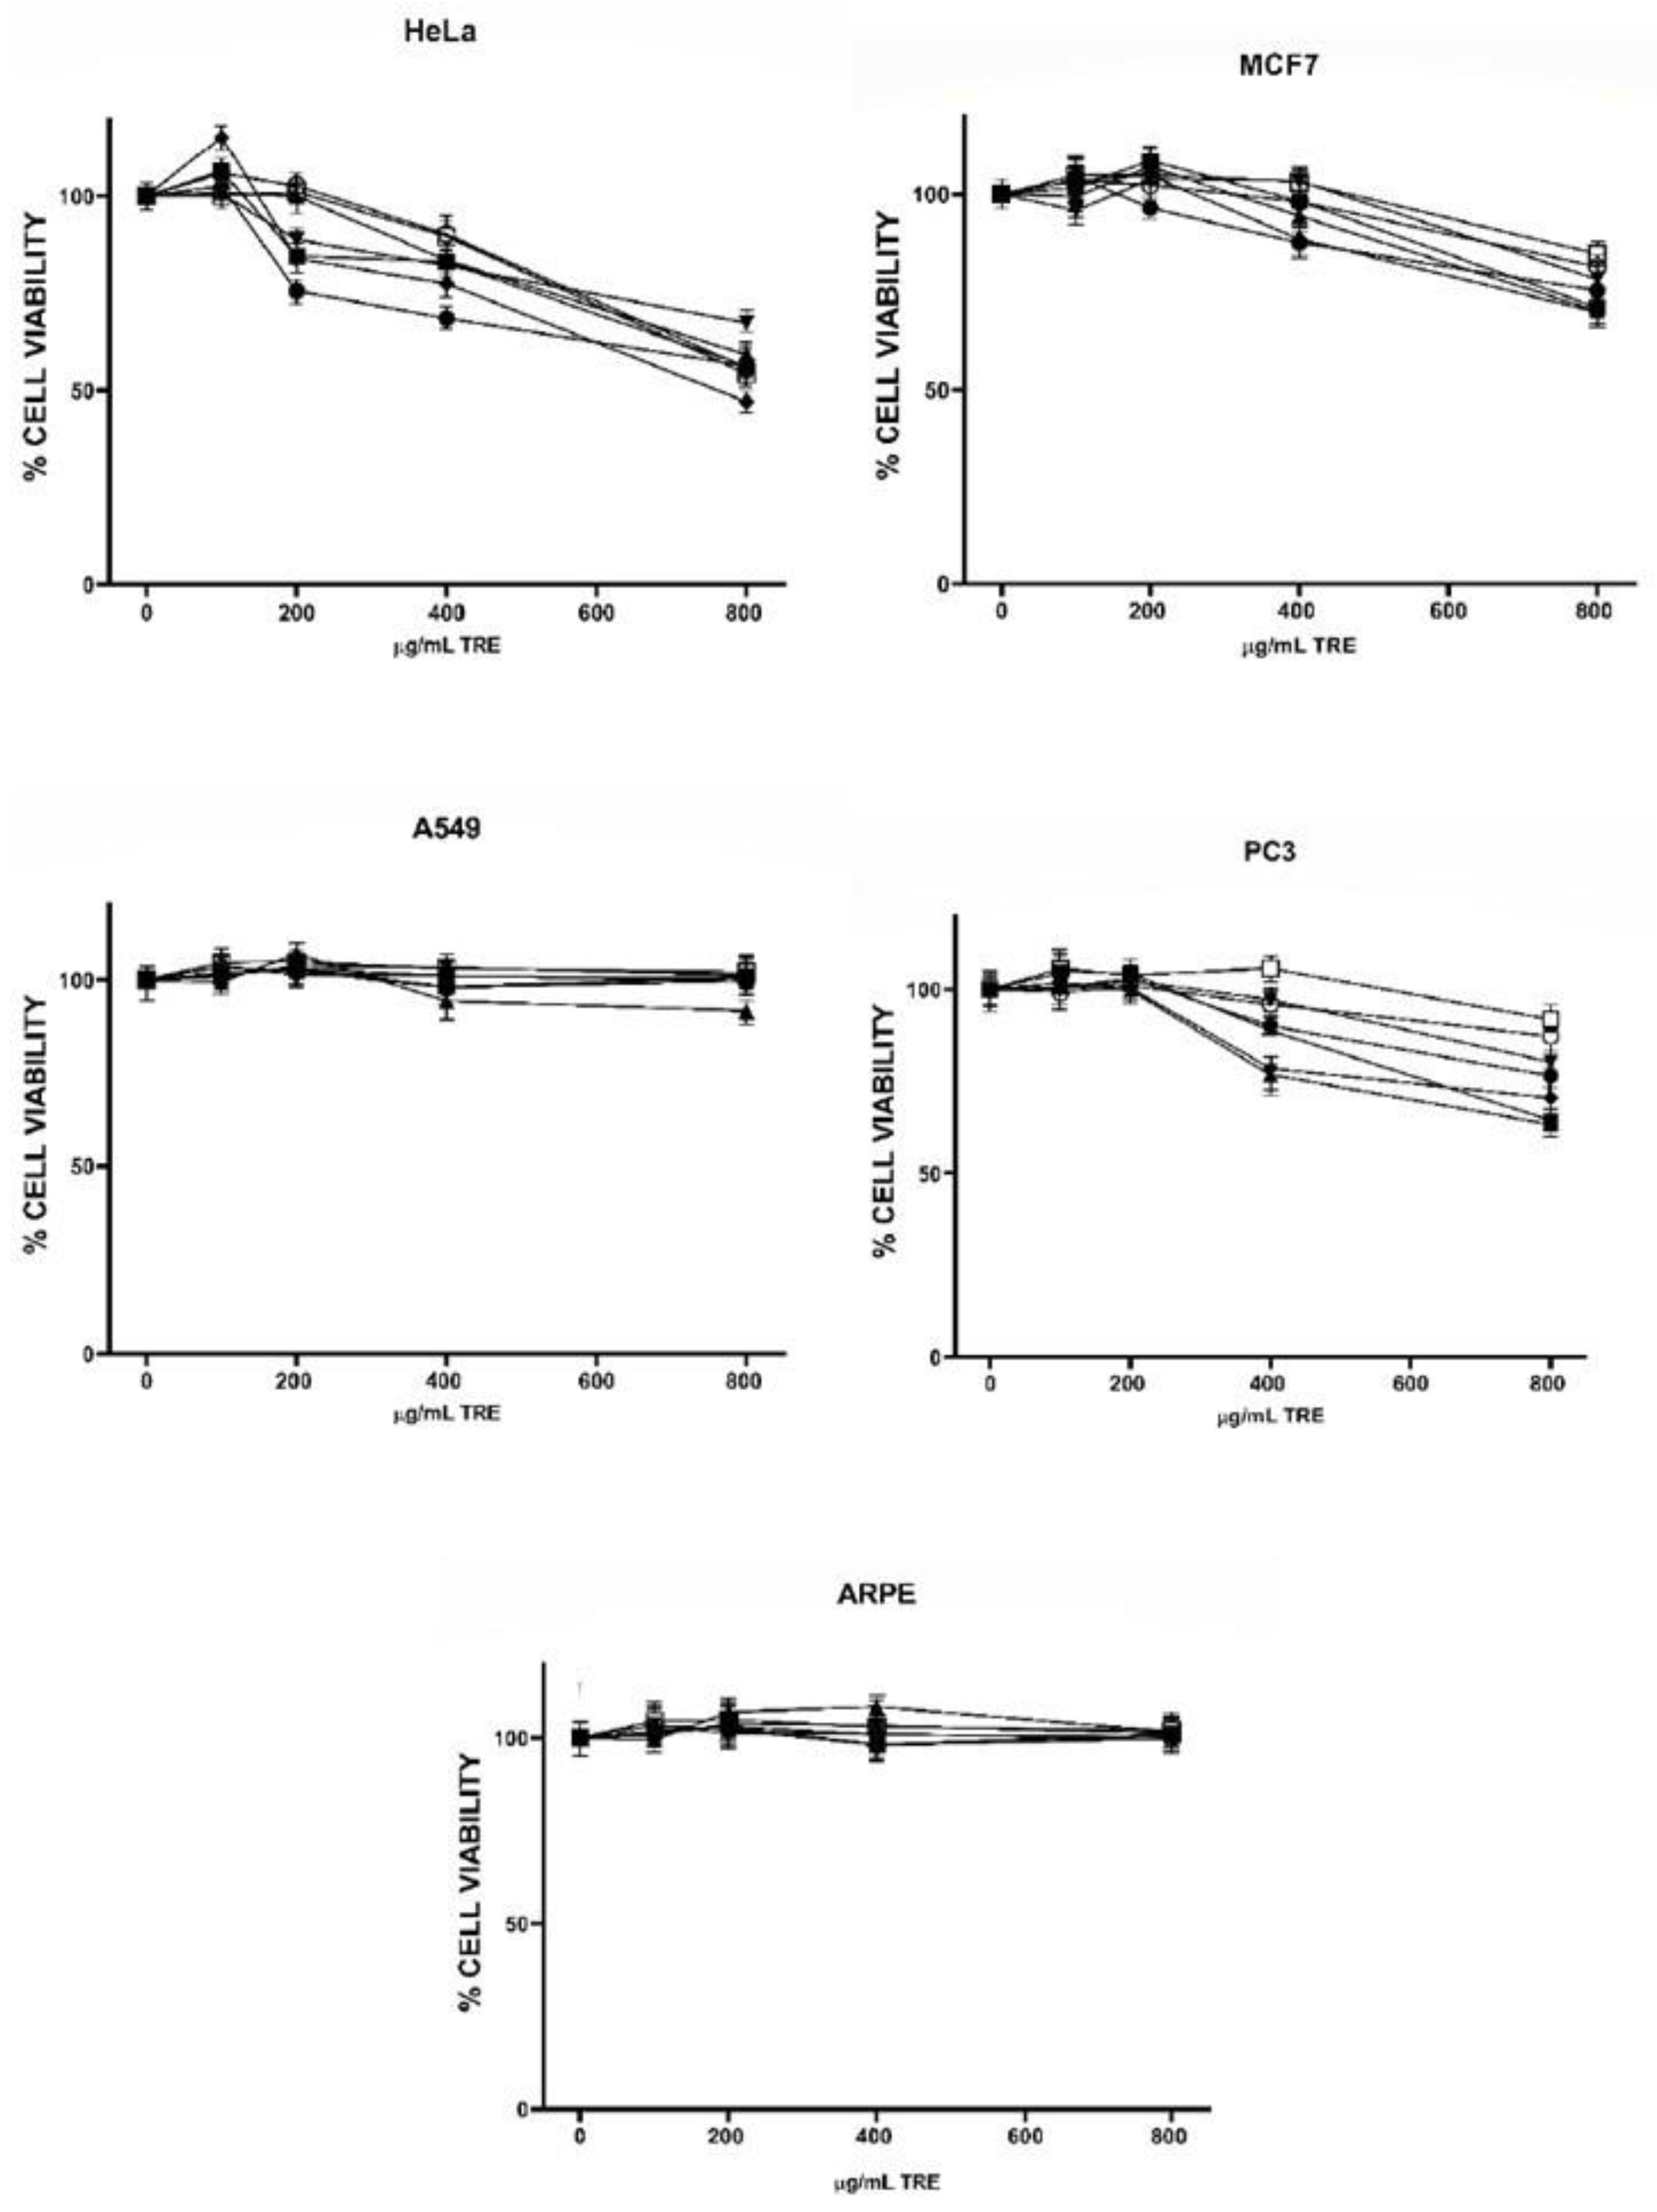 ), Emory oak acorn (EOA ), Pecans (PEC ), Pine nut pink (PPN ), Pine nut white (PNW ), Pistachio (PIS ), Walnut (WN ).
), Emory oak acorn (EOA ), Pecans (PEC ), Pine nut pink (PPN ), Pine nut white (PNW ), Pistachio (PIS ), Walnut (WN ).
), Emory oak acorn (EOA ), Pecans (PEC ), Pine nut pink (PPN ), Pine nut white (PNW ), Pistachio (PIS ), Walnut (WN ).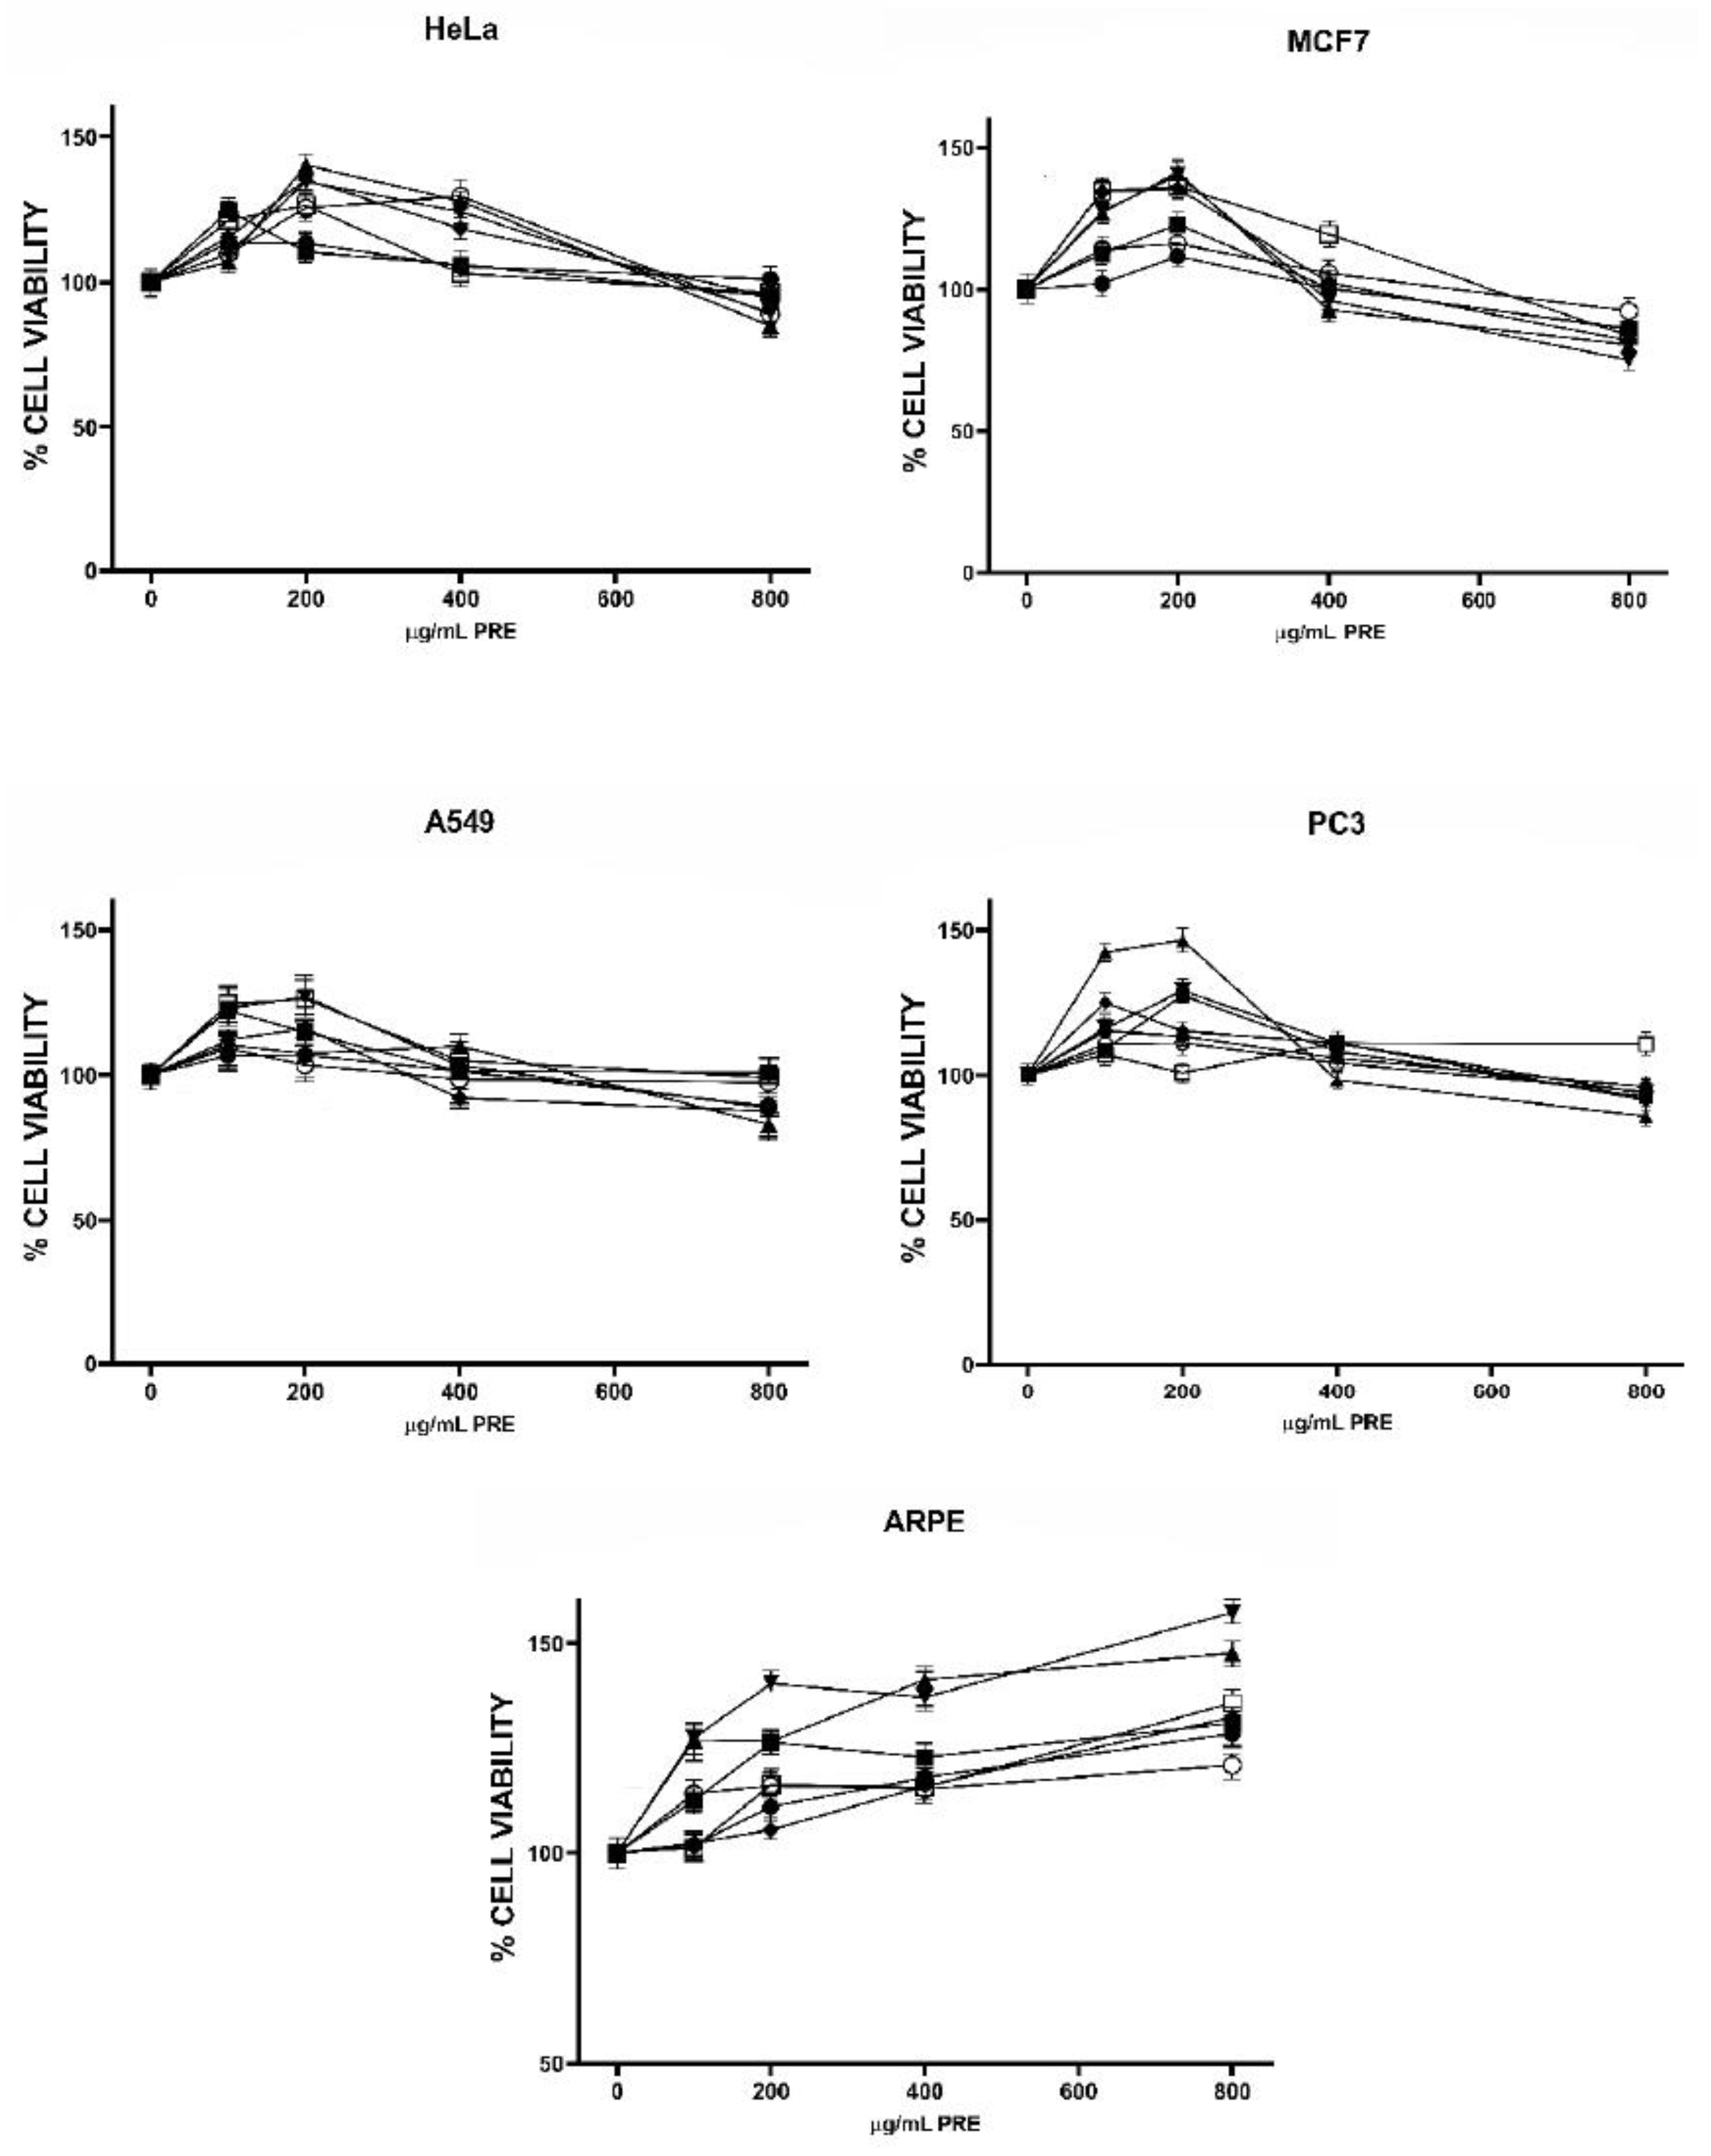

| HeLa | MCF7 | A549 | PC3 | |
|---|---|---|---|---|
| EC50 µM | EC50 µM | EC50 µM | EC50 µM | |
| αT | 764.9 ± 19.2 c i | 631.5 ± 12.3 e i | 969.8 ± 78.8 c i | 866.3 ± 106.2 c i |
| γT | 659.2 ± 16.9 c ii | 438.3 ± 8.0 d i | 463.6 ± 14.7 b i | 437.1 ± 0.3 b i |
| δT | 386.7 ± 6.0 b ii | 319.9 ± 9.8 c i,ii | 491.9 ± 21.0 b iii | 436.9 ± 11.6 b ii,iii |
| Gallic acid | 281.4 ± 44.0 b i | 151.3 ± 23.4 b i | 421.9 ± 42.7 ab i | 98.6 ± 32.6 ab i |
| Doxorubicin | 2.36 ± 0.08 a i | 2.30 ± 0.03 a i | 4.7 ± 0.05 a ii | 7.00 ± 0.5 a iii |
| Nuts | αT | γT | δT | αT3 | γT3 | TT |
|---|---|---|---|---|---|---|
| Almond | 43.4 ± 0.5 a | 318.3 ± 11.4 c | 97.38 ± 0.0 b | ND | ND | 459.1 ± 4.5 b |
| Emory oak acorn | 1.52 ± 0.1 c | 7170.5 ± 1227.1 a | 1695 ± 0.3 a | UQL | 219.7 ± 26.7 c | 9086.8 ± 250.0 a |
| Pecan | 0.05 ± 0.0 c | 564.0 ± 20.5 bc | 204.2 ± 0.2 b | 0.3 ± 0.0 b | UQL | 768.3 ± 93.0 b |
| Pine nut, pink | 7.79 ± 2.3 b | 3235.5 ± 807.1 abc | 818.2 ± 0.2 ab | 1740.5 ± 445.1 a | 793.4 ± 193.0 b | 6595 ± 164.0 ab |
| Pine nut, white | 0.18 ± 0.0 c | 4538.0 ± 38.9 abc | UQL | 136.3 ± 4.7 b | 1303.9 ± 1.2 a | 5978 ± 12.3 ab |
| Pistachio | 0.02 ± 0.0 c | 429.5 ± 2.4 c | 97.1 ± 0.0 b | 44.2 ± 3.4 b | 93.5 ± 0.0 c | 664.3 ± 4.6 b |
| Walnut | ND | 5225.1 ± 542.1 ab | 827.1 ± 0.3 ab | ND | ND | 6052.4 ± 207.1 ab |
| Nuts | µg GAE/g PCE |
|---|---|
| Almond | 512.5 ± 31.0 b |
| Emory oak acorn | 475.1 ± 16.3 b |
| Pecan | 823.4 ± 31.1 a |
| Pine nut, pink | 369.7 ± 0.8 b |
| Pine nut, white | 383.6 ± 11.3 b |
| Pistachio | 141.6 ± 2.91 c |
| Walnut | 717.9 ± 72.2 ab |
| Compound in Extract | Correlation Coefficient ® with % Cell Viability of Cell Lines | ||||
|---|---|---|---|---|---|
| HeLa | MCF7 | A549 | PC3 | ARPE | |
| αT | 0.1995 | 0.5733 | 0.4529 | 0.5563 | 0.5060 |
| γT | −0.7481 | −0.9071 * | −0.6761 | −0.7696 * | −0.5662 |
| δT | −0.8644 * | −0.8515 * | −0.2293 | −0.6346 | −0.6466 |
| Total T | −0.7975 * | −0.9277 * | −0.6135 | −0.7699 * | −0.6004 |
| αT3 | 0.2925 | −0.2807 | −0.2215 | −0.4657 | −0.0666 |
| γT3 | 0.2229 | −0.2377 | −0.8048 * | −0.3382 | −0.2324 |
| Total T3 | 0.3063 | −0.3061 | −0.5591 | −0.4790 | −0.1631 |
| Total T + T3 | −0.6426 | −0.9336 * | −0.7176 | −0.8380 * | −0.5944 |
| Total phenols | −0.5172 | −0.9715 * | −0.6034 | −0.1582 | 0.9778 |
| Nuts | CI for Combination TRE + PREEC20 | CI for Combination PRE + TREEC20 | ||
|---|---|---|---|---|
| HeLa | MCF7 | HeLa | MCF7 | |
| EOA | 0.53 (synergy) | 0.55 (synergy) | 0.12 (strong synergy) | 0.30 (synergy) |
| PEC | 0.44 (synergy) | 0.37 (synergy) | 0.18 (strong synergy) | 0.28 (strong synergy) |
| WAL | 0.52 (synergy) | 0.43 (synergy) | 0.27 (strong synergy) | 0.22 (strong synergy) |
Publisher’s Note: MDPI stays neutral with regard to jurisdictional claims in published maps and institutional affiliations. |
© 2022 by the authors. Licensee MDPI, Basel, Switzerland. This article is an open access article distributed under the terms and conditions of the Creative Commons Attribution (CC BY) license (https://creativecommons.org/licenses/by/4.0/).
Share and Cite
Stevens-Barrón, J.C.; Wall-Medrano, A.; Álvarez-Parrilla, E.; Olivas-Armendáriz, I.; Astiazaran-García, H.; Robles-Zepeda, R.E.; De la Rosa, L.A. Synergistic Interactions between Tocol and Phenolic Extracts from Different Tree Nut Species against Human Cancer Cell Lines. Molecules 2022, 27, 3154. https://doi.org/10.3390/molecules27103154
Stevens-Barrón JC, Wall-Medrano A, Álvarez-Parrilla E, Olivas-Armendáriz I, Astiazaran-García H, Robles-Zepeda RE, De la Rosa LA. Synergistic Interactions between Tocol and Phenolic Extracts from Different Tree Nut Species against Human Cancer Cell Lines. Molecules. 2022; 27(10):3154. https://doi.org/10.3390/molecules27103154
Chicago/Turabian StyleStevens-Barrón, Jazmín C., Abraham Wall-Medrano, Emilio Álvarez-Parrilla, Imelda Olivas-Armendáriz, Humberto Astiazaran-García, Ramón E. Robles-Zepeda, and Laura A. De la Rosa. 2022. "Synergistic Interactions between Tocol and Phenolic Extracts from Different Tree Nut Species against Human Cancer Cell Lines" Molecules 27, no. 10: 3154. https://doi.org/10.3390/molecules27103154