Article

Quercetin Reduces Inflammation and Protects Gut Microbiota in Broilers

College of Animal Science and Technology, Jilin Agricultural University, Changchun 130118, China
*
Authors to whom correspondence should be addressed.
Molecules 2022, 27(10), 3269; https://doi.org/10.3390/molecules27103269
Submission received: 21 April 2022 / Revised: 18 May 2022 / Accepted: 18 May 2022 / Published: 19 May 2022
(This article belongs to the Section Bioorganic Chemistry)

Abstract

:
The aim of this study was to investigate the effects of quercetin on inflammatory response and intestinal microflora in broiler chicken jejuna. A total of 120 broiler chickens were allocated into 3 groups: saline-challenged broilers fed a basal diet (CTR group), lipopolysaccharide (LPS)-challenged broilers fed a basal diet (L group) and LPS-challenged broilers fed a basal diet supplemented with 200 mg/kg quercetin (LQ group). Our results showed that LPS significantly increased expression of tumor necrosis factor (TNF)-α, interleukin (IL)-1β, IL-6, IL-8, interferon (IFN)-γ, toll-like receptor (TLR)-4, Bax, Caspase-3 and diamine oxidase activity (DAO), and decreased expression of zona occludens-1 (ZO-1), Occludin and Bcl-2 in the jejunum, while dietary quercetin prevented the adverse effects of LPS injection. LPS injection significantly decreased the number of Actinobacteria, Armatimonadetes and Fibrobacteriae at the phylum level when compared to the CTR group. Additionally, at genus level, compared with the CTR group, the abundance of Halomonas, Micromonospora, Nitriliruptor, Peptococcus, Rubellimicrobium, Rubrobacter and Slaclda in L group was significantly decreased, while dietary quercetin restored the numbers of these bacteria. In conclusion, our results demonstrated that dietary quercetin could alleviate inflammatory responses of broiler chickens accompanied by modulating jejunum microflora.

1. Introduction

Chicken enteritis is a comprehensive intestinal disease caused by bacteria, viruses, parasites and a variety of management factors. In production, the incidence rate of enteritis is high; although the mortality rate is low, the direct economic loss is huge [1,2,3]. In recent decades, antibiotics have been widely used to prevent or control bacterial infections in animals. However, overuse of antibiotics leads to multiple drug resistance (MDR) and has affected the health of animals [4]. Thus, dietary supplementation of plant-derived compounds with anti-inflammatory and antioxidant effects has been studied as a substitute for antibiotics. Some flavonoids, such as naringin and luteolin, have been found to relieve intestinal inflammation [5,6].
Quercetin is a natural flavonoid. Its chemical name is 3,3′,4′,5,7-pentahydroxy-flavone, and it has antioxidant, antitumor, anti-inflammatory, free radical scavenging and other biological actions. Meanwhile, This study proposed that quercetin could play a beneficial role in intestinal barrier function [7]. Quercetin inhibited the expression of TNF-α, IL-1β, IL-6 and GM-CSF in macrophages induced by lipopolysaccharides (LPS) [8]. The effects of flavonoids on body health depends largely on the transformation of intestinal microflora [9]. Studies have found that quercetin could reverse diet-induced changes in the composition of intestinal microorganisms related to obesity and could effectively reduce the induction effects of a high-fat sucrose diet [10]. It also had an anti-inflammatory effect, suppressing the expression of cell adhesion molecules in LPS-induced rat intestinal microvascular endothelial cells [11]. The study found that dysbiosis was a causal or contributing factor in the pathogenesis of inflammatory bowel disease [12]. The use of high-throughput sequencing of 16s rRNA genes revealed that intestinal inflammation was generally accompanied by changes in the composition of the intestinal microbiome (dysbiosis). Meanwhile, intestinal microflora dysbiosis also led to gastrointestinal and inflammatory disorders [13,14]. Maternal fermented diet could ameliorate neonatal colonic inflammation by inducing an abundance of gut Lactobacillus reuteri [15]. Licochalcone A alleviated ulcerative colitis by maintaining tight junction protein expression (maintaining integrity of the intestinal barrier), inhibiting inflammation levels and regulating intestinal barrier-associated bacteria [16]. In our present study, we studied the influence of quercetin on intestinal inflammation and then analyzed the effects of quercetin on intestinal microflora of broiler chicken jejuna challenged with LPS.

2. Results

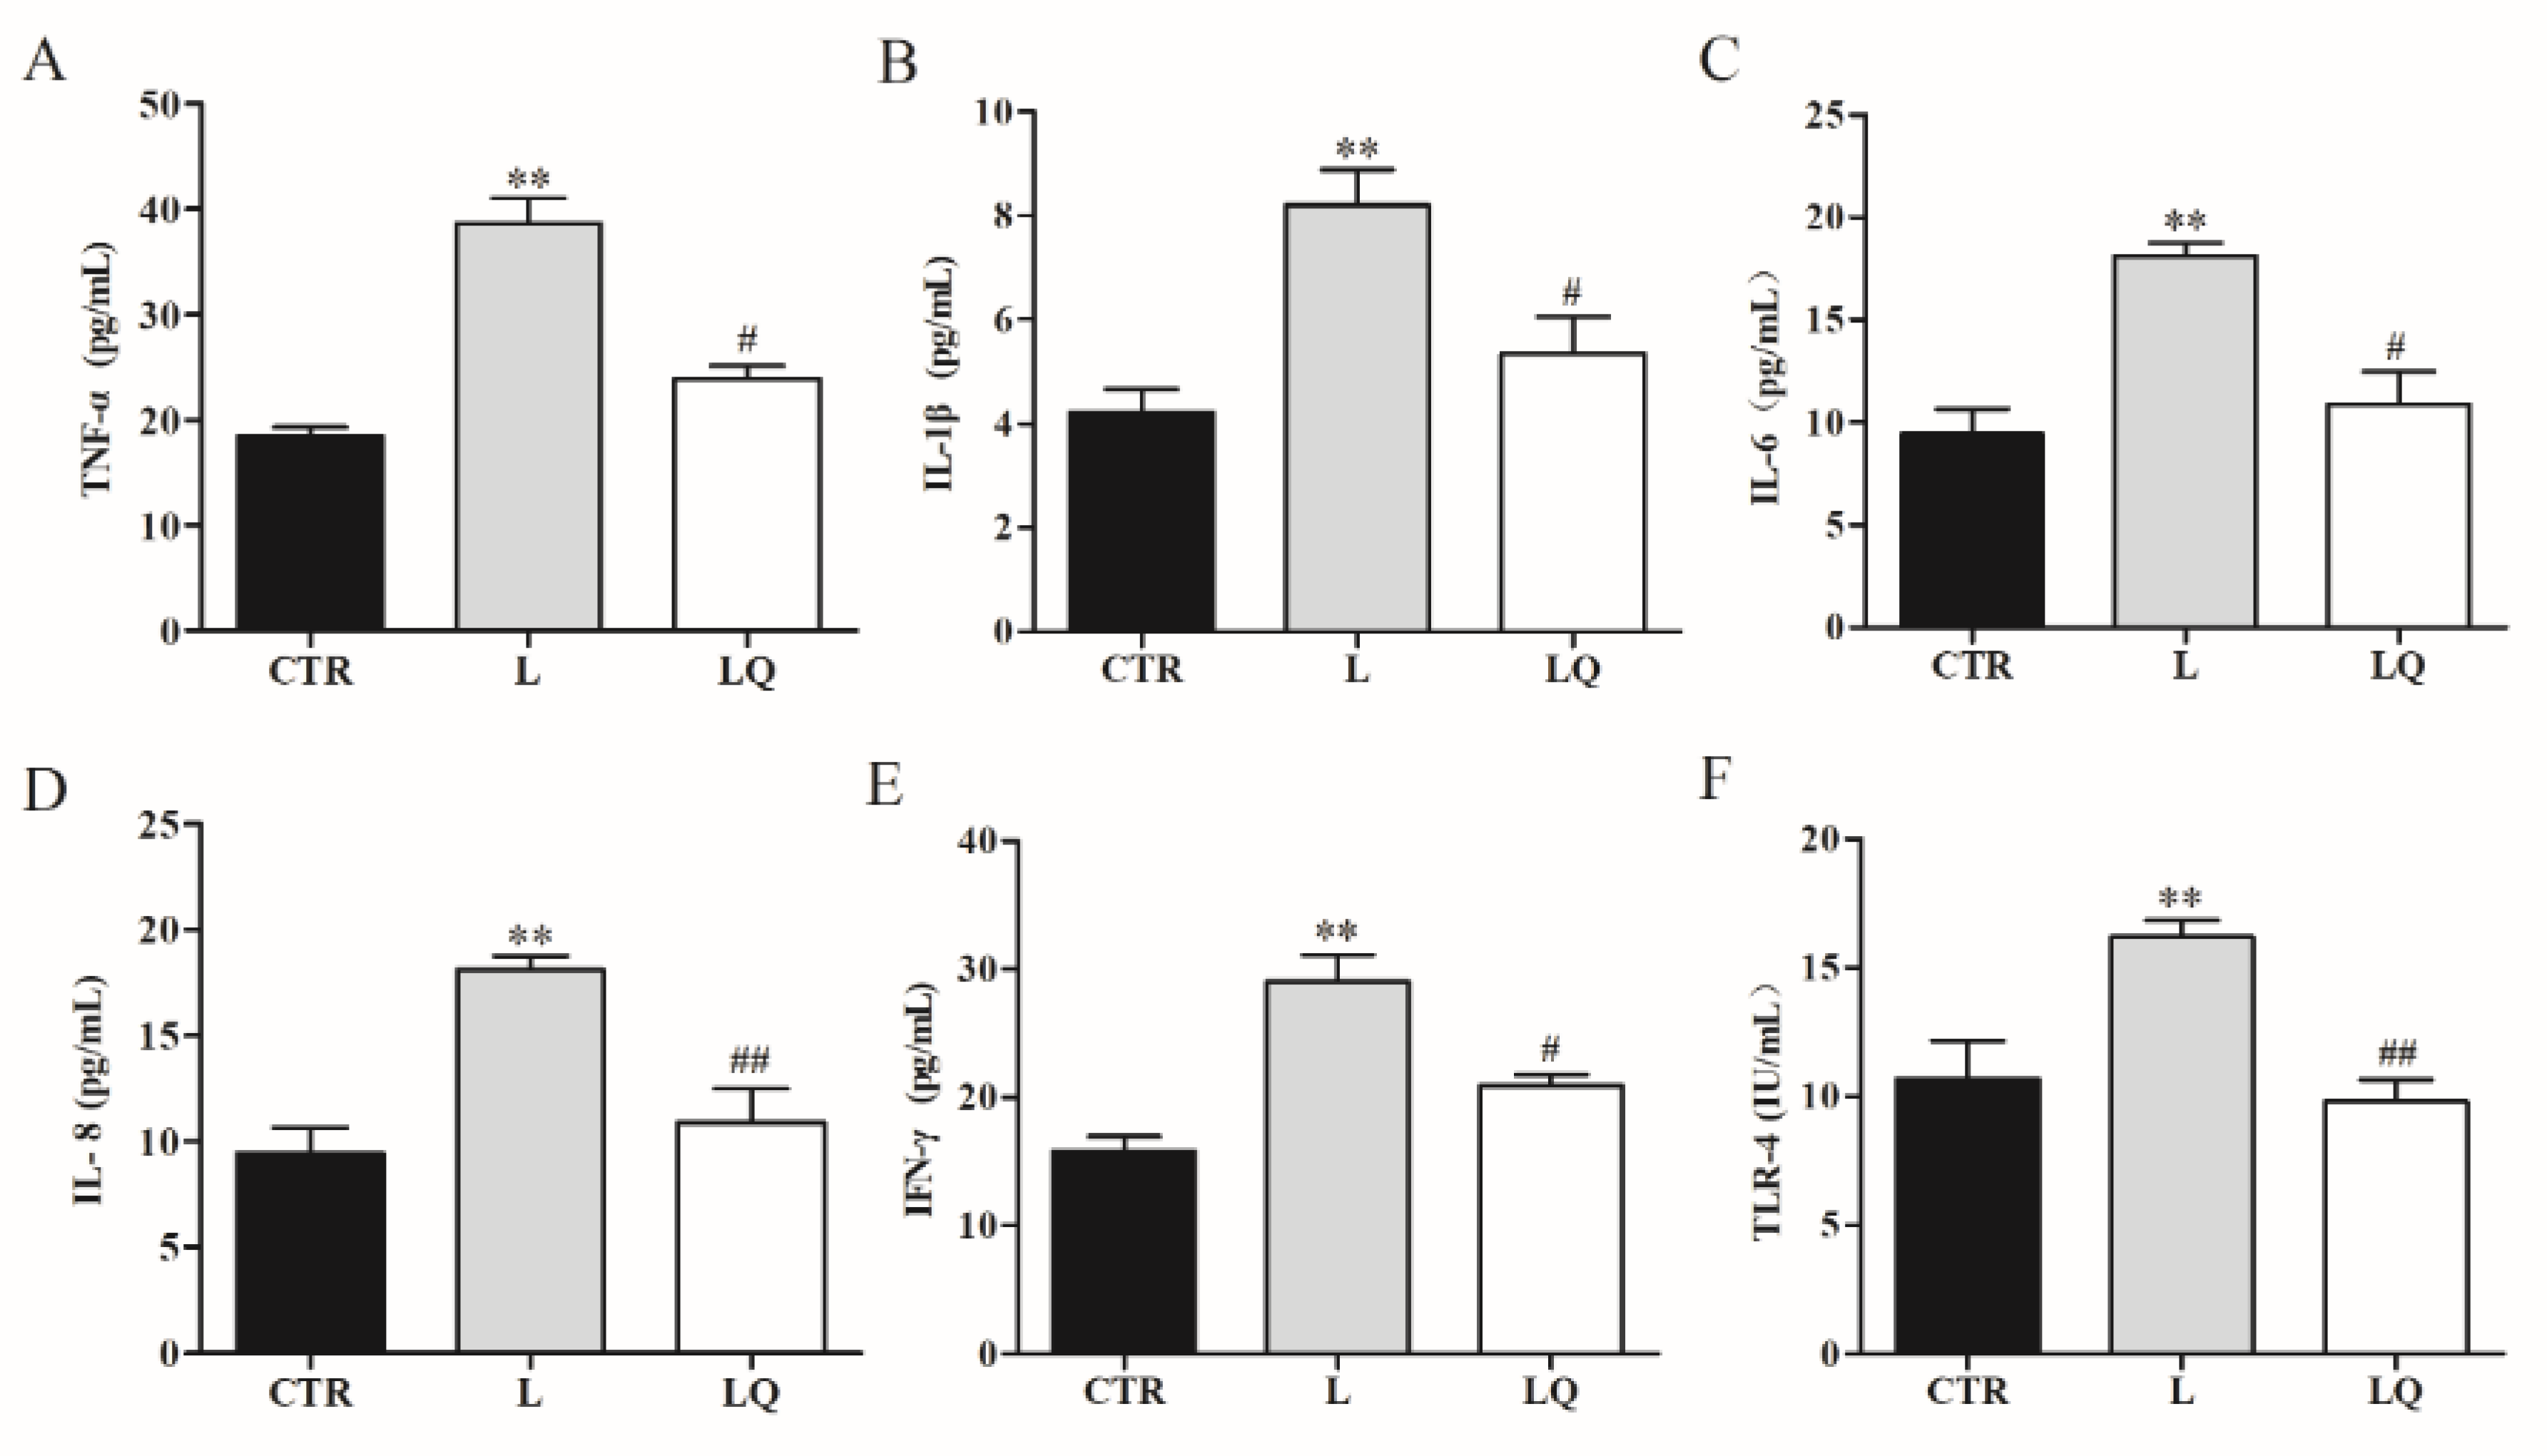
2.1. Effect of Dietary Quercetin on the Intestinal Inflammation in Broiler Chickens Challenged with LPS

To investigate the regulatory effects of quercetin on the intestinal inflammation of broiler chickens, mRNA expressions and protein content of toll-like receptor (TLR)-4 and inflammatory cytokines tumor necrosis factor (TNF)-α, interleukin (IL)-1β, IL-6, IL-8 and interferon (IFN)-γ were detected using RT-PCR and ELISA. As shown in Figure 1 and Figure 2, LPS challenge significantly increased mRNA expression and protein content of TNF-α, IL-1β, IL-6, IL-8, IFN-γ and TLR-4 in the jejuna (p < 0.01), while dietary quercetin decreased the expression of these genes induced by LPS.

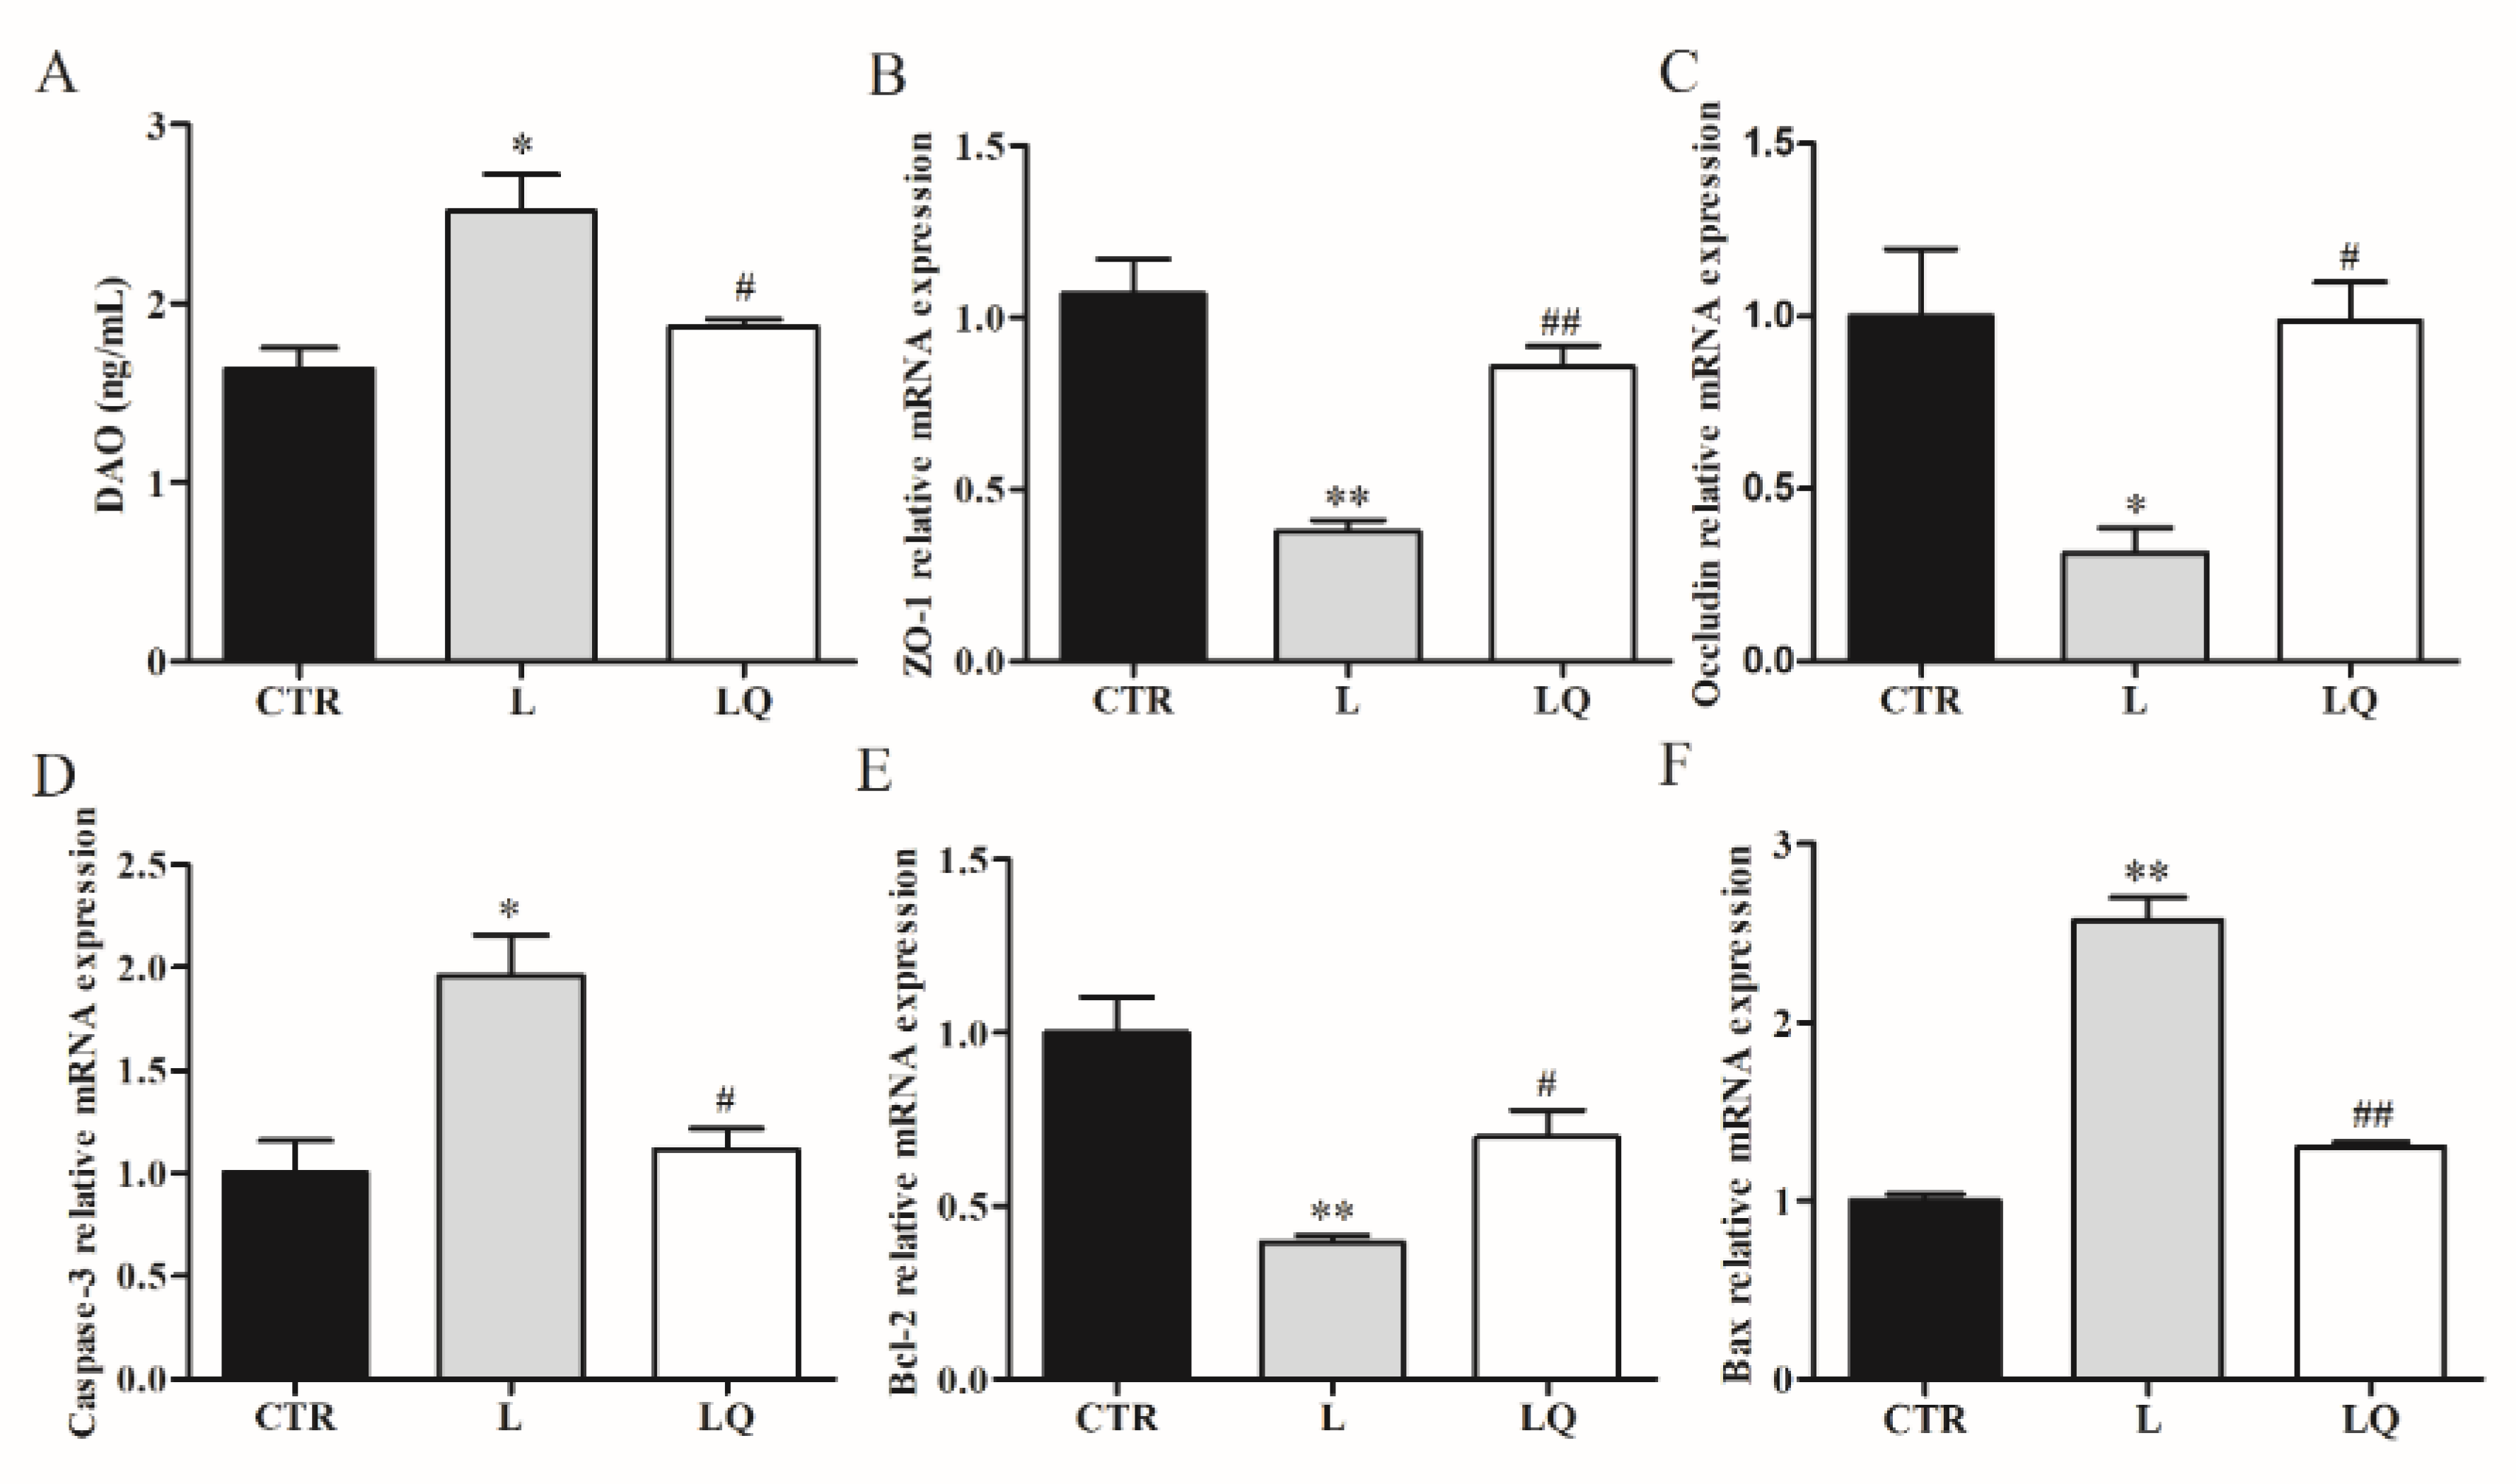
2.2. Effect of Dietary Quercetin on the Intestinal Barrier of Broiler Chickens Challenged with LPS

We further investigated the effects of quercetin on the intestinal barrier and examined the expression of apoptosis-related genes, tight junction protein genes and DAO in broiler chickens. As shown in Figure 3, LPS challenge significantly increased the mRNA expression of pro-apoptosis genes Caspase-3 and Bax (p < 0.01), while it decreased the mRNA expression of anti-apoptosis gene Bcl-2 (p < 0.01), tight junction protein genes zona occludens-1 (ZO-1) and Occludin (p < 0.05) when compared to the CTR group. The altered mRNA expressions of these apoptosis-related genes and tight junction protein genes were reversed with dietary quercetin. We detected the diamine oxidase activity (DAO) level in plasma and found that dietary quercetin significantly relieved the increased DAO (p < 0.05) level in plasma induced by LPS.

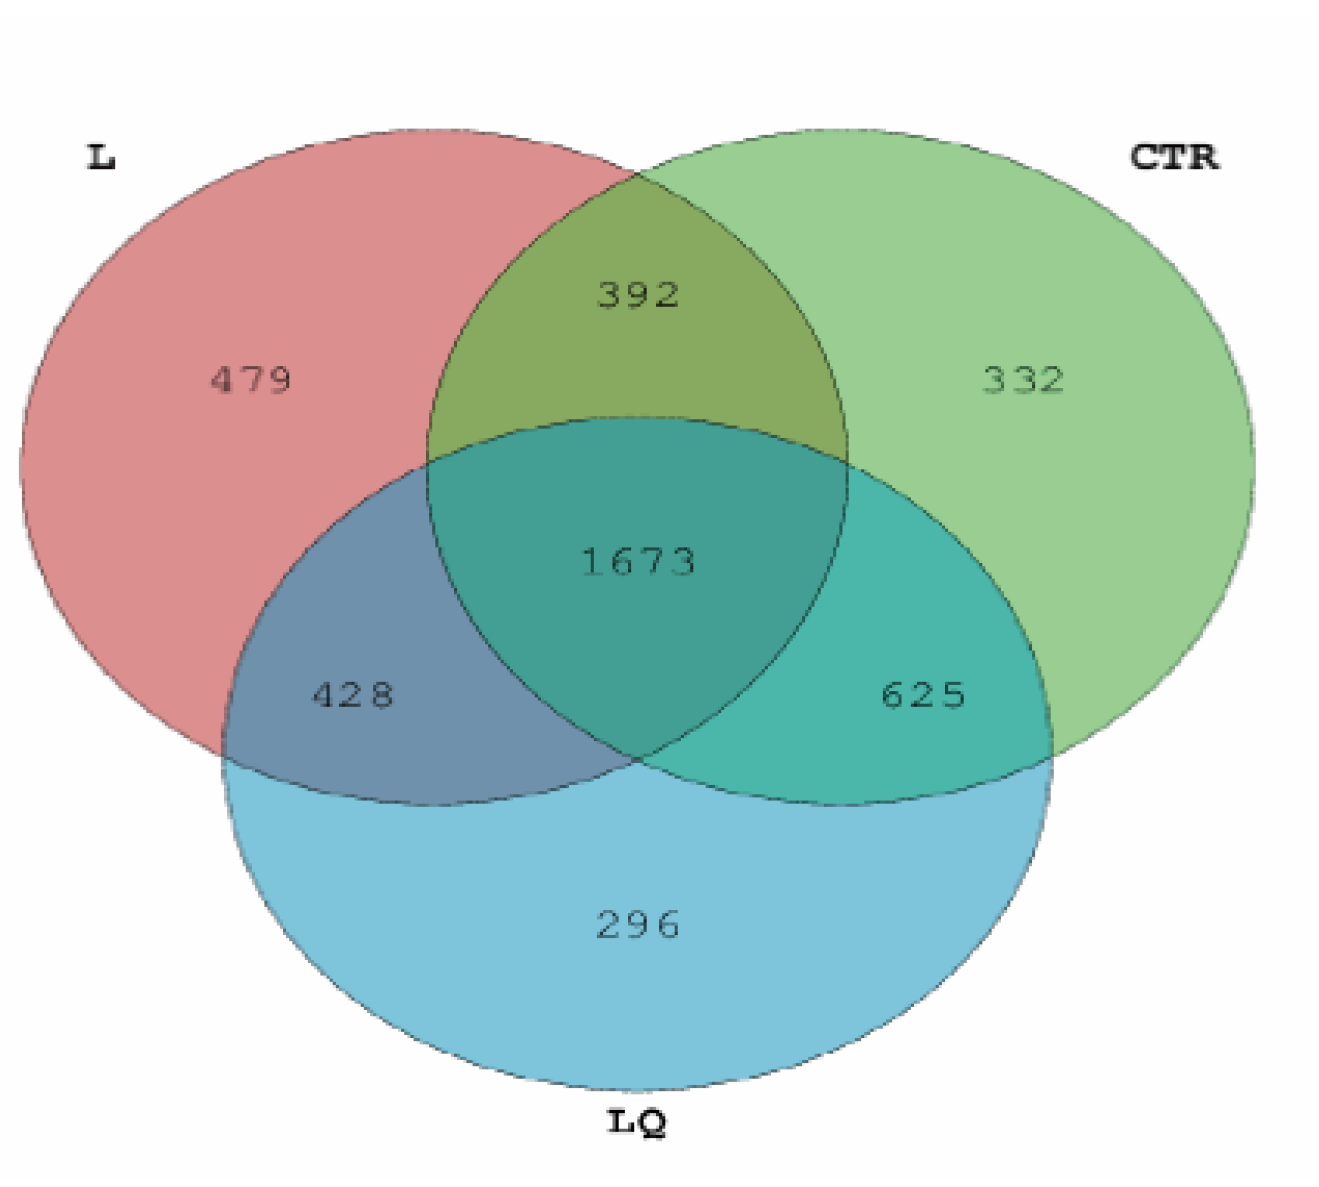
2.3. 16S rRNA Sequencing and Total out Analysis

Total DNA extracted from 27 jejunum samples were collected from three groups (n = 9). There were 297,258, 279,105 and 27,447 sequences of intestinal microbiota found in CTR, L and LQ, respectively. The proportions for shared and unique OTUs in the three groups are intuitively indicated in the Venn diagram in Figure 4. There were 1673 shared OTUs contained in CTR, L and LQ groups; the unique OTUs were 332, 479 and 296, respectively (Figure 4).

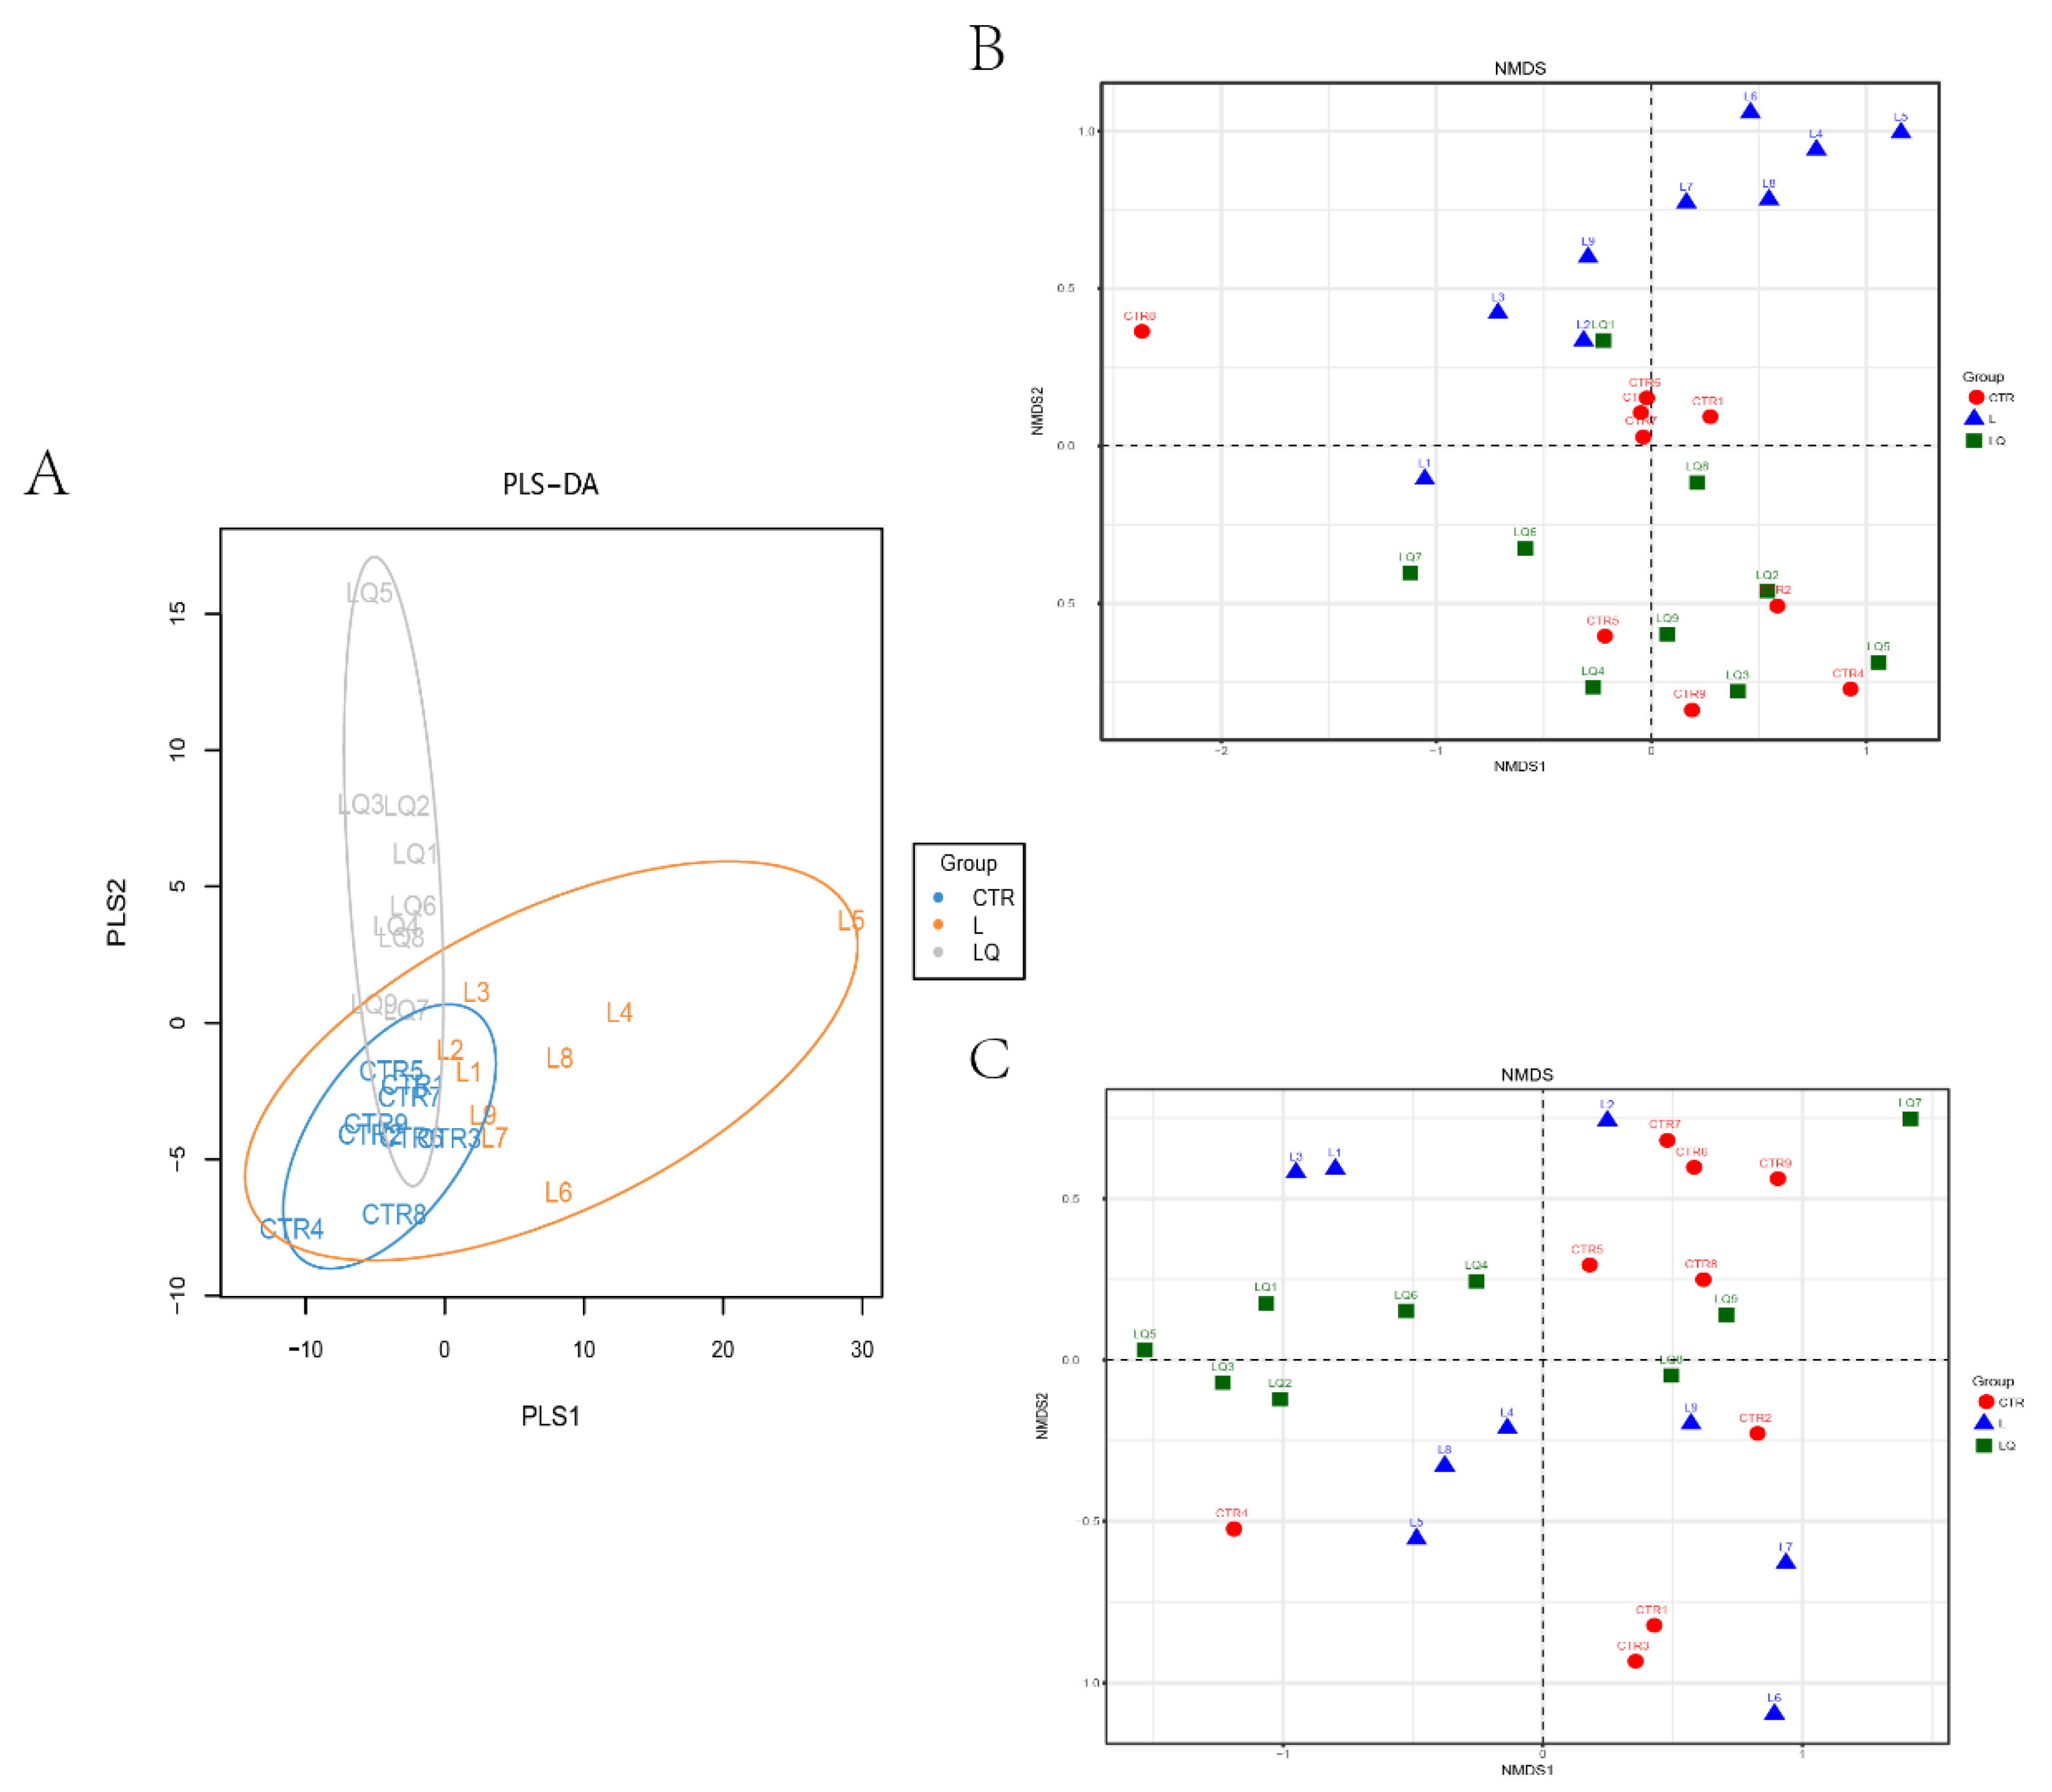
2.4. Diversity and Similarity of Microbial Community

The diversity of microbial communities among CTR, L and LQ groups was measured based on the alpha-diversity indices, such as chao1, Simpson and Shannon index (Table 1). There were no significant differences among the three groups, indicating that LPS and quercetin caused no changes in microbial community diversity.
Partial least squares discriminant analysis (PLS-DA) depicted the differences between and distance of samples by analyzing the different groups of the OTU. It applied variance decomposition to indicate the differences between two-fold samples on a two-dimensional coordinate graph. The circles of the different treatment groups in the PLS-DA map have overlapping regions, indicating that the differences between the groups were not very high (Figure 5A).
Beta-diversity analysis was used to investigate the similarity of community structure among the three groups and nonmetric multidimensional scaling (NMDS) analysis was performed for unweighted Unifmc and weighted UniFrac (Figure 5B,C) distance matrix by R software. The results of unweighted Unifmc (Figure 5B) showed that there was a grouping pattern between L and other groups (CTR and LQ) and a higher similarity between the CTR and LQ samples. However, the results of weighted UniFrac (Figure 5C) showed that there was no grouping pattern between groups.

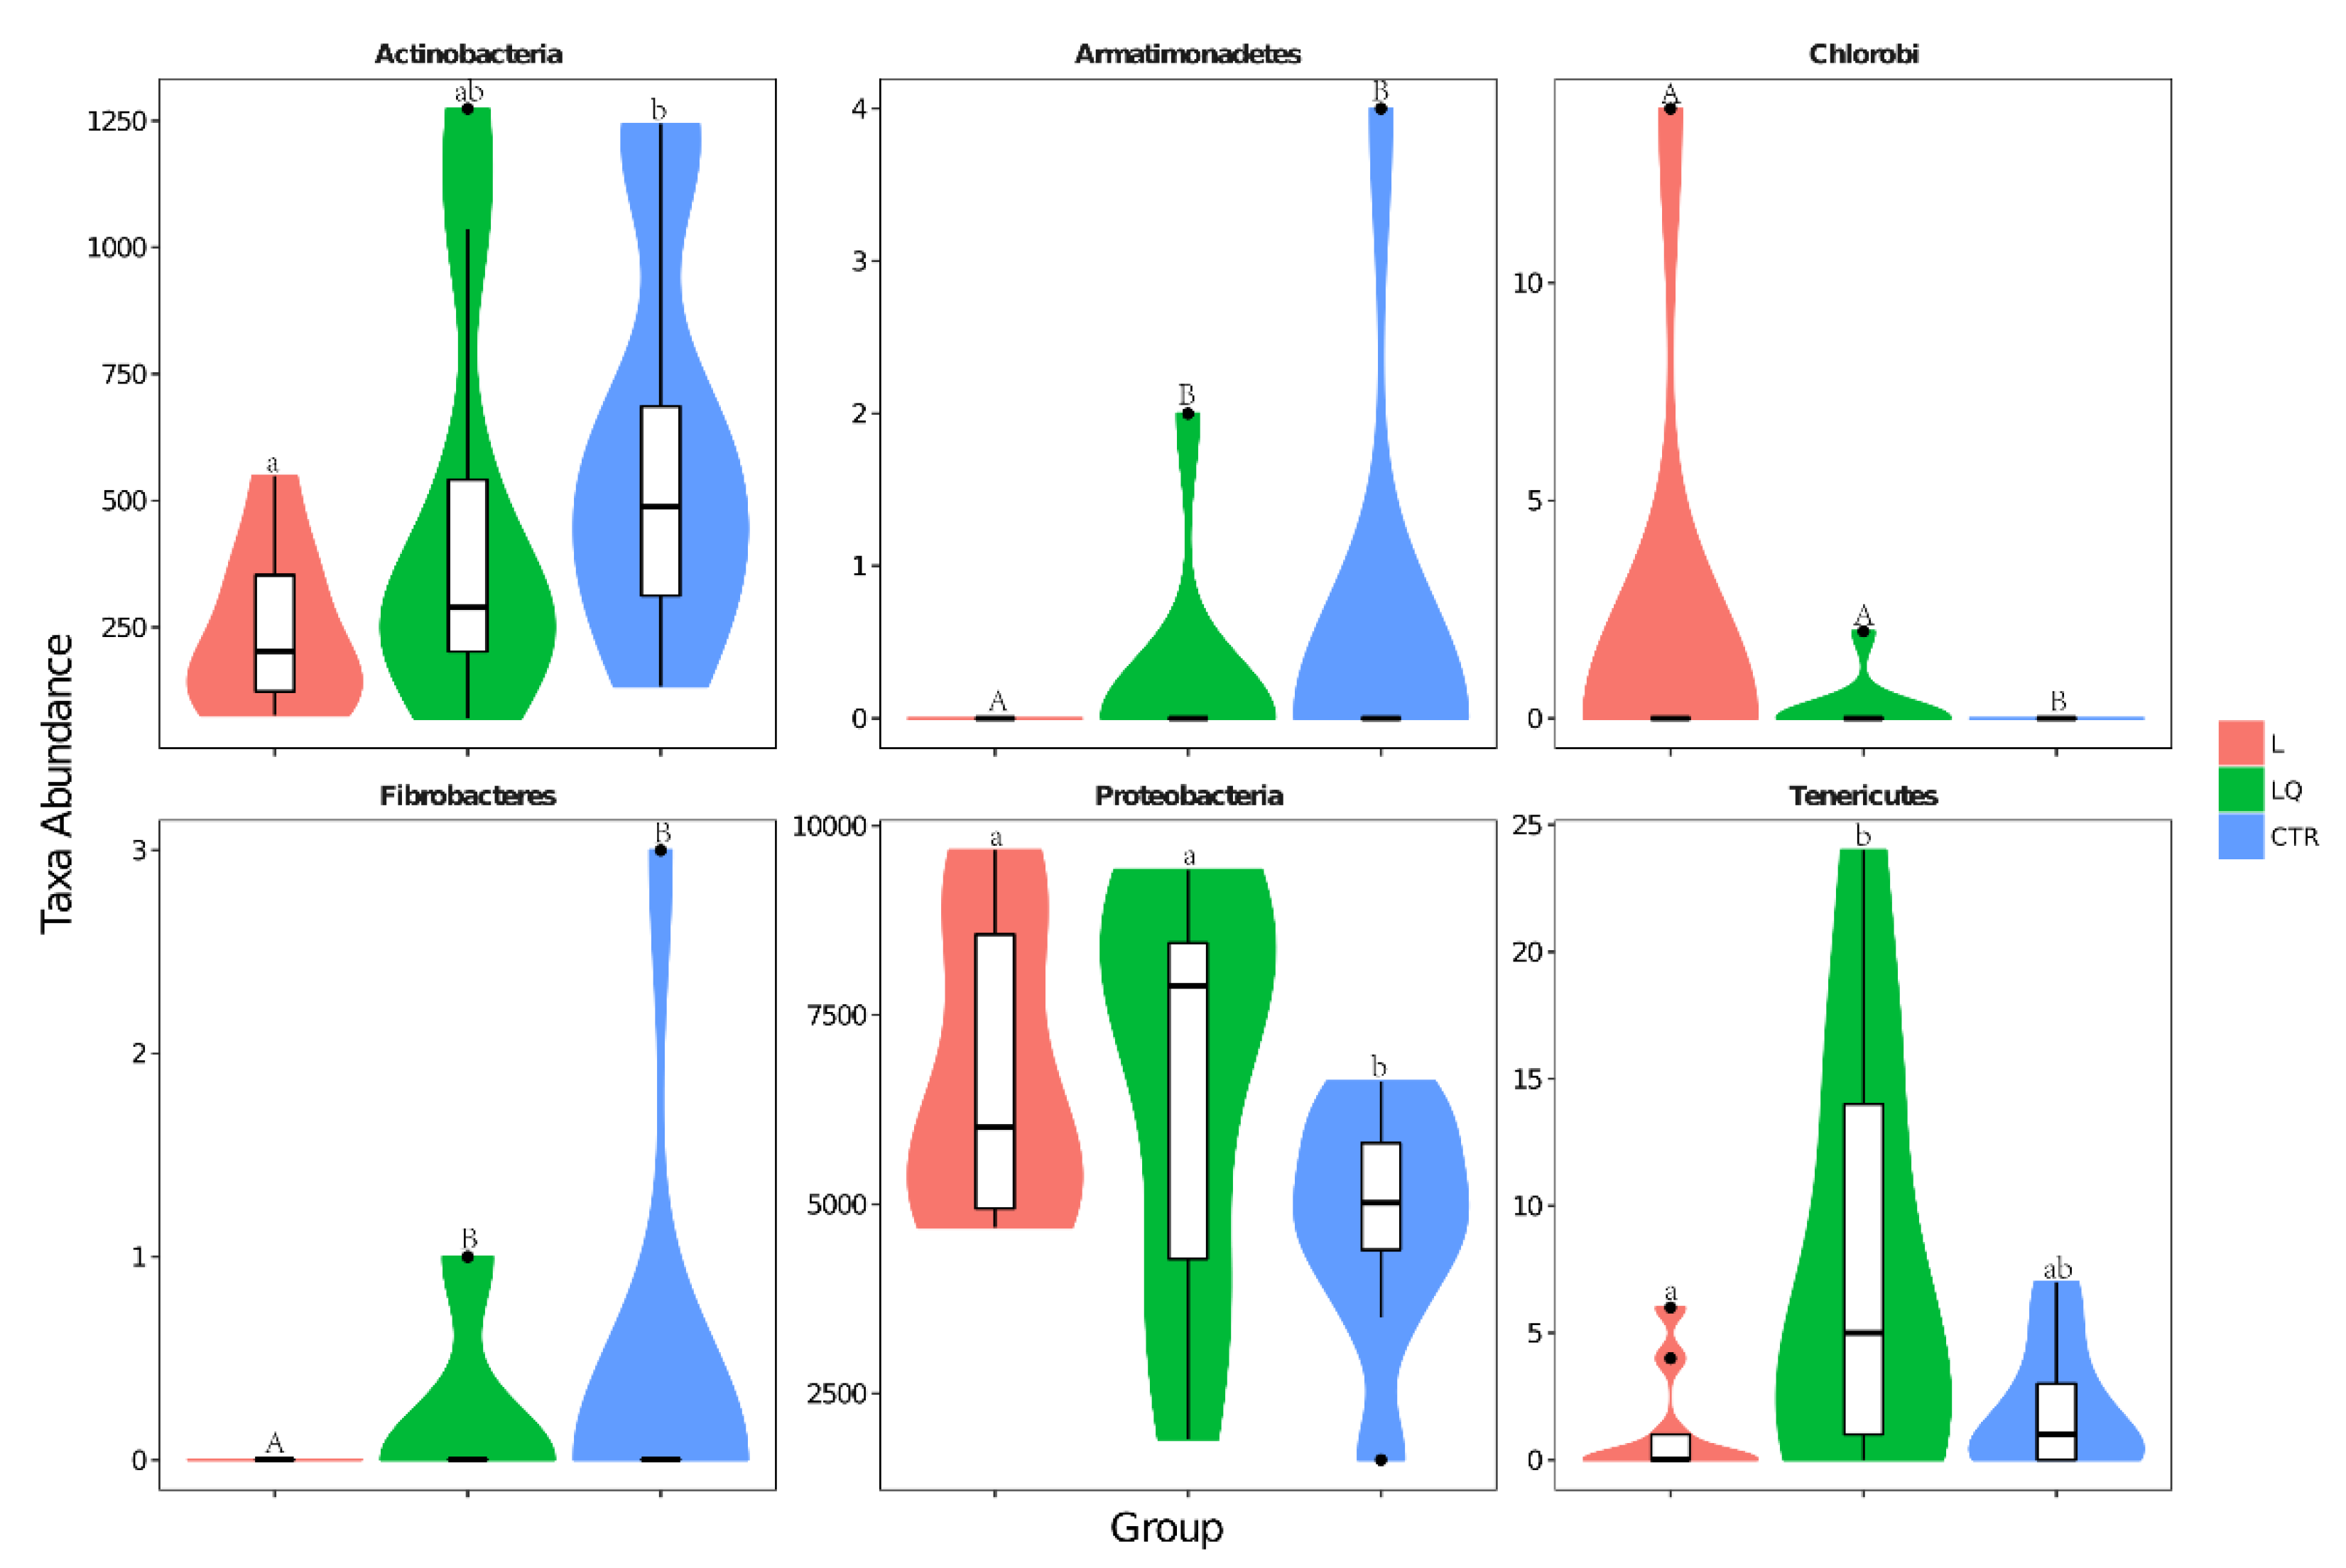
2.5. Phylum Level Abundance and Significance Difference of the Three Groups

As shown in Figure 6, Firmicutes were the most dominant bacteria at the phylum level, accounting for 66.60%, 59.59% and 58.99% in the CTR, L and LQ groups, respectively, followed by Proteobacteria, accounting for 24.96%, 35.19% and 34.99% in the CTR, L and LQ groups respectively. Another important bacterium with relatively low proportions was Actinobacteria, which had 3.17%, 1.26% and 2.47%, respectively. Results of Phylum level abundance in different groups are shown in Figure 7. The results showed that, at the phylum level, intraperitoneal injection of LPS could decrease the number of Actinobacteria (p < 0.05), Armatimonadetes (p < 0.01) and Fibrobacteriae (p < 0.01) when compared to the CTR group in jejuna of broiler chickens, while dietary quercetin could restore the number of these bacteria. Chlorobi (p < 0.01) and Proteobacteria (p < 0.05) in L group and LQ group were significantly abundant than in the CTR group.

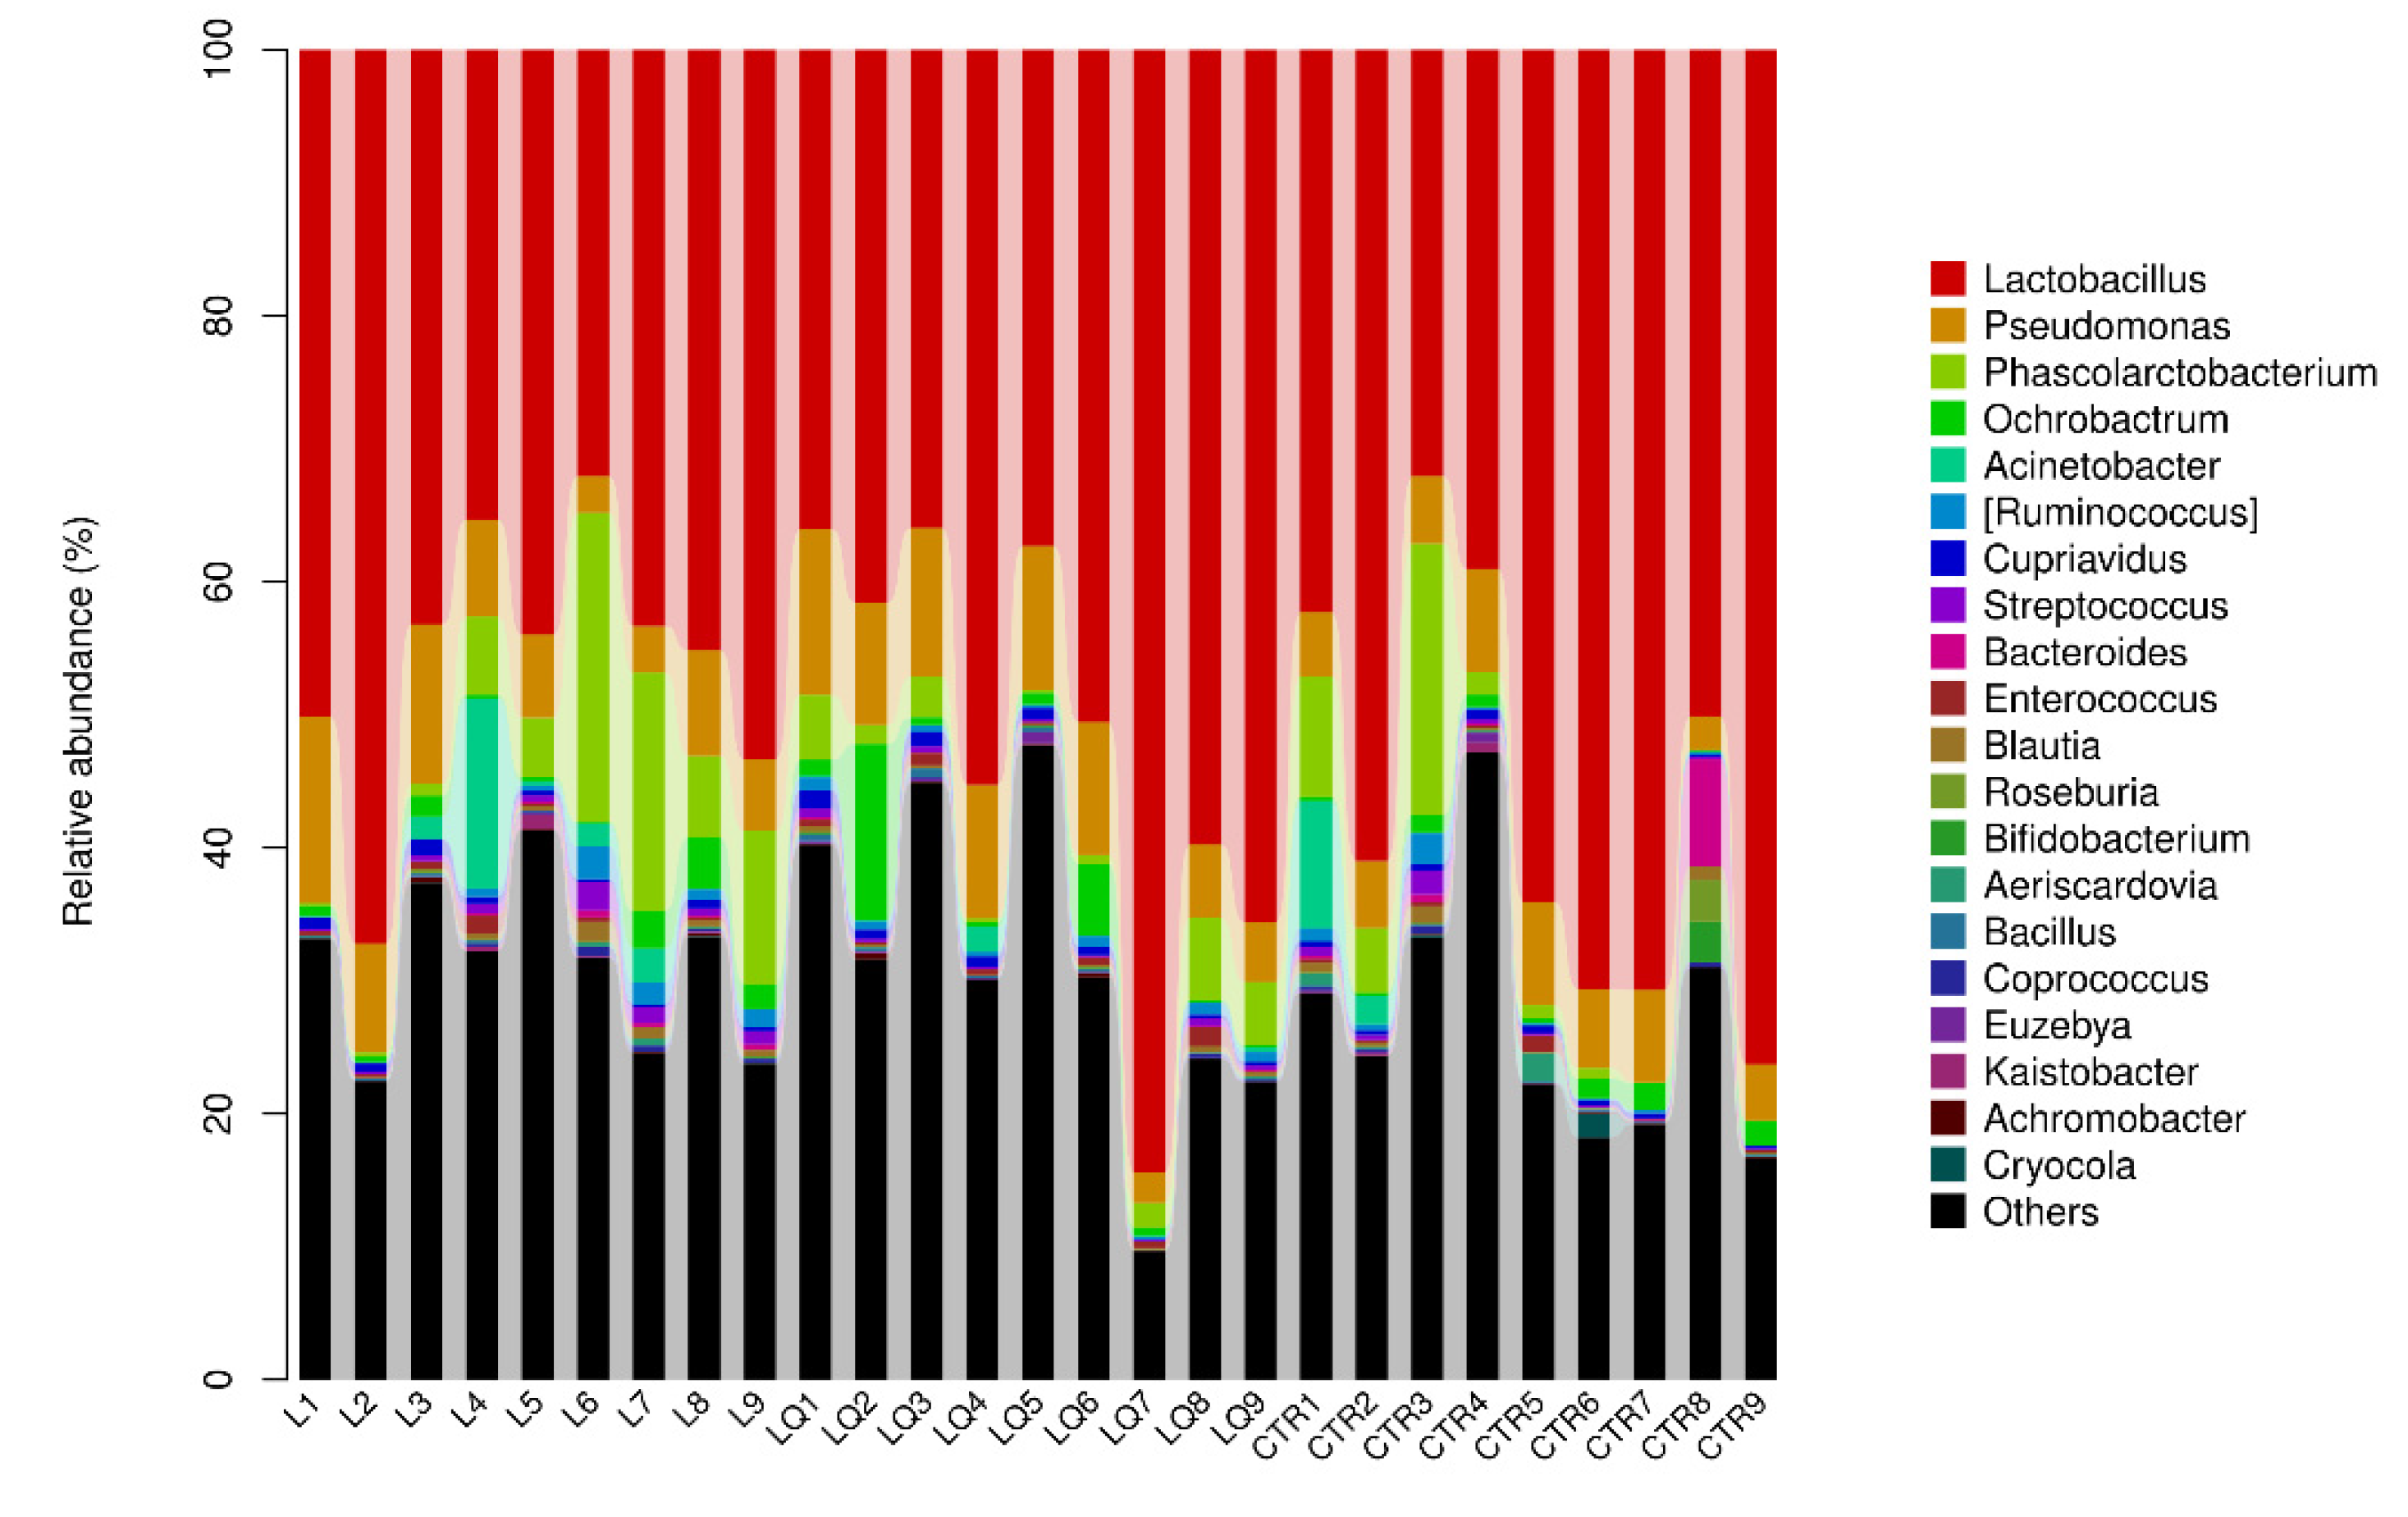
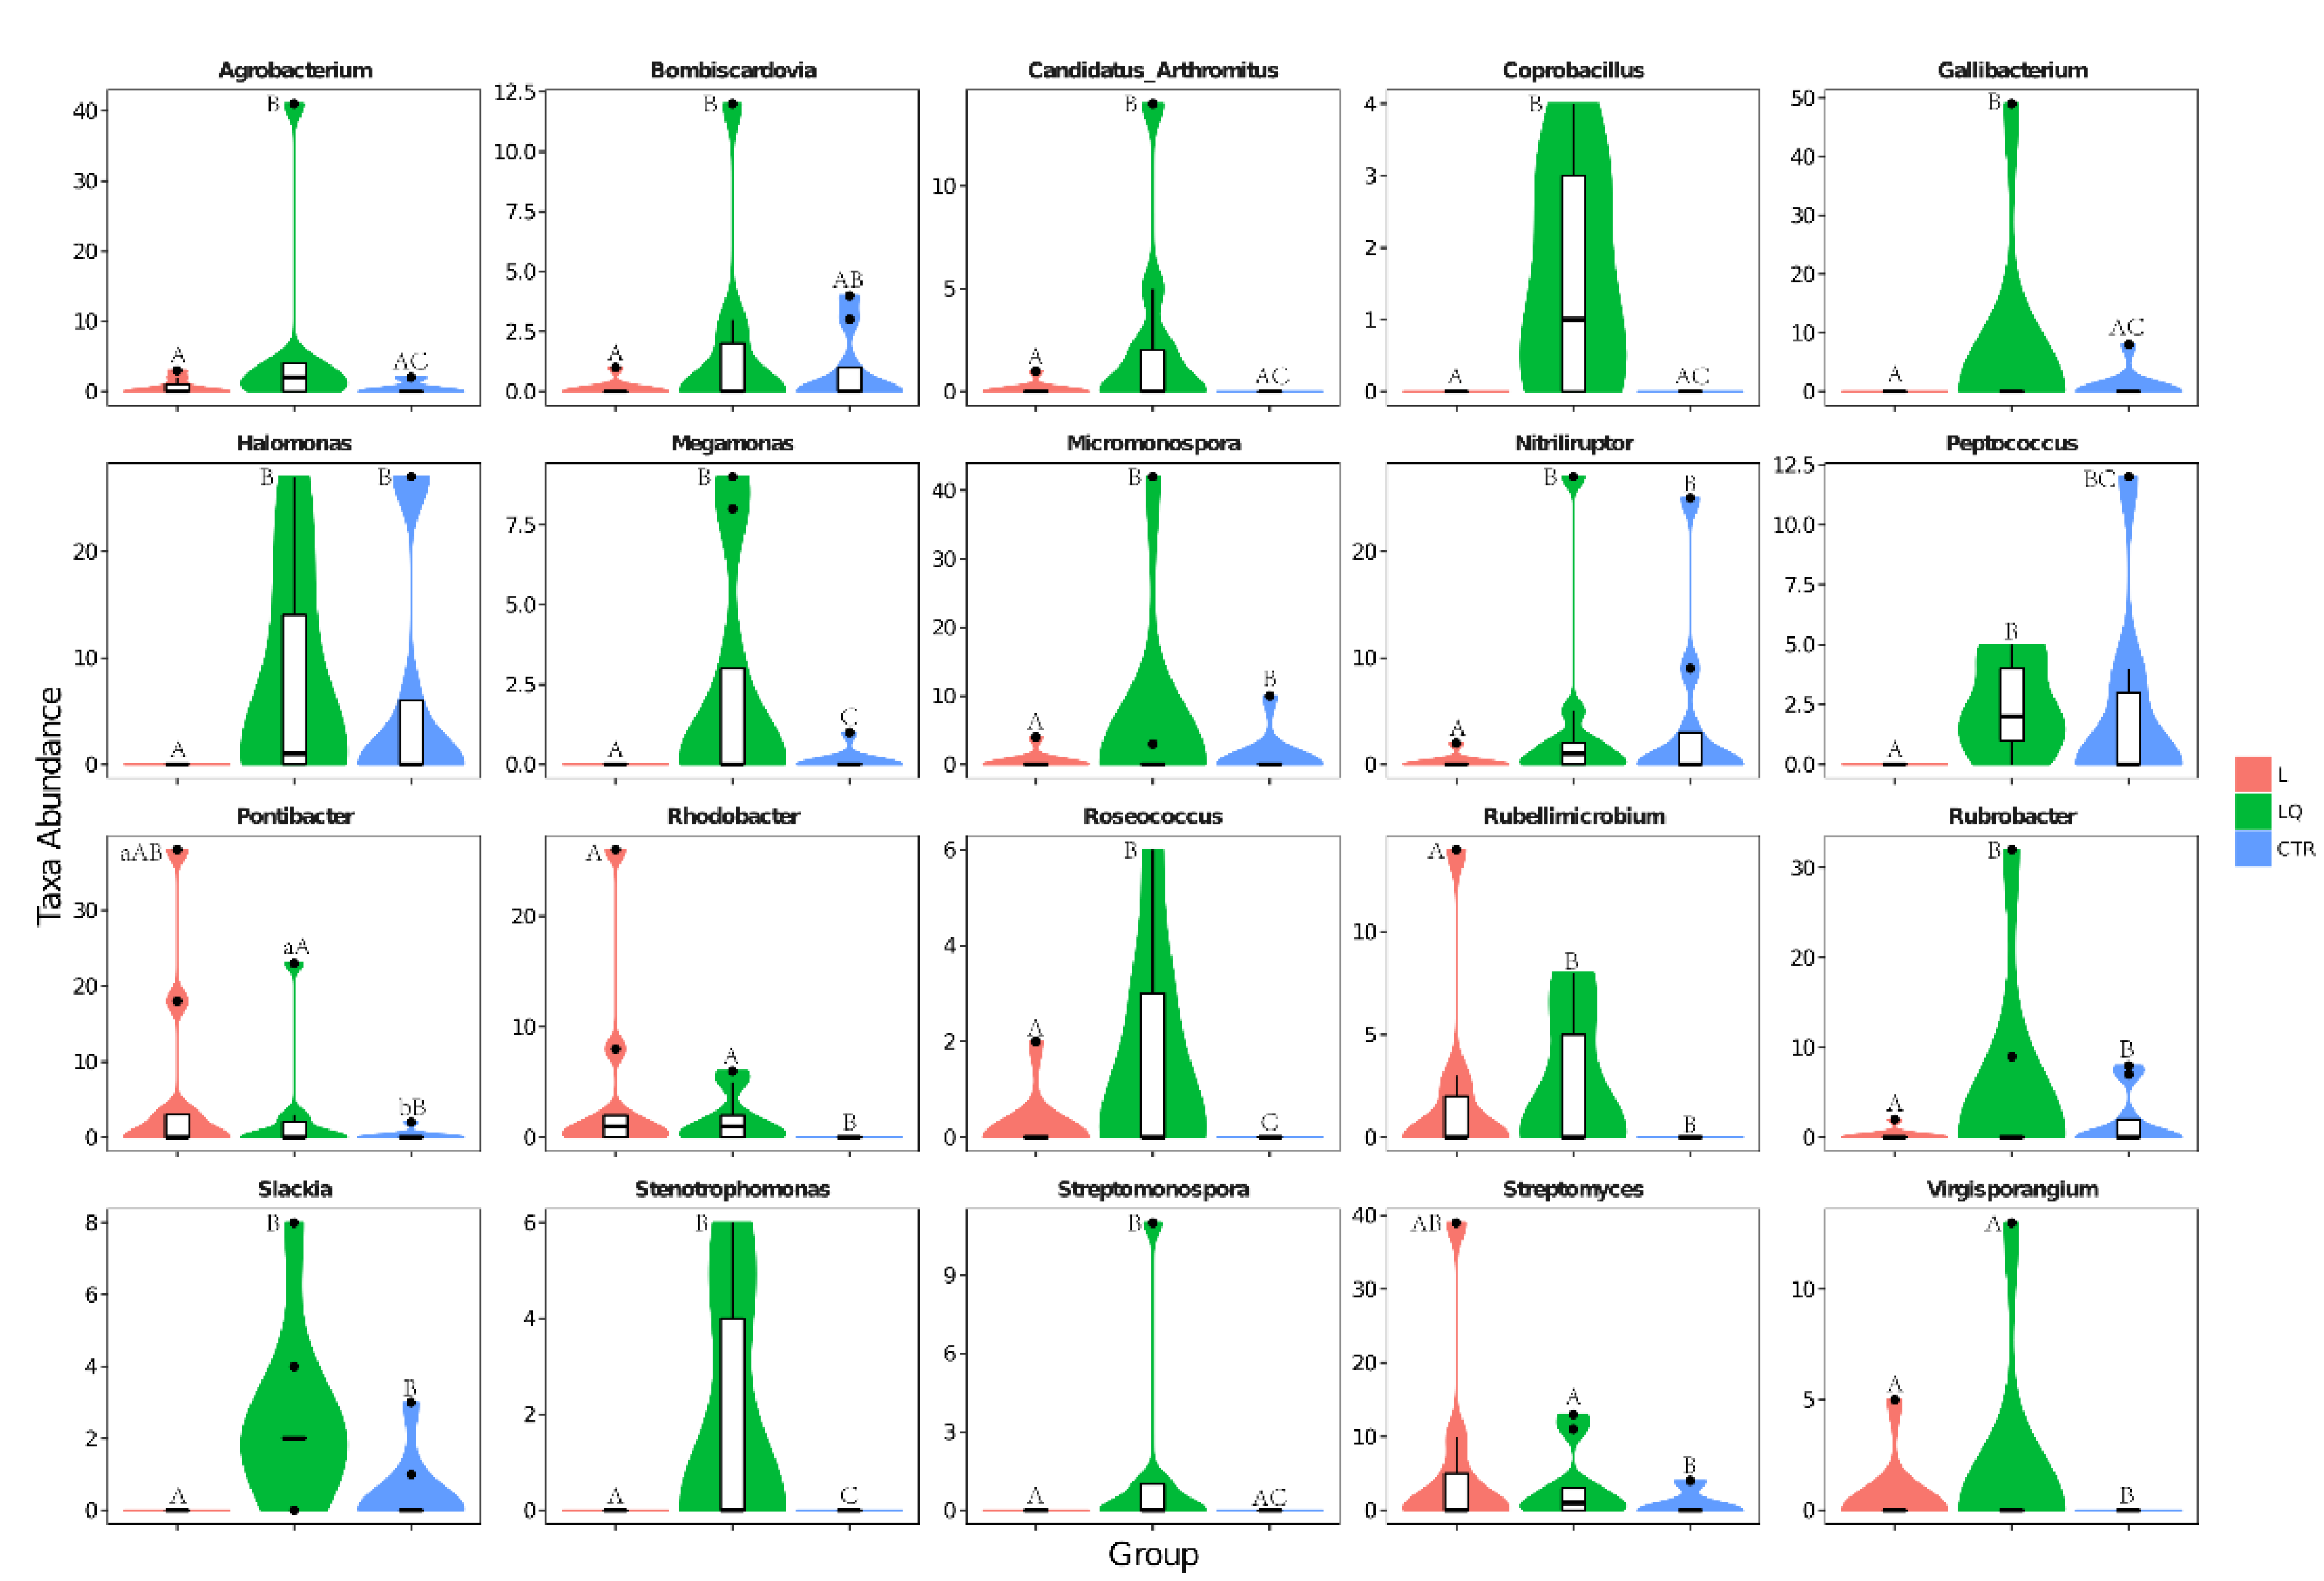
2.6. Genus Level Abundance and Significance Difference of the Three Groups

The most abundant bacterium at the genus level was Lactobacillus and its abundance levels in the CTR, L and LQ groups were 56.24%, 45.98% and 51.87%, respectively. Unclassified Moraxellaceae also had 12.42%, 16.98% and 18.94% abundance in CTR, L and LQ groups, respectively. Another abundant genus was Pseudomonas; its abundance levels in the CTR, L and LQ groups were 5.56%, 7.48% and 8.46%, respectively (Figure 8). Results of genus-level abundance in different groups are shown in Figure 9. At the genus level, compared with the CTR group, the abundance of Halomonas, Micromonospora, Nitriliruptor, Peptococcus, Rubellimicrobium, Rubrobacter and Slacldain (p < 0.05) in L group were significantly decreased, while the LQ group restored the number of these bacteria. The number of Agrobacterium, Candidatus_Arthromitus, Coprobacillus, Gallibacterium and Streptomonospora (p < 0.01) in LQ group were significantly more abundant than in CTR and L groups. Compared with the CTR group, the abundance of Rhodobacter, Virgisporangium (p < 0.01) in L group increased significantly, while Rhodobacter, Virgisporangium, Pontibacter and Streptomyces (p < 0.01) in LQ group increased significantly.

3. Discussion

The gut is the largest immunity organ in an animal’s body, and the benefits to animals maintaining a healthy gut are immeasurable [17]. Previous studies have shown that quercetin has anti-inflammatory effects [18,19]. Supplementation of dietary quercetin could mitigate intestinal inflammatory damage, as well as promote intestinal structure and immune barrier integrity in aged breeder hens [20]. In addition, intestinal inflammation could also be alleviated by regulating intestinal flora [21] The present study demonstrated, for the first time, that dietary quercetin could alleviate inflammatory responses induced by LPS injection and modulate the jejunum microflora of broiler chickens.
Cytokines are endogenous mediators of the immune system and are responsible for controlling inflammatory responses [22]. The intestinal barrier regulates the passage of microorganisms, proinflammatory molecules, antigens and toxins [23], whereas external stimuli induce oxidative stress, which ultimately increases proinflammatory cytokines, leading to intestinal epithelial cell damage and apoptosis [24]. Dietary antioxidants reduce intestinal inflammation by inhibiting proinflammatory enzymes [25]. Dietary quercetin also reduced cellular apoptosis in Japanese quails [26]. Similarly, this study showed that LPS-challenged chickens exhibited increased expression of inflammatory cytokines (TNF-α, IL-1β, IL-6, IL-8 and IFN-γ), TLR-4 and apoptosis-related genes (Bax and Caspase3), and decreased the expression of Bcl-2 in jejuna of broiler chickens, while dietary quercetin reversed the expression of these genes induced by LPS. Tight junction proteins (ZO-1 and occludin) and DAO affect the normal function of the intestinal mucosal barrier [27]. We found that LPS injection decreased the mRNA expression of ZO-1 and occludin, increased the level of DAO, and caused damage to the structure and function of the jejunum barrier; dietary quercetin prevented the adverse effects of LPS injection. Previous studies supported this research. It has been demonstrated that LPS can induce intestinal inflammation and barrier dysfunction in broilers [28]. Quercetin could ameliorate the inflammatory response of human retinal pigment epithelial cells [29]. Compared to untreated mice with allergic airway inflammation, quercetin supplementation improved histopathological changes in lung and decreased levels of inflammatory cytokine and cell apoptosis [18]. Recently, studies also showed that dietary quercetin could counteract colitis in mice [30,31] Quercetin also protected intestinal porcine enterocyte cells from H2O2-induced apoptosis [32]. Quercetin could alleviate intestinal barrier disruption and inflammation in acute necrotizing pancreatitis of rats [33]. Supported by previous studies, the results showed that dietary quercetin could alleviate inflammatory response and barrier dysfunction in the jejuna of broilers induced by LPS.
Mounting evidence has shown that intestinal microflora affect immune function and inflammatory response [34]. Previous studies have shown that LPS treatment could lead to inflammatory response and microflora disorder [35]. Dietary quercetin could alleviate colitis severity in Citrobacter rodentium-infected mice by modulating gut microflora [30]. Consistently, our results showed that LPS injection could significantly decrease the number of Actinobacteria, Armatimonadetes and Fibrobacteriae at the phylum level. Additionally, at genus level, compared with the CTR group, the abundance of Halomonas, Micromonospora, Nitriliruptor, Peptococcus, Rubellimicrobium and Rubrobacter in L group were significantly decreased; dietary quercetin could restore the numbers of these bacteria. Dietary quercetin also significantly increased the number of Rhodobacter, Virgisporangium, Pontibacter and Streptomyces. These results indicated that dietary quercetin could at least partly restore microbial communities in jejuna of broilers caused by LPS and increase some beneficial bacteria. The quantitative changes in some specific bacteria in the present study were supported by previous studies. Studies have pointed out that the abundance levels of Halomonas, Peptococcus, and Rubrobacter can be associated with intestinal inflammation, and are increased when intestinal inflammation occurs [36,37,38]. Streptomyces and Micromonospora, as members of Actinobacteria, have been shown to have anti-inflammatory and antioxidant effects [39,40,41]. It has been shown that Rhodobacter spheroids attenuate inflammation and directly regulate T cell response [42]. Quercetin has antibacterial effects and changes cecal microbial population and distribution in broilers [43]. In rats, quercetin could restore gut microbiota dysbiosis induced by a high-fat sucrose diet [44]. This research showed that quercetin could protect the gut from inflammatory responses by modulating microbial communities.
However, there were some limitations in the present study. The effects of specific bacteria regulated by quercetin on the inflammatory responses of the gut were not investigated. Therefore, experiments in vivo investigating the role of some specific bacteria on gut inflammatory responses in broilers might help clarify the anti-inflammatory effects of dietary quercetin via microflora.

4. Conclusions

200 mg/kg quercetin improved LPS-induced inflammation and apoptosis in broilers, downregulating TNF-α, IL-1β, IL-6, IL-8, IFN-γ, TLR-4, Bax, Caspase-3 and DAO and upregulating the expression of ZO-1, Occludin and Bcl-2. Meanwhile, Quercetin also ameliorated LPS-induced changes in jejunal microbiota and improved gut immunity with increased abundance of Peptococcus, Rubellimicrobium, Rubrobacter and Slaclda. In conclusion, this research showed that dietary quercetin could alleviate inflammatory responses in broiler chickens accompanied by modulating jejunum microflora. This study will have certain reference significance for the application of quercetin to the development of broiler production.

5. Materials and Methods

Ethical approval for the present study was obtained from the Ethical Committee of the Jilin Agricultural University, China.

5.1. Animal Treatment and Sample Preparation

One hundred and twenty arbor acre broiler chickens (1-day-old) were kept for three weeks and their basal diet was formulated to meet NRC (1994) recommendations (Table 2). The broiler chickens were randomly allocated into 3 groups (n = 40): control group (CTR), LPS group (L) and quercetin group (LQ). Broiler chickens in the CTR and L groups were fed a basal diet, while broiler chickens in LQ groups were fed a basal diet containing 200 mg/kg of quercetin. The broiler chickens in the L and LQ groups were intraperitoneally injected with LPS on days 16, 18 and 20, respectively. The injection volume was 0.5 mg/kg (sigma company, serotype 055 B55, diluted with sterilized saline to 0.5 mg/mL). Additionally, broiler chickens in the CTR group were injected with the same volume of saline as LPS treatment. Feed and water were provided ad libitum. Light was applied 24 h per day. Broiler chickens were slaughtered at 21 days old. The jejuna were collected at about 10 cm distal to the duodenum, opened longitudinally, then flushed gently and repeatedly with phosphate-buffered saline (pH 7.4). They were then transferred into sterile frozen tubes and flash-frozen in liquid nitrogen. Segments of approximately 2 cm of mid-jejunum were rinsed with phosphate-buffered saline and kept in formalin solution (10%) for histological examination. At the same time, twelve broiler chickens from different groups were randomly selected and slaughtered by bleeding from the jugular vein. Their whole blood samples were collected using EDTA anticoagulant vacuum tubes. Plasma was then separated by centrifuging at 2000 rpm for 20 min and stored at −20 °C for further analysis.

5.2. Quantitative Real-Time Polymerase Chain Reaction (qRT-PCR) Analysis

Detection of mRNA expression of inflammatory cytokines, apoptosis related genes, tight junction protein genes and TLR-4 was carried out using qRT-PCR, and β-Actin was used as an interior control. Primers were synthesized by Shanghai Biotech (Table 3). Reverse transcription to cDNA was conducted using TaKaRa reverse transcription kit and qRT-PCR was also performed with TB Green Supermix (Takara, Tokyo, Japan) real-time PCR system in a 20 μL reaction mixture comprising 2 μL cDNA template, 10 μL SYBR Premix Ex TaqII, 0.4 µL ROX reference DyeII, 0.8 µL Forward and Reverse Primer and 6 μL nuclease-free water. The separate sample was analyzed into four repeats. The relative expression fraction of the target gene was calculated by means of the 2−ΔΔCt method and expressed in comparison with the β-Actin gene.

5.3. Enzyme-Linked Immunosorbent Assay (ELISA)

Jejunum tissue samples were treated with protease inhibitor and phosphate-buffered saline and then subjected to homogenization. Finally, the samples were centrifuged at 5000× g for 10 min, and the supernatant was used for ELISA. The contents of toll-like receptor (TLR)-4, inflammatory cytokines tumor necrosis factor (TNF)-α, interleukin (IL)-1β, IL-6, IL-8 and interferon (IFN)-γ were measured by ELISA using a commercial kit (Shanghai Enzyme-linked Biotechnology Co., Ltd., China), according to the manufacturer’s protocol.

5.4. Determination of Diamine Oxidase Activity (DAO) Level

After collection from different groups of broiler chickens, The DAO in the plasma was determined using a microplate reader, following the manufacturers’ instructions (Shanghai Langdun Biotech, Shanghai, China).

5.5. Extraction of Total DNA and Sequencing of 16S rRNA

Total DNA in the jejuna was extracted using the Fast DNA SPIN Extraction Kits (MP Biomedicals, Santa Ana, CA, USA) according to the manufacturer’s instructions. The purity of the DNA extracts was measured by 0.8% agarose gel electrophoresis. The PCR reaction procedure: 5 µL 5 × Q5 reaction buffer, 5 µL 5 × Q5 High-Fidelity GC buffer, 0.25 µL of Q5 High-Fidelity DNA Polymerase, 2 µL 2.5 mM dNTPs, 1 µL 10 µM Forward and Reverse Primer, 10 ng Template DNA and ddH2O were added to reach the final volume to 25 µL. PCR reaction conditions were as follows: 98 °C for 2 min with 25 cycles, 98 °C for 15 s, 55 °C for 30 s, 72 °C for 30 s and then a final extension at 72 °C for 5 min. The PCR product was separated and recovered by 2% agarose gel electrophoresis and quantified using Quant-iT PicoGreen dsDNA Assay Kits (Invitrogen, Carlsbad, CA, USA).
The DNA was sequenced using the Illumina MiSeq platform obtained from Shanghai Personal Biotechnology Co., Ltd. (Shanghai, China). All the raw sequences obtained from the Illumina MiSeq were filtered, and FLASH software (v1.2.7) was used to sort and evaluate the quality of the original data. The obtained sequences were clustered and ≥97% sequence identity was merged into the OTU [45]. The sequence with the highest abundance in each operational taxonomic unit (OTU) was then selected as the representative sequence of the OTU using QIIME software, and OTU classification was performed by BLAST search in the Greengenes database [46]. OTUs whose abundance values were less than 0.001% of the total sequencing volume of all samples [47] and rare OTUs were removed. According to the obtained OTU abundance matrix, R software was used to calculate the number of OTUs in the three groups, and a Venn chart was drawn. The QIIME software was used to calculate the α diversity analysis (Chao1, Simpson Mean and Shannon Mean) to determine the abundance and diversity of the sequences. Nonmetric multidimensional scaling (NMDS) analyses of Unweighted and Weighted UniFrac distance matrices were performed using R software to assess similarities in the structure and distribution of microbial genetic communities in the samples [48,49]. The phylum and genus intestinal flora composition and abundance distribution table were obtained using QIIME software.

5.6. Statistical Analysis

SPSS software 23.0 (IBM Corp, Armonk, NY, USA) was used for data analysis. The data were expressed as means ± standard error of the mean (SEM), analyzed for significance by one-way analysis of variance (ANOVA) accompanied by Tukey’s honestly significant difference post-hoc test. p < 0.05 meant that the difference was statistically significant.

Author Contributions

Conceptualization, L.Y. and W.L.; Methodology, L.S. and L.G.; Software, Z.L. and M.O.A.; Validation, L.S., L.G., M.O.A. and G.X.; Formal Analysis, L.S.; Investigation, L.G.; Data Curation, L.S.; Writing—Original Draft Preparation, L.S.; Writing—Review & Editing, L.Y. and W.L.; Supervision, L.Y. and W.L.; Project W.L.; Funding Acquisition, W.L. All authors have read and agreed to the published version of the manuscript.

Funding

This research was funded by the National Key Research and Development Program of China grant number [2016YFD0500502].

Institutional Review Board Statement

All institutional and national guidelines for the care and use of experimental animals were followed. All the experimental procedures were approved by the National Animal Experiment Board with the guidelines established by the European Union Directive about animal experimentation (Act on the Protection of Animals Used for Scientific or Educational Purposes). The study was conducted in accordance with the Declaration of Helsinki, and approved by the Institutional Review Board of Ethics Committee of Jilin Agricultural University (protocol code 20200426001).

Informed Consent Statement

Not applicable.

Data Availability Statement

Not applicable.

Acknowledgments

This work was supported by the National Key Research and Development Program of China (2016YFD0500502).

Conflicts of Interest

There is no competing of interest in the submission of the manuscript and all authors approve it for publication.

Sample Availability

Samples of the compounds are not available from the authors.

References

  1. Kaldhusdal, M.; Benestad, S.L.; Løvland, A. Epidemiologic aspects of necrotic enteritis in broiler chickens-disease occurrence and production performance. Avian Pathol. 2016, 45, 271–274. [Google Scholar] [CrossRef] [PubMed]
  2. Prescott, J.F.; Parreira, V.R.; Mehdizadeh Gohari, I.; Lepp, D.; Gong, J. The pathogenesis of necrotic enteritis in chickens: What we know and what we need to know: A review. Avian Pathol. 2016, 45, 288–294. [Google Scholar] [CrossRef] [PubMed] [Green Version]
  3. Ateya, A.I.; Arafat, N.; Saleh, R.M.; Ghanem, H.M.; Naguib, D.; Radwan, H.A.; Elseady, Y.Y. Intestinal gene expressions in broiler chickens infected with Escherichia coli and dietary supplemented with probiotic, acidifier and synbiotic. Vet. Res. Commun. 2019, 43, 131–142. [Google Scholar] [CrossRef] [PubMed]
  4. Kollef, M.H.; Bassetti, M.; Francois, B.; Burnham, J.; Dimopoulos, G.; Garnacho-Montero, J.; Lipman, J.; Luyt, C.-E.; Nicolau, D.P.; Postma, M.J.; et al. The intensive care medicine research agenda on multidrug-resistant bacteria, antibiotics, and stewardship. Intens Care Med. 2017, 43, 1187–1197. [Google Scholar] [CrossRef]
  5. Dou, W.; Zhang, J.; Sun, A.; Zhang, E.; Ding, L.; Mukherjee, S.; Wei, X.; Chou, G.; Wang, Z.-T.; Mani, S. Protective effect of naringenin against experimental colitis via suppression of Toll-like receptor 4/NF-κB signalling. Br. J. Nutr. 2013, 110, 599–608. [Google Scholar] [CrossRef] [Green Version]
  6. Kim, J.S.; Jobin, C. The flavonoid luteolin prevents lipopolysaccharide-induced NF-kappaB signalling and gene expression by blocking IkappaB kinase activity in intestinal epithelial cells and bone-marrow derived dendritic cells. Immunology 2005, 115, 375–387. [Google Scholar] [CrossRef]
  7. Amasheh, M.; Grotjohann, I.; Amasheh, S.; Fromm, A.; Söderholm, J.D.; Zeitz, M.; Fromm, M.; Schulzke, J.-D. Regulation of mucosal structure and barrier function in rat colon exposed to tumor necrosis factor alpha and interferon gamma in vitro: A novel model for studying the pathomechanisms of inflammatory bowel disease cytokines. Scand. J. Gastroenterol. 2009, 44, 1226–1235. [Google Scholar] [CrossRef]
  8. Endale, M.; Park, S.-C.; Kim, S.; Kim, S.-H.; Yang, Y.; Cho, J.Y.; Rhee, M.H. Quercetin disrupts tyrosine-phosphorylated phosphatidylinositol 3-kinase and myeloid differentiation factor-88 association, and inhibits MAPK/AP-1 and IKK/NF-κB-induced inflammatory mediators production in RAW 264.7 cells. Immunobiology 2013, 218, 1452–1467. [Google Scholar] [CrossRef]
  9. Gil-Cardoso, K.; Ginés, I.; Pinent, M.; Ardévol, A.; Blay, M.; Terra, X. Effects of flavonoids on intestinal inflammation, barrier integrity and changes in gut microbiota during diet-induced obesity. Nutr. Res. Rev. 2016, 29, 234–248. [Google Scholar] [CrossRef]
  10. Suzuki, T.; Hara, H. Quercetin enhances intestinal barrier function through the assembly of zonula [corrected] occludens-2, occludin, and claudin-1 and the expression of claudin-4 in Caco-2 cells. J. Nutr. 2009, 139, 965–974. [Google Scholar] [CrossRef]
  11. Bian, Y.; Liu, P.; Zhong, J.; Hu, Y.; Zhuang, S.; Fan, K.; Liu, Z. Quercetin Attenuates Adhesion Molecule Expression in Intestinal Microvascular Endothelial Cells by Modulating Multiple Pathways. Dig. Dis. Sci. 2018, 63, 3297–3304. [Google Scholar] [CrossRef] [PubMed]
  12. Pisani, A.; Rausch, P.; Bang, C.; Ellul, S.; Tabone, T.; Marantidis Cordina, C.; Zahra, G.; Franke, A.; Ellul, P. Dysbiosis in the Gut Microbiota in Patients with Inflammatory Bowel Disease during Remission. Microbiol. Spectr. 2022, e0061622. [Google Scholar] [CrossRef] [PubMed]
  13. Yang, X.; Liu, L.; Chen, J.; Xiao, A. Response of Intestinal Bacterial Flora to the Long-term Feeding of Aflatoxin B1 (AFB1) in Mice. Toxins 2017, 9, 317. [Google Scholar] [CrossRef] [PubMed] [Green Version]
  14. Giloteaux, L.; Goodrich, J.K.; Walters, W.A.; Levine, S.M.; Ley, R.E.; Hanson, M.R. Reduced diversity and altered composition of the gut microbiome in individuals with myalgic encephalomyelitis/chronic fatigue syndrome. Microbiome 2016, 4, 30. [Google Scholar] [CrossRef] [PubMed] [Green Version]
  15. Wang, C.; Wei, S.; Liu, B.; Wang, F.; Lu, Z.; Jin, M.; Wang, Y. Maternal consumption of a fermented diet protects offspring against intestinal inflammation by regulating the gut microbiota. Gut Microbes 2022, 14, 2057779. [Google Scholar] [CrossRef]
  16. Zhang, J.; Cao, L.; Sun, Y.; Qing, D.-G.; Xu, X.-Q.; Wang, J.-C.; Si, J.-Y.; Li, N. The Regulatory Effects of Licochalcone A on the Intestinal Epithelium and Gut Microbiota in Murine Colitis. Molecules 2021, 26, 4149. [Google Scholar] [CrossRef]
  17. McClave, S.A. Can feeding strategies alter immune signaling and gut sepsis in critical illness? JPEN J. Parenter. Enter. Nutr. 2021, 45 (Suppl. 2), 66–73. [Google Scholar] [CrossRef]
  18. Caglayan Sozmen, S.; Karaman, M.; Cilaker Micili, S.; Isik, S.; Bagriyanik, A.; Arikan Ayyildiz, Z.; Uzuner, N.; Anal, O.; Karaman, O. Effects of Quercetin Treatment on Epithelium-derived Cytokines and Epithelial Cell Apoptosis in Allergic Airway Inflammation Mice Model. Iran. J. Allergy Asthma Immunol. 2016, 15, 487–497. [Google Scholar]
  19. Zhu, Q.; Liu, M.; He, Y.; Yang, B. Quercetin protect cigarette smoke extracts induced inflammation and apoptosis in RPE cells. Artif. Cells Nanomed. Biotechnol. 2019, 47, 2010–2015. [Google Scholar] [CrossRef] [Green Version]
  20. Amevor, F.K.; Cui, Z.; Du, X.; Ning, Z.; Deng, X.; Xu, D.; Shu, G.; Wu, Y.; Cao, X.; Shuo, W.; et al. Supplementation of Dietary Quercetin and Vitamin E Promotes the Intestinal Structure and Immune Barrier Integrity in Aged Breeder Hens. Front. Immunol. 2022, 13, 860889. [Google Scholar] [CrossRef]
  21. Ma, F.; Sun, M.; Song, Y.; Wang, A.; Jiang, S.; Qian, F.; Mu, G.; Tuo, Y. Lactiplantibacillus plantarum-12 Alleviates Inflammation and Colon Cancer Symptoms in AOM/DSS-Treated Mice through Modulating the Intestinal Microbiome and Metabolome. Nutrients 2022, 14, 1916. [Google Scholar] [CrossRef] [PubMed]
  22. Salemi, R.; Tomasello, B.; Gattuso, G.; Signorelli, S.S.; Candido, S. Overactivation of IL6 cis-signaling in leukocytes is an inflammatory hallmark of deep vein thrombosis. Mol. Med. Rep. 2022, 25, 136. [Google Scholar] [CrossRef] [PubMed]
  23. Farré, R.; Fiorani, M.; Abdu Rahiman, S.; Matteoli, G. Intestinal Permeability, Inflammation and the Role of Nutrients. Nutrients 2020, 12, 1185. [Google Scholar] [CrossRef] [PubMed]
  24. Liu, L.; Liang, L.; Yang, C.; Zhou, Y.; Chen, Y. Extracellular vesicles of Fusobacterium nucleatum compromise intestinal barrier through targeting RIPK1-mediated cell death pathway. Gut Microbes 2021, 13, 1902718. [Google Scholar] [CrossRef]
  25. Li, M.; Kong, Y.; Wu, X.; Yin, Z.; Niu, X.; Wang, G. Dietary α-lipoic acid can alleviate the bioaccumulation, oxidative stress, cell apoptosis, and inflammation induced by lead (Pb) in Channa argus. Fish Shellfish Immunol. 2021, 119, 249–261. [Google Scholar] [CrossRef]
  26. Arslan, A.S.; Seven, I.; Mutlu, S.I.; Arkali, G.; Birben, N.; Seven, P.T. Potential ameliorative effect of dietary quercetin against lead-induced oxidative stress, biochemical changes, and apoptosis in laying Japanese quails. Ecotoxicol. Environ. Saf. 2022, 231, 113200. [Google Scholar] [CrossRef]
  27. Wu, Y.; Wang, W.; Kim, I.H.; Yang, Y. Dietary hydrolyzed wheat gluten supplementation ameliorated intestinal barrier dysfunctions of broilers challenged with Escherichia coli O78. Poult. Sci. 2022, 101, 101615. [Google Scholar] [CrossRef]
  28. Yang, L.; Liu, G.; Lian, K.; Qiao, Y.; Zhang, B.; Zhu, X.; Luo, Y.; Shang, Y.; Gu, X.-L. Dietary leonurine hydrochloride supplementation attenuates lipopolysaccharide challenge-induced intestinal inflammation and barrier dysfunction by inhibiting the NF-κB/MAPK signaling pathway in broilers. J. Anim. Sci. 2019, 97, 1679–1692. [Google Scholar] [CrossRef]
  29. Cheng, S.-C.; Huang, W.-C.; S Pang, J.-H.; Wu, Y.-H.; Cheng, C.-Y. Quercetin Inhibits the Production of IL-1β-Induced Inflammatory Cytokines and Chemokines in ARPE-19 Cells via the MAPK and NF-κB Signaling Pathways. Int. J. Mol. Sci. 2019, 20, 2957. [Google Scholar] [CrossRef] [Green Version]
  30. Lin, R.; Piao, M.; Song, Y. Dietary Quercetin Increases Colonic Microbial Diversity and Attenuates Colitis Severity in Citrobacter rodentium-Infected Mice. Front. Microbiol. 2019, 10, 1092. [Google Scholar] [CrossRef]
  31. Hong, Z.; Piao, M. Effect of Quercetin Monoglycosides on Oxidative Stress and Gut Microbiota Diversity in Mice with Dextran Sodium Sulphate-Induced Colitis. Biomed. Res. Int. 2018, 2018, 8343052. [Google Scholar] [CrossRef] [PubMed]
  32. Chen, Z.; Yuan, Q.; Xu, G.; Chen, H.; Lei, H.; Su, J. Effects of Quercetin on Proliferation and H2O2-Induced Apoptosis of Intestinal Porcine Enterocyte Cells. Molecules 2018, 23, 2012. [Google Scholar] [CrossRef] [Green Version]
  33. Junyuan, Z.; Hui, X.; Chunlan, H.; Junjie, F.; Qixiang, M.; Yingying, L.; Lihong, L.; Xingpeng, W.; Yue, Z. Quercetin protects against intestinal barrier disruption and inflammation in acute necrotizing pancreatitis through TLR4/MyD88/p38 MAPK and ERS inhibition. Pancreatology 2018, 18, 742–752. [Google Scholar] [CrossRef] [PubMed]
  34. Mukherjee, S.; Joardar, N.; Sengupta, S.; Sinha Babu, S.P. Gut microbes as future therapeutics in treating inflammatory and infectious diseases: Lessons from recent findings. J. Nutr. Biochem. 2018, 61, 111–128. [Google Scholar] [CrossRef] [PubMed]
  35. Yang, Y.; Qu, C.; Liang, S.; Wang, G.; Han, H.; Chen, N.; Wang, X.; Luo, Z.; Zhong, C.; Chen, Y.; et al. Estrogen inhibits the overgrowth of Escherichia coli in the rat intestine under simulated microgravity. Mol. Med. Rep. 2018, 17, 2313–2320. [Google Scholar] [PubMed] [Green Version]
  36. Song, B.; Li, P.; Yan, S.; Liu, Y.; Gao, M.; Lv, H.; Lv, Z.; Guo, Y. Effects of Dietary Astragalus Polysaccharide Supplementation on the Th17/Treg Balance and the Gut Microbiota of Broiler Chickens Challenged With Necrotic Enteritis. Front. Immunol. 2022, 13, 781934. [Google Scholar] [CrossRef]
  37. Franco-de-Moraes, A.C.; de Almeida-Pititto, B.; da Rocha Fernandes, G.; Gomes, E.P.; da Costa Pereira, A.; Ferreira, S.R.G. Worse inflammatory profile in omnivores than in vegetarians associates with the gut microbiota composition. Diabetol. Metab. Syndr. 2017, 9, 62. [Google Scholar] [CrossRef] [Green Version]
  38. Liu, S.; Zhu, X.; Qiu, Y.; Wang, L.; Shang, X.; Gao, K.; Yang, X.; Jiang, Z. Effect of Niacin on Growth Performance, Intestinal Morphology, Mucosal Immunity and Microbiota Composition in Weaned Piglets. Animals 2021, 11, 2186. [Google Scholar] [CrossRef]
  39. Nimal Christhudas, I.V.S.; Praveen Kumar, P.; Agastian, P. In vitro α-glucosidase inhibition and antioxidative potential of an endophyte species (Streptomyces sp. loyola UGC) isolated from Datura stramonium L. Curr. Microbiol. 2013, 67, 69–76. [Google Scholar] [CrossRef]
  40. Karthik, L.; Kumar, G.; Bhaskara Rao, K.V. Antioxidant activity of newly discovered lineage of marine actinobacteria. Asian Pac. J. Trop. Med. 2013, 6, 325–332. [Google Scholar] [CrossRef] [Green Version]
  41. Mohammadipanah, F.; Momenilandi, M. Potential of rare actinomycetes in the production of metabolites against multiple oxidant agents. Pharm. Biol. 2018, 56, 51–59. [Google Scholar] [CrossRef] [PubMed]
  42. Gaikwad, S.; Agrawal-Rajput, R. Lipopolysaccharide from Rhodobacter sphaeroides Attenuates Microglia-Mediated Inflammation and Phagocytosis and Directs Regulatory T Cell Response. Int. J. Inflamm. 2015, 2015, 361326. [Google Scholar] [CrossRef] [PubMed] [Green Version]
  43. Wang, S.; Yao, J.; Zhou, B.; Yang, J.; Chaudry, M.T.; Wang, M.; Xiao, F.; Li, Y.; Yin, W. Bacteriostatic Effect of Quercetin as an Antibiotic Alternative In Vivo and Its Antibacterial Mechanism In Vitro. J. Food Prot. 2018, 81, 68–78. [Google Scholar] [CrossRef] [PubMed]
  44. Etxeberria, U.; Arias, N.; Boqué, N.; Macarulla, M.T.; Portillo, M.P.; Martínez, J.A.; Milagro, F.I. Reshaping faecal gut microbiota composition by the intake of trans-resveratrol and quercetin in high-fat sucrose diet-fed rats. J. Nutr. Biochem. 2015, 26, 651–660. [Google Scholar] [CrossRef]
  45. Blaxter, M.; Mann, J.; Chapman, T.; Thomas, F.; Whitton, C.; Floyd, R.; Abebe, E. Defining operational taxonomic units using DNA barcode data. Philos. Trans. R. Soc. Lond. B Biol. Sci. 2005, 360, 1935–1943. [Google Scholar] [CrossRef]
  46. DeSantis, T.Z.; Hugenholtz, P.; Larsen, N.; Rojas, M.; Brodie, E.L.; Keller, K.; Huber, T.; Dalevi, D.; Hu, P.; Andersen, G.L. Greengenes, a chimera-checked 16S rRNA gene database and workbench compatible with ARB. Appl. Environ. Microbiol. 2006, 72, 5069–5072. [Google Scholar] [CrossRef] [Green Version]
  47. Bokulich, N.A.; Subramanian, S.; Faith, J.J.; Gevers, D.; Gordon, J.I.; Knight, R.; Mills, D.A.; Caporaso, J.G. Quality-filtering vastly improves diversity estimates from Illumina amplicon sequencing. Nat. Methods 2013, 10, 57–59. [Google Scholar] [CrossRef]
  48. Lozupone, C.; Knight, R. UniFrac: A new phylogenetic method for comparing microbial communities. Appl. Environ. Microbiol. 2005, 71, 8228–8235. [Google Scholar] [CrossRef] [Green Version]
  49. Lozupone, C.A.; Hamady, M.; Kelley, S.T.; Knight, R. Quantitative and qualitative beta diversity measures lead to different insights into factors that structure microbial communities. Appl. Environ. Microbiol. 2007, 73, 1576–1585. [Google Scholar] [CrossRef] [Green Version]
Figure 1. The mRNA levels of inflammatory cytokines and toll-like receptor (TLR)-4 in jejunum. Tumor necrosis factor (TNF)-α (A), interleukin (IL)-1β (B), IL-6 (C), IL-8 (D), interferon (IFN)-γ (E) and TLR-4 (F) mRNA expressions are determined using RT-PCR. Values in bar graphs are means ± standard error of the mean (SEM) of at least 3 independent experiments performed. Data are analyzed using one-way analysis of variance (ANOVA) accompanied by Tukey’s post-hoc test. ** p < 0.01 vs. CTR and ## p < 0.01 or # p < 0.05 vs. L. CTR (control group), L (LPS group) and LQ (quercetin group).
Molecules 27 03269 g001
Figure 2. Protein content of inflammatory cytokines and toll-like receptor (TLR)-4 in jejunum. Tumor necrosis factor (TNF)-α (A), interleukin (IL)-1β (B), IL-6 (C), IL-8 (D), interferon (IFN)-γ (E) and TLR-4 (F) are determined using ELISA. Values in bar graphs are means ± standard error of the mean (SEM) of at least 3 independent experiments performed. Data are analyzed using one-way analysis of variance (ANOVA) accompanied by Tukey’s post-hoc test. ** p < 0.01 vs. CTR and ## p < 0.01 or # p < 0.05 vs. L. CTR (control group), L (LPS group) and LQ (quercetin group).
Molecules 27 03269 g002
Figure 3. Effects of dietary quercetin on expression of apoptosis-related genes, tight junction protein genes and DAO in broiler chicken jejuna. The relative mRNA expression levels of apoptosis-related genes, including Caspase-3 (A), Bcl-2 (B) and Bax (C) are detected and analyzed (n = 3). The relative mRNA expression levels of tight junction-related genes, including zona occludens-1 (ZO-1) (D) and Occludin (E) are detected and analyzed (n = 3). The diamine oxidase activity (DAO) (F) level is detected and analyzed (n = 3). Data are analyzed using one-way ANOVA accompanied by Tukey’s post-hoc test. ** p < 0.01 or * p < 0.05 vs. CTR and ## p < 0.01 or # p < 0.05 vs. L. CTR. CTR (control group), L (LPS group) and LQ (quercetin group).
Molecules 27 03269 g003
Figure 4. Total operational taxonomic unit (OTU) analyses. Each circle represents a group; the green is the CTR group, the pink is the L group, and the blue is the LQ group. The overlapping areas between circles indicate the number of shared OTUs between groups, and the number of shared or unique OTUs of groups contained within each block. CTR (control group), L (LPS group) and LQ (quercetin group).
Molecules 27 03269 g004
Figure 5. Similar analyses of microbial community. (A) Partial least squares discriminant analysis (PLS-DA) diagram. Each point represents a sample; the points with the same color belong to the same group, and the points of the same group are marked by ellipses. Nonmetric multidimensional Scaling (NMDS) analyses are based on the UniFrac distance. The UniFrac results are divided into unweighted Unifmc (B) and weighted UniFrac (C). Each point represents a sample, and the points with different colors belong to different groups. CTR (control group), L (LPS group) and LQ (quercetin group).
Molecules 27 03269 g005
Figure 6. Phylum level community composition and abundance distribution map. The horizontal coordinate is arranged according to the sample name, and each bar graph represents a sample. Colors are used to distinguish each taxon. The vertical coordinates represent the relative abundance of each taxon. In these samples, the longer the column, the higher relative abundance of the taxon. CTR (control group), L (LPS group) and LQ (quercetin group).
Molecules 27 03269 g006
Figure 7. Classifications of bacteria show significant differences at the phylum level. The border of boxplot represents the upper and lower quartile spacing, the horizontal line represents the median value and the upper and lower whisker represents 1.5 times the IQR range outside the upper and lower quartile, respectively. The symbol • indicates the extreme value beyond the range. a, b indicate significant differences at p < 0.05; A, B indicate significant differences at p < 0.01. The same letters indicate no significant differences. CTR (control group), L (LPS group) and LQ (quercetin group).
Molecules 27 03269 g007
Figure 8. Genus-level community composition and abundance distribution map. The horizontal coordinate is arranged according to the sample name, each bar graph represents a sample and colors are used to distinguish each taxon. The vertical coordinate represents the relative abundance of each taxon. In these samples, the longer the column, the higher the relative abundance of the taxon. CTR (control group), L (LPS group) and LQ (quercetin group).
Molecules 27 03269 g008
Figure 9. Classifications of bacteria show significant differences at the genus level. The border of the boxplot represents the upper and lower quartile spacing, the horizontal line represents the median value and the upper and lower whisker represents 1.5 times the IQR range outside the upper and lower quartile, respectively. The symbol • indicates the extreme value beyond the range. a, b indicate significant differences at p < 0.05; A, B and C indicate significant differences at p < 0.01. The same letters indicate no significant differences. CTR (control group), L (LPS group) and LQ (quercetin group).
Molecules 27 03269 g009
Table 1. The alpha-diversity indexes of data distribution.
Group *ChaolSTDSimpsonSTDShannonSTD
MeanMeanMean
L1187.048199.87160.9504650.0269156.390.682486
LQ1287.091181.80620.9671440.0100347.20.229627
CTR1098.337188.44530.9301070.0626016.260.773747
* L (LPS group), LQ (quercetin group), and CTR (control group).
Table 2. Formulation and nutrient compositions of basal diet.
Ingredient (%)1–21 DaysNutritional Index (g/kg) 1–21 Days
Corn58.63Crude protein21
Soybean meal32.07Metabolism energy (MJ/kg)3050
Soybean oil3.53Moisture12.38
Corn gluten meal2Dry matter87.62
Limestone powder1.17Crude fat6.1
DL-methionine (98%)0.23Crude fiber3.17
Lysine (98%)0.38Crude ash5.55
L-threonine0.05Calcium0.9
Choline chloride0.1Total phosphorus0.64
Calcium hydrogen phosphate1.03Available phosphorus0.41
Sodium chloride0.33Sodium0.15
Broiler chickens vitamins *0.2Chlorine0.23
Broiler chickens trace elements †0.15Total lysine1.35
Complex enzyme0.02Total methionine0.55
Phytase (10,000 units)0.01Total sulfur-containing amino acid0.88
L-tryptophan (20%)0.1Total threonine0.83
Total100Total tryptophan0.25
* Vitamin for broiler chickens provided per kg of diet: VA, 10,000 IU; VB1, 2 mg; VB2, 7 mg; VB6, 4 mg; VB12, 0.02 mg; VD, 4000 IU; VE, 25 mg; VK, 2 mg; biotin, 0.1 mg; folic acid, 1.2 mg; niacinamide, 40 mg; calcium pantothenate, 10 mg. † Fe (from ferrous sulfate), 100 mg; Mn (from manganese sulfate), 100 mg; Zn (from zinc oxide), 65 mg; Cu (from copper sulfate), 10 mg; Se (from sodium selenite), 0.3 mg; I (from calcium iodate), 0.7 mg.
Table 3. Information on primers of real-time quantitative PCR.
GenesPrimer Sequence (5′–3′)Genebank No.Size (bp)
TNF-αF: TGGGAAGGGAATGAACCCTCNM_204267.1118
R: AACTGGGCGGTCATAGAACA
IL-1βF: AGCAGCCTCAGCGAAGAGACCNM_204524.190
R: GTCCACTGTGGTGTGCTCAGAATC
IL-6F: TTCACCGTGTGCGAGAACAGCNM_204628.180
R: CAGCCGTCCTCCTCCGTCAC
IL-8F: AGGATGGAAGAGAGGTGTGCNM_205498.180
R: CTGAGCCTTGGCCATAAGTG
TLR4F: AGGCACCTGAGCTTTTCCTCNM_001030693.196
R: TACCAACGTGAGGTTGAGCC
IFN-γF: CACTGACAAGTCAAAGCCGC NM_205149.187
R: ACCTTCTTCACGCCATCAGG
BCL-2F: GAGTTCGGCGGCGTGATGTG NM_205339.292
R: TTCAGGTACTCGGTCATCCAGGTG
BAXF: TCCATTCAGGTTCTCTTGACCXM_001235092.4119
R: GCCAAACATCCAAACACAGA
Caspase-3F: TACCGGACTGTCATCTCGTTCAGGXM_015276122.2166
R: ACTGCTTCGCTTGCTGTGATCTTC
ZO-1F: ACACTGTGACCCCAAAACCTXM_015278981.281
R: ACTGAGACACAGTTTGCTCCA
OccludinF: CATCGCCTCCATCGTCTACANM_205128.1117
R: TTGAGGTAGGTGCTGCCGTA
β-actinF: GTGCTATGTTGCTCTAGACTTCGNM_007393.5174
R: ATGCCACAGGATTCCATACC
Publisher’s Note: MDPI stays neutral with regard to jurisdictional claims in published maps and institutional affiliations.

