
The First Step in Standardizing an Artificial Aging Protocol for Dental Composites—Evaluation of Basic Protocols

 , , , ,
Abstract
:
1. Introduction
2. Results
3. Discussion
4. Materials and Methods
4.1. Aging Protocols
4.2. Methods
4.2.1. Flexural Strength
4.2.2. Diametral Tensile Strength
4.2.3. Hardness
4.2.4. Water Sorption and Solubility
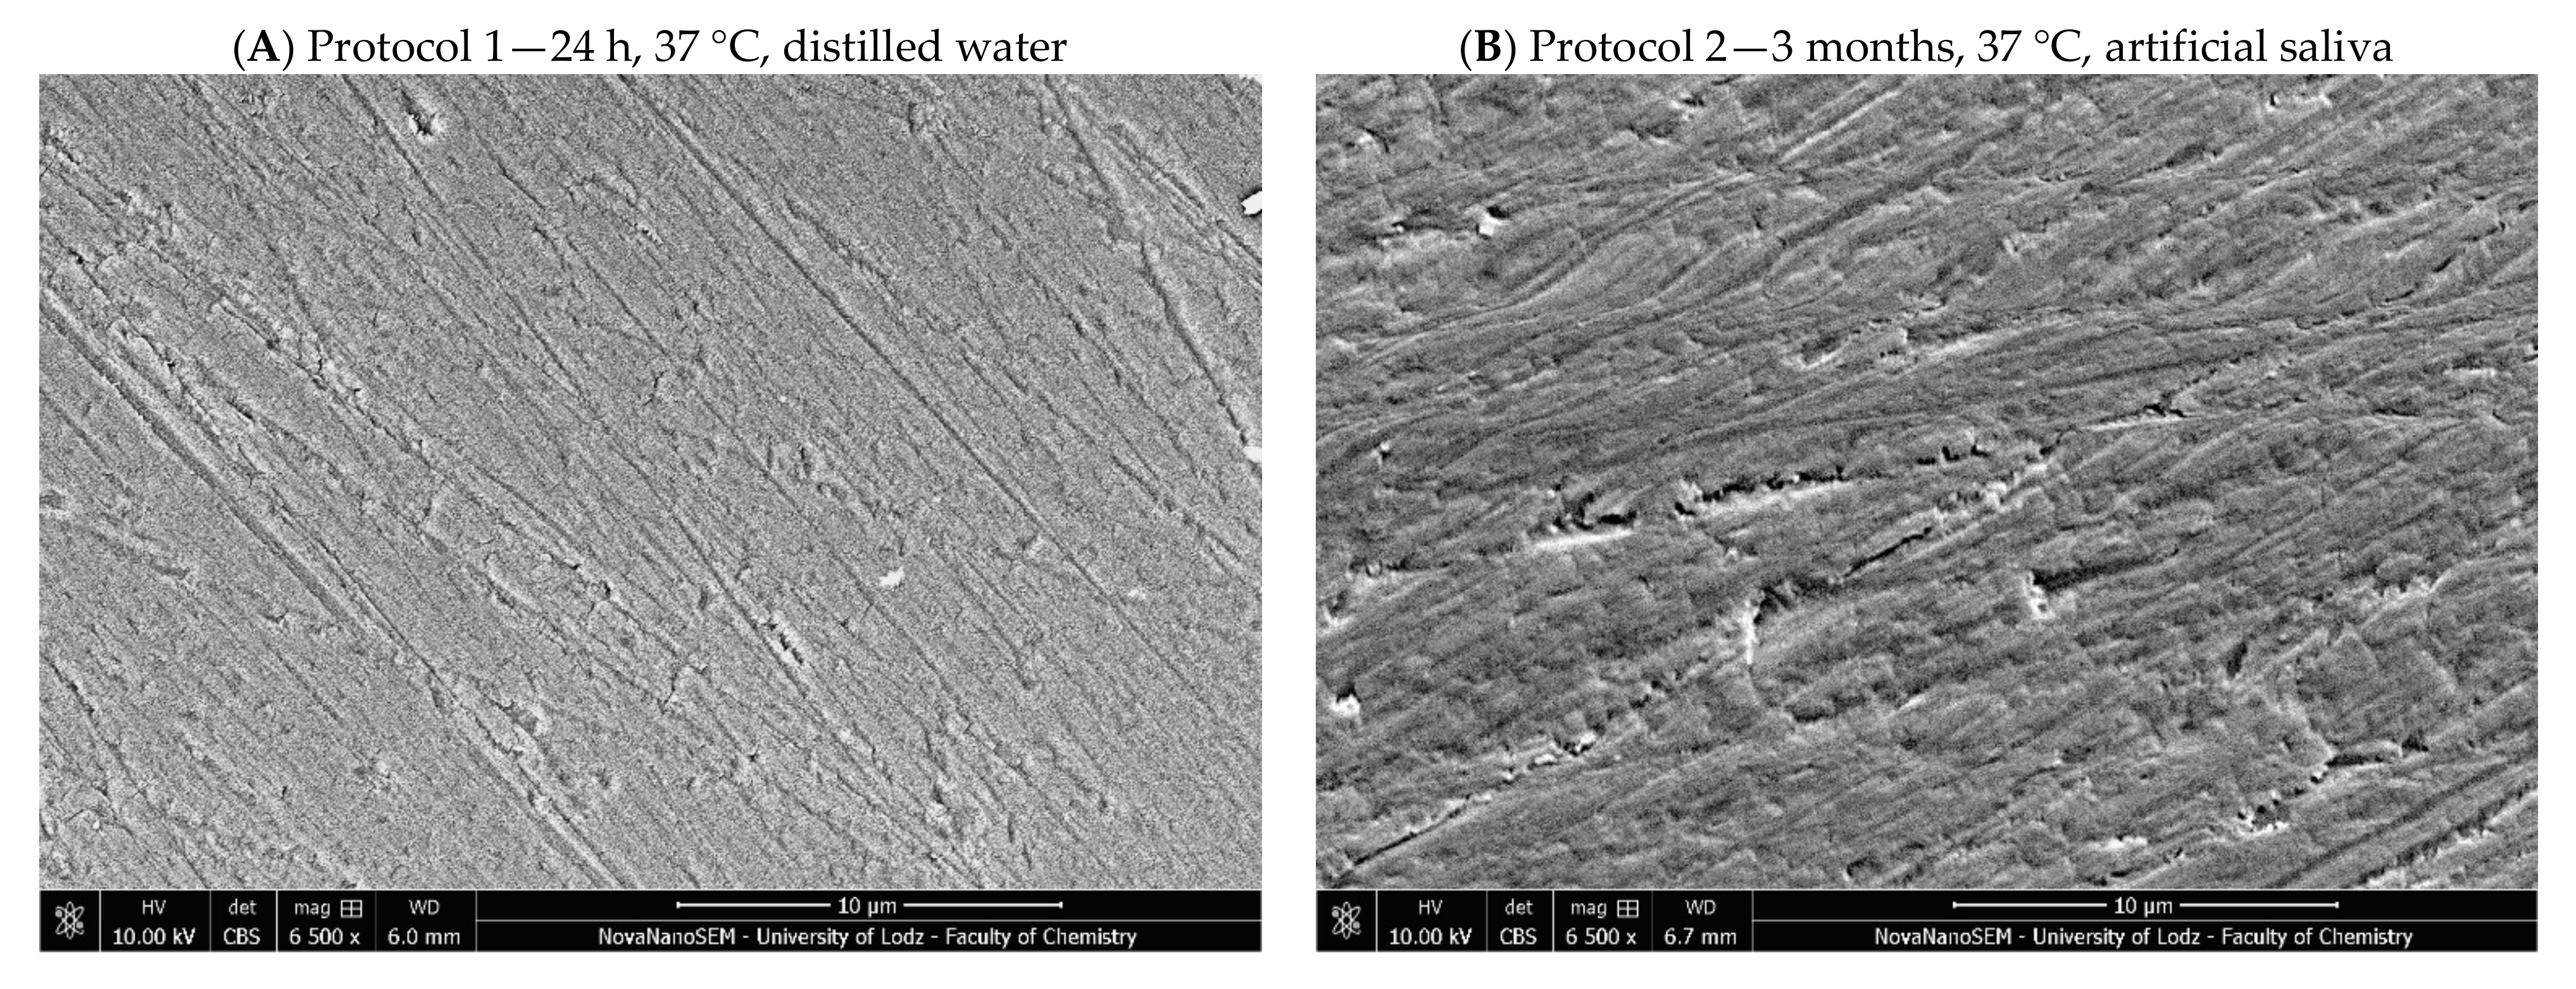
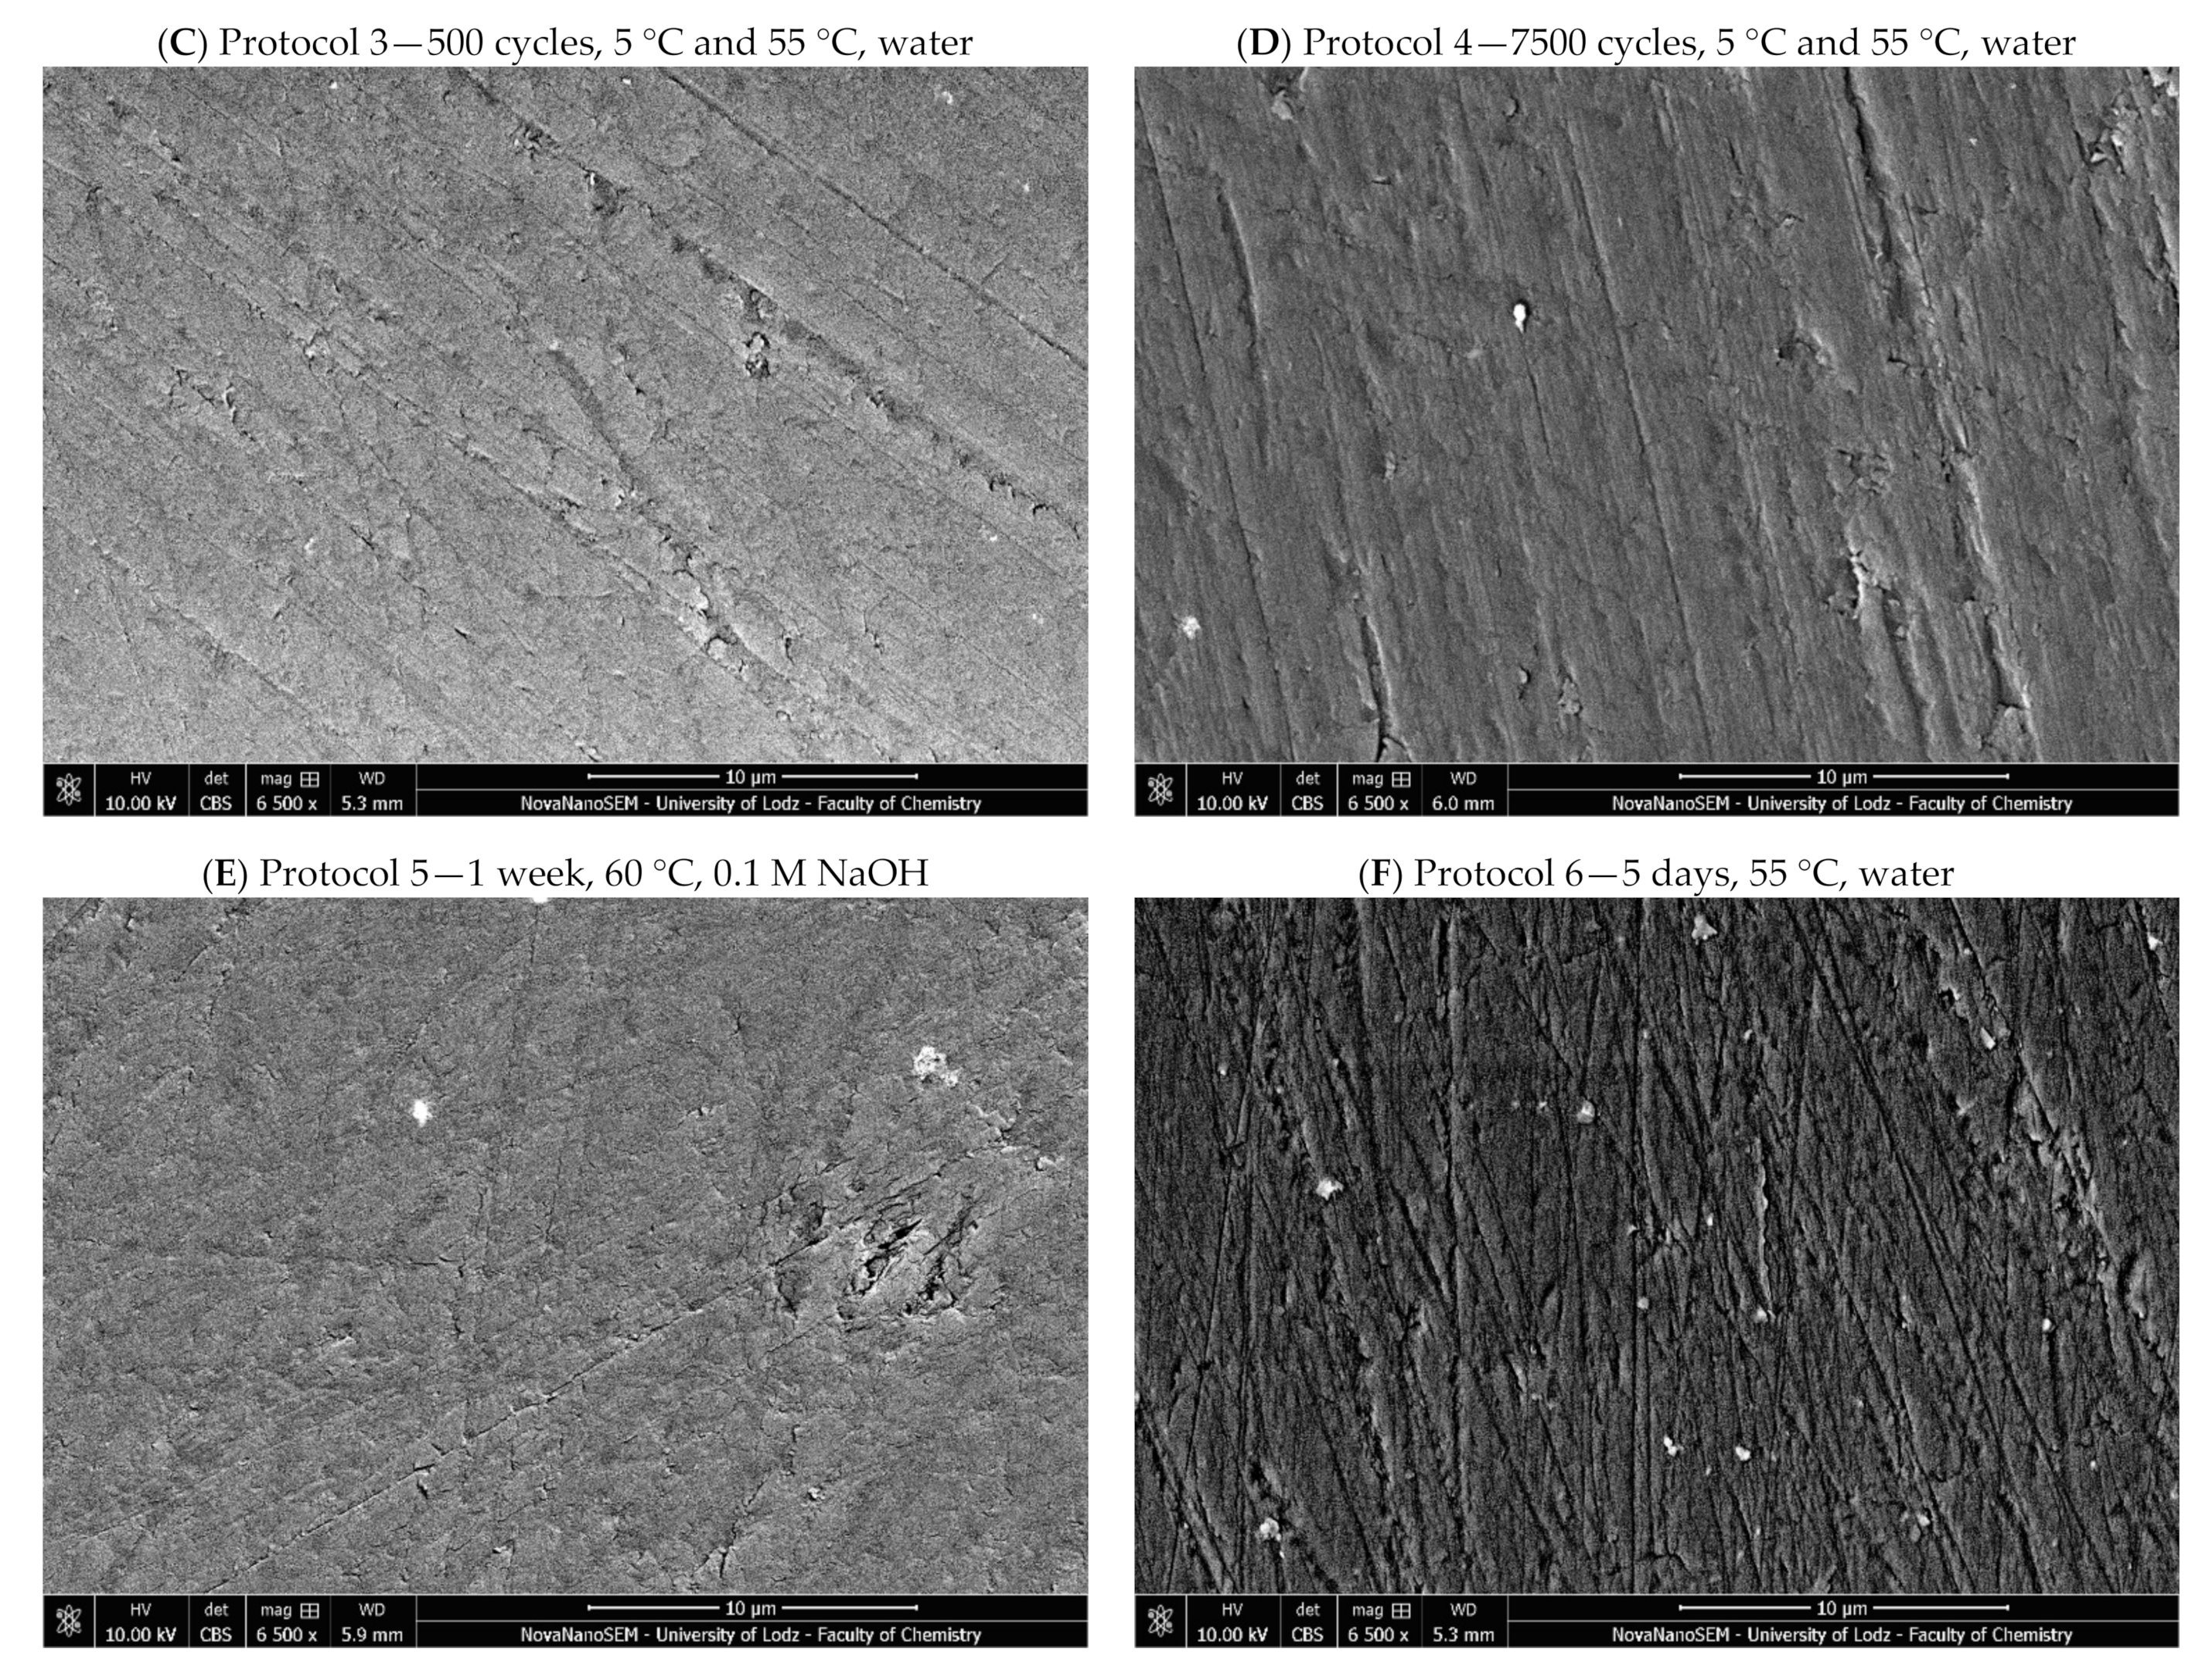
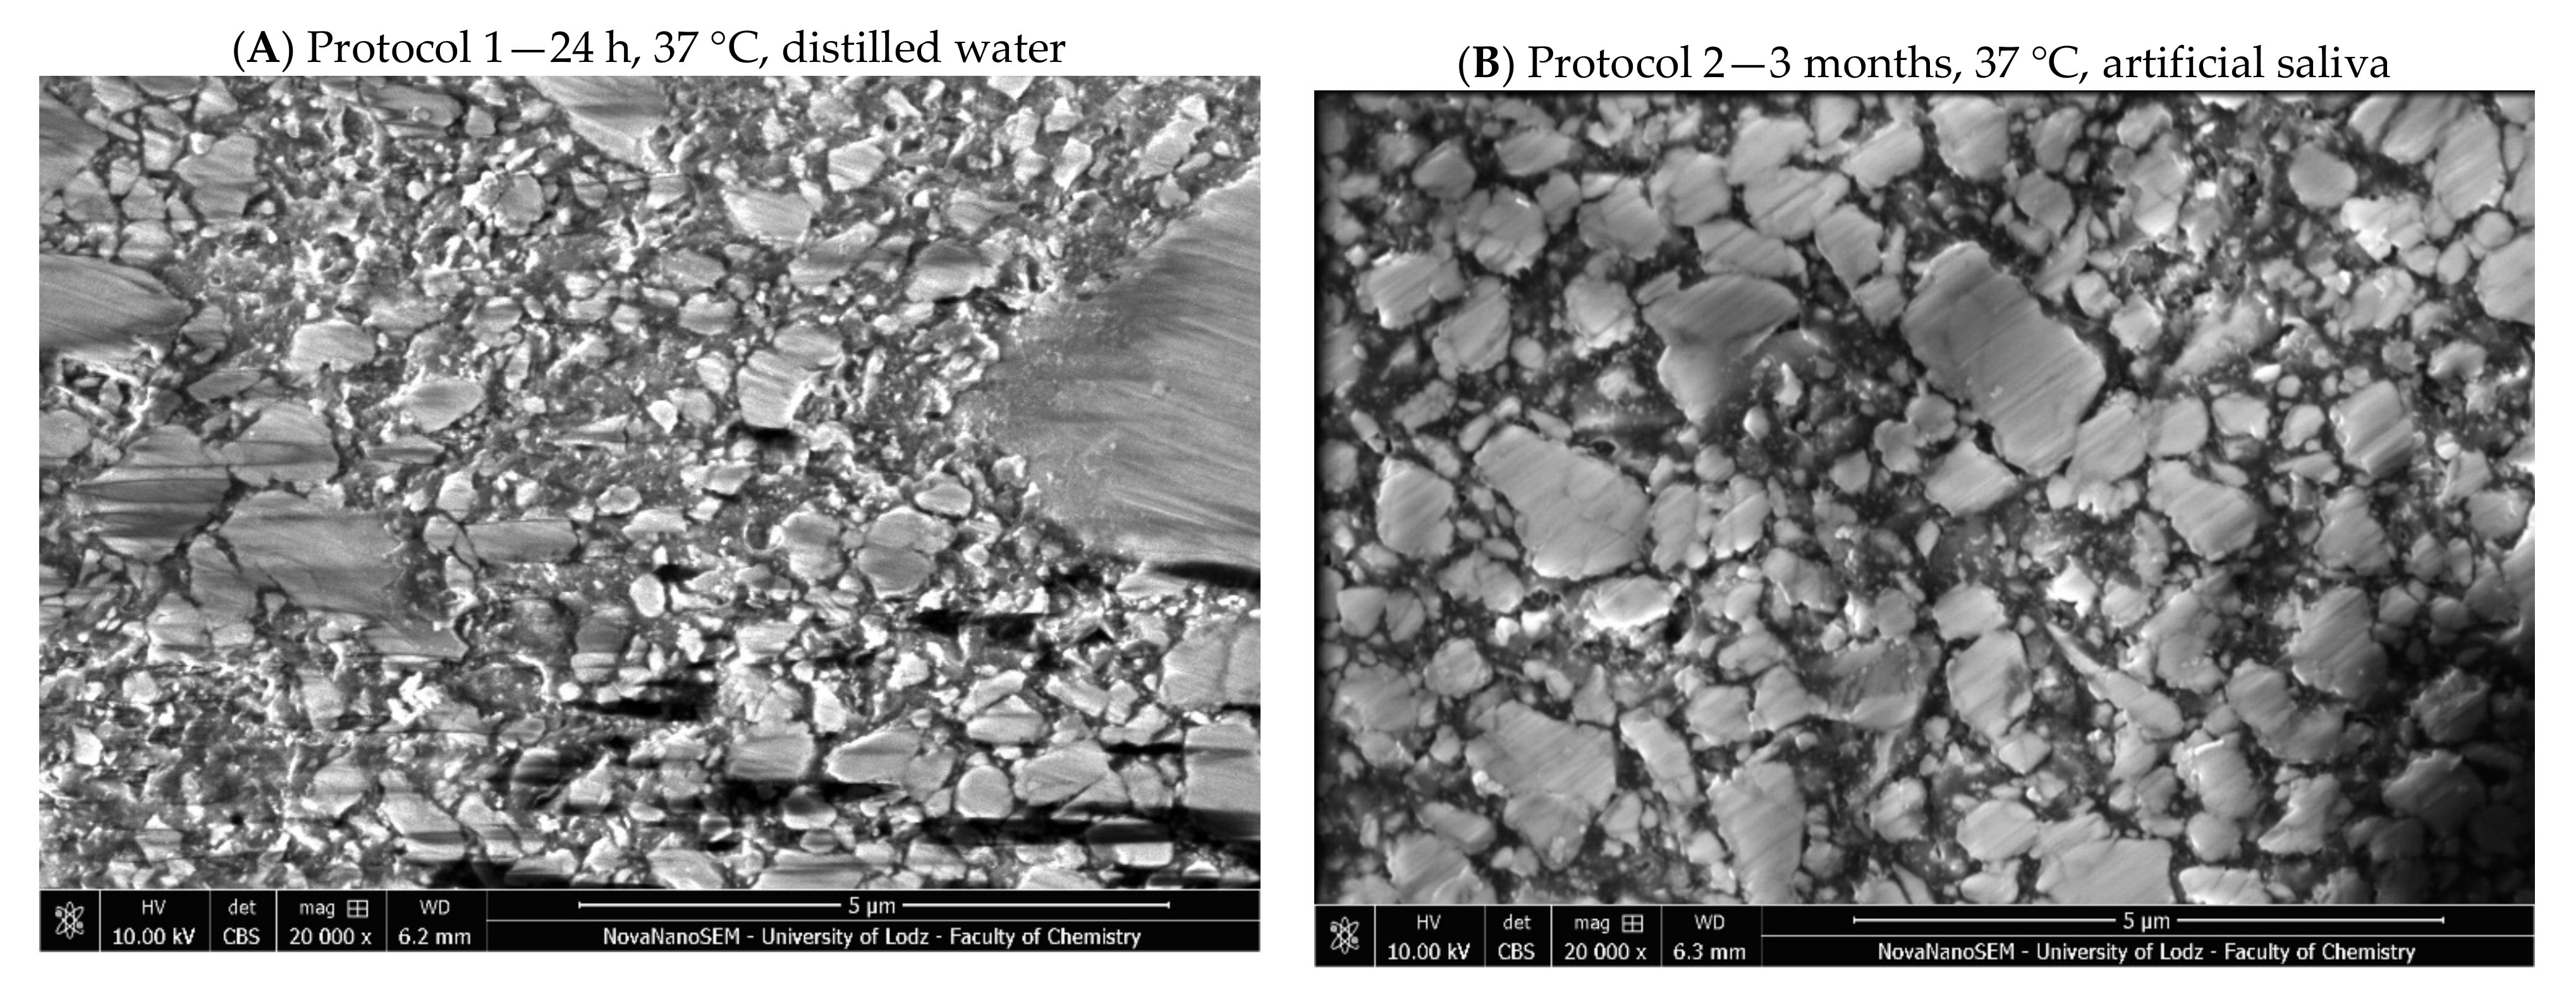
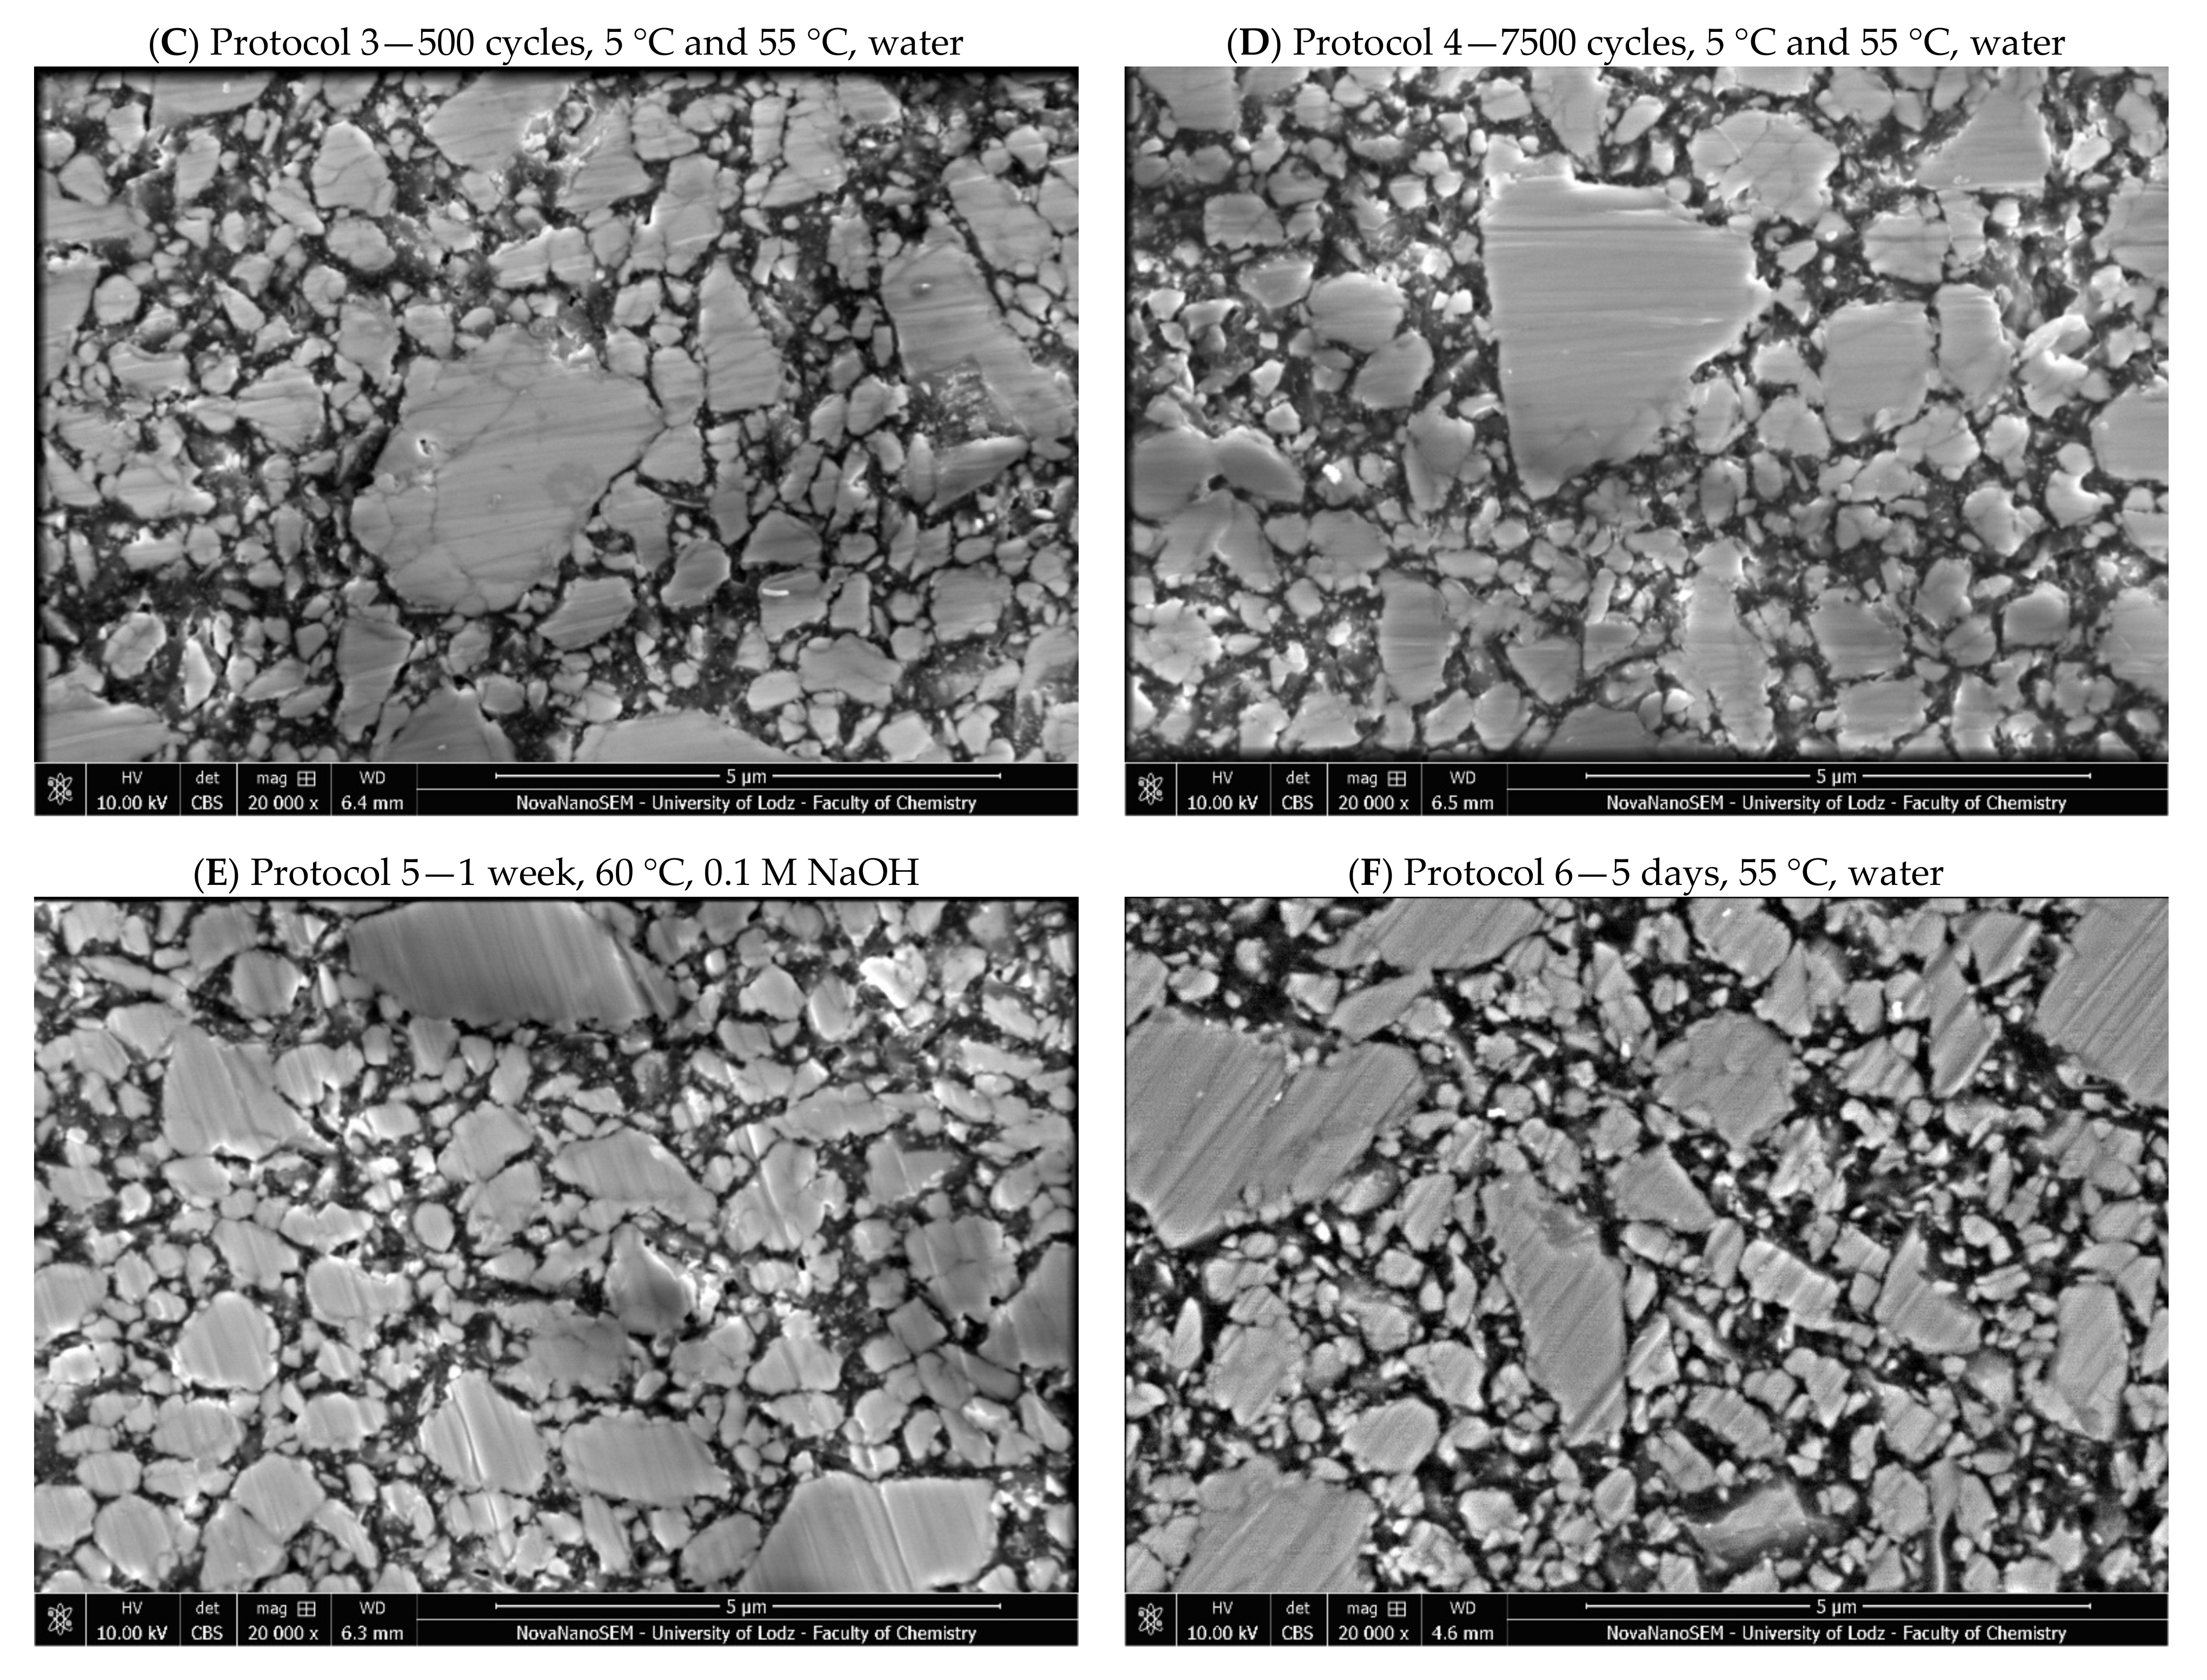
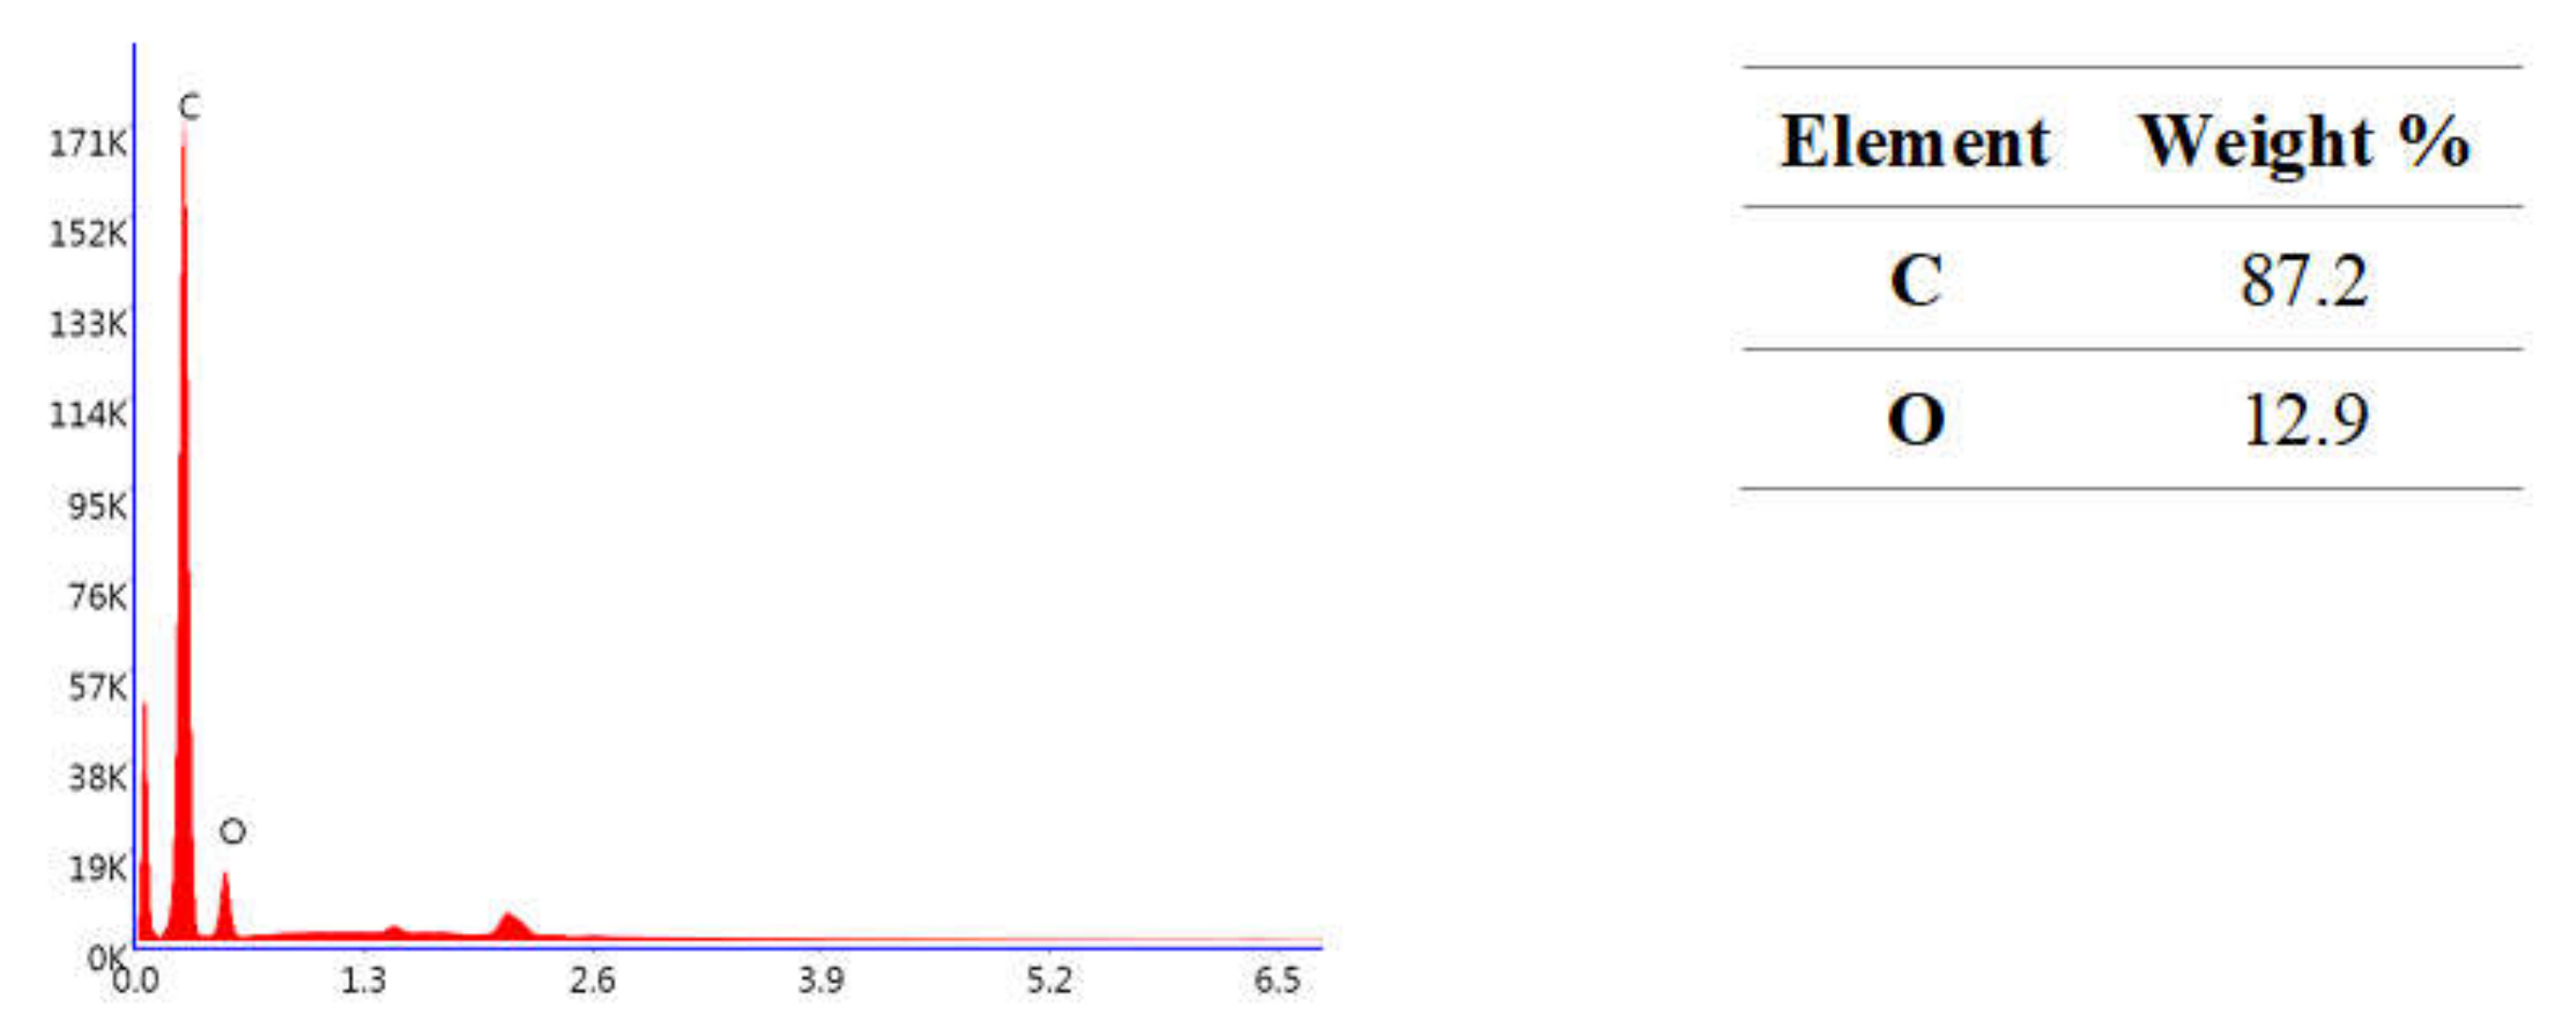
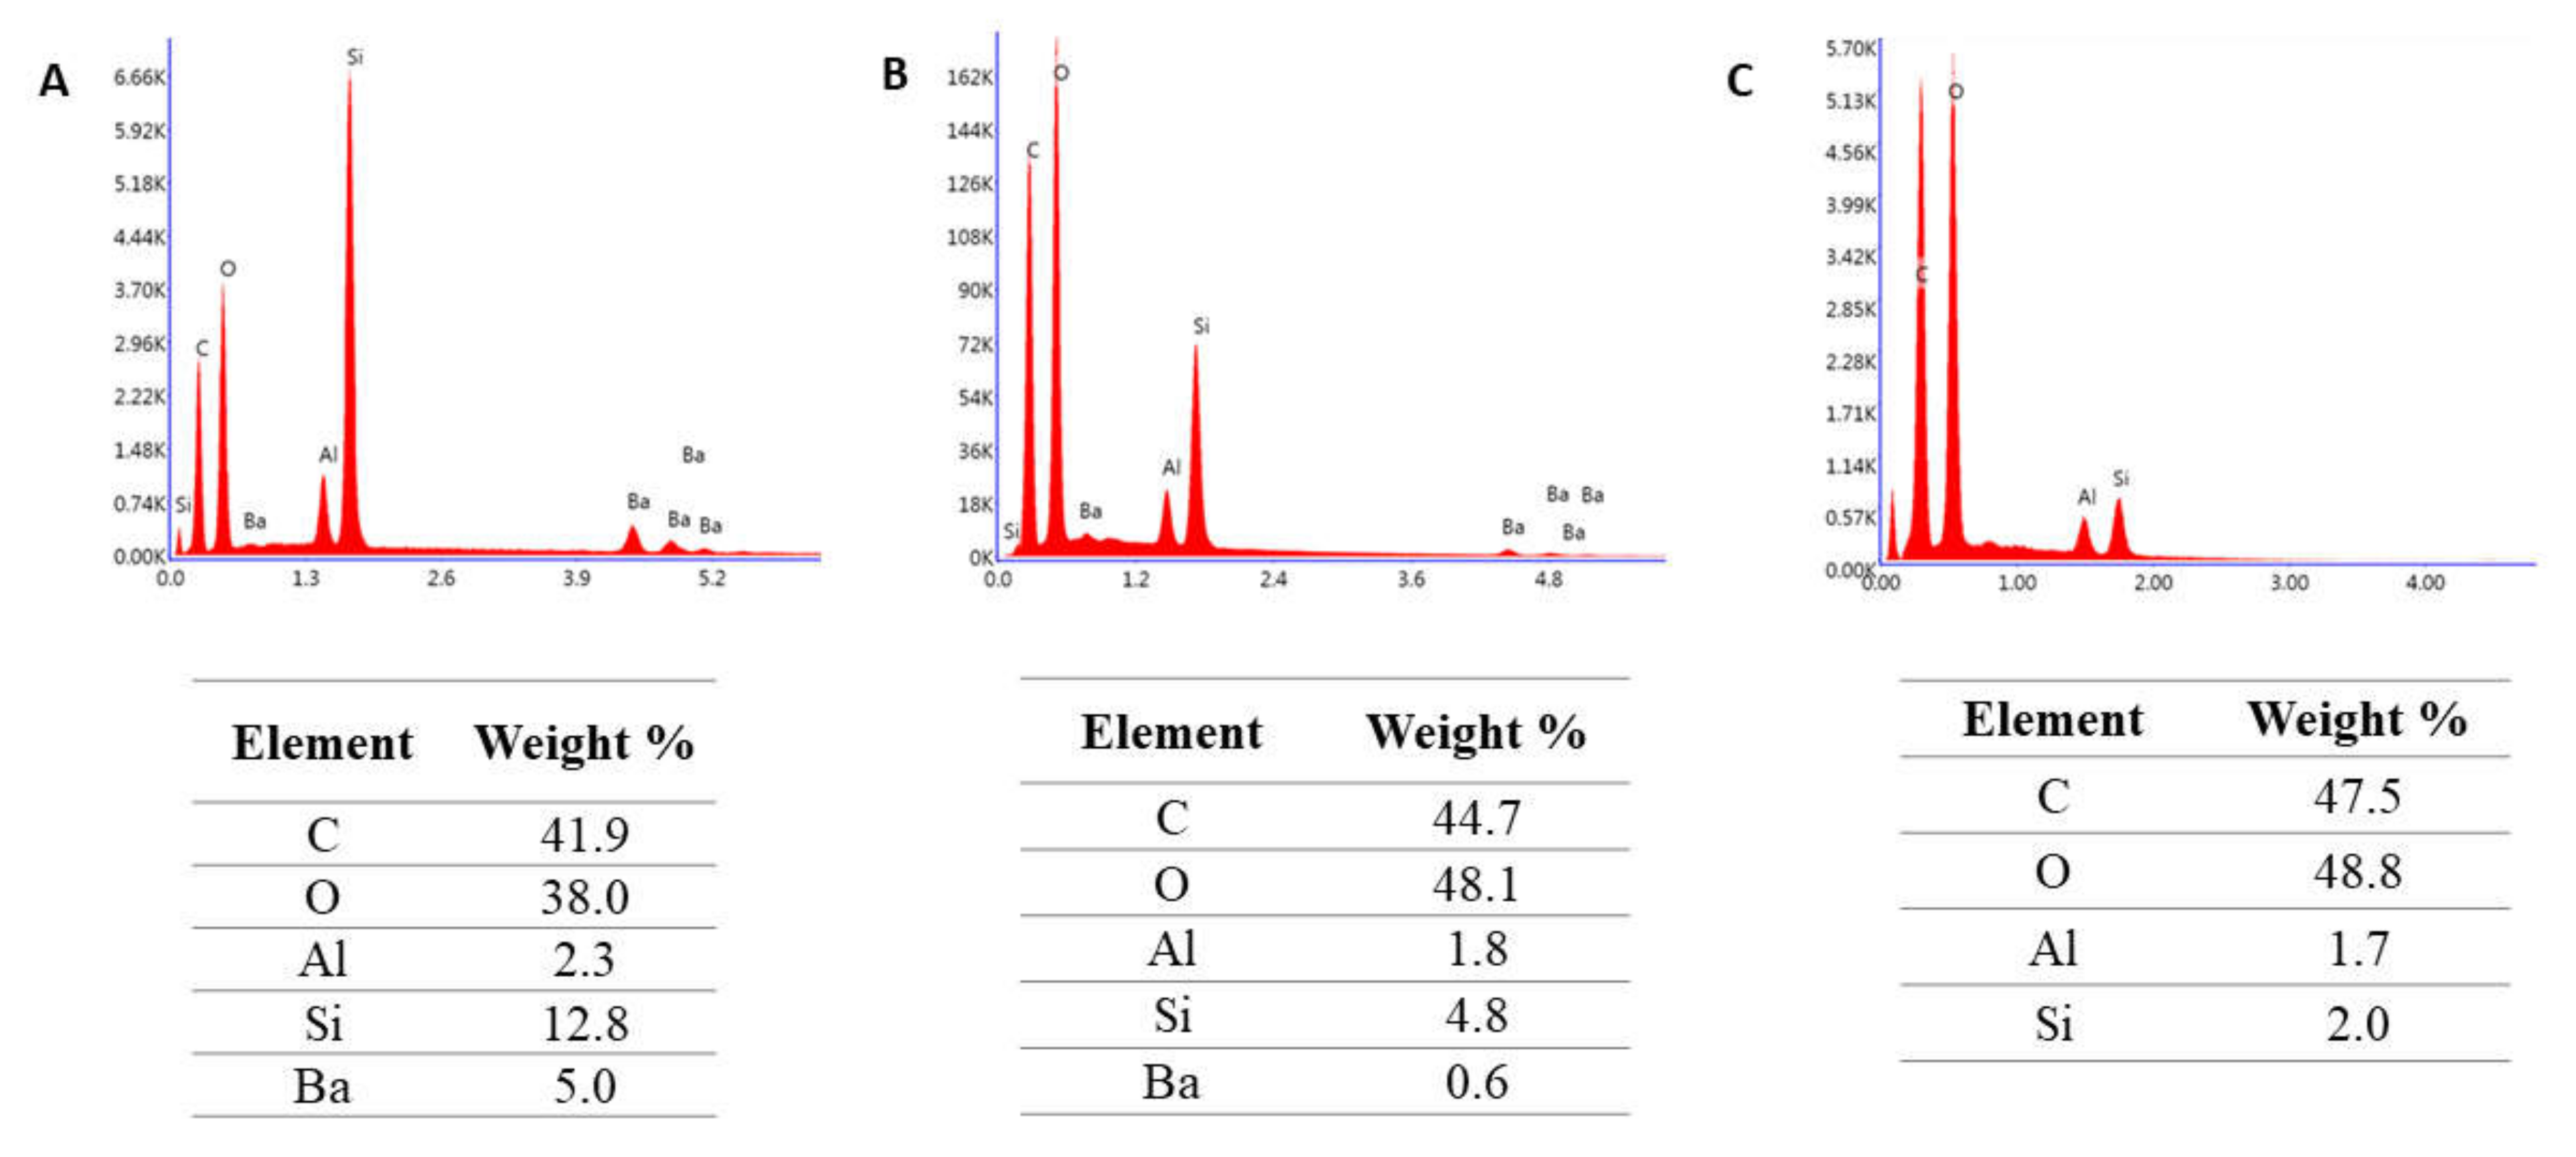
4.2.5. Microstructure Evaluation Based on Scanning Electron Microscopy
4.2.6. Statistical Analysis
5. Conclusions
- Each aging protocol has some influence on the tested properties of Resin F, Flow-Art and Arkon;
- The mechanical properties of neat resin (Resin F) were more susceptible to aging protocols than the filled materials (Flow-Art, Arkon);
- The most aggressive aging protocol was Protocol 5 (0.1 M NaOH, 7 days, 60 °C);
- Protocol 4 (7500 thermocycles, 5/55 °C) was more aggressive than Protocol 3 (500 thermocycles, 5/55 °C) and it had a greater influence on materials with higher filler content (Arkon);
- When designing studies on dental materials, there is a need for accurate selection of the thermal and chemical factors acting during artificial aging.
Author Contributions
Funding
Institutional Review Board Statement
Informed Consent Statement
Data Availability Statement
Acknowledgments
Conflicts of Interest
Appendix A


References
- Iftikhar, S.; Jahanzeb, N.; Saleem, M.; ur Rehman, S.; Matinlinna, J.P.; Khan, A.S. The trends of dental biomaterials research and future directions: A mapping review. Saudi Dent. J. 2021, 33, 229–238. [Google Scholar] [CrossRef] [PubMed]
- Yadav, R.; Kumar, M. Dental restorative composite materials: A review. J. Oral Biosci. 2019, 61, 78–83. [Google Scholar] [CrossRef] [PubMed]
- Ferracane, J.L. Hygroscopic and hydrolytic effects in dental polymer networks. Dent. Mater. 2006, 22, 211–222. [Google Scholar] [CrossRef] [PubMed]
- Zhang, N.; Ma, Y.; Weir, M.D.; Xu, H.H.K.; Bai, Y.; Melo, M.A.S. Current insights into the modulation of oral bacterial degradation of dental polymeric restorative materials. Materials 2017, 10, 507. [Google Scholar] [CrossRef] [Green Version]
- Moore, R.J.; Watts, J.T.F.; Hood, J.A.A.; Burritt, D.J. Intra-oral temperature variation over 24 h. Eur. J. Orthod. 1999, 21, 249–261. [Google Scholar] [CrossRef] [Green Version]
- Flanagan, D. Bite force and dental implant treatment: A short review. Med. Devices Evid. Res. 2017, 10, 141–148. [Google Scholar] [CrossRef] [PubMed] [Green Version]
- Delaviz, Y.; Finer, Y.; Santerre, J.P. Biodegradation of resin composites and adhesives by oral bacteria and saliva: A rationale for new material designs that consider the clinical environment and treatment challenges. Dent. Mater. 2014, 30, 16–32. [Google Scholar] [CrossRef]
- Sarkar, N.K. Internal corrosion in dental composite wear: Its Significance and Simulation. J. Biomed. Mater. Res. 2000, 53, 371–380. [Google Scholar] [CrossRef]
- Bayne, S.C. Correlation of clinical performance with “in vitro tests” of restorative dental materials that use polymer-based matrices. Dent. Mater. 2012, 28, 52–71. [Google Scholar] [CrossRef]
- Fonseca, A.S.Q.D.S.; Pereira, G.D.D.S.; Schneider, L.F.J.; Gerhardt, K.M.D.F.; Sinhoreti, M. Do new matrix formulations improve resin composite resistance to degradation processes? Braz. Oral Res. 2017, 27, 410–416. [Google Scholar] [CrossRef] [Green Version]
- Yap, A.U.J.; Tan, S.H.L.; Wee, S.S.C.; Lee, C.W.; Lim, E.L.C.; Zeng, K.Y. Chemical degradation of composite restoratives. J. Oral Rehabil. 2001, 28, 1015–1021. [Google Scholar] [CrossRef] [PubMed]
- Lohbauer, U.; Belli, R.; Ferracane, J.L. Factors involved in mechanical fatigue degradation of dental resin composites. J. Dent. Res. 2013, 92, 584–591. [Google Scholar] [CrossRef] [PubMed] [Green Version]
- Zhou, X.; Wang, S.; Peng, X.; Hu, Y.; Ren, B.; Li, M.; Hao, L.; Feng, M.; Cheng, L.; Zhou, X. Effects of water and microbial-based aging on the performance of three dental restorative materials. J. Mech. Behav. Biomed. Mater. 2018, 80, 42–50. [Google Scholar] [CrossRef] [PubMed]
- Cilli, R.; Pereira, J.C.; Prakki, A. Properties of dental resins submitted to pH catalysed hydrolysis. J. Dent. 2012, 40, 1144–1150. [Google Scholar] [CrossRef] [PubMed]
- Szczesio-Wlodarczyk, A.; Sokolowski, J.; Kleczewska, J.; Bociong, K. Ageing of dental composites based on methacrylate resins—A critical review of the causes and method of assessment. Polymers 2020, 12, 882. [Google Scholar] [CrossRef]
- Söderholm, K.-J.; Zigan, M.; Ragan, M.; Fischlschweiger, W.; Bergman, M. Hydrolytic Degradation of Dental Composites. J. Dent. Res. 1984, 63, 1248–1254. [Google Scholar] [CrossRef]
- Santerre, J.P.; Shajii, L.; Leung, B.W. Relation of dental composite formulations to their degradation and the release of hydrolyzed polymeric-resin-derived products. Crit. Rev. Oral Biol. Med. 2001, 12, 136–151. [Google Scholar] [CrossRef] [Green Version]
- Krüger, J.; Maletz, R.; Ottl, P.; Warkentin, M. In vitro aging behavior of dental composites considering the influence of filler content, storage media and incubation time. PLoS ONE 2018, 13, e0195160. [Google Scholar] [CrossRef]
- Zhang, Y.; Xu, J. Effect of immersion in various media on the sorption, solubility, elution of unreacted monomers, and flexural properties of two model dental composite compositions. J. Mater. Sci. Mater. Med. 2008, 19, 2477–2483. [Google Scholar] [CrossRef]
- Al Badr, R.M.; Hassan, H.A. Effect of immersion in different media on the mechanical properties of dental composite resins. Int. J. Appl. Dent. Sci. 2017, 3, 81–88. [Google Scholar]
- Sideridou, I.D.; Karabela, M.M.; Bikiaris, D.N. Aging studies of light cured dimethacrylate-based dental resins and a resin composite in water or ethanol/water. Dent. Mater. 2007, 23, 1142–1149. [Google Scholar] [CrossRef] [PubMed]
- Ayatollahi, M.R.; Yahya, M.Y.; Karimzadeh, A.; Nikkhooyifar, M.; Ayob, A. Effects of temperature change and beverage on mechanical and tribological properties of dental restorative composites. Mater. Sci. Eng. C 2015, 54, 69–75. [Google Scholar] [CrossRef] [PubMed]
- Prakki, A.; Cilli, R.; Lia Mondelli, R.F.; Kalachandra, S.; Pereira, J.C. Influence of pH environment on polymer based dental material properties. J. Dent. 2005, 33, 91–98. [Google Scholar] [CrossRef]
- Kawano, F.; Ohguri, T.; Ichikawa, T.; Matsumoto, N. Influence of thermal cycles in water on flexural strength of laboratory-processed composite resin. J. Oral Rehabil. 2001, 28, 703–707. [Google Scholar] [CrossRef] [PubMed]
- Morresi, A.L.; D’Amario, M.; Capogreco, M.; Gatto, R.; Marzo, G.; D’Arcangelo, C.; Monaco, A. Thermal cycling for restorative materials: Does a standardized protocol exist in laboratory testing? A literature review. J. Mech. Behav. Biomed. Mater. 2014, 29, 295–308. [Google Scholar] [CrossRef]
- Chen, S.; Öhman, C.; Jefferies, S.R.; Gray, H.; Xia, W.; Engqvist, H.; Blumer, L.; Schmidli, F.; Weiger, R.; Fischer, J.; et al. A systematic approach to standardize artificial aging of resin composite cements. Dent. Mater. 2016, 31, 855–863. [Google Scholar] [CrossRef]
- ISO 4049:2019; Dentistry—Polymer-Based Restorative Materials. International Organization for Standardization: Geneva, Switzerland, 2019; pp. 1–29.
- Ferracane, J.L. Resin composite—State of the art. Dent. Mater. 2011, 27, 29–38. [Google Scholar] [CrossRef]
- Betancourt, D.E.; Baldion, P.A.; Castellanos, J.E. Resin-dentin bonding interface: Mechanisms of degradation and strategies for stabilization of the hybrid layer. Int. J. Biomater. 2019, 2019, 5268342. [Google Scholar] [CrossRef]
- Maravic, T.; Mazzoni, A.; Comba, A.; Scotti, N.; Checchi, V.; Breschi, L. How Stable is Dentin As a Substrate for Bonding? Curr. Oral Health Rep. 2017, 4, 248–257. [Google Scholar] [CrossRef]
- Gates, T. The physical and chemical ageing of polymeric composites. In Ageing of Composites; Woodhead Publishing: Cambridge, UK, 2008; pp. 3–33. ISBN 9781845693527. [Google Scholar]
- Peutzfeldt, A. Resin composites in dentistry: The monomer systems. Eur. J. Oral Sci. 1997, 105, 97–116. [Google Scholar] [CrossRef]
- Masaro, L.; Zhu, X.X. Physical Models of Diffusion for Polymer Solutions, Gels and Solids. Prog. Polym. Sci. 1999, 24, 731–775. [Google Scholar] [CrossRef]
- Venz, S.; Dickens, B. NIR-spectroscopic investigation of water sorption characteristics of dental resins and composites. J. Biomed. Mater. Res. 1991, 25, 1231–1248. [Google Scholar] [CrossRef] [PubMed]
- Gajewski, V.E.S.; Pfeifer, C.S.; Fróes-Salgado, N.R.G.; Boaro, L.C.C.; Braga, R.R. Monomers used in resin composites: Degree of conversion, mechanical properties and water sorption/solubility. Braz. Dent. J. 2012, 23, 508–514. [Google Scholar] [CrossRef] [PubMed]
- Pieniak, D.; Niewczas, A.; Walczak, A.; Łępicka, M.; Grądzka-Dahlke, M.; Maciejewski, R.; Kordos, P. The effect of thermal stresses on the functional properties of various dental composites. Tribol. Int. 2020, 152, 106509. [Google Scholar] [CrossRef]
- Barszczewska-Rybarek, I.M. A guide through the dental dimethacrylate polymer network structural characterization and interpretation of physico-mechanical properties. Materials 2019, 12, 4057. [Google Scholar] [CrossRef] [Green Version]
- Karmaker, A.; Prasad, A.; Sarkar, N.K. Characterization of adsorbed silane on fillers used in dental composite restoratives and its effect on composite properties. J. Mater. Sci. Mater. Med. 2007, 18, 1157–1162. [Google Scholar] [CrossRef]
- Kuwahata, H.; Seki, H.; Fujii, K.; Inoue, K. Deterioration of Mechanical Properties of Composite Resins. Dent. Mater. J. 1995, 14, 78–83. [Google Scholar]
- Antonucci, J.M.; Dickens, S.H.; Fowler, B.O.; Xu, H.H.K.; McDonough, W.G. Chemistry of Silanes: Interfaces in Dental Polymers and Composites. J. Res. Natl. Inst. Stand. Technol. 2005, 110, 541–558. [Google Scholar] [CrossRef]
- Ortengren, U.; Wellendorf, H.; Karlsson, S.; Ruyter, I.E.E.; Örtengren, U.; Wellendorf, H.; Karlsson, S.; Ruyter, I.E.E. Water sorption and solubility of dental compositesand identication of monomers released in an aqueousenvironment. J. Oral Rehabil. 2001, 2, 1106–1115. [Google Scholar] [CrossRef]
- Ghavami-Lahiji, M.; Firouzmanesh, M.; Bagheri, H.; Jafarzadeh Kashi, T.S.; Razazpour, F.; Behroozibakhsh, M. The effect of thermocycling on the degree of conversion and mechanical properties of a microhybrid dental resin composite. Restor. Dent. Endod. 2018, 43, e26. [Google Scholar] [CrossRef]
- Moazzami, S.; Sadid Zadeh, R.; Kianoush, K.; Sarmad, M.; Barani Karbaski, F.; Amiri Daluyi, R.; Kazemi, R. Chemical Stability of Bioglass in Simulated Oral Environment. J. Dent. Biomater. 2016, 3, 261–268. [Google Scholar]
- Söderholm, K.M. Filler leachability during water storage of six composite materials. Eur. J. Oral Sci. 1990, 98, 82–88. [Google Scholar] [CrossRef] [PubMed]
- Gregson, K.; Beiswanger, A.J.; Platt, J. The impact of sorption, buffering, and proteins on leaching of organic and inorganic substances from dental resin core materials. J. Biomed. Mater. Res. Part A 2008, 84, 256–264. [Google Scholar] [CrossRef] [PubMed]
- Ferracane, J.L. Current trends in dental composites. Crit. Rev. Oral Biol. Med. 1995, 6, 302–318. [Google Scholar] [CrossRef] [Green Version]
- Drummond, J.L.; Andronova, K.; Al-Turki, L.I.; Slaughter, L.D. Leaching and mechanical properties characterization of dental composites. J. Biomed. Mater. Res.—Part B Appl. Biomater. 2004, 71, 172–180. [Google Scholar] [CrossRef]
- Palin, W.M.; Fleming, G.J.P.; Burke, F.J.T.; Marquis, P.M.; Randall, R.C. The influence of short and medium-term water immersion on the hydrolytic stability of novel low-shrink dental composites. Dent. Mater. 2005, 21, 852–863. [Google Scholar] [CrossRef]
- Ferracane, J.L. Resin-based composite performance: Are there some things we can’t predict? Dent. Mater. 2013, 29, 51–58. [Google Scholar] [CrossRef] [Green Version]
- Arola, D. Fatigue testing of biomaterials and their interfaces. Dent. Mater. 2017, 33, 367–381. [Google Scholar] [CrossRef]
- Alshali, R.Z.; Salim, N.A.; Satterthwaite, J.D.; Silikas, N. Long-term sorption and solubility of bulk-fill and conventional resin-composites in water and artificial saliva. J. Dent. 2015, 43, 1511–1518. [Google Scholar] [CrossRef]
- Gale, M.S.; Darvell, B.W. Thermal cycling procedures for laboratory testing of dental restorations. J. Dent. 1999, 27, 89–99. [Google Scholar] [CrossRef]
- Bociong, K.; Szczesio, A.; Sokolowski, K.; Domarecka, M.; Sokolowski, J.; Krasowski, M.; Lukomska-Szymanska, M. The Influence of Water Sorption of Dental Light-Cured Composites on Shrinkage Stress. Materials 2017, 10, 1142. [Google Scholar] [CrossRef] [PubMed]
- Müller, J.A.; Rohr, N.; Fischer, J. Evaluation of ISO 4049: Water sorption and water solubility of resin cements. Eur. J. Oral Sci. 2017, 125, 141–150. [Google Scholar] [CrossRef] [PubMed]


| Material | Aging Protocol | FS [MPa] | SD | FM [MPa] | QT | DTS [MPa] | SD */QT | HV [-] | SD */QT |
|---|---|---|---|---|---|---|---|---|---|
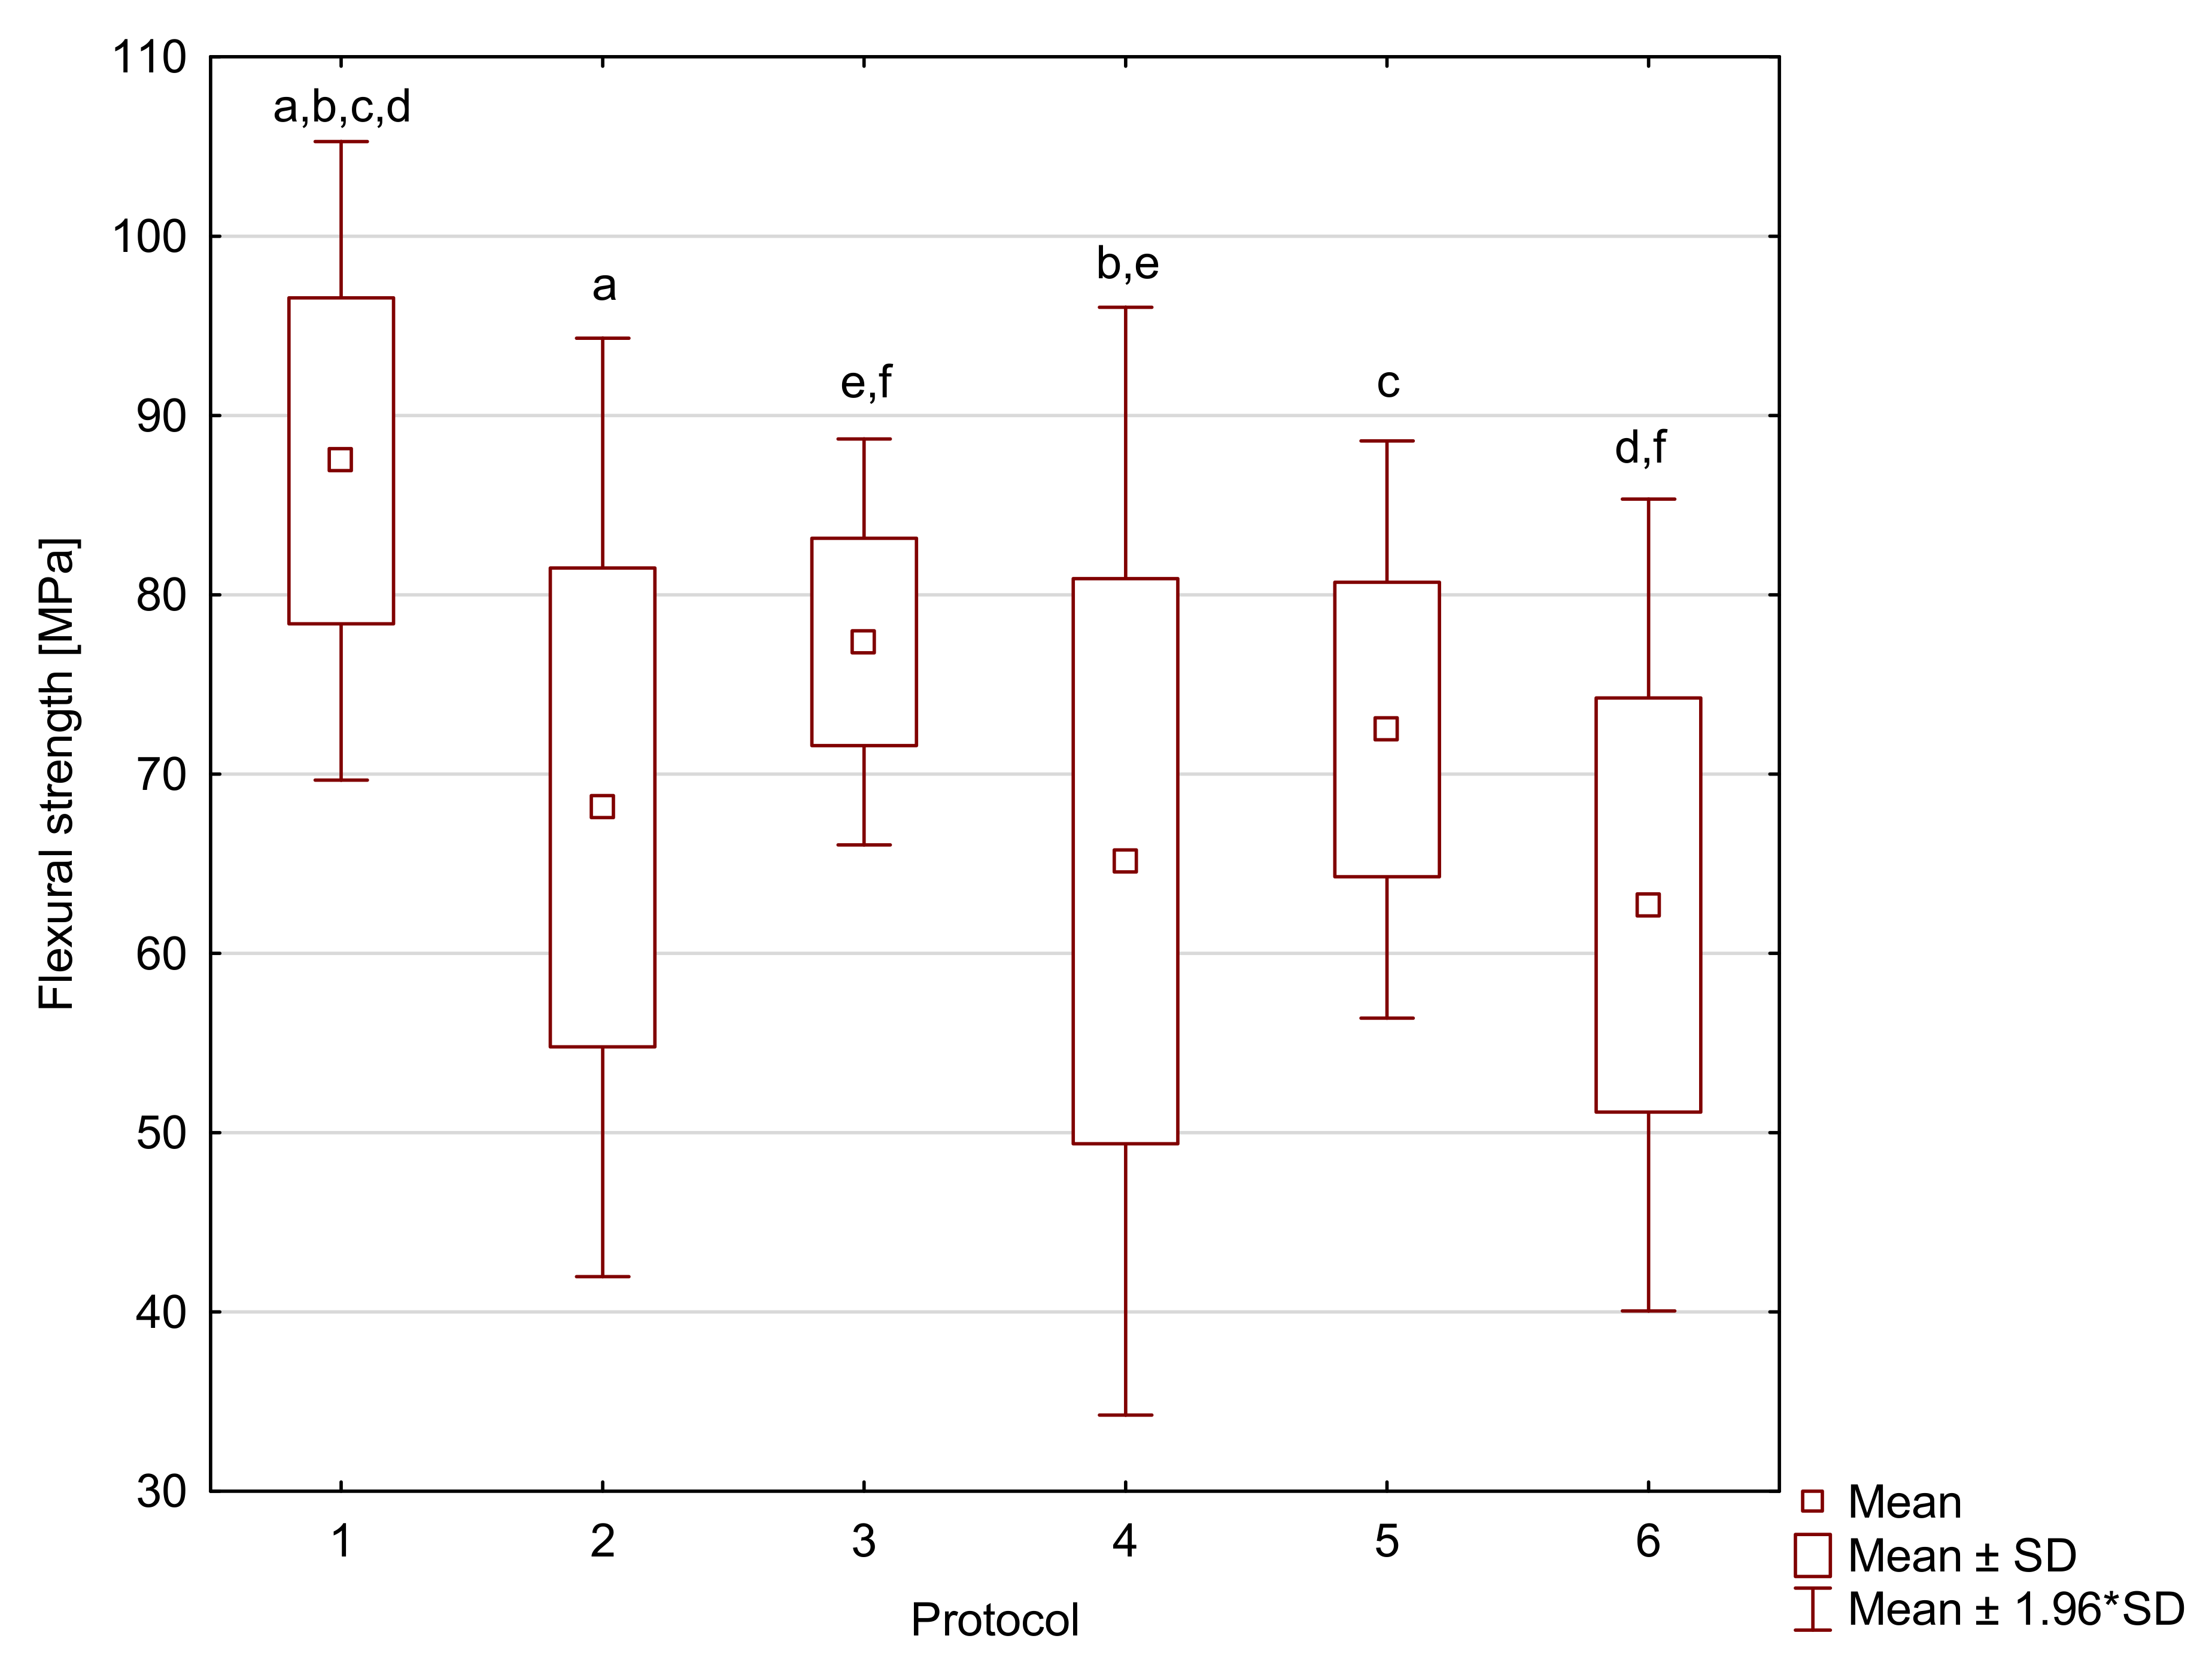
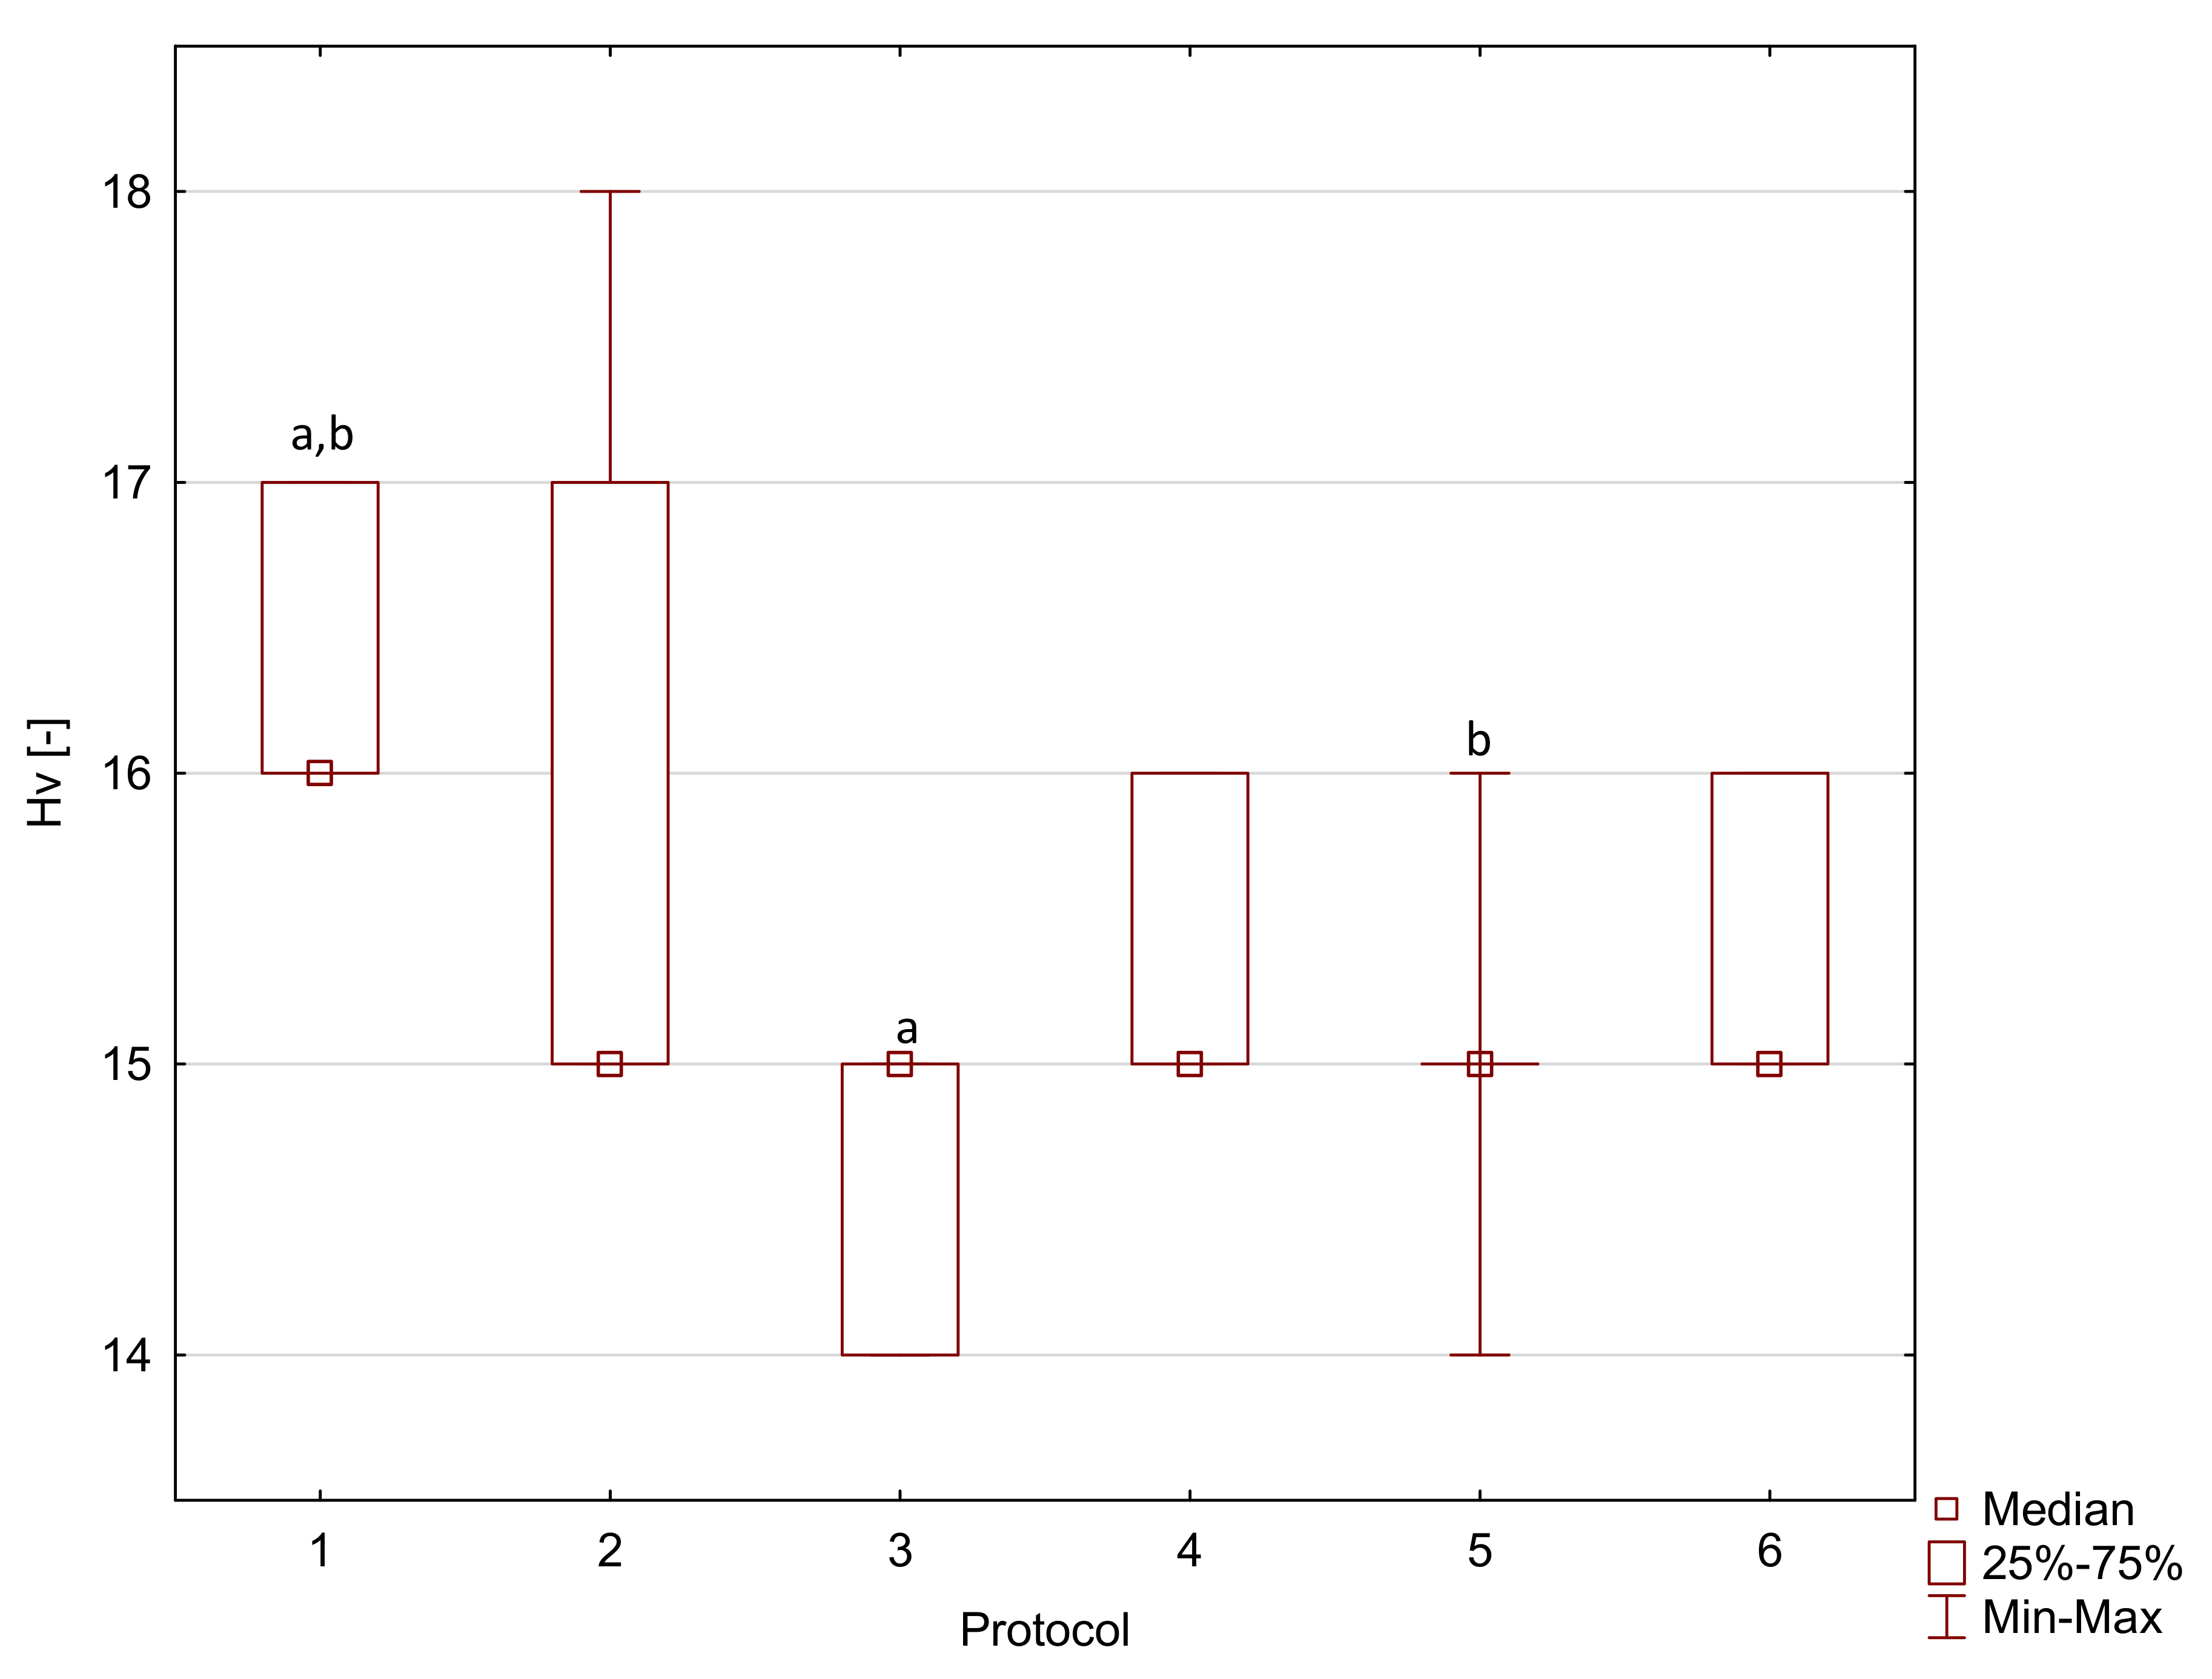
| Resin F | 1 | 87.5 a,b,c,d | 9.1 | 1950 | 310 | 36.6 a | 8.3 | 16 a,b | 1 |
| 2 | 68.1 a | 13.4 | 2130 a | 170 | 22.7 a | 3.3 | 15 | 2 | |
| 3 | 77.4 e,f | 5.8 | 1920 | 170 | 32.1 | 6.8 | 15 a | 1 | |
| 4 | 65.1 b,e | 15.8 | 1980 | 160 | 28.0 | 4.3 | 15 | 1 | |
| 5 | 72.5 c | 8.2 | 2160 | 510 | 34.9 | 15.7 | 15 b | 0 | |
| 6 | 62.7 d,f | 11.6 | 1790 a | 260 | 25.4 | 9.1 | 15 | 1 | |
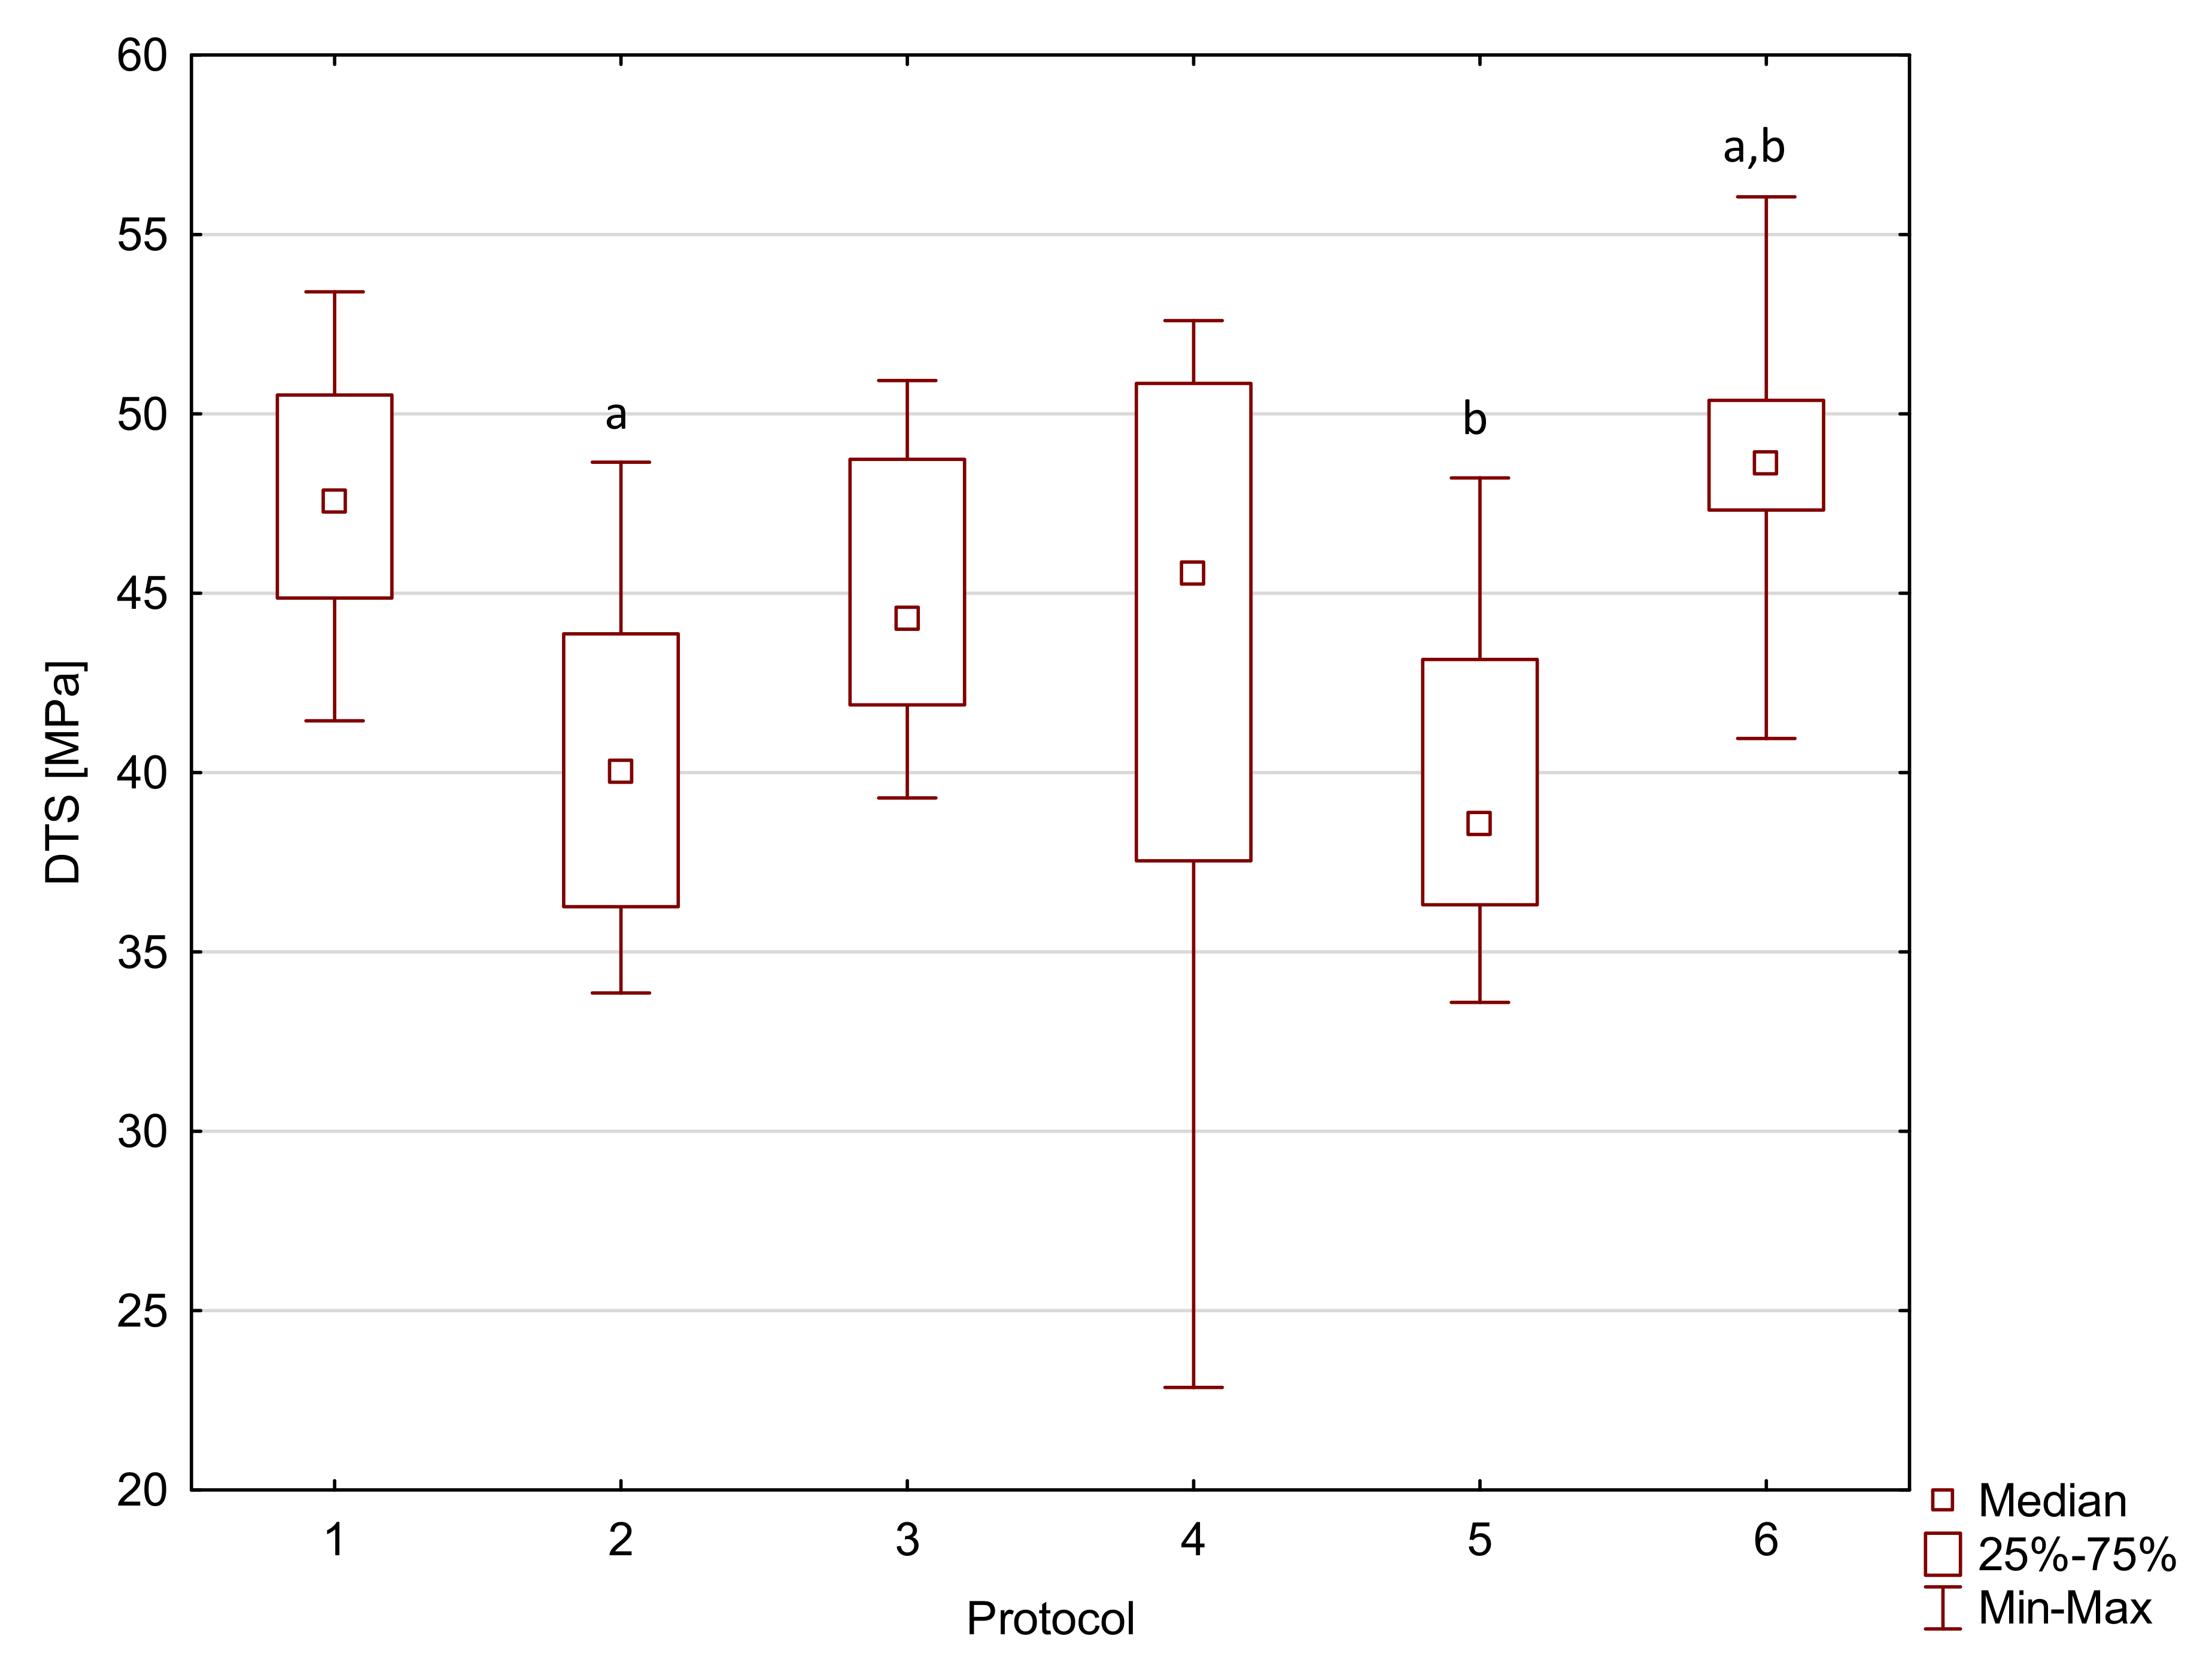
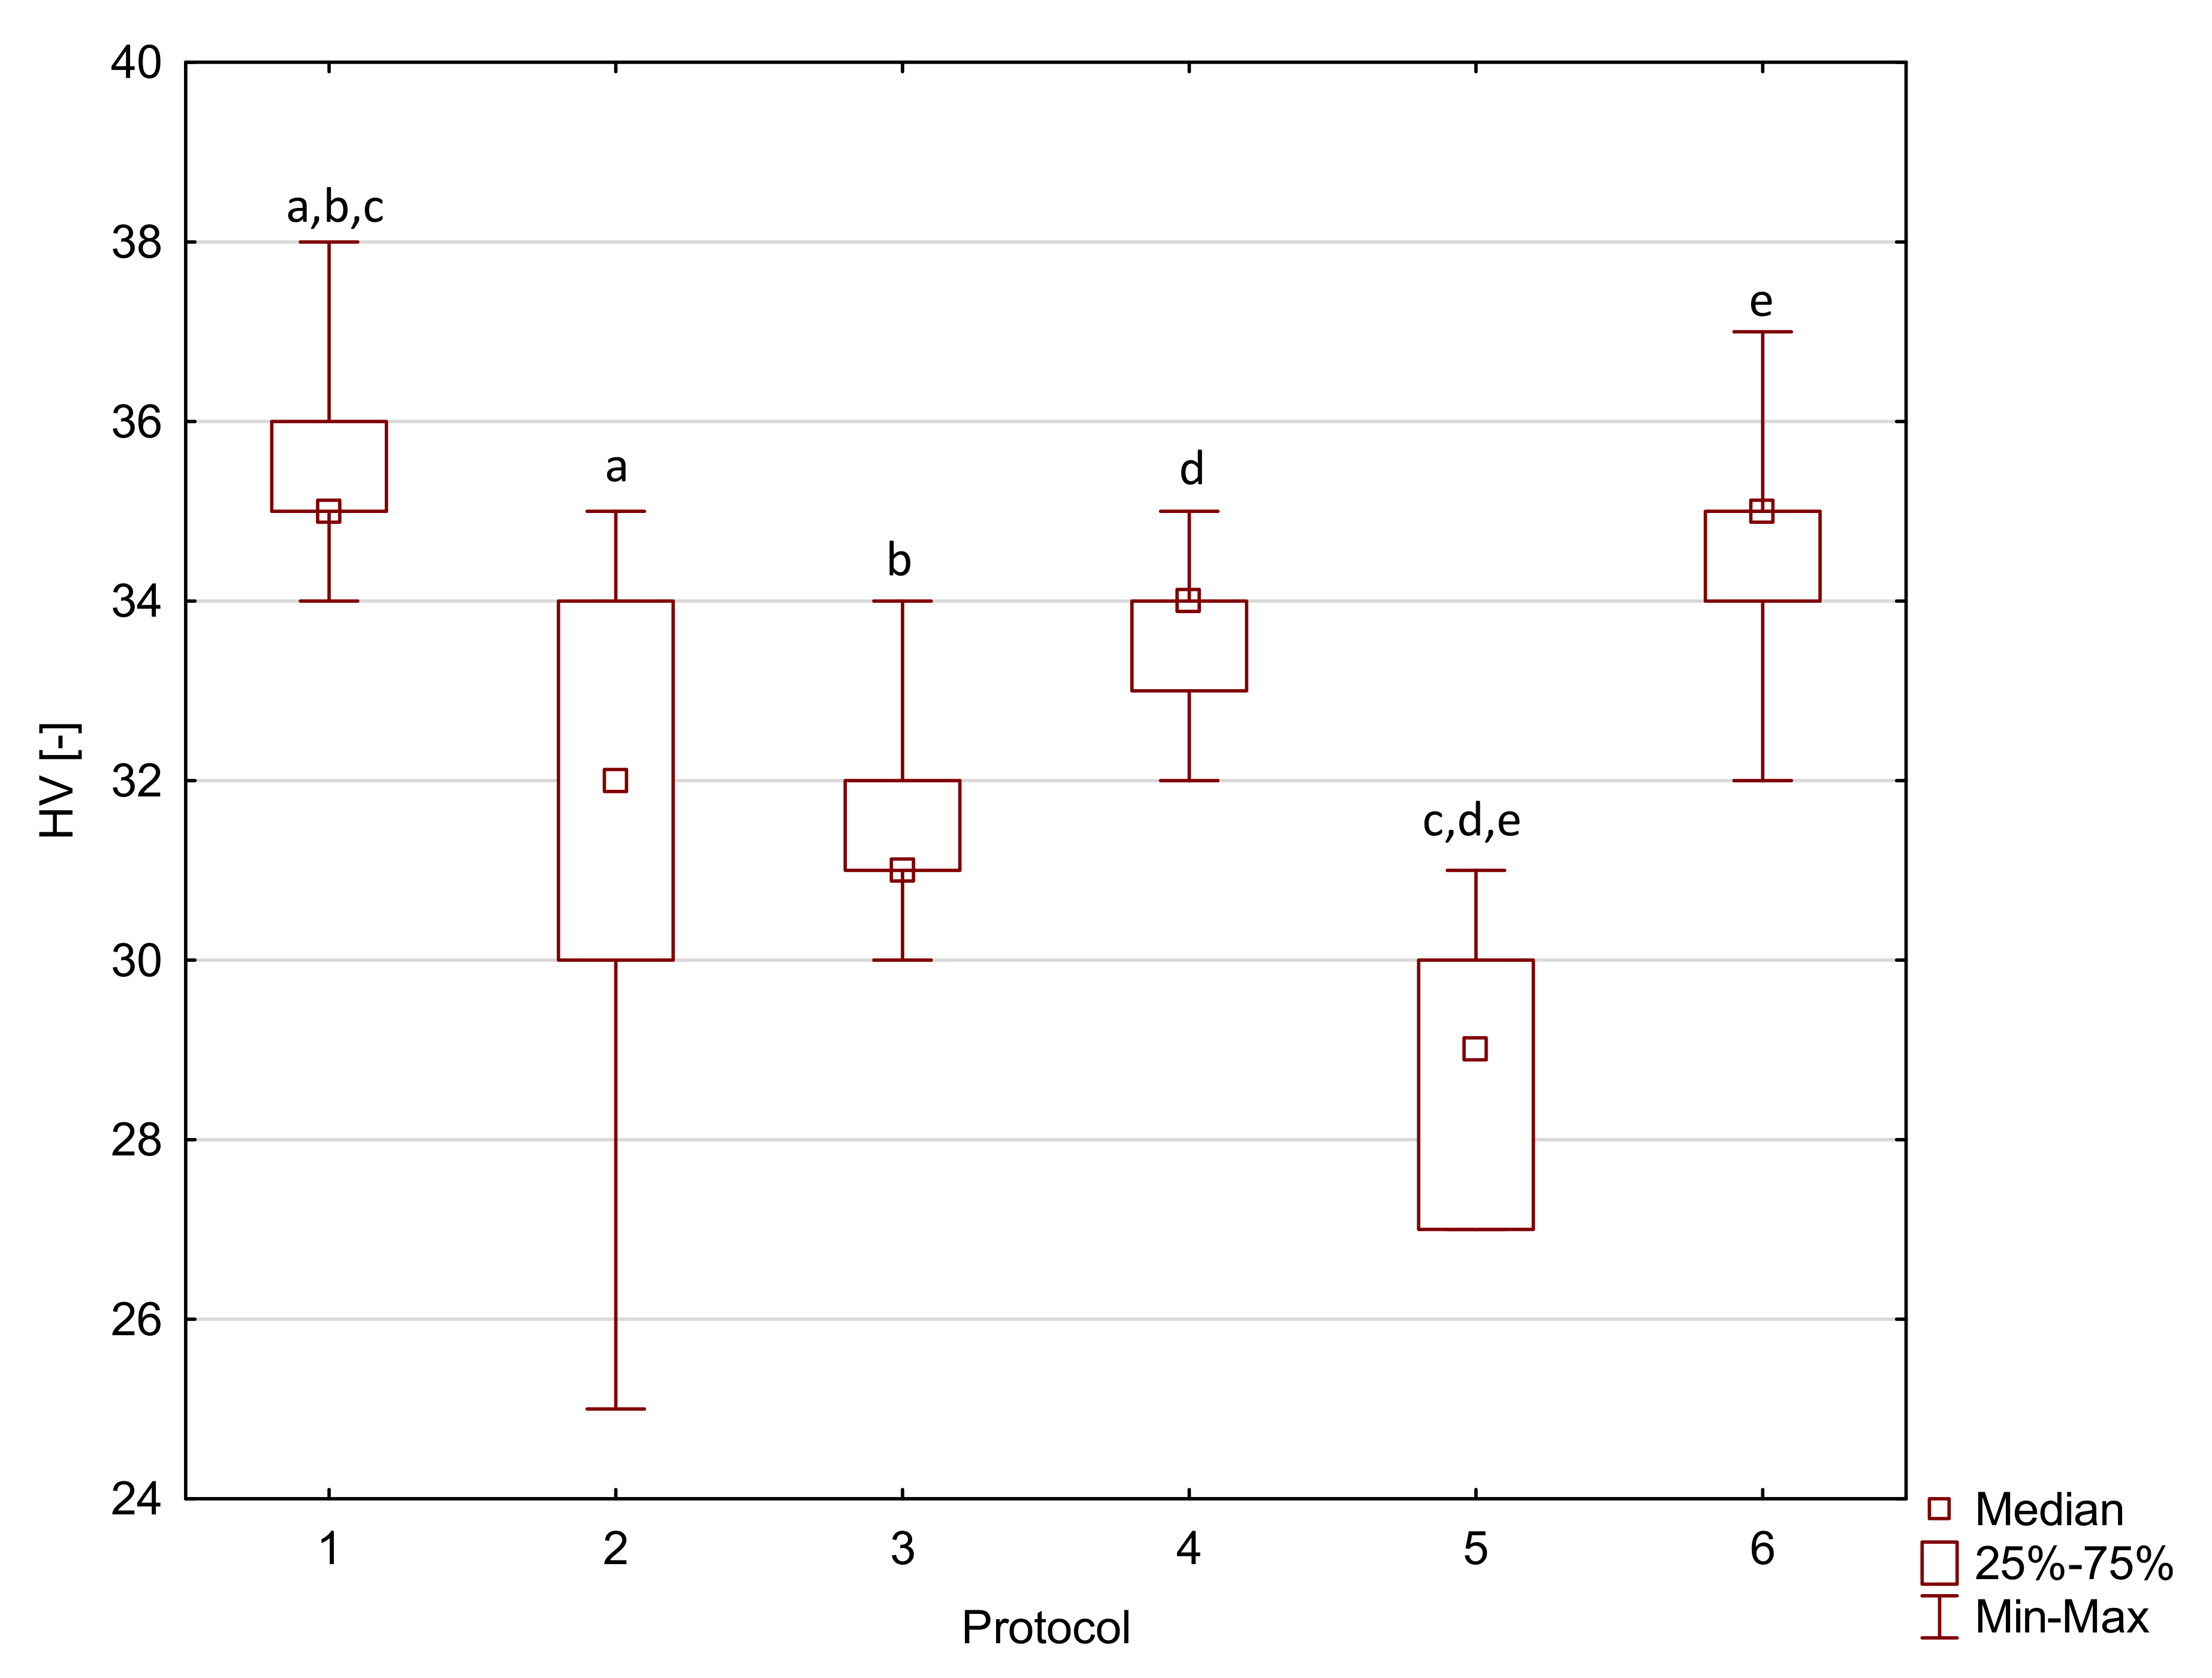
| Flow-Art | 1 | 97.0 a,f | 16.2 | 5750 a,b | 620 | 47.5 | 5.7 | 35 a,b,c | 1 |
| 2 | 87.5 b | 10.9 | 5840 c,d | 440 | 40.0 a | 7.6 | 32 a | 4 | |
| 3 | 84.2 c | 15.6 | 4480 a,c | 440 | 44.3 | 6.8 | 31 b | 1 | |
| 4 | 84.3 d | 7.6 | 5720 | 320 | 45.6 | 13.3 | 34 d | 1 | |
| 5 | 58.4 a,b,c,d,e | 10.8 | 5250 | 2050 | 38.6 b | 6.8 | 29 c,d,e | 3 | |
| 6 | 78.2 e,f | 15.3 | 4090 b,d | 1050 | 48.6 a,b | 3.1 | 35 e | 1 | |
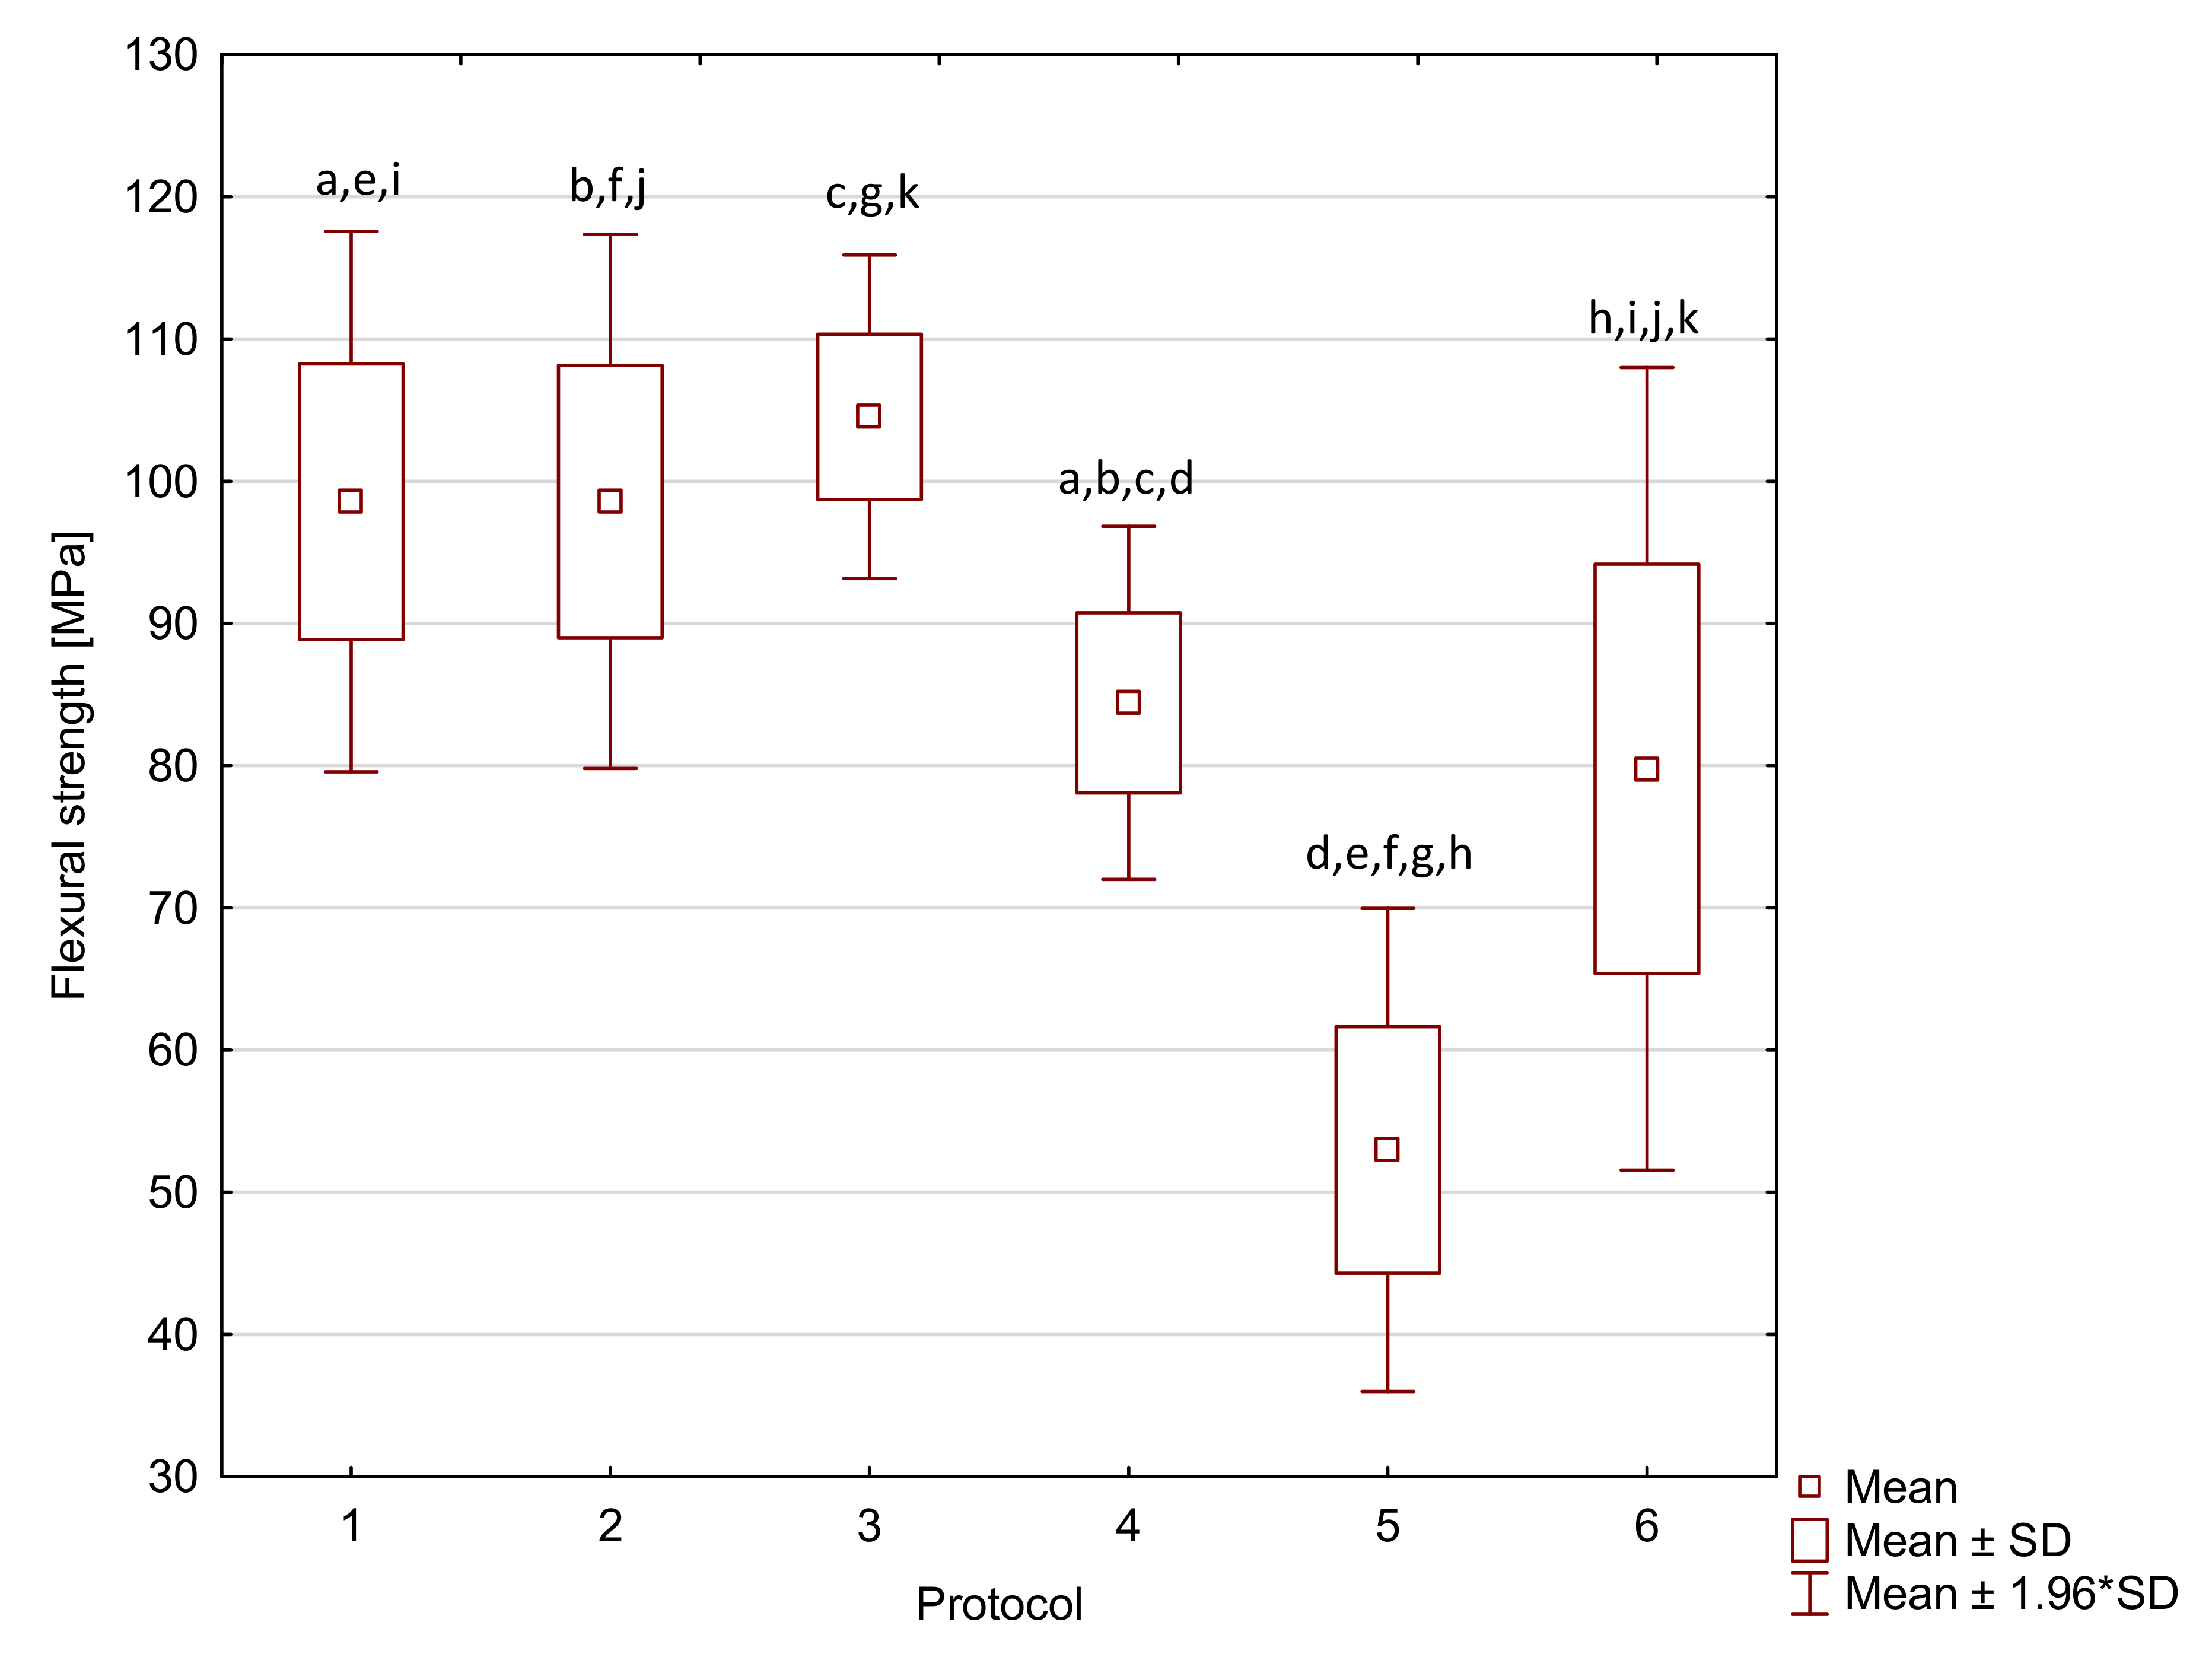
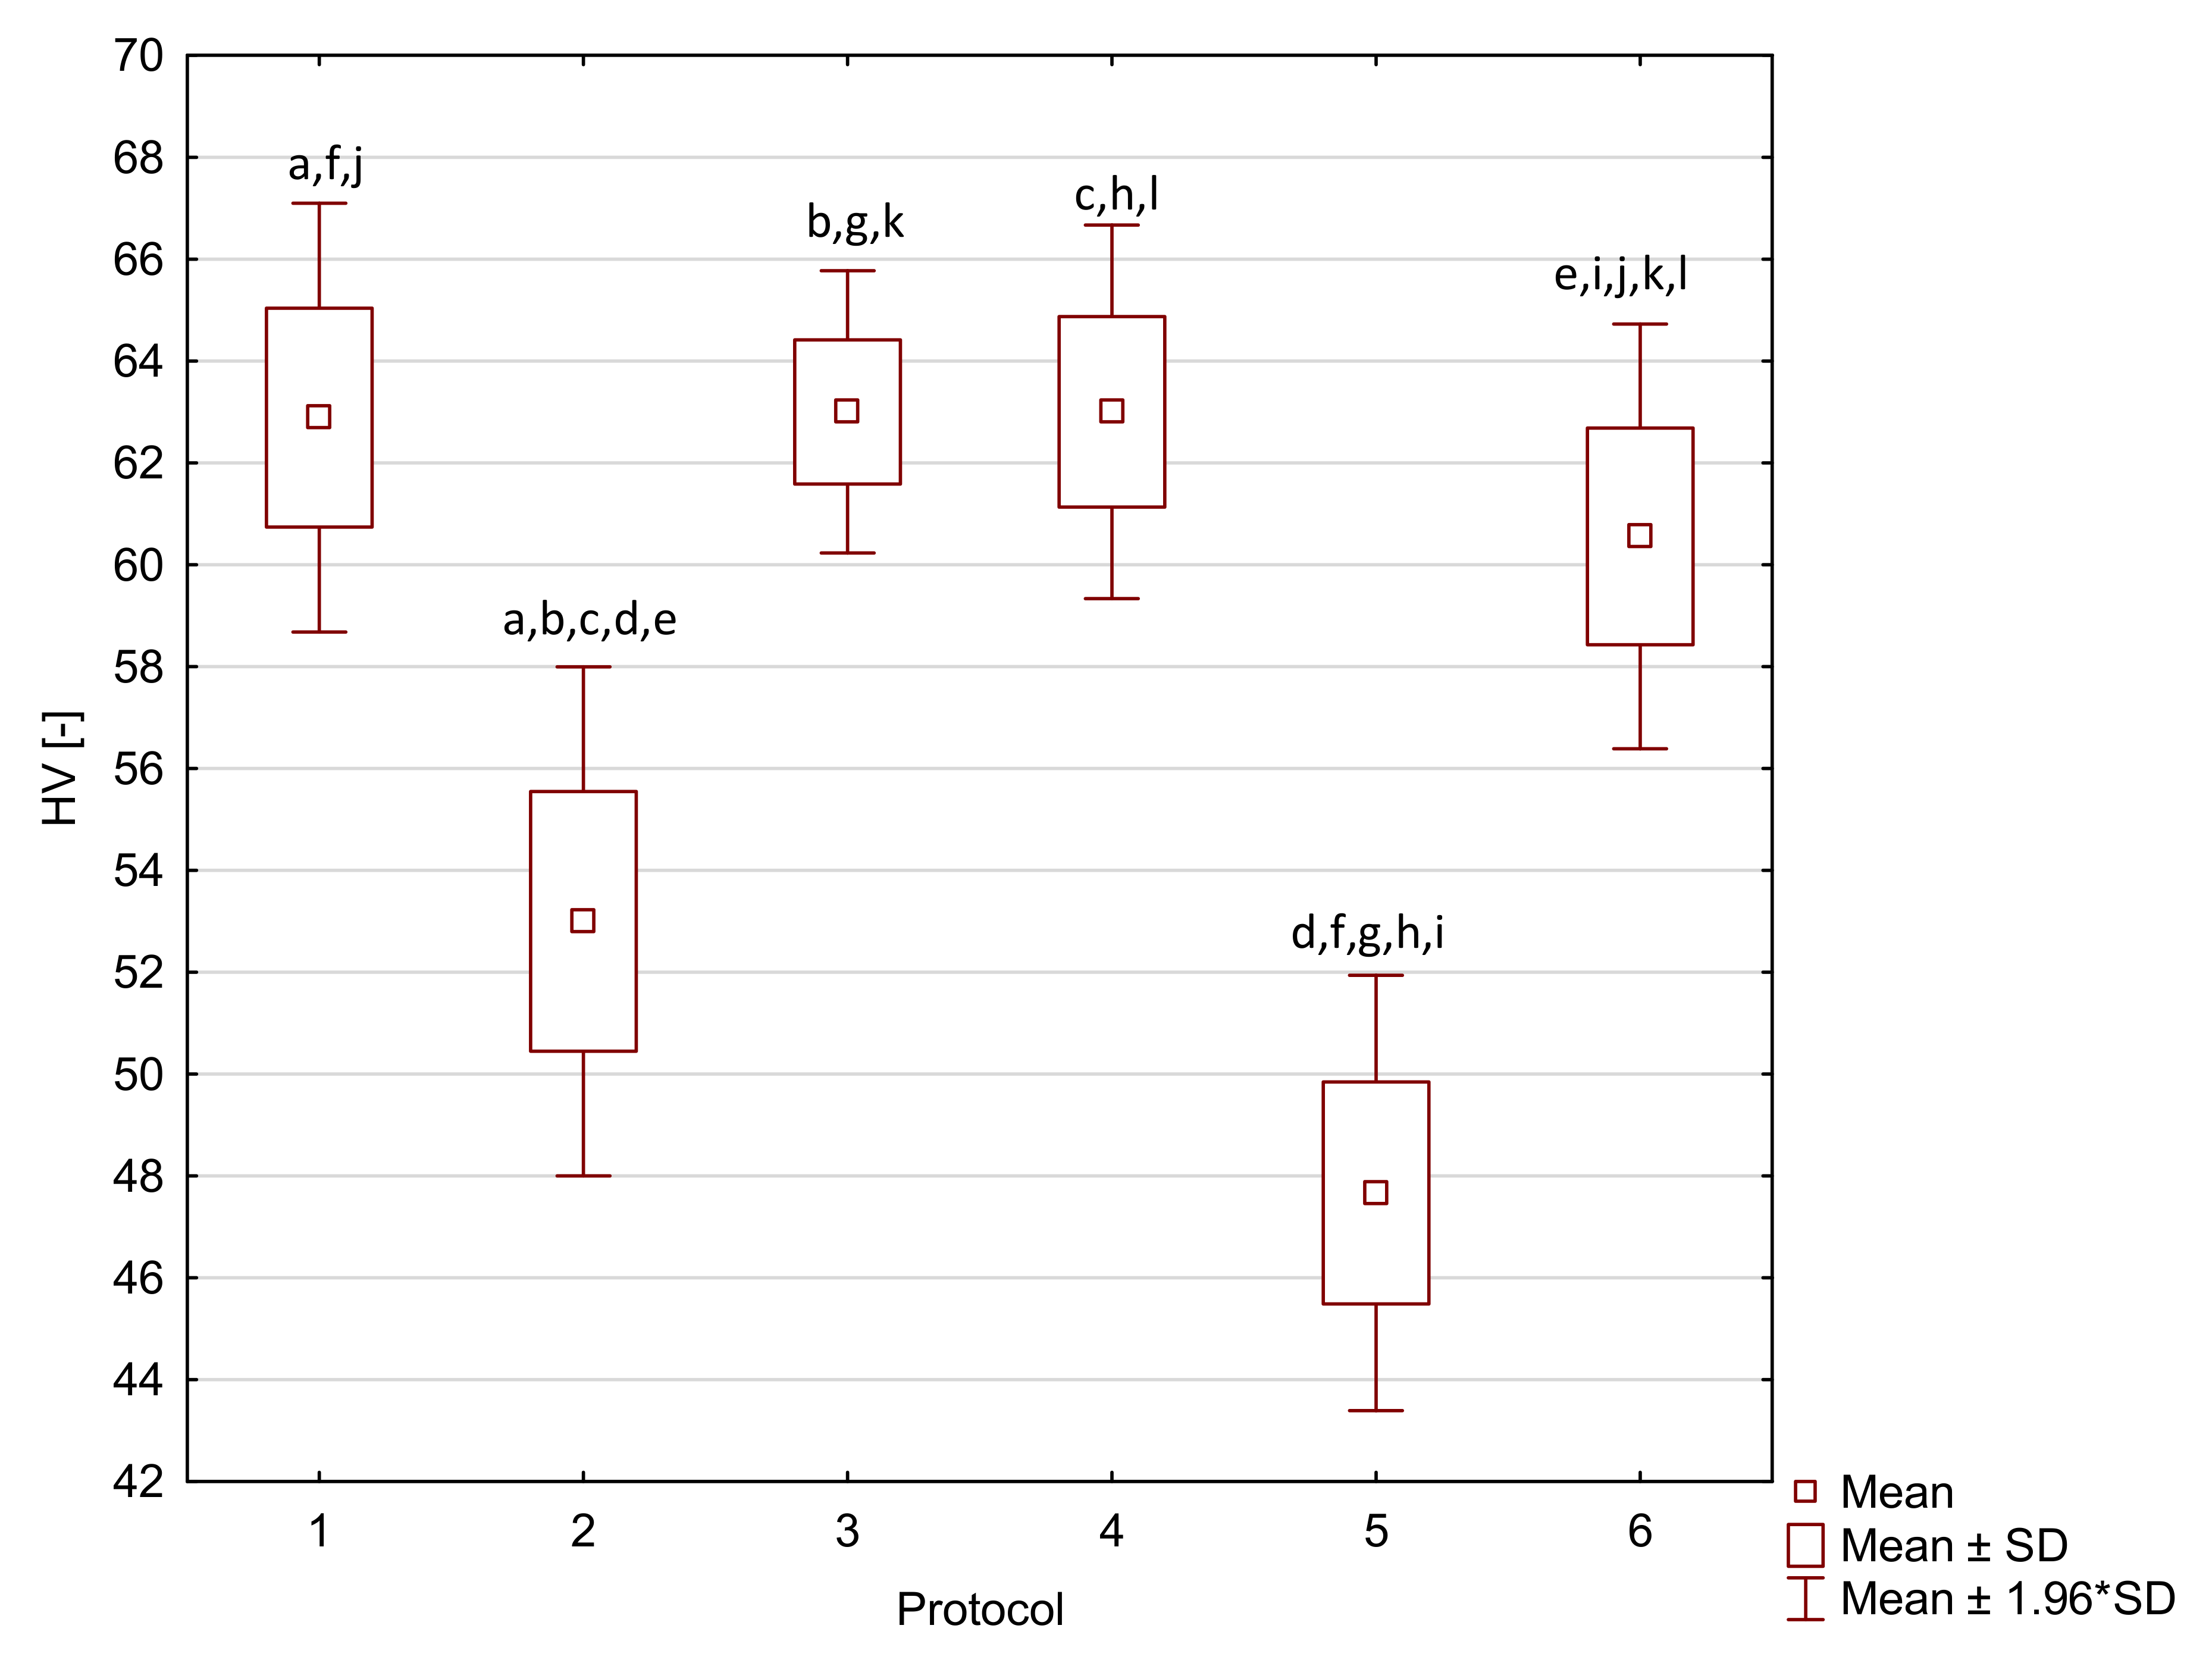
| Arkon | 1 | 98.6 a,e,i | 9.7 | 9360 | 3130 | 44.4 a,f | 6.6 * | 63 a,f,j | 2 * |
| 2 | 98.6 b,f,j | 9.6 | 9620 a | 960 | 40.6 b,g | 5.2 * | 53 a,b,c,d,e | 3 * | |
| 3 | 104.5 c,g,k | 5.8 | 7710 | 1980 | 52.6 a,b,c,d,e | 5.5 * | 63 b,g,k | 1 * | |
| 4 | 84.4 a,b,c,d | 6.3 | 9360 | 860 | 30.3 c,f,g,h,i | 5.4 * | 63 c,h,l | 2 * | |
| 5 | 53.0 d,e,f,g,h | 8.7 | 8180 | 3120 | 44.0 d,h | 6.5 * | 48 d,f,g,h,i | 2 * | |
| 6 | 79.8 h,i,j,k | 14.4 | 8300 a | 2000 | 44.7 e,i | 5.0 * | 61 e,i,j,k,l | 2 * |
| Material | Sorption (SD) [µg/mm3] | Solubility (SD) [µg/mm3] |
|---|---|---|
| Resin F | 35.6 (0.8) | 1.7 (0.6) |
| Flow-Art | 21.6 (1.2) | 1.2 (0.5) |
| Arkon | 14.6 (0.5) | 0.7 (0.2) |
| Material Name | Manufacturer | Type | Composition | Curing Time [S] |
|---|---|---|---|---|
| RESIN F | Arkona (Niemce, Poland) | Resin | Matrix: Bis-GMA, TEGDMA, UDMA, Bis-EMA, CQ: DMAEMA | 20 |
| FLOW-ART | Flowable composite | Matrix: Bis-GMA, TEGDMA, UDMA, Bis-EMA; CQ: DMAEMA Filler: Al-Ba-B-Si glass, Ba-Al-B-F-Si glass, pyrogenic silica (62 % wt.) | 20 | |
| ARKON | Universal composite | Matrix: Bis-GMA, TEGDMA, UDMA, Bis-EMA; CQ: DMAEMA Filler: Al-Ba-B-Si glass, Ba-Al-B-F-Si glass, pyrogenic silica (78 % wt.) | 20 |
| Aging Protocol | Description |
|---|---|
| 1 | 24 h, 37 °C, distilled water; standard method of sample conditioning (for example in ISO 4049—flexural strength [27]) |
| 2 | Three months, 37 °C, artificial saliva; time needed to stabilize weight gain [51] |
| 3 | 500 cycles, 5 °C and 55 °C, water; based on ISO/TS 11405:2015 [25] |
| 4 | 7200 cycles, 5 °C and 55 °C, water; this corresponds to one year of clinical function, assuming that 20 such cycles may occur per day [52]. Previous studies have noted major deterioration before day 4 in resin cements (≈6000 cycles) [26] |
| 5 | One week, 60 °C, 0.1 M NaOH; this is considered to be a quick appropriate method to predict the durability of composites in vitro [23] |
| 6 | Five days, 55 °C, water; considered a viable alternative to thermal cycling [26] |
Publisher’s Note: MDPI stays neutral with regard to jurisdictional claims in published maps and institutional affiliations. |
© 2022 by the authors. Licensee MDPI, Basel, Switzerland. This article is an open access article distributed under the terms and conditions of the Creative Commons Attribution (CC BY) license (https://creativecommons.org/licenses/by/4.0/).
Share and Cite
Szczesio-Wlodarczyk, A.; Fronczek, M.; Ranoszek-Soliwoda, K.; Grobelny, J.; Sokolowski, J.; Bociong, K. The First Step in Standardizing an Artificial Aging Protocol for Dental Composites—Evaluation of Basic Protocols. Molecules 2022, 27, 3511. https://doi.org/10.3390/molecules27113511
Szczesio-Wlodarczyk A, Fronczek M, Ranoszek-Soliwoda K, Grobelny J, Sokolowski J, Bociong K. The First Step in Standardizing an Artificial Aging Protocol for Dental Composites—Evaluation of Basic Protocols. Molecules. 2022; 27(11):3511. https://doi.org/10.3390/molecules27113511
Chicago/Turabian StyleSzczesio-Wlodarczyk, Agata, Magdalena Fronczek, Katarzyna Ranoszek-Soliwoda, Jarosław Grobelny, Jerzy Sokolowski, and Kinga Bociong. 2022. "The First Step in Standardizing an Artificial Aging Protocol for Dental Composites—Evaluation of Basic Protocols" Molecules 27, no. 11: 3511. https://doi.org/10.3390/molecules27113511