
Ultrasensitive and Specific Detection of Anticancer Drug 5-Fluorouracil in Blood Samples by a Surface-Enhanced Raman Scattering (SERS)-Based Lateral Flow Immunochromatographic Assay


Abstract
:1. Introduction
2. Materials and Methods
2.1. Chemicals, Materials and Apparatus
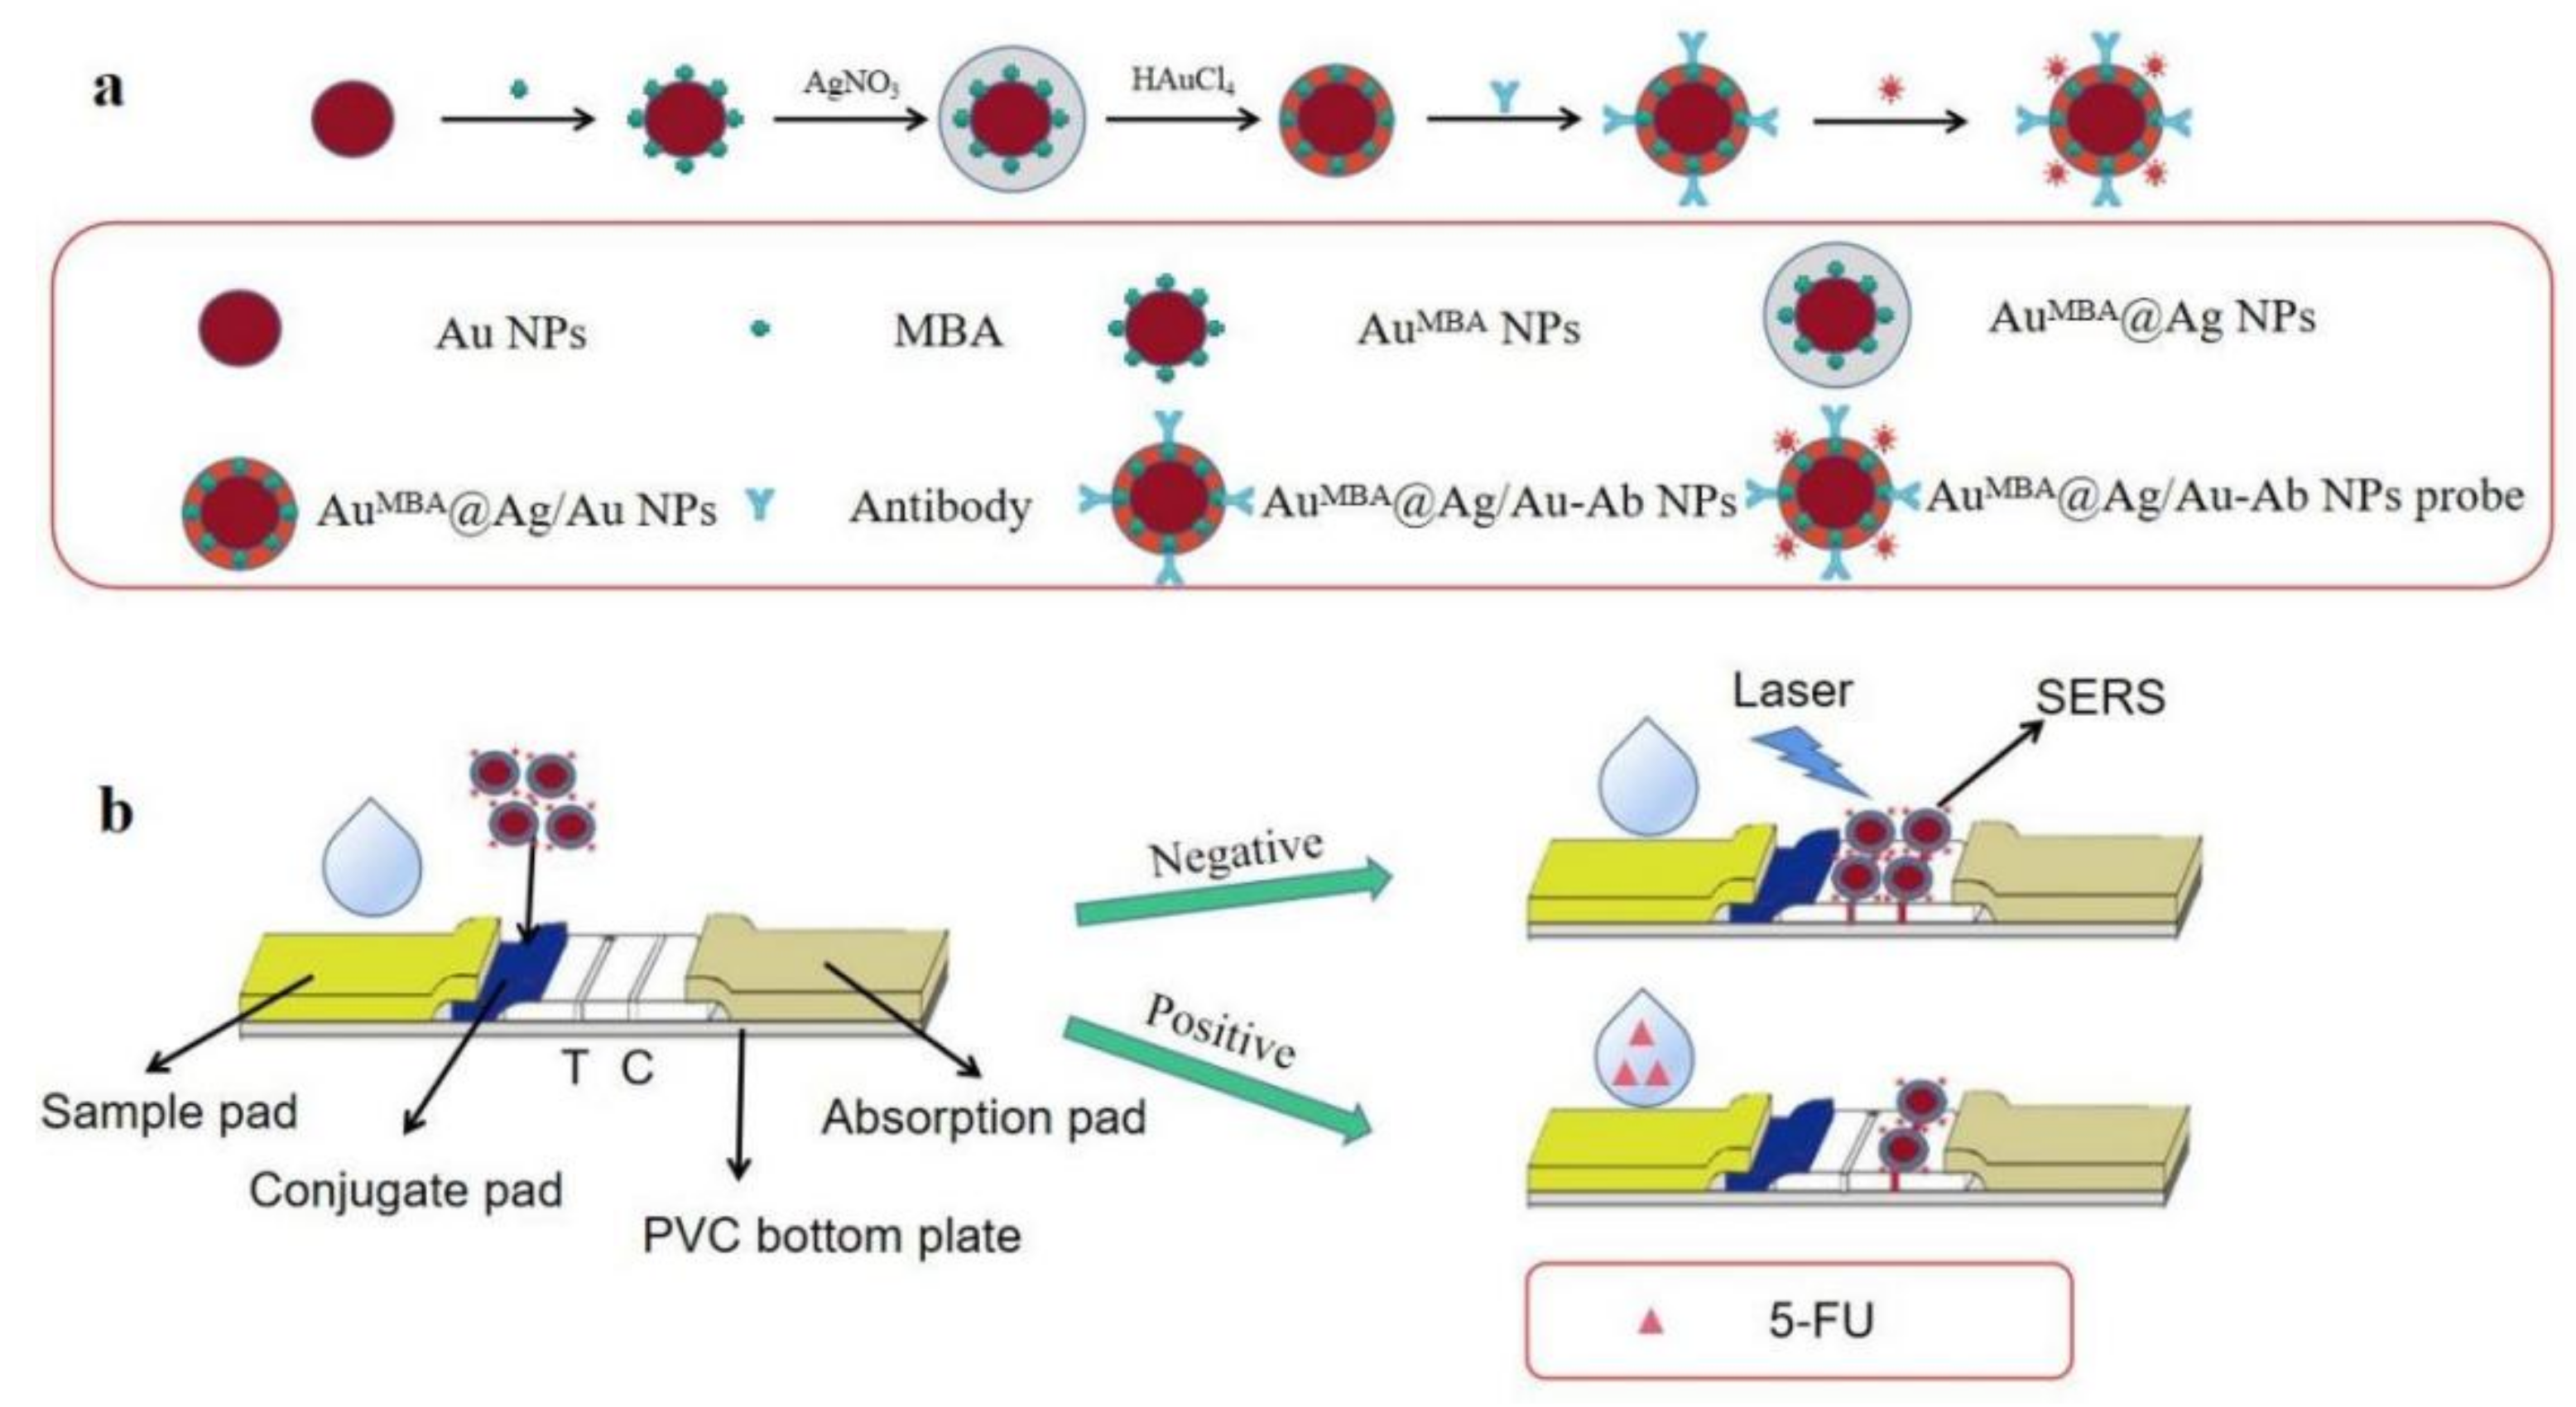
2.2. Synthesis of AuMBA@Ag/Au NPs
2.3. Preparation of Immunoprobe
2.4. Fabrication of LFIA Strip
2.5. Procedures of Competitive LFIA
2.6. Detection of 5-FU in Spiked Samples
2.7. LC-MS/MS Analysis
3. Results and Discussion
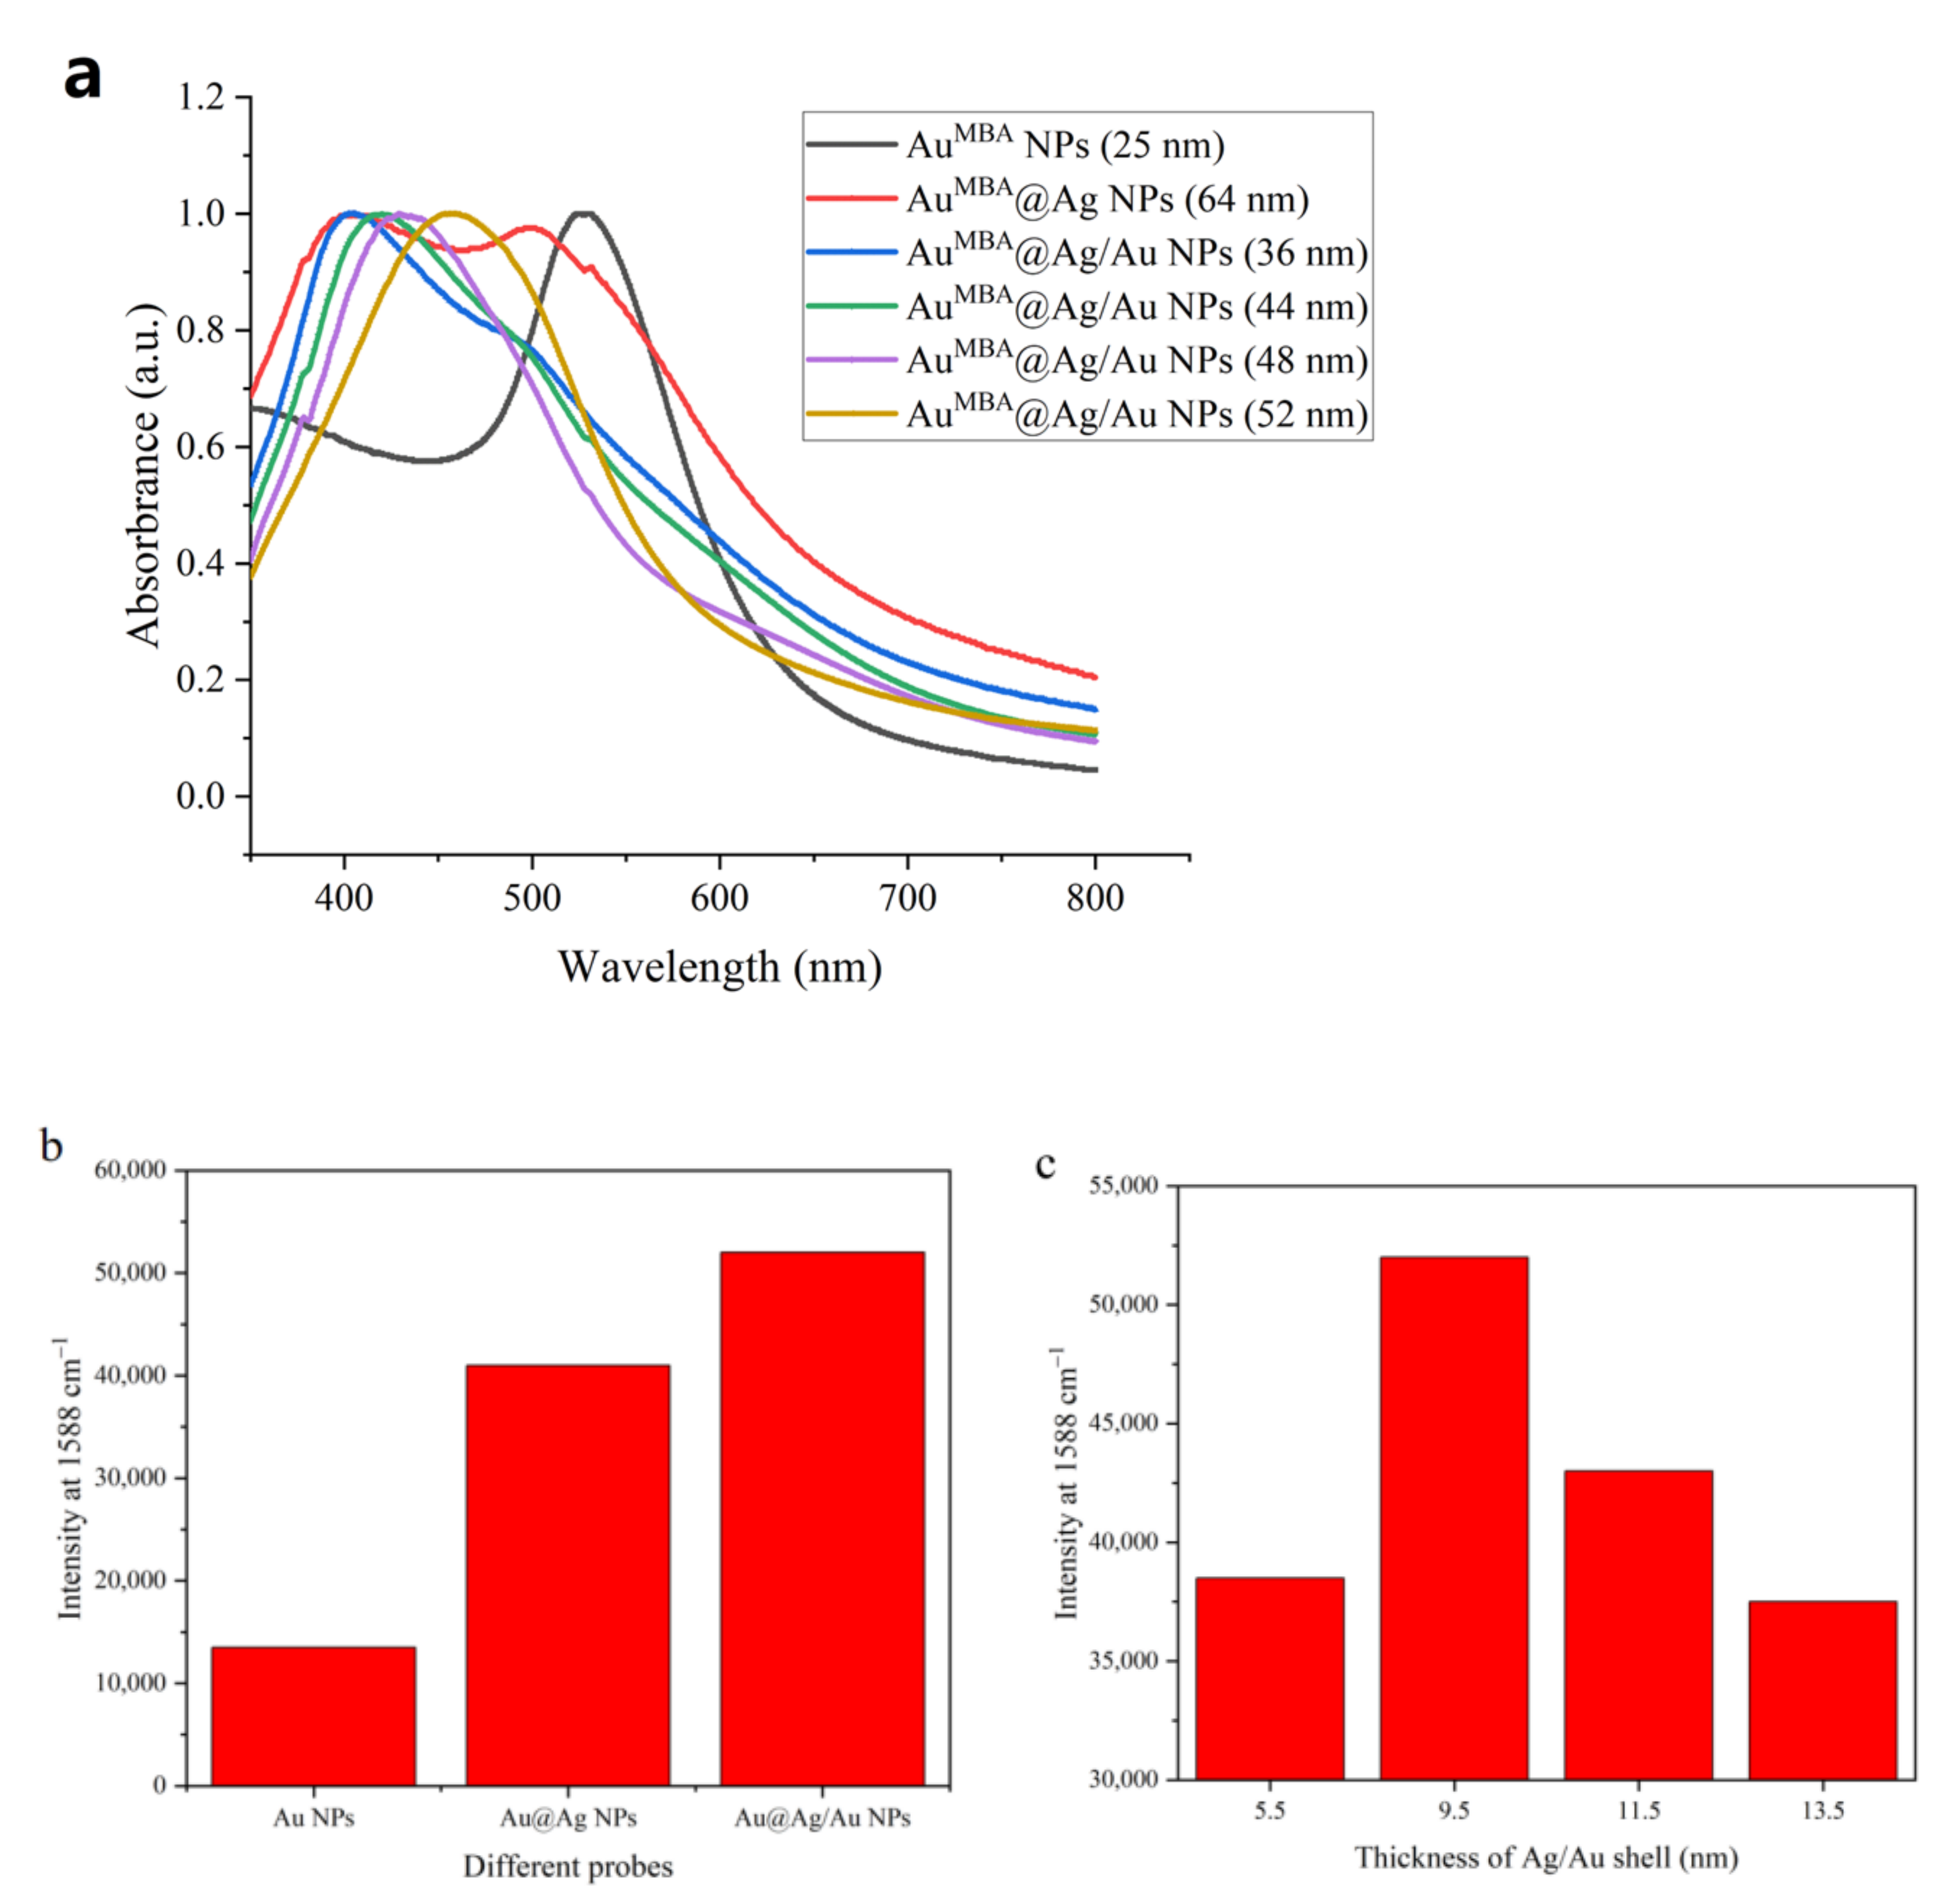
3.1. Synthesis and Characterization of Different NPs
3.2. Characterization of Immunoprobe
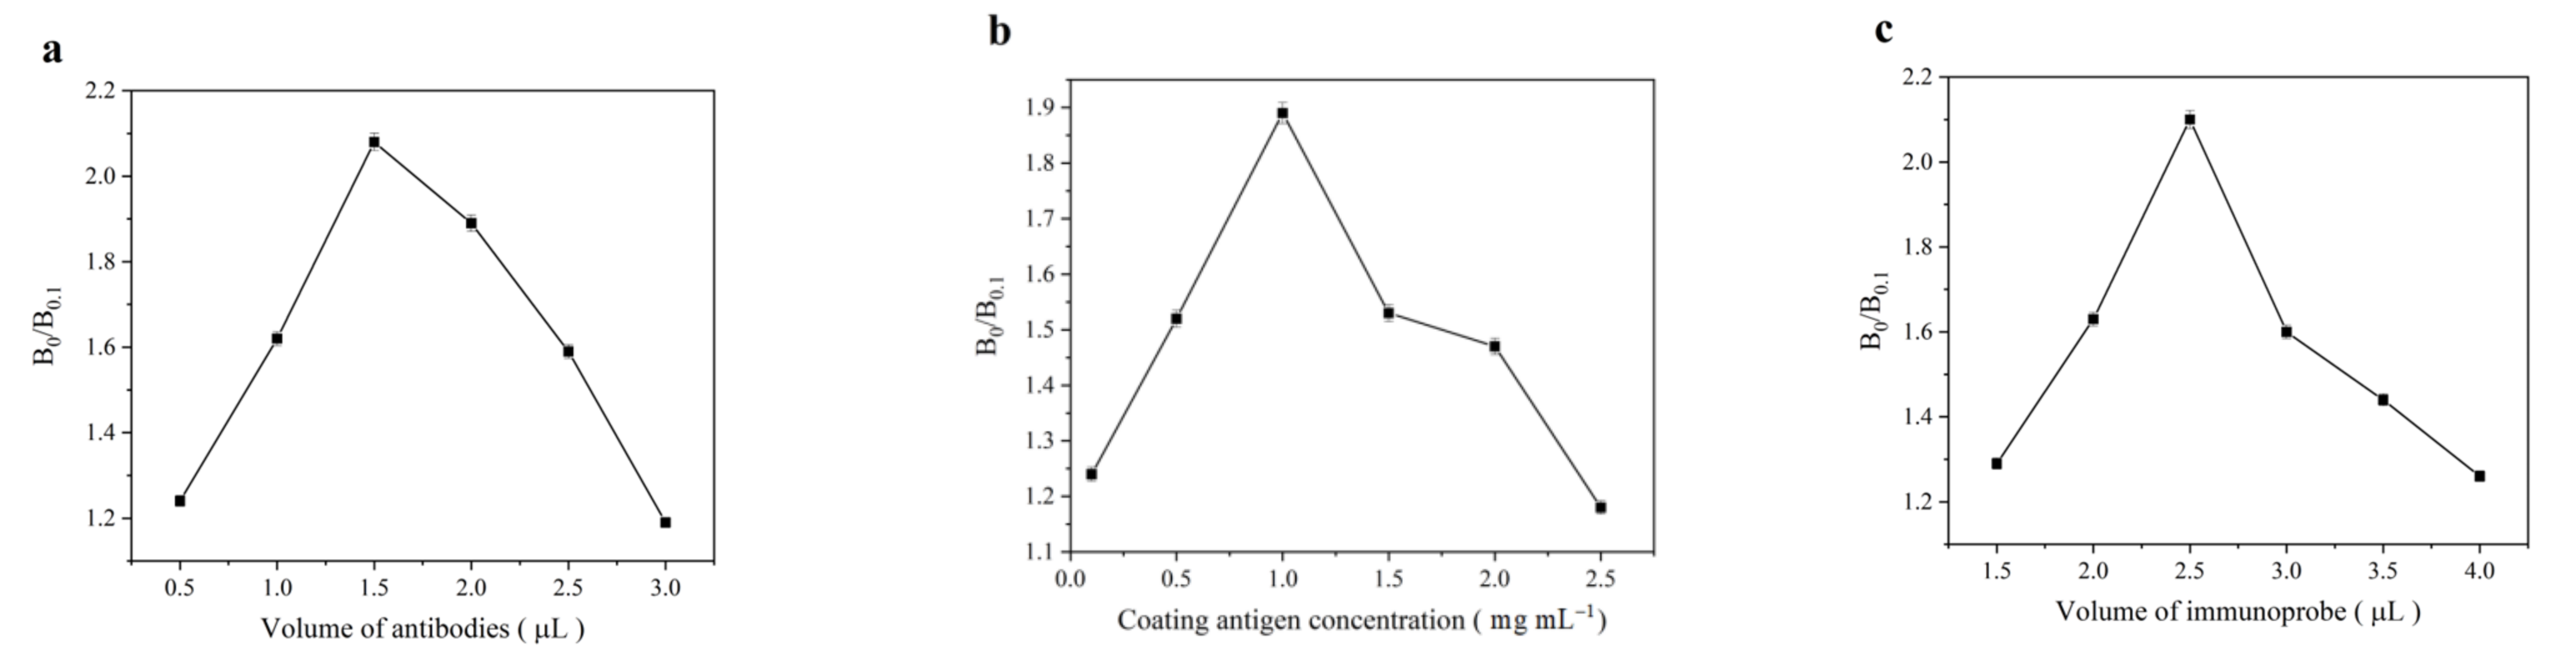
3.3. Optimization of Experimental Conditions
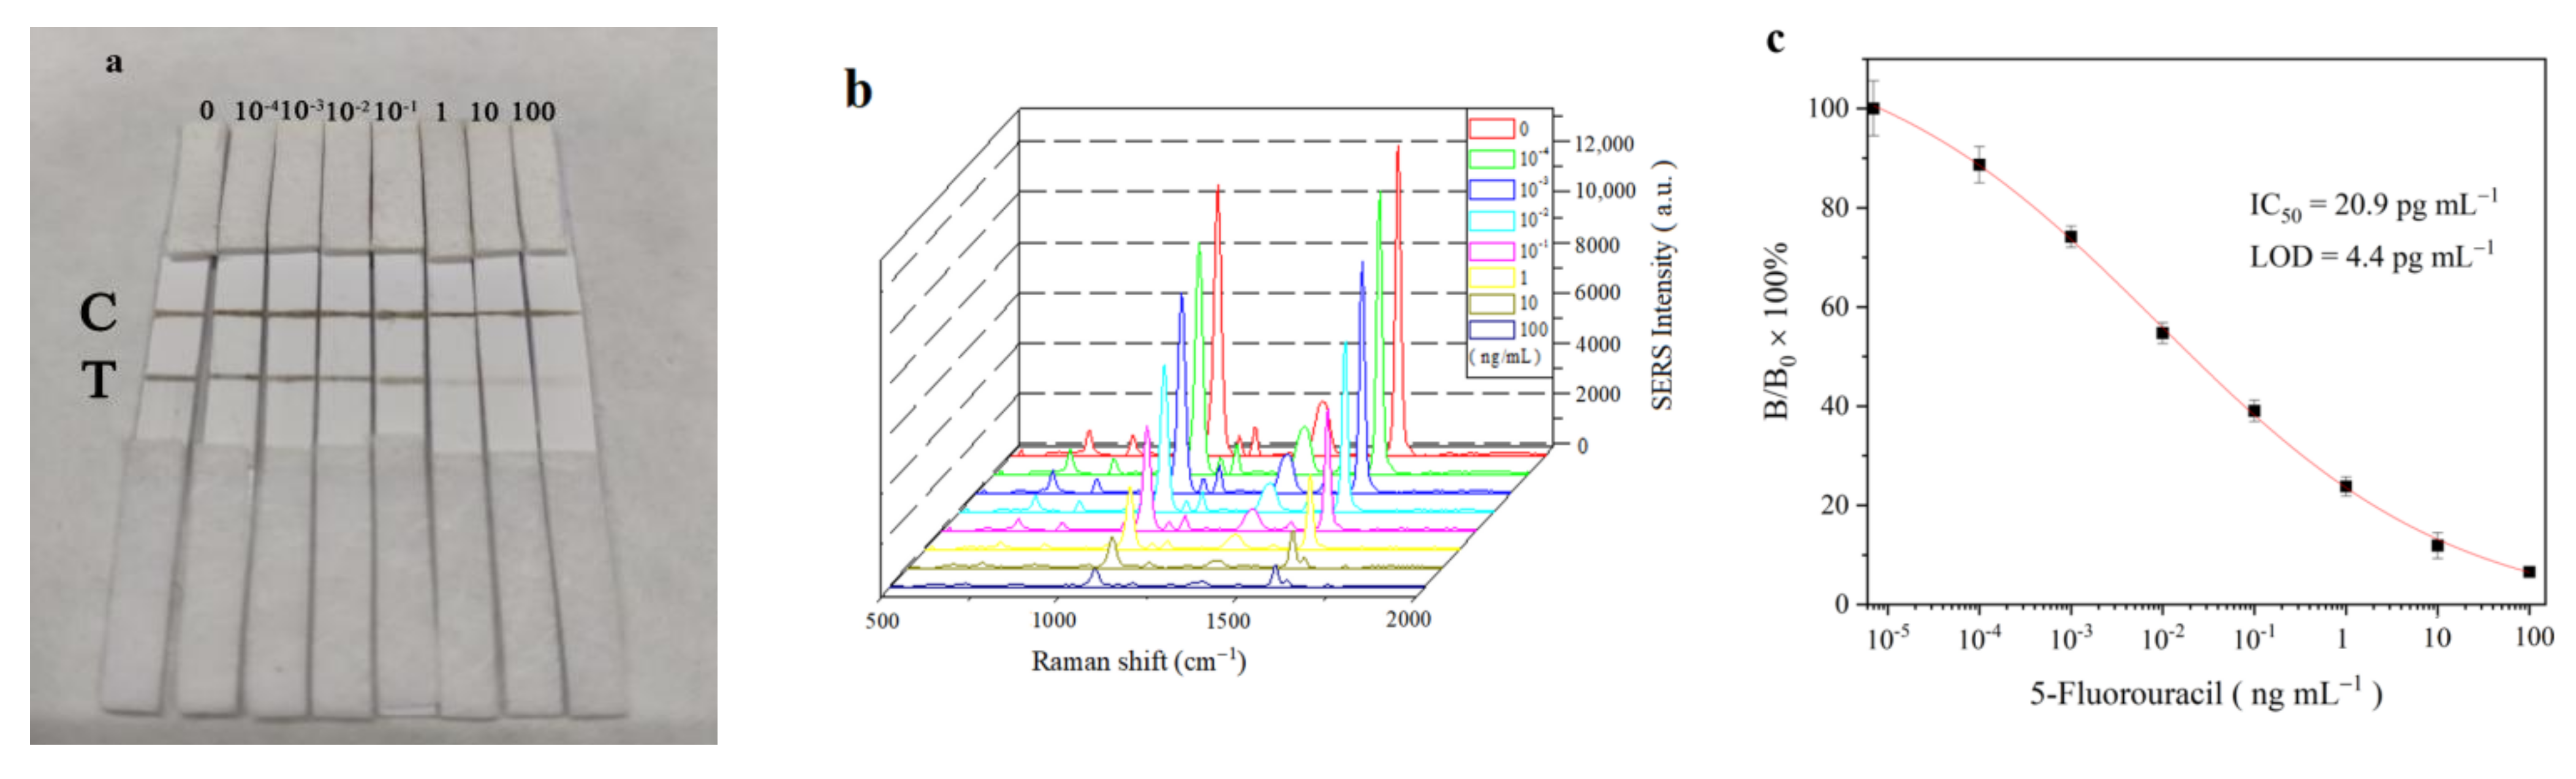
3.4. Sensitivity of SERS-LFIA
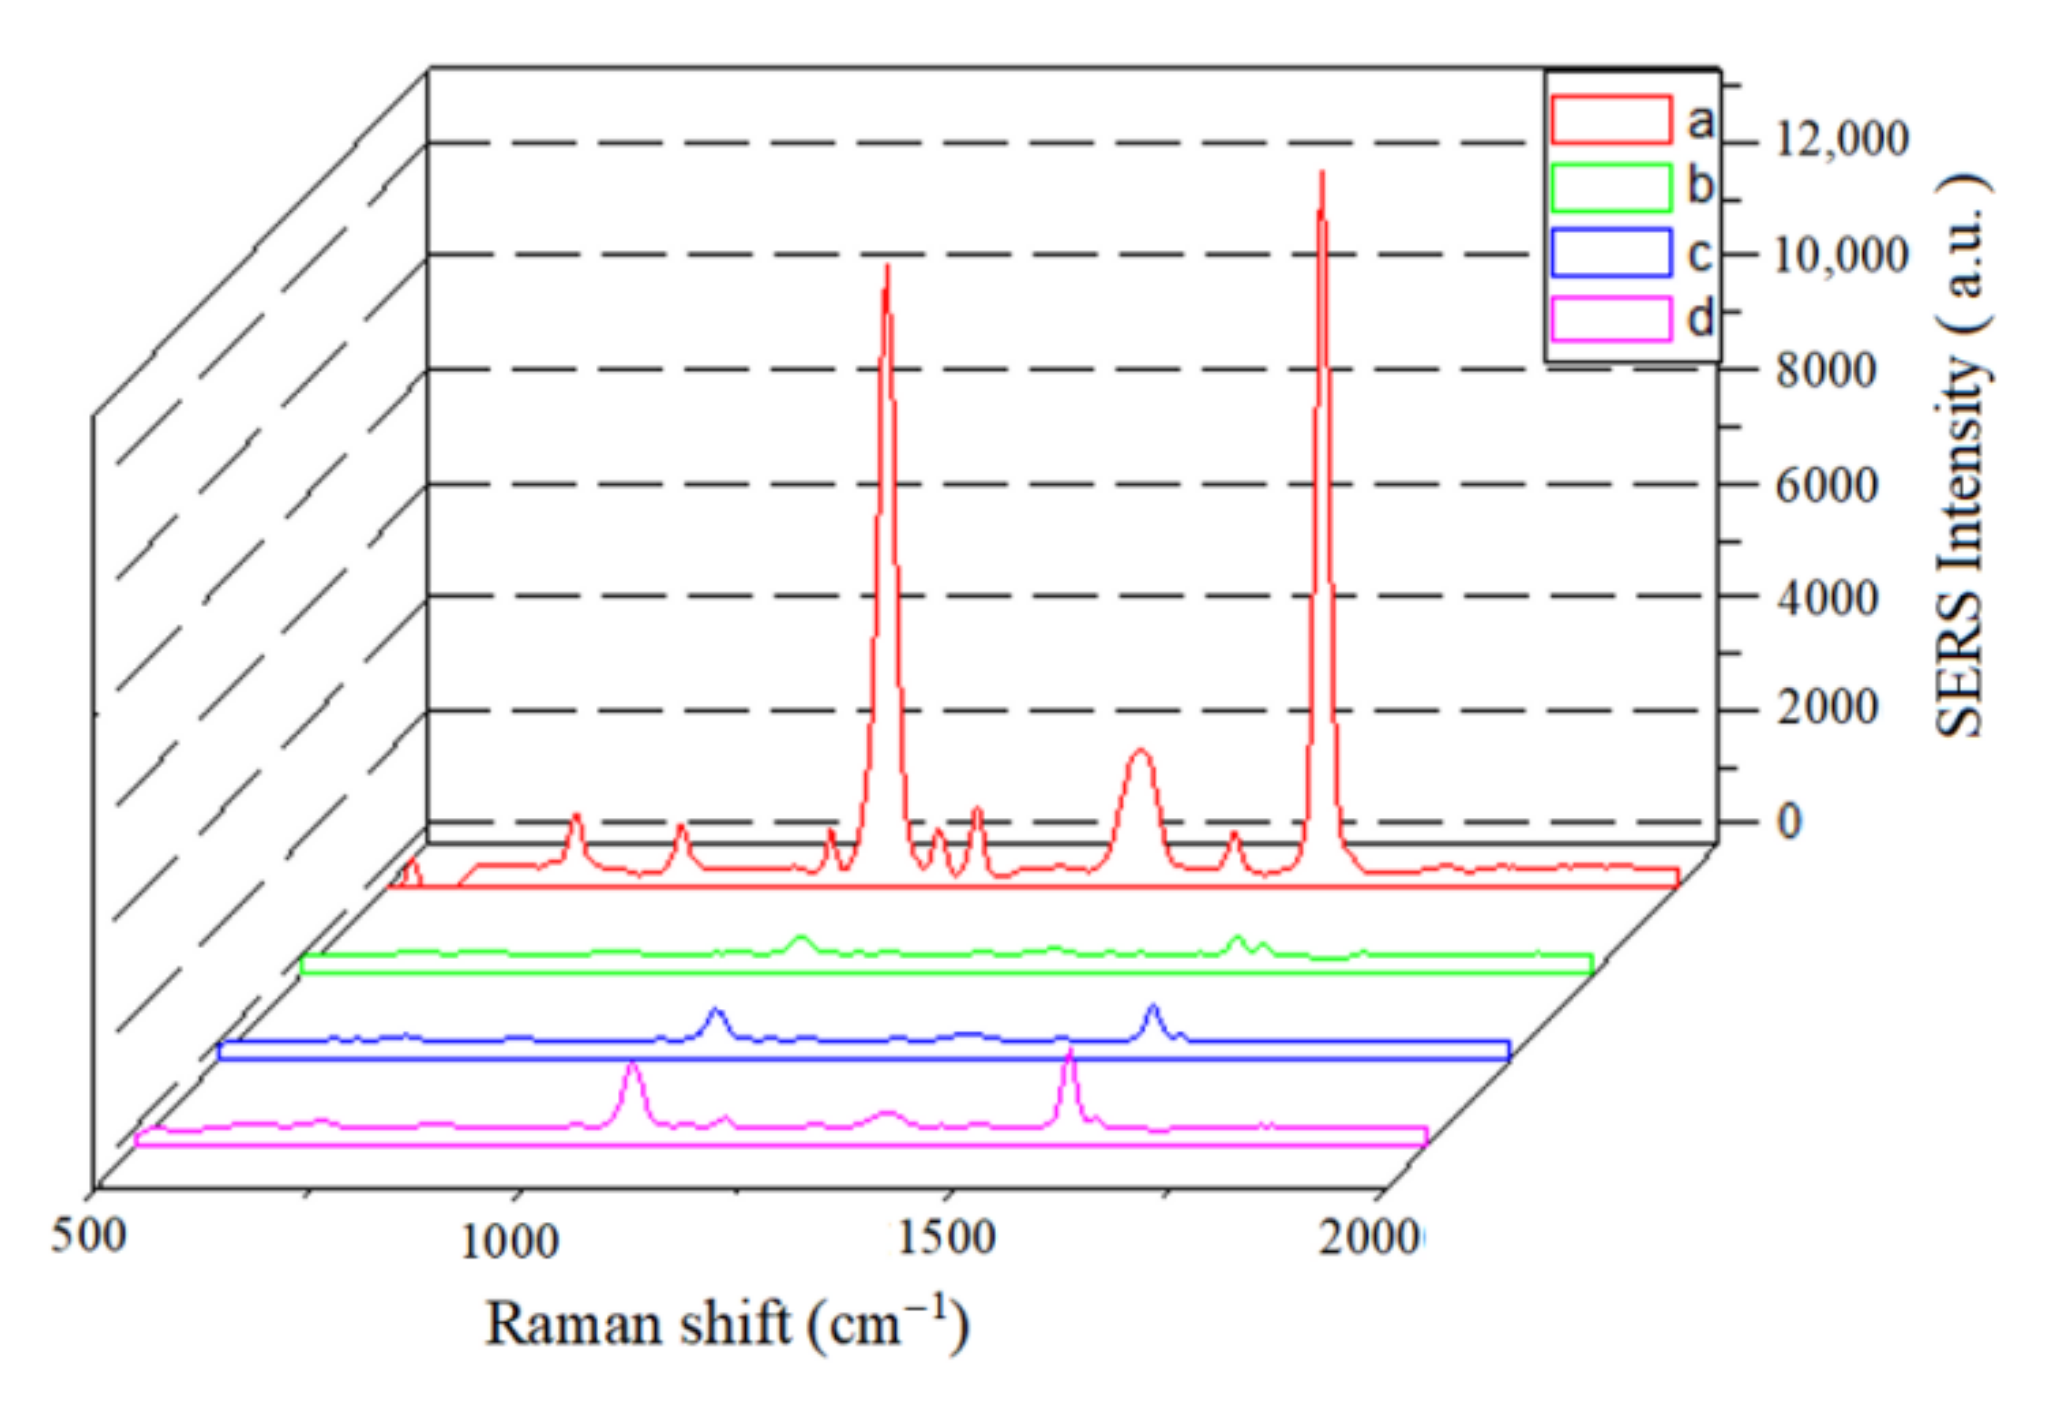
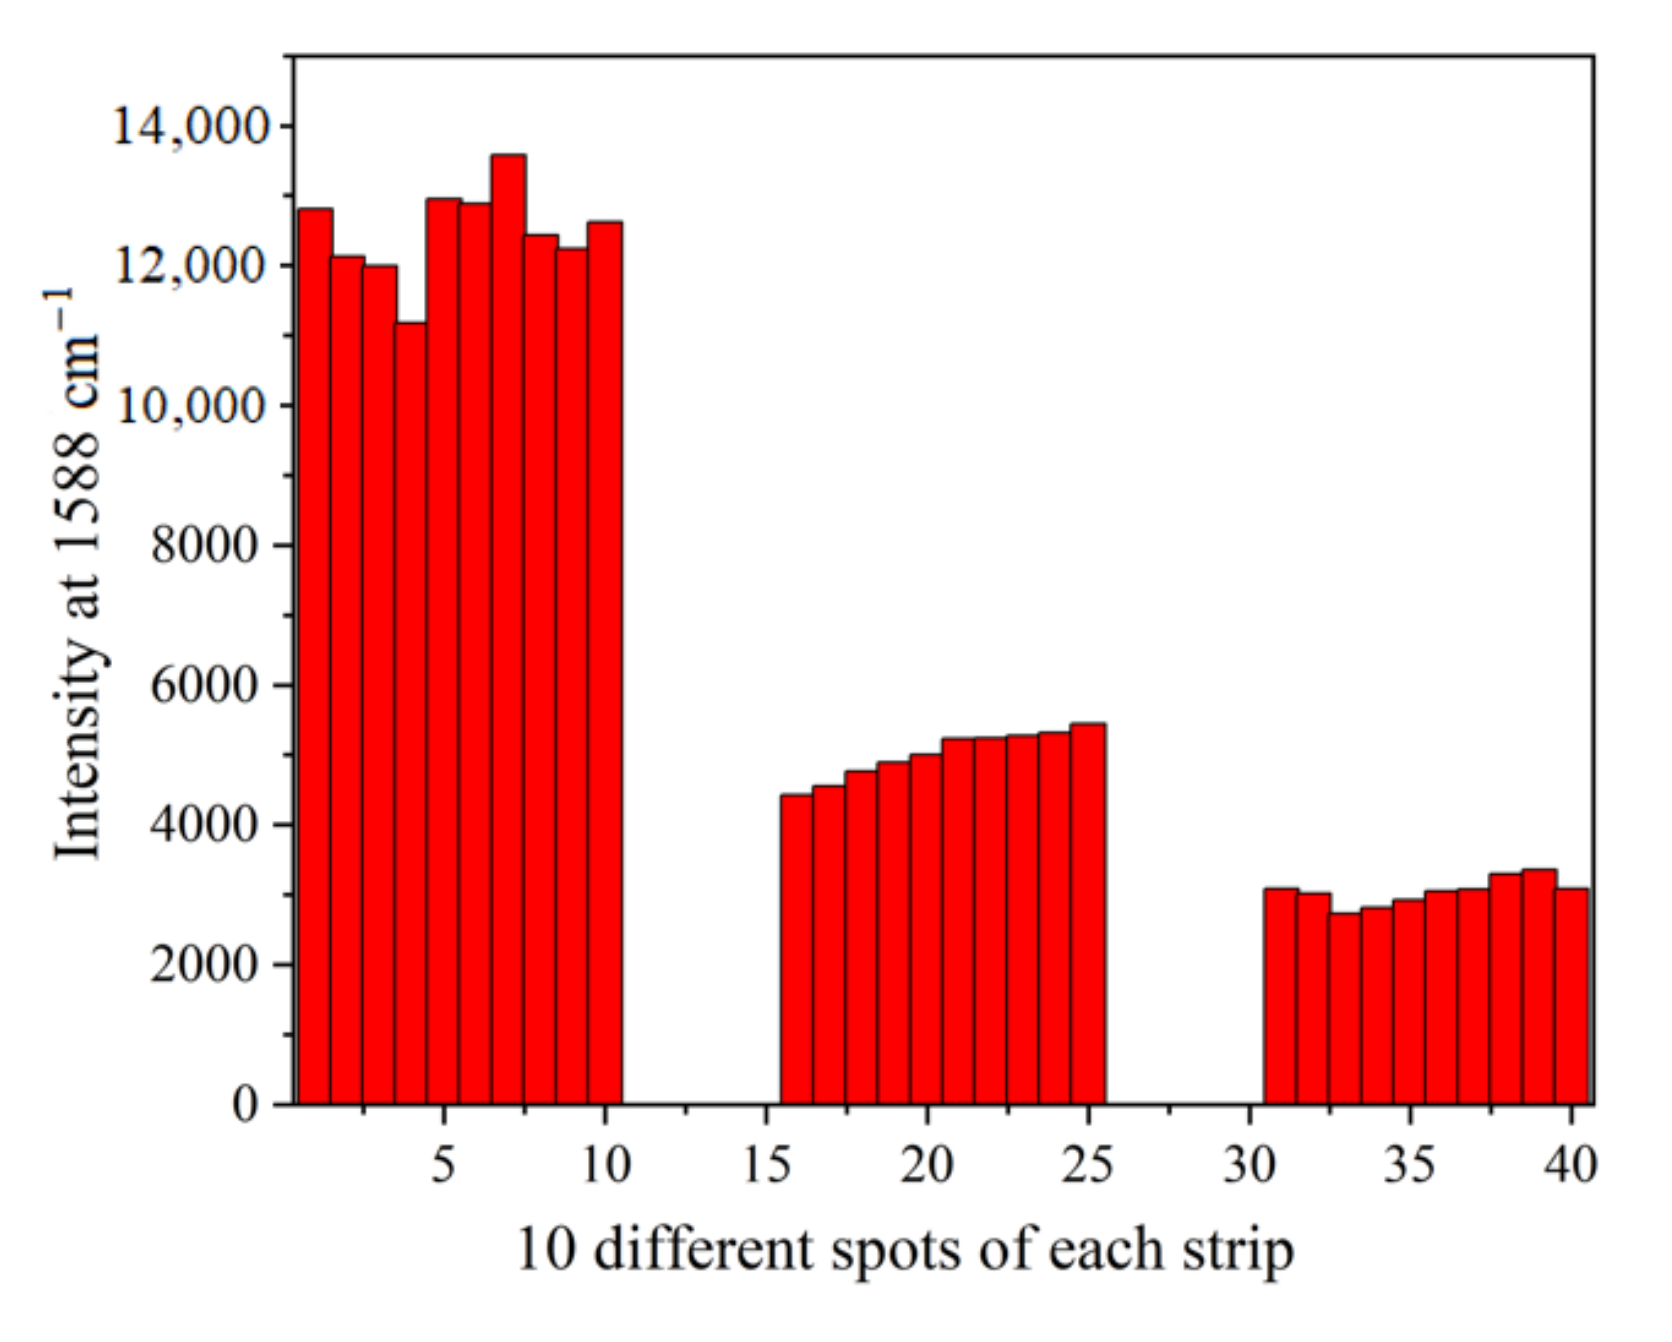
3.5. Reproducibility of SERS Intensities
3.6. Specificity of SERS-LFIA
3.7. Detection of 5-FU in Spiked Samples
3.8. Real Samples Analysis
4. Conclusions
Author Contributions
Funding
Institutional Review Board Statement
Informed Consent Statement
Data Availability Statement
Conflicts of Interest
Sample Availability
References
- Goffin, E.; Jacques, N.; Musumeci, L.; Nchimi, A.; Oury, C.; Lancellotti, P.; Pirotte, B. Synthesis of ticagrelor analogues be-longing to 1,2,3-triazolo[4,5-d] pyrimidines and study of their antiplatelet and antibacterial activity. Eur. J. Med. Chem. 2020, 208, 112767. [Google Scholar] [CrossRef] [PubMed]
- Rashid, H.; Martines, M.; Duarte, A.P.; Jorge, J.; Rasool, S.; Muhammad, R.; Ahmad Umar, N.M.N. Research developments in the syntheses, antiinflammatory activities and structure–activity relationships of pyrimidines. RSC Adv. 2021, 11, 6060–6098. [Google Scholar] [CrossRef] [PubMed]
- Broto, M.; McCabe, R.; Galve, R.; Marco, M.P. High throughput immunoassay for the therapeutic drug monitoring of tegafur. Analyst 2017, 142, 2404–2410. [Google Scholar] [CrossRef] [PubMed]
- Sabatini, L.; Barbieri, A.; Tosi, M.; Violante, F.S. A new high-performance liquid chromatographic/electrospray ionization tandem mass spectrometric method for the simultaneous determination of cyclophosphamide, methotrexate and 5-fluorouracil as markers of surface contamination for occupational exposure monitoring. J. Mass. Spectrom. 2005, 40, 669–674. [Google Scholar] [CrossRef] [PubMed]
- Dyhl-Polk, A.; Vaage-Nilsen, M.; Schou, M.; Vistisen, K.K.; Lund, C.M.; Kumler, T.; Appel, J.M.; Nielsen, D.L. Incidence and risk markers of 5-fluorouracil and capecitabine cardiotoxicity in patients with colorectal cancer. Acta Oncol. 2020, 59, 475–483. [Google Scholar] [CrossRef]
- Kosmas, C.; Kallistratos, M.S.; Kopterides Syrios, P.J.; Skopelitis, H.; Mylonakis, N.; Karabelis, A.; Tsavaris, N.J. Cardiotoxicity of xuoropyrimidines in diVerent schedules of administration: A prospective study. Cancer Res. Clin. Oncol. 2008, 134, 75–82. [Google Scholar] [CrossRef]
- Cesar, I.C.; Cunha, G.F.; Byrro, R.M.D.; Coelho, L.G.V.; Pianetti, G.A. A rapid HPLC-ESI-MS/MS method for determination of dihydrouracil/uracil ratio in plasma: Evaluation of toxicity to 5-flurouracil in patients with gastrointestinal cancer. Ther. Drug Monit. 2012, 34, 59–66. [Google Scholar] [CrossRef]
- Buechel, B.; Rhyn, P.; Schürch, S.; Buehr, C.; Amstutz, U.; Largiader, C.R. LC-MS/MS method for simultaneous analysis of uracil, 5,6-dihydrouracil, 5-Fluorouracil and 5-fluoro-5,6-dihydrouracil in human plasma for therapeutic drug monitoring and toxicity prediction in cancer patients. Biomed. Chromatogr. 2013, 27, 7–16. [Google Scholar] [CrossRef]
- Maring, J.G.; Schouten, L.; Greijdanus, B.; de Vries, E.G.E.; Uges, D.R.A. A simple and sensitive fully validated HPLC-UV method for the determination of 5-fluorouracil and its metabolite 5.6-dihydrofluorouracil in plasma. Ther. Drug Monit. 2005, 27, 25–30. [Google Scholar] [CrossRef] [Green Version]
- Alanazi, F.K.; Haq, N.; Radwan, A.A.; Alsarra, I.A.; Shakeel, F. Development and validation of UHPLC-DAD method for the determination of cholesteryl-hexahydrophthaloyl-5-fluorouracil in lipid nanoemulsion. J. Anal. Chem. 2015, 70, 593–599. [Google Scholar] [CrossRef]
- Schlucker, S. Surface-enhanced Raman spectroscopy: Concepts and chemical applications. Angew. Chem. Int. Ed. 2014, 53, 4756–4795. [Google Scholar] [CrossRef]
- Weiss, A.; Haran, G. Time-dependent single-molecule Raman scattering as a probe of surface dynamics. J. Phys. Chem. B 2001, 105, 12348–12354. [Google Scholar] [CrossRef]
- Li, Q.; Wang, J.; Ding, Q.; Chen, M.; Ma, F. Coupling effect on charge-transfer mechanism of surface-enhanced resonance Raman scattering. J. Raman Spectrosc. 2017, 48, 560–569. [Google Scholar] [CrossRef]
- Qian, X.M.; Nie, S.M. Single-molecule and single-nanoparticle SERS: From fundamental mechanisms to biomedical applica-tions. Chem. Soc. Rev. 2008, 37, 912–920. [Google Scholar] [CrossRef] [PubMed]
- Sharma, B.; Frontiera, R.R.; Henry, A.-I.; Ringe, E.; Van Duyne, R.P. SERS: Materials, applications, and the future. Mater. Today 2012, 15, 16–25. [Google Scholar] [CrossRef]
- Liu, H.Q.; He, Y.N.; Cao, K.Z. Flexible surface-enhanced Raman scattering substrates: A review on constructions, applications, and challenges. Adv. Mater. Interfaces 2021, 8, 2100982. [Google Scholar] [CrossRef]
- Tran, V.; Walkenfort, B.; Kçnig, M.; Salehi, M.; Schlucker, S. Rapid, Quantitative, and ultrasensitive point-of-care testing: A portable SERS reader for lateral flow assays in clinical chemistry. Angew. Chem. Int. Ed. 2019, 58, 442–446. [Google Scholar] [CrossRef]
- Sun, Y.; Chen, H.; Ma, P.; Li, J.Y.; Zhang, Z.; Shi, H.; Zhang, X.D. In situ synthesis of graphene oxide/gold nanocomposites as ultrasensitive surface-enhanced Raman scattering substrates for clenbuterol detection. Anal. Bioanal. Chem. 2020, 412, 193–201. [Google Scholar] [CrossRef]
- Zhu, Z.; Meng, H.; Liu, W.; Liu, X.; Gong, J.; Qiu, X.; Jiang, L.; Wang, D.; Tang, Z. Superstructures and SERS Properties of Gold Nanocrystals with Different Shapes. Angew. Chem. Int. Ed. 2011, 50, 1593–1596. [Google Scholar] [CrossRef]
- Huang, Y.; Yang, Y.; Chen, Z.; Li, X.; Nogami, M. Fabricating Au−Ag core-shell composite films for surface-enhanced Raman scattering. J. Mater. Sci. 2008, 43, 5390–5393. [Google Scholar] [CrossRef]
- Gantelius, J.; Bass, T.; Sjöberg, R.; Nilsson, P.; Andersson-Svahn, H. A Lateral flow protein microarray for rapid and sensitive antibody assays. Int. J. Mol. Sci. 2011, 12, 7748–7759. [Google Scholar] [CrossRef] [PubMed] [Green Version]
- Xie, Q.; Wu, Y.; Xiong, Q.; Xu, H.; Xiong, Y.; Liu, K.; Jin Lai, Y.W. Advantages of fluorescent microspheres compared with colloidal gold as a label in immunochromatographic lateral flow assays. Biosens. Bioelectron. 2014, 54, 262–265. [Google Scholar] [CrossRef]
- Taranova, N.A.; Berlina, A.N.; Zherdev, A.V.; Dzantiev, B.B. ‘Traffic light’ immunochromatographic test based on multicolor quantum dots for the simultaneous detection of several antibiotics in milk. Biosens. Bioelectron. 2015, 63, 255–261. [Google Scholar] [CrossRef] [PubMed]
- Juntunen, E.; Myyryläinen, T.; Salminen, T.; Soukka, T.; Pettersson, K. Performance of fluorescent europium(III) nanoparticles and colloidal gold reporters in lateral flow bioaffinity assay. Anal. Biochem. 2012, 428, 31–38. [Google Scholar] [CrossRef] [PubMed]
- Li, M.; Yang, H.; Li Zhao, S.K.; Li, J.; Jiang, D.; Sun, L.; Deng, A. Ultrasensitive and quantitative detection of a new beta-agonist phenylethanolamine A by a novel immunochromatographic assay based on surface-enhanced Raman scattering (SERS). J. Agric. Food Chem. 2014, 62, 10896–10902. [Google Scholar] [CrossRef] [PubMed]
- Rong, Z.; Xiao, R.; Xing, S.; Xiong, G.; Yu, Z.; Wang, L.; Jia, X.; Wang, K.; Cong, Y.; Wang, S. SERS-based lateral flow assay for quantitative detection of C-reactive protein as an early bioindicator of a radiation-induced inflammatory response in non-human primates. Analyst 2018, 143, 2115–2121. [Google Scholar] [CrossRef]
- Zhang, D.; Huang, L.; Liu, B.; Ni, H.; Sun, L.; Su, E.; Chen, H.; Gu, Z.; Zhao, X. Quantitative and ultrasensitive detection of multiplex cardiac biomarkers in lateral flow assay with core-shell SERS nanotags. Biosens. Bioelectron. 2018, 106, 204–211. [Google Scholar] [CrossRef] [PubMed]
- Kim, K.; Han, D.K.; Choi, N.; Kim, S.H.; Joung, Y.; Kim, K.; Ho, N.T.; Joo, S.W.; Choo, J. Surface-enhanced Raman scatter-ing-based dual-flow lateral flow assay sensor for the ultrasensitive detection of the thyroidStimulating hormone. Anal. Chem. 2021, 93, 6673–6681. [Google Scholar] [CrossRef]
- Hassanain, W.A.; Spoors, J.; Johnson, C.L.; Faulds, K.; Keegan, N.; Graham, D. Rapid ultra-sensitive diagnosis of clostridium difficile infection using a SERS-based lateral flow assay. Analyst 2021, 146, 4495–4505. [Google Scholar] [CrossRef]
- Wang, J.; Chen, Q.; Jin, Y.; Zhang, X.; He, L.; Zhang, W.; Chen, Y. Surface enhanced Raman scattering-based lateral flow immunosensor for sensitive detection of aflatoxin M1 in urine. Anal. Chim. Acta 2020, 1128, 184–192. [Google Scholar] [CrossRef]
- Deng, D.; Yang, H.; Liu, C.; Zhao, K.; Li, J.; Deng, A. Ultrasensitive detection of Sudan I in food samples by a quantitative immunochromatographic assay. Food Chem. 2019, 277, 595–603. [Google Scholar] [CrossRef] [PubMed]
- Kim, K.; Kashefi-Kheyrabadi, L.; Joung, Y.; Kim, K.; Dang, H.; Chavan, S.G.; Lee, M.-H.; Choo, J. Recent advances in sensitive surface-enhanced Raman scattering-based lateral flow assay platforms for point-of-care diagnostics of infectious diseases. Sens. Actuat. B. Chem 2021, 329, 129214. [Google Scholar] [CrossRef]
- Wang, L.; Wang, X.; Cheng, L.; Ding, S.; Wang, G.; Choo, J.; Chen, L. SERS-based test strips: Principles, designs and applications. Biosens. Bioelectron. 2021, 189, 113360. [Google Scholar] [CrossRef]
- Xiao, R.; Lu, L.; Rong, Z.; Wang, C.; Peng, Y.; Wang, F.; Wang, J.; Sun, M.; Dong, J.; Wang, D.; et al. Portable and multiplexed lateral flow immunoassay reader based on SERS for highly sensitive point-of-care testing. Biosens. Bioelectron. 2020, 168, 112524. [Google Scholar] [CrossRef] [PubMed]
- Frens, G. Controlled nucleation for the regulation of the particle size in monodisperse gold suspensions. Nat. Phys. Sci. 1973, 241, 20–22. [Google Scholar] [CrossRef]
- Bruzzone, S.; Arrighini, G.P.; Guidotti, C. Electromagnetic response behavior of binary metallic nanoparticles: A comparison of results from a few models of different schematicity. Mater. Sci. Eng. 2003, 23, 191–200. [Google Scholar] [CrossRef]
- Lee, J.J.; Beumer, J.H.; Chu, E. Therapeutic drug monitoring of 5 fluorouracil. Cancer Chemother. Pharmacol. 2016, 78, 447–464. [Google Scholar] [CrossRef] [PubMed]
- Vishnu, S.K.D.; Ranganathan, P.; Rwei, S.; Pattamaprom, C.; Kavitha, T.; Sarojini, P. New reductant-free synthesis of gold nanoparticles-doped chitosan-based semi-IPN nanogel: A robust nanoreactor for exclusively sensitive 5-fluorouracil sensor. Int. J. Biol. Macromol. 2020, 148, 79–88. [Google Scholar] [CrossRef]
- Gui, R.; Wan, A.; Jin, H. Facile synthesis of quantum dots/mesoporous silica/ quantum dots core/shell/shell hybrid micro-spheres for ratiometric fluorescence detection of 5-fluorouracil in human serum. Analyst 2013, 138, 5956–5964. [Google Scholar] [CrossRef]
- Rahimi-Nasrabadi, M.; Ahmadi, F.; Beigizadeh, H.; Karimi, M.S.; Sobhani-Nasab, A.; Joseph, Y.; Ehrlich, H.; Ganjali, M.R. A modified sensitive carbon paste electrode for 5-fluorouracil based using a composite of praseodymium erbium tungstate. Microchem. J. 2020, 154, 104654. [Google Scholar] [CrossRef]
- Wang, J.M.; Qu, X.L.; Zhao, L.M.; Yan, B. Fabricating Nanosheets and Ratiometric Detection of 5-Fluorouracil by Covalent Organic Framework Hybrid Material. Anal. Chem. 2021, 93, 4308–4316. [Google Scholar] [CrossRef] [PubMed]
- Chang, T.H.; Chang, Y.C.; Chen, C.M.; Chuang, K.W.; Chou, C.M. A facile method to directly deposit the large-scale Ag nanoparticles on a silicon substrate for sensitive, uniform, reproducible and stable SERS substrate. J. Alloys Compd. 2019, 782, 887–892. [Google Scholar] [CrossRef]
- Ganesan, M.; Ramadhass, K.D.; Chuang, H.C.; Gopalakrishnan, G. Synthesis of nitrogen-doped carbon quantum dots@Fe2O3/multiwall carbon nanotubes ternary nanocomposite for the simultaneous electrochemical detection of 5-fluorouracil, uric acid, and xanthine. J. Mol. Liq. 2021, 331, 115768. [Google Scholar] [CrossRef]
- Sun, X.Y.; Zhang, H.J.; Zhao, X.Y.; Sun, Q.; Wang, Y.Y.; Gao, E.Q. Dual functions of pH-sensitive cation Zr-MOF for 5-Fu: Large drug-loading capacity and high-sensitivity fluorescence detection. Dalton Trans. 2021, 50, 10524–10532. [Google Scholar] [CrossRef]


| Detection Method | Linear Range (ng mL−1) | Detection Limit (ng mL−1) | Reference |
|---|---|---|---|
| Electrochemical sensor | 13–64,000 | 3.9 | [38] |
| Ratiometric PL sensor | 0–130 | 2.6 | [39] |
| Square wave voltammetry | 1.3–6500 | 127.4 | [40] |
| Ratiometric fluorescence detection | 13–130,000 | 8.38 | [41] |
| SERS | 1300–130,000 | 1300 | [42] |
| Electrochemical detection | 65–15,600 | 2.47 | [43] |
| Fluorescence detection | 0–13,000 | 304.2 | [44] |
| SERS-LFIA | 0.0001–100 | 0.0044 | This work |
| Compound | Chemical Structure | IC50 (ng mL−1) | CR (%) |
|---|---|---|---|
| 5-Fluorouracil |  | 0.021 | 100 |
| Cytosine |  | 0.475 | 4.40 |
| Tegafur | 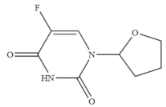 | 0.706 | 2.96 |
| Carmofur | 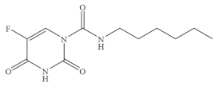 | 0.523 | 4.00 |
| Thymine | 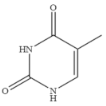 | >100 | <0.01 |
| Capecitabine | 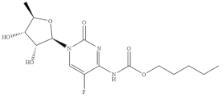 | >100 | <0.01 |
| Uracil | 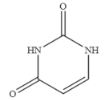 | >100 | <0.01 |
| 5-Bromouracil | 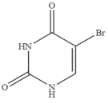 | >100 | <0.01 |
| 5-Fluoro-2’-deoxyuridine | 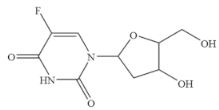 | >100 | <0.01 |
| 5-Fluoro-1,3-dimethyluracil | 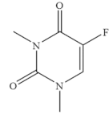 | >100 | <0.01 |
| Uridine | 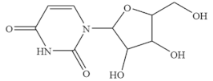 | >100 | <0.01 |
| 5-Bromo-2’-deoxyuridine | 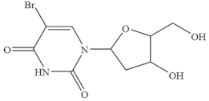 | >1000 | <0.001 |
| Gimeracil |  | >1000 | <0.001 |
| Conc. Spiked (ng mL−1) | Conc. Measured (ng mL−1) (Mean ± SD, n = 3) | RSD (%) | Recovery (%) |
|---|---|---|---|
| 0.01 | (0.786 ± 0.034) ×10−2 | 4.42 | 78.6 |
| 0.1 | (0.863 ± 0.028) ×10−1 | 3.27 | 86.4 |
| 1 | 0.805 ± 0.021 | 2.69 | 80.6 |
| No. of Sample | LC-MS/MS (ng/g) | SERS-LFIA | |
|---|---|---|---|
| Mean ± SD (ng/g) | CV (%) (n = 3) | ||
| 1 | 1160.5 | 1296.6 ± 98.5 | 7.6 |
| 2 | 315.7 | 344.5 ± 31.6 | 9.2 |
| 3 | 643.6 | 626.6 ± 42.6 | 6.8 |
| 4 | 3961.3 | 3210.7 ± 157.3 | 4.9 |
| 5 | 644.7 | 744.8 ± 55.9 | 7.5 |
Publisher’s Note: MDPI stays neutral with regard to jurisdictional claims in published maps and institutional affiliations. |
© 2022 by the authors. Licensee MDPI, Basel, Switzerland. This article is an open access article distributed under the terms and conditions of the Creative Commons Attribution (CC BY) license (https://creativecommons.org/licenses/by/4.0/).
Share and Cite
Liu, H.; Liu, Y.; Zhou, T.; Zhou, P.; Li, J.; Deng, A. Ultrasensitive and Specific Detection of Anticancer Drug 5-Fluorouracil in Blood Samples by a Surface-Enhanced Raman Scattering (SERS)-Based Lateral Flow Immunochromatographic Assay. Molecules 2022, 27, 4019. https://doi.org/10.3390/molecules27134019
Liu H, Liu Y, Zhou T, Zhou P, Li J, Deng A. Ultrasensitive and Specific Detection of Anticancer Drug 5-Fluorouracil in Blood Samples by a Surface-Enhanced Raman Scattering (SERS)-Based Lateral Flow Immunochromatographic Assay. Molecules. 2022; 27(13):4019. https://doi.org/10.3390/molecules27134019
Chicago/Turabian StyleLiu, Hanwen, Ying Liu, Ting Zhou, Penghui Zhou, Jianguo Li, and Anping Deng. 2022. "Ultrasensitive and Specific Detection of Anticancer Drug 5-Fluorouracil in Blood Samples by a Surface-Enhanced Raman Scattering (SERS)-Based Lateral Flow Immunochromatographic Assay" Molecules 27, no. 13: 4019. https://doi.org/10.3390/molecules27134019
APA StyleLiu, H., Liu, Y., Zhou, T., Zhou, P., Li, J., & Deng, A. (2022). Ultrasensitive and Specific Detection of Anticancer Drug 5-Fluorouracil in Blood Samples by a Surface-Enhanced Raman Scattering (SERS)-Based Lateral Flow Immunochromatographic Assay. Molecules, 27(13), 4019. https://doi.org/10.3390/molecules27134019