Article

Carbon Quantum Dots from Pomelo Peel as Fluorescence Probes for “Turn-Off–On” High-Sensitivity Detection of Fe3+ and L-Cysteine

1
School of Light Industry, Beijing Technology and Business University, 11 Fucheng Road, Beijing 100048, China
2
School of Food and Health, Beijing Technology and Business University, 11 Fucheng Road, Beijing 100048, China
*
Authors to whom correspondence should be addressed.
Molecules 2022, 27(13), 4099; https://doi.org/10.3390/molecules27134099
Submission received: 18 April 2022 / Revised: 15 June 2022 / Accepted: 24 June 2022 / Published: 25 June 2022
(This article belongs to the Section Photochemistry)

Abstract

:
This study designed a “turn-off–on” fluorescence analysis method based on carbon quantum dots (CQDs) to detect metal ions and amino acids in real sample systems. CQDs were derived from green pomelo peel via a one-step hydrothermal process. The co-doped CQDs with N and S atoms imparted excellent optical properties (quantum yield = 17.31%). The prepared CQDs could be used as fluorescent “turn-off” probes to detect Fe3+ with a limit of detection of 0.086 µM, a linear detection range of 0.1–160 µM, and recovery of 83.47–106.53% in water samples. The quenched CQD fluorescence could be turned on after adding L-cysteine (L-Cys), which allowed detection of L-Cys with a detection limit of 0.34 µM and linear range of 0.4–85 µM. Recovery of L-Cys in amino acid beverage was 87.08–122.74%. Visual paper-based testing strips and cellulose/CQDs composite hydrogels could be also used to detect Fe3+ and L-Cys.

1. Introduction

Since their initial discovery in 2004, carbon quantum dots (CQDs) have drawn great attention and been widely used as novel carbon-based nanomaterials. Typically, most CQDs are spherical nanoparticles; the average diameter is usually less than 10 nm [1]. In the past 10 years, CQDs have attracted great attention because of their superior properties of low toxicity, good biocompatibility and light resistance, easy surface modification, and environmental friendliness [2], providing good potential for use in applications, such as drug delivery, sensing, biological imaging, fluorescent inks, catalysis, and light-emitting diodes [3,4,5]. The obvious advantages of green chemistry have stimulated the great potential of CQDs in synthesis and application, making them an indispensable part of carbon nanomaterials. To date, many CQDs have been synthesized from biomass, such as candle root, Prunus avium fruit, and garlic [6,7,8]. Recently, heteroatom-doped CQDs have gradually emerged into the field of carbon-based nanomaterials because they can effectively adjust the composition of surface groups and change optical properties [9,10]. However, the quantum yield (QY) of one or two heteroatom-doped CQDs from biomass materials is very low, which complicates the practical application of CQDs. Therefore, there remains an urgent need for methods of large-scale preparation of high-QY biomass CQDs.
Currently, CQDs with optosensing capabilities are attracting widespread attention from researchers. In consideration of the fluorescence intensity changes in CQDs during the analysis and detection process, CQDs have been used as sensitive analytical fluorescent nanoprobes to detect certain metal ions (Cu2+, Ag+, Fe3+, Hg2+) and amino acids [11,12,13,14]. Such applications are important because low levels of some heavy metal ions may cause serious physiological problems in the human body [15]. In particular, Fe3+ is abundant in the human body as an essential element. L-Cysteine (L-Cys) is a common and significant amino acid in living organisms and the only one among more than 20 common amino acids that contains a thiol moiety. Because of its important physiological functions, it has promising application prospects in biopharmaceuticals, the food industry, animal feed, and the cosmetics industry [16,17]. The traditional detection methods of Fe3+ and L-Cys were mainly large-scale instrument chromatographic analysis methods [18,19,20]. However, in general, these methods have several limitations of time-consuming pretreatments, complex operations, complicated detection processes, and relatively expensive instruments. Thus, there remains a need for a facile, rapid, inexpensive, highly sensitive, and selective analytical method for simultaneous analysis of Fe3+ and L-Cys. Recently, Huang et al. prepared red-emitting CQDs co-doped with nitrogen–boron–sulfur to detect Ag+ and L-Cys in living cells and complex biological fluids [11]. Yan et al. constructed a simple sensing system based on fluorescence switching of CQDs for Hg2+ and L-Cys analysis [12]. Zong and co-workers developed an “off–on” fluorescent CQD probe to detect Cu2+ and L-Cys in aqueous solution [13]. Recently, Sun’s group achieved a sensitive “on–off–on” model for Hg2+ and L-Cys detection using nitrogen–sulfur (N-S) co-doped CQDs prepared from gardenia fruit [21]. However, the low toxicity and high QY of CQDs is still a problem that we urgently need to improve.
Herein, we describe the innovative design of CQDs with a specific and sensitive fluorescence “turn-off–on” mode, which could be used for sensitive and simple determination of Fe3+ and L-Cys. N-S co-doped CQDs were prepared via a one-step hydrothermal method using waste green pomelo peel as a precursor. The prepared N–S co-doped CQDs could be used as efficient fluorescent “turn-off” probes for Fe3+ detection with high selectivity, low LOD, and wide linear detection range. Interestingly, the quenched fluorescence could be “turned-on” after adding L-Cys, which could provide a high-selectivity and -sensitivity detection method for L-Cys in real samples. In addition, visual paper-based testing stripes and cellulose/CQDs composite hydrogels with N–S co-doped CQDs had also been used for Fe3+ and L-Cys detection in the solid state according to the change in color and off–on fluorescence.

2. Results and Discussion

2.1. Optimization of the Preparation Conditions of CQDs

The detection pathway for Fe3+ and L-Cys based on CQDs’ fluorescent switch is shown in Scheme 1. Carbon sources play a very significant role in the preparation of the CQDs and there are many carbon sources for the preparation of CQDs. So far, CQDs synthesized from different carbon sources have been reported. Taking into account the low toxicity of CQDs and the cost of source, biomass and its derivatives have attracted extensive attention because of their outstanding performance in availability, reproducibility, and low cost. Navel orange peel, orange peel, and pomelo peel from the citrus genus of Rutaceae were used as the carbon sources for the CQDs preparation in the study (Figure S1A–C). It was interesting that CQDs derived from pomelo peel had better fluorescence intensity than navel orange peel and orange peel (Figure S1D). In addition, the effects of different solvents on CQDs’ fluorescence intensities were conducted to explore by H2O, C2H6O, CH3COOH, and phosphate buffer solution (PBS). It is obvious from Figure S2A that the CQDs have the highest fluorescence response in aqueous solution. Then, the optimum concentration of CQDs in aqueous solution was optimized (Figure S2B). The CQDs aqueous solution (0.01 mg mL−1) obtained under the optimized conditions was used for further study.

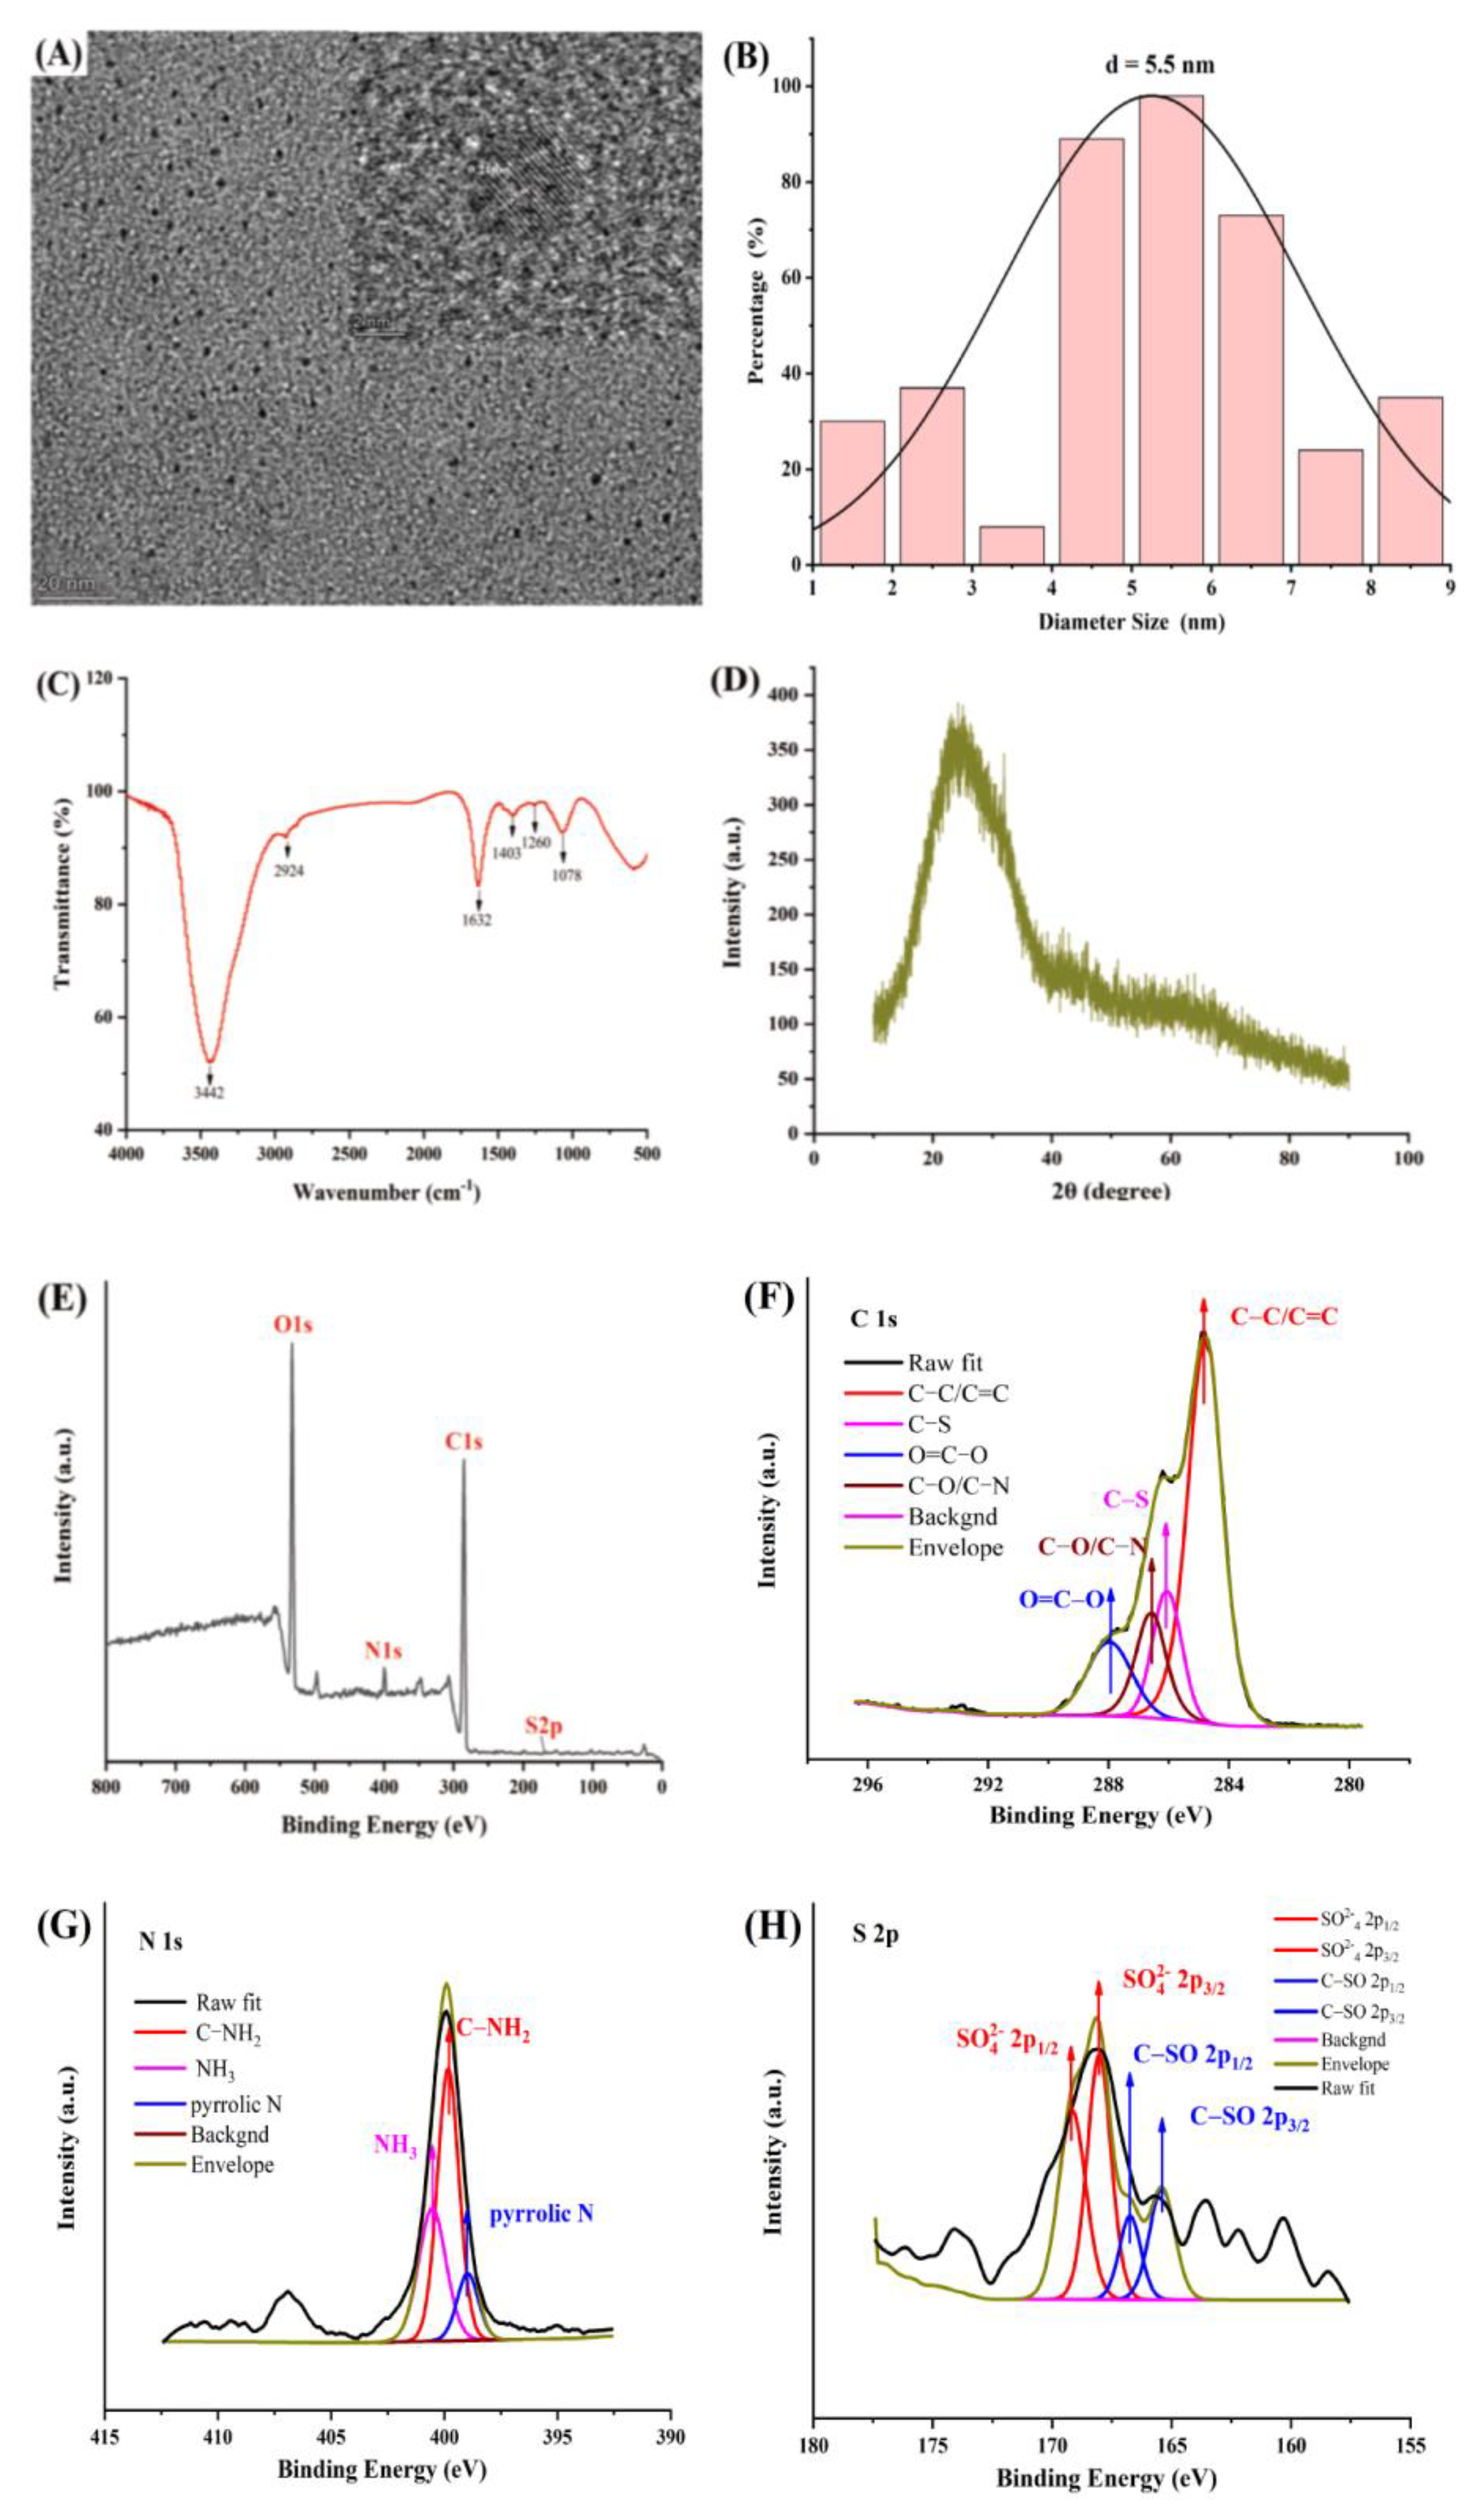
2.2. Characterization

Figure 1A showed the particle sizes and shapes of CQDs, which were obtained by TEM analysis. The TEM images showed that the prepared CQDs were uniformly distributed and could be well dispersed in aqueous solutions without apparent aggregation. High-resolution TEM images further exhibited the CQDs with a graphitic structure of clear lattice fringes about 0.21 nm. Figure 1B shows that the synthesized CQDs were not very uniform in shape, with a size range of about 1.2–8.4 nm. The average particle size of CQDs was about 5.5 nm based on 100 random nanoparticles. Typical XRD patterns of CQDs (Figure 1D) displayed highly disordered carbon structure with a center of broad diffraction peak at 22.1° [22].
The functional group information of CQDs was obtained through FTIR spectroscopy (Figure 1C). The strong bands at 3442 cm−1 and 2924 cm−1 correspond to the N–H and –CH2 group characteristic vibrational bands on the surface of CQDs, respectively [23,24]. The peaks at 1520–1720 cm−1 were attributed to the C=O groups’ stretching vibration [25]. An obvious band at 1403 cm−1 was derived from the COO stretching vibration [26]. The band at 1260 cm−1 was attributed to C–N groups [27]. A stretching vibration peak at 1078 cm−1 resulted from –SO42− bands [28]. All these absorption peaks indicated that N and S were successful at doping on the CQD surface.
The elemental composition of CQDs was determined by XPS (Figure 1E). There were four obvious peaks of 532.5, 399.9, 284.9, and 186.5 eV on the XPS spectrum, representing the presence of O1s, N1s, C1s, and S2p on the CQD surface. According to the XPS data, the elemental composition of the CQDs was 67.96% C, 4.03% N, 27.81% O, and 0.2% S. As shown in Figure 1F, four peaks at 288, 286.5, 286.1, and 284.7 eV in the high-resolution C1s spectrum, represented O=C–O, C–O/C–N, C–S, and C–C/C=C bonds, respectively [29,30]. As shown in Figure 1G, three peaks appeared at 400.5, 399.8, and 399 eV on the N1s spectrum, implying the pyrrolic N, C–NH2, and NH3, respectively [31]. There were two main components at 165.4 and 168 eV on the S2p spectrum (Figure 1H), exhibiting that S was on the CQD surface. The deconvolution peaks at 165.4 eV were attributed to –C–S–O bond; other components at 168 eV are attributed to sulfur oxides [32]. The XPS and FTIR spectra features confirmed that N and S were successfully co-doped in the CQDs, and some relevant functional groups existed on the CQD surface, such as amino, carboxyl, carbonyl, and hydroxyl groups.

2.3. Optical Properties of CQDs

The UV absorption and fluorescence spectrometry of the CQDs were investigated. As shown in Supporting Information Figure S3A, the UV spectrum contained two typical peaks at 282 nm and 317 nm. The former was attributed to the n-π* electronic transition of the C=O bands of carboxyl groups on the surface of CQDs, while the latter was assigned to modification of other components on the CQD surface [33,34]. The fluorescence excitation and emission spectra of CQDs’ aqueous solution are shown in blue and red lines in Figure S3A. The optimal emission wavelength of the CQDs was about 410 nm under the excitation wavelength, about 310–350 nm. The CQDs’ aqueous solution was brown under natural light while it exhibited a bright blue fluorescence under the excitation of a UV light at 365 nm (Inserted Figure S3A). Accordingly, the excitation wavelength of CQDs was further optimized in Figure S3B. The emission wavelength showed no evident shift at 410 nm when the excitation wavelength of CQDs was set in a range of 300 to 360 nm. The fluorescence intensity gradually enhanced and then decreased rapidly, and the inflection point with the greatest fluorescence intensity occurred at 330 nm. Therefore, we chose 330 nm as the maximum excitation wavelength (Figure S3B).
The optical stability of the prepared CQDs was further evaluated at ambient temperature and under UV light to evaluate the potential practical application. The preliminary experimental results showed that the CQDs had good fluorescence stability after storage at ambient temperature for 30 days (Figure S4A). In addition, the prepared CQDs had good resistance to photobleaching, the fluorescence intensity of CQDs was almost unaffected after 90 min of continuous irradiation at 365 nm (Figure S4B). The CQDs also maintained constant fluorescence intensity over a broad pH range, increasing from 3 to 10 (Figure S4C). The salt tolerance of CQDs was also investigated, in ultrahigh-concentration NaCl (up to 1.0 M) solution, and the CQDs still had strong fluorescence intensity, indicating that CQDs possess the advantage of salt tolerance (Figure S4D). The absolute QY of the CQDs reached 17.31% (Table S1). Therefore, the prepared CQDs still had good stability under extremely harsh conditions, which was beneficial to the potential applications in sensing and analysis.

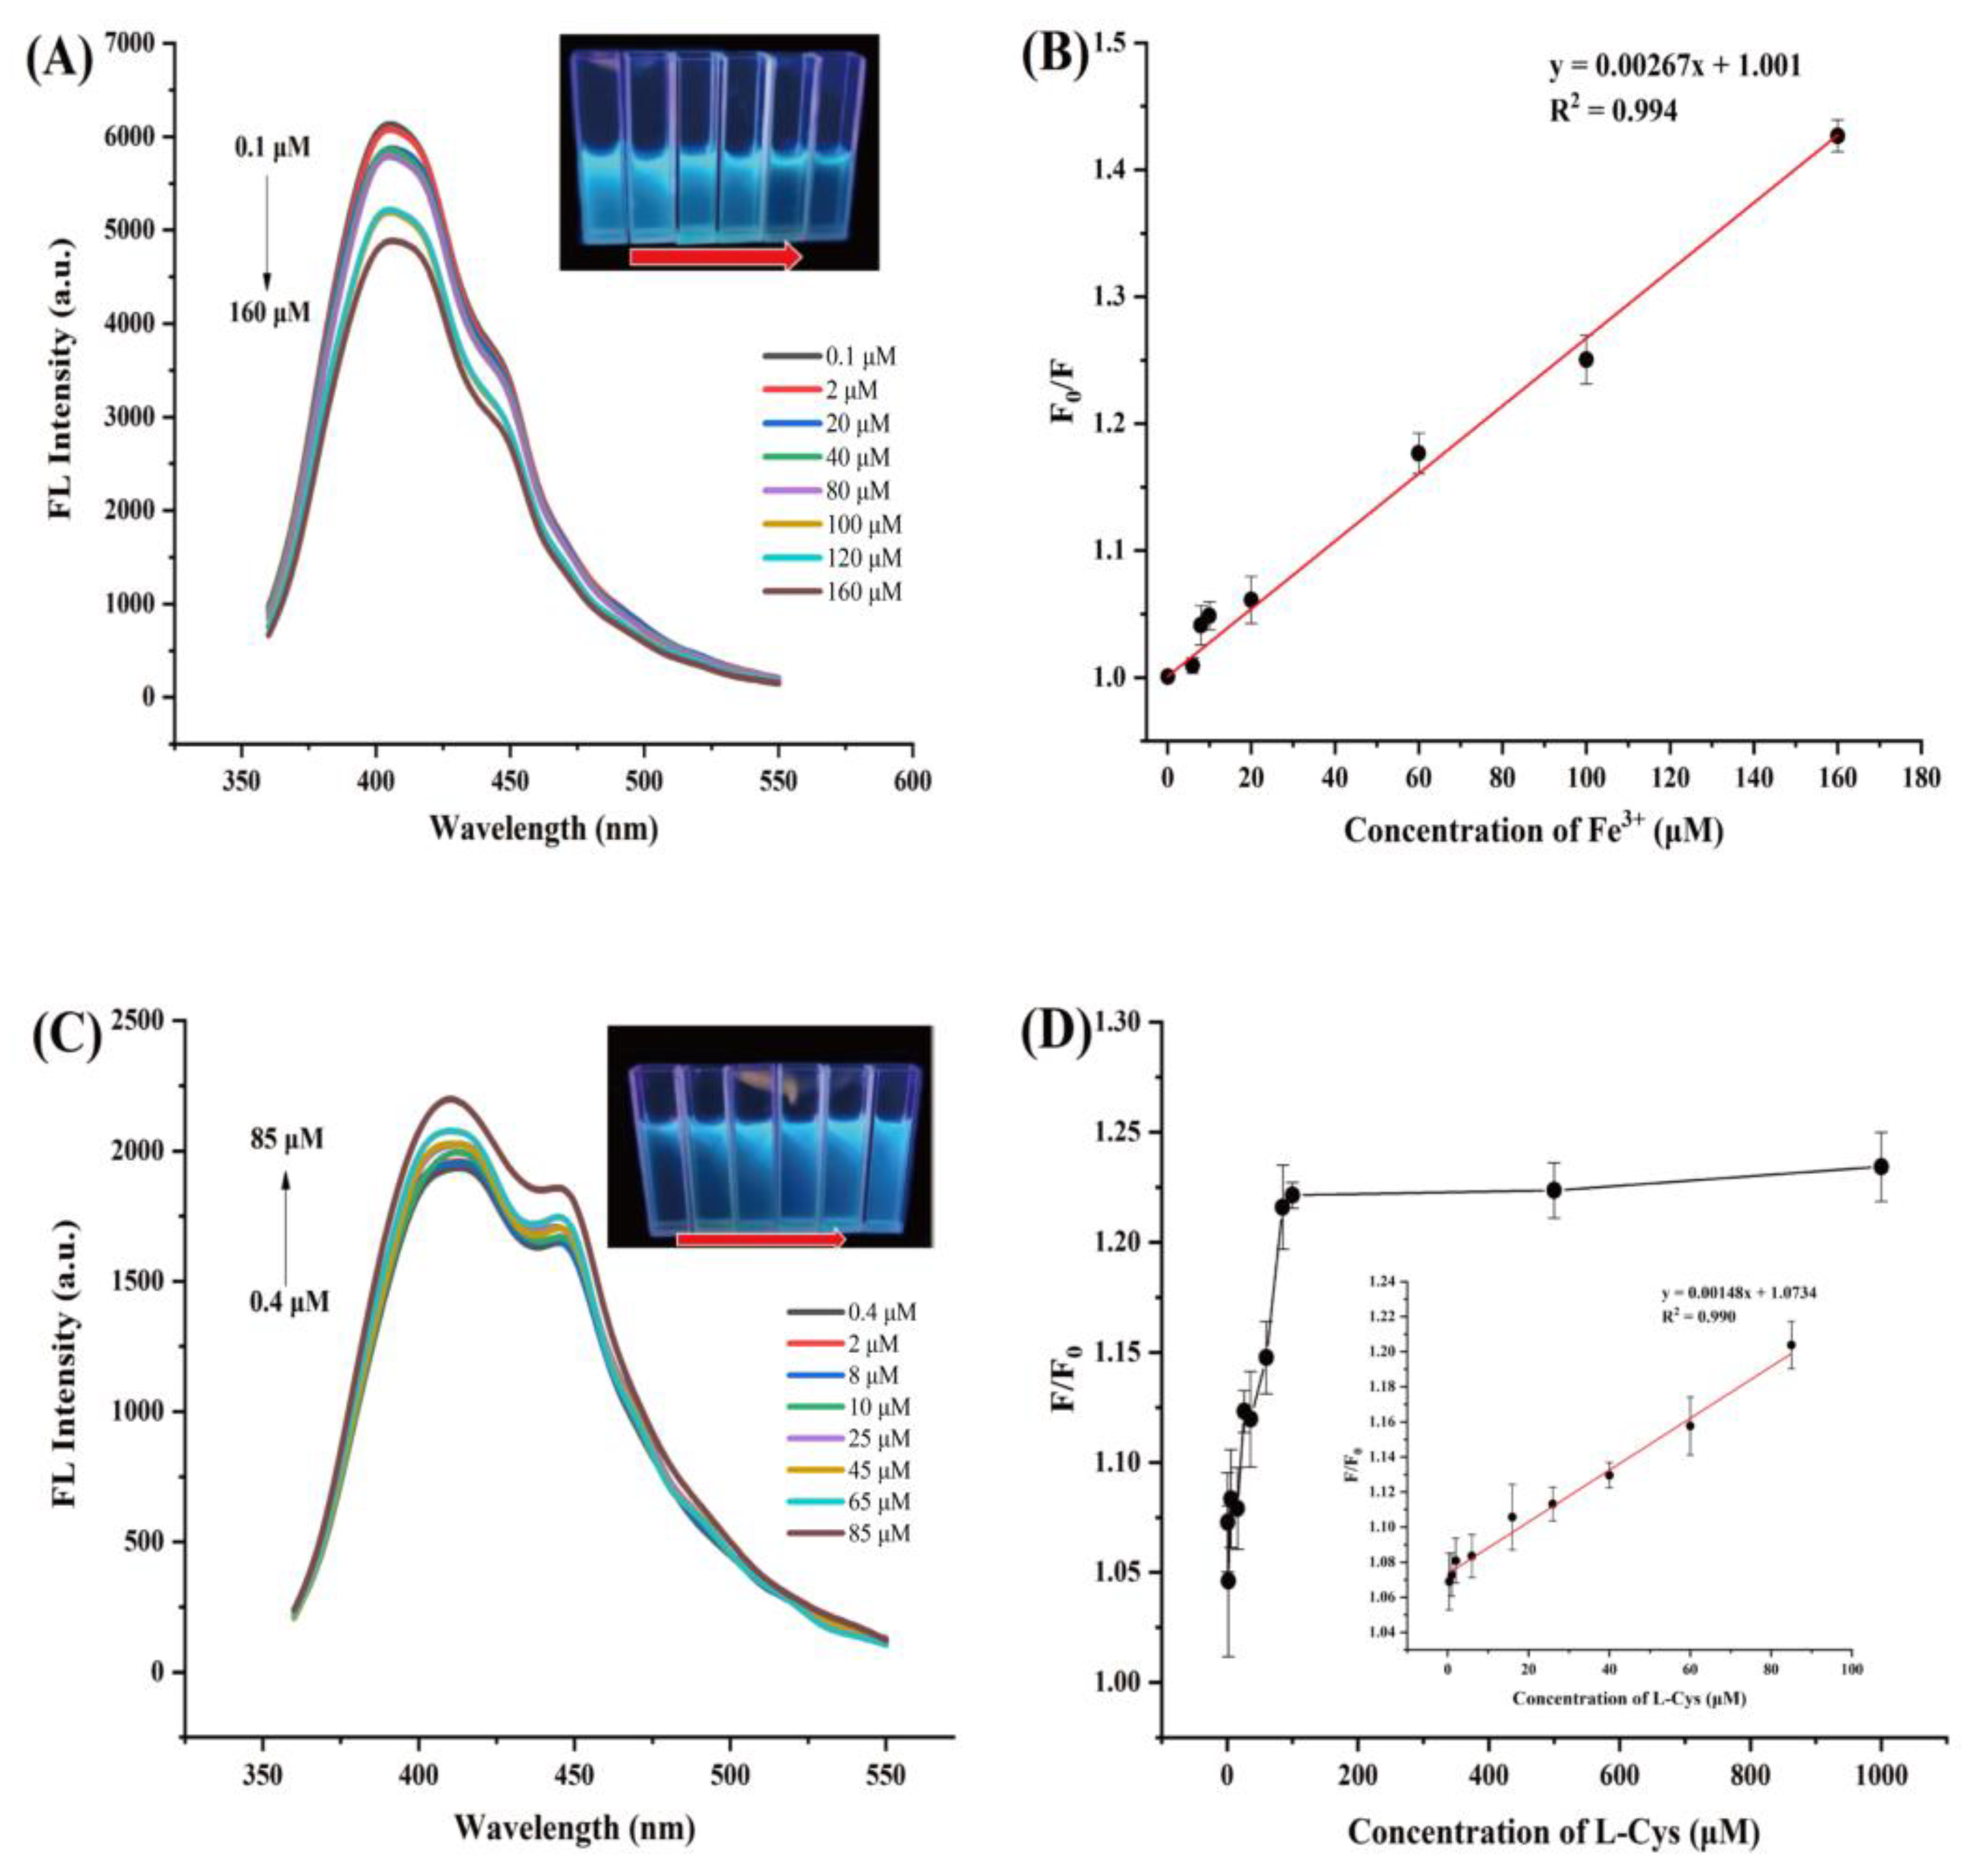
2.4. Selectivity and Sensitivity

There were fifteen common metal ions used in the interference experiments to evaluate the selectivity and sensitivity of CQDs. The fluorescence intensities of CQDs containing different metal ions are studied in Figure 2A. In order to evaluate the specificity and feasibility of prepared CQDs for the detection of Fe3+, the fluorescence responses of various potentially interfering metal ions to the CQDs/Fe3+ system at a constant concentration were investigated (Figure 2B). The concentration of other metal ions was twice and five-times that of Fe3+, as shown in Figure S5. These studies showed that only Fe3+ could effectively decrease the fluorescence intensity of the CQD aqueous solution. This more prominent selectivity for Fe3+ is possibly caused by the much stronger interaction of Fe3+ with the CQDs than the other 14 cations. The result was intriguing, which gave us some inspiration for Fe3+ detection using the “turn-off” CQDs. However, after introducing L-Cys into the CQDs/Fe3+ system, the fluorescence intensity was recovered. Other amino acids were also tested at the same time, and it was apparent that their fluorescence recovery extent was inferior to L-Cys (Figure 2C). The selectivity of homocysteine and glutathione based on the CQDs/Fe3+ system for L-cysteine was also studied (Figure S6). Accordingly, we designed a “circular pattern” by using CQD solutions containing 15 common metal ions (Figure 2D). Under UV light, the white circular pattern in daylight exhibited a blue fluorescence except in the presence of Fe3+. Thus, the CQDs/Fe3+ system could be successfully applied to L-Cys analysis as a “turn-on” fluorescence probe. The changes in CQD fluorescence intensity during the proposed sensing process is shown in Scheme 1.

2.5. Optosensing of Fe3+ and L-Cys

To evaluate the detection performance of the prepared CQDs, fluorescence intensity was used as the evaluation index to reflect various Fe3+ concentrations from 0.1 to 160 µM. Figure 3A shows that the fluorescence response of CQDs gradually decreased when the Fe3+ concentration increased. In addition, the insert in Figure 3A shows that after irradiation with UV light, the blue light of CQD aqueous solution vanished with the increasing concentration of Fe3+. The linear range of Fe3+ detection was further investigated by the changes in fluorescence intensity of CQDs (Figure 3B). In a range of 0.1–60 μM, an obvious linear relationship was obtained with a good correlation coefficient (R2 = 0.994). The linear equation was fitted as y = 0.00267x + 1.001. The LOD was calculated as 0.086 µM, according to Equation (1) [12,35]:
LOD = 3σ/s
where σ is the relative standard deviation of the blank NCD sample recorded (N = 10) and s is the slope of the linear calibration curve.
Notably, the fluorescence signal of CQDs was gradually recovered when L-Cys was added from a concentration of 0.4 to 1000 mM (Figure 3C). The insert in Figure 3C shows that after irradiation with UV light, the blue light in the CQDs/Fe3+ aqueous solutions obviously recovered by increasing the content of L-Cys. Figure 3D shows the correlation of the relative fluorescence intensity of CQDs with a concentration of L-Cys from 0.4 to 1000 mM. The relative fluorescence intensity of N/S-CQDs showed a good linear relationship with the concentration of L-Cys between 0.4 and 85 µM (Inserted in Figure 3D). An appropriate correlation coefficient was obtained by R2 of 0.990. The fitted linear equation is y = 0.00148x + 1.0734. The LOD for L-Cys was 0.34 µM calculated by the same method as Fe3+ detection.
In order to further evaluate the practicability of the “turn-off–on” assay, the CQDs were applied to the detection of Fe3+ in laboratory tap water and L-Cys in amino acid beverage samples. Neither of the two samples contained the target to be measured. The recovery was calculated as difference before and after adding standard targets of 10, 30, and 60 μM, which was 83.47–106.53% and 87.08–122.74% in Table S2. The results demonstrated the feasibility of the developed CQD probe for Fe3+ and L-Cys detection in a complex matrix. The feasibility, reliability, and application potential of the CQD-based optosensing for detection of targets were demonstrated.
The repeatability of the CQDs/Fe3+ system for the L-Cys detection is shown in Table S3. Six repeated measurements showed no significant differences in the study. That is to say, the established detection method has good reproducibility.

2.6. Possible Mechanism of “Turn-Off–On” Mode

The photoluminescence quenching process is complex, usually including static and dynamic quenching. In this study, CQDs displayed a “turn-off–on” mode when adding Fe3+ and L-Cys into CQDs aqueous solution. When Fe3+ was added, the fluorescence intensity of CQDs was reduced (Scheme 1), which may be due to the coordination of S-containing groups of CQDs with Fe3+ to form Fe3+-S bonds [36]. However, the CQD fluorescence recovered after adding L-Cys into the CQDs/Fe3+ mixture, which may be caused by stronger binding interaction between Fe3+ and L-Cys, meaning that Fe3+ can be desorbed from the CQD surface. The fluorescence-sensing process can be studied with the experiments of UV absorption spectroscopy and fluorescence lifetime measurement. As shown in Figure 4A, the characteristic absorption peak of CQDs was obviously red shifted from 318 to 328 nm in the presence of Fe3+, indicating that Fe3+ formed a complex with the CQDs. However, under the presence of L-Cys, the absorption peaks for the CQDs recovered to their original positions, which confirmed the removal of Fe3+ on the CQD surface. Interestingly, an average fluorescence lifetime for the aqueous CQDs solution was 1.19 ns (Figure 4B), which was essentially the same as the lifetimes for the CQDs/Fe3+ system (1.22 ns) and after adding L-Cys to the system (1.20 ns). These results suggested that the fluorescence-quenching mechanism was static fluorescence quenching in these processes. Combined, these results suggested that the developed CQDs could be applied as bifunctional probes for Fe3+ and L-Cys recognition.

2.7. Visualization Cellulose/CQDs Composite Hydrogels and Test Paper

Cellulose/CQDs composite hydrogels and CQD-based strip-type test papers (Figure 5) were prepared using simple blending and coating processes. The composite hydrogels and CQD-based test papers had good biocompatibility and biodegradability because they were composed of cellulose and CQDs. After the addition of Fe3+ (Figure 5), the cellulose/CQDs hydrogels and CQD-based test papers showed color changes and drop-offs in fluorescence. Surprisingly, the cellulose/CQDs hydrogels and CQD-based test papers then showed obvious color recovery with the addition of L-Cys. Therefore, cellulose/CQDs hydrogels and CQD-based test papers could act as optical sensors for Fe3+ and L-Cys. Compared with aqueous solutions of CQDs, the CQD-based hydrogels and test papers were easier to operate and use, and, therefore, had broader application prospects. More importantly, both cellulose/CQDs hydrogels and CQD-based test papers were environmentally friendly and disposable. All these findings suggested that the prepared CQDs had great potential for applications as bifunctional sensors for recognition of Fe3+ and L-Cys.

3. Materials and Methods

3.1. Materials

Green pomelo, navel orange, and tangerine were purchased from a fruit shop in Beijing, China. CoCl2, Ba(NO3)2, AgCl, MgCl2, CuSO4, NaCl, CaCl2, ZnCl2, CdCl2, NiCl2, and FeSO4·6H2O were acquired from Tianjin Chemical Reagent (Tianjin, China). MnCl2, FeCl3·6H2O, and AlCl3·6H2O were obtained from Aladdin (Shanghai, China). The 15 amino acids used in the study were obtained from Alfa Aesar (Tianjin, China) Chemical. 1-Allyl-3-methylimidazolium chloride (AmimCl) ionic liquid was acquired from Sigma-Aldrich (St. Louis, MO, USA). Dialysis bags (1000 Da molecular weight cutoff, MWCO) were supplied by MYM Biological Technology (Hyderabad, India). All reagents and chemicals used in the experiments were of analytical grade and not further purified. Tap water sample was obtained from our laboratory.

3.2. Instruments

All fluorescence spectra were obtained by Synergy H1 full-function microplate reader (BioTek, Winooski, VT, USA). Transmission electron microscopy (TEM, FEI, Thermo Fisher Scientific, Waltham, MA, USA) images were obtained using a Talos F200X electron microscope. Fourier transform infrared (FTIR, Nicolet Instruments, Thermo Fisher Scientific, Waltham, MA, USA) spectra (400–4000 cm−1) were obtained on IS10 spectrometer. X-ray photoelectron spectroscopy (XPS, Thermo Fisher Scientific, Waltham, MA, USA) was carried out by ESCALAB 250Xi spectrometer. Fluorescence lifetime was recorded via FLS1000 fluorescence spectrometer (Edinburgh Instruments, Livingston, UK). X-ray diffraction (XRD, Bruker, Karlsruhe, Germany) analysis using a D8 ADVANCE instrument using Cu Kα (λ = 0.15405 nm).

3.3. Synthesis of CQDs

The CQDs were derived via one-step hydrothermal method using waste green pomelo peel as the carbon source. Dried green pomelo peel was ground into powder in the mortar and 0.5 g of powder was dispersed in deionized water of 50 mL. We transferred the mixture to the polytetrafluoroethylene-lined stainless steel autoclave of 100 mL. After heating for 5 h at 180 °C, we cooled to ambient temperature naturally and the suspension was centrifuged at 10,000 rpm for 10 min to obtain a yellow-brown supernatant. It was then filtered through a 0.22 um cellulose filter membrane and dialyzed for 24 h using deionized water (MWCO: 1000 Da); deionized water was changed every 8 h. Subsequently, the CQDs were obtained by evaporation of the solvent and placed in a vacuum drying oven for further drying.
For comparison, navel orange peel and tangerine peel were selected as alternative raw materials to synthesize CQDs. The same experimental steps were repeated, and the corresponding tests of fluorescence intensity were performed.

3.4. QY of CQDs

The QY of the obtained CQDs was determined by comparison method with a reference substance of quinine sulfate (QY = 56% in 0.1 M H2SO4) [37]. The QYCQDs was calculated according to Equation (2):
QYCQDs = QYR × (FCQDS/FR)(AR/ACQDs)(ηRCQDs),
where F represents the integral of the fluorescence intensity, A is the absorbance at the excitation wavelength, η represents the refractive index of the solvent (1.33 for water), and subscript R represents the reference substance quinine sulfate.

3.5. Fluorescence Stability of CQDs

To evaluate fluorescence stability of the CQDs in different solvents, the CQDs were dispersed in deionized water, ethanol, acetic acid, and PBS buffer, respectively. We added aliquots of these solutions (200 μL) to 96-well plates to measure the fluorescence intensity. For a continuous investigation of fluorescence stability, the fluorescence intensity of CQDs was measured every 3 days for 30 days at ambient temperature. The effect of different irradiation time (5, 10, 20, 30, 40, 50, 60, 70, 80, 90 min) with ultraviolet (UV) light was performed in a UV light box at 356 nm. The effect of different pH values on fluorescence intensity was investigated from 3 to 10. Aliquots (100 μL) NaCl solutions of different concentrations (10, 20, 50, 100, 150, 200, 300, 400, 500 mM) were added into 100 μL of CQD solution, respectively, and the fluorescence intensities were recorded.

3.6. Selectivity and Interference Measurements of CQDs

In the selectivity experiment, 100 μL of CQD (0.01 mg·mL−1) solution was added to the 96-well plate. Aliquots of individual metal ion solution (Mg2+, Ag+, Zn2+, Cd2+, Co2+, Na+, Al3+, Fe2+, Fe3+, Cu2+, Ni2+, Ca2+, Mn2+, and Ba2+, 100 μL, 1 mM) were, respectively, mixed with CQD solution, then the fluorescence intensity was measured. We then added 100 μL of Fe3+ solution to the CQDs solution and measured the fluorescence intensity again. The interference of metal ions on Fe3+ detection by CQDs was determined by the relative fluorescence intensities in the CQD solution containing different metal ions before and after adding Fe3+ solution.

3.7. Sensitive Detection of Fe3+ and L-Cys

In the Fe3+ detection experiment, 100 μL of Fe3+ solutions of different concentrations (0.1–160 µM) was added into aqueous CQD (100 μL, 0.01 mg·mL−1) solutions, then 100 μL aliquots of different metal ions (1 mM) were added into the CQD solutions for comparison. Furthermore, the states of the CQDs in Fe3+ solutions with different concentrations were recorded under sunlight and UV light.
We added 100 μL of L-Cys solutions (0.4–1 mM) to the mixed solutions of CQDs (100 μL, 0.01 mg·mL−1) and Fe3+ (100 μL, 4 × 10⁻⁴ mol·L−1) for L-Cys detection. After sufficient mixing, we recorded the fluorescence intensities immediately (equilibration time 10 s). The fluorescence intensities of all samples in the experiment were recorded in a wavelength range of 360–700 nm and the excitation wavelength was 330 nm. The optical behavior of the CQDs in the presence of the mixture was recorded under sunlight and UV light.
Tests were also performed with other amino acids in the mixture of CQDs and Fe3+ under the same conditions. Measurements of sensitivity and selectivity were repeated three times.

3.8. Fe3+ and L-Cys Detection in Real Samples

Fe3+ was dissolved into the tap water to give different concentrations of 50, 100, and 400 µM for detection (excitation at 360 nm). For L-Cys detection, the amino acid beverage sample was diluted 100 times and then mixed with CQD solution containing Fe3+. Aliquots (200 μL) of 10, 30, and 60 μM mixtures of amino acid beverage sample were added into 96-well plates for detection (excitation at 360 nm).

3.9. Preparation of Cellulose/CQDs Composite Hydrogels

The Cotton pulp (2.5 g) was mixed into 100 g of AmimCl and stirred vigorously at 80 °C to obtain a homogeneous solution, then placed in a vacuum oven for 4 h to remove air bubbles. The solution was then poured slowly into a 12-well plate, which was subsequently put into an AmimCl/H2O (v/v = 1/1) coagulation bath for 24 h. We completely removed AmimCl ionic liquid by ethanol/H2O (v/v = 1/1). The prepared cellulose hydrogels were soaked in CQD aqueous solution for 24 h to obtain CQD composite hydrogels.

3.10. Preparation of CQD-based Test Papers

The aqueous solution of CQDs was brushed onto strip-type filter papers, which were previously treated with dimethylformamide to remove the luminescent substances. The fluorescein-free filter paper was soaked overnight in the CQD aqueous solution. The solvent was evaporated thoroughly to obtain the CQD-based test papers. Fe3+ solution and L-Cys were dripped onto the filter papers and a digital photo of the test papers was acquired in a UV light box (365 nm).

4. Conclusions

Food waste biomass was utilized to prepare CQDs as a simple, low-toxicity dual probe for Fe3+ and L-Cys detection. The CQDs were prepared from green pomelo peel via a one-step hydrothermal method using green pomelo peels as the precursor. After co-doped with N and S atoms, the resultant CQD solutions showed excellent optical properties, good fluorescence stabilities, and high QYs, up to 17.31%. The blue-emission CQD-based “turn-off–on” fluorescent probes with high selectivity and sensitivity were developed and employed for detection of Fe3+ and L-Cys. The detection limit for Fe3+ was 0.086 µM with a linear detection range of 0.1–160 µM, and the LOD for L-Cys was 0.34 µM with a linear detection range of 0.4–85 µM. Notably, common metal ions and amino acids did not interfere with the Fe3+ and L-Cys detection. These traits were attributed to the sorption of Fe3+ on the CQD surface and desorption of Fe3+ from the CQDs via the stronger bonding of L-Cys. Therefore, low-toxicity CQDs can be considered as promising candidates for visual optical sensing in practical sample analysis. Furthermore, cellulose/CQDs composite hydrogels and CQD-based test papers also showed good responsiveness to Fe3+ and L-Cys. The proposed CQD probes utilize a simple “turn-off–on” fluorescent mode, providing a high-efficiency platform for ideal analytical applications in food and environmental science.

Supplementary Materials

The following supporting information can be downloaded at: https://www.mdpi.com/article/10.3390/molecules27134099/s1, Figure S1: (A) Fluorescence intensity of CQDs from navel orange peel, (B) fluorescence intensity of CQDs from orange peel, (C) fluorescence intensity of CQDs from pomelo peel, (D) fluorescence intensity of CQDs from different carbon sources; Figure S2: (A) Effect of different solvents on fluorescence intensity of CQDs, (B) effect of different concentration on fluorescence intensity of CQDs.; Figure S3: (A) UV absorption spectrum and fluorescence spectra of the optimal excitation and emission of the CQDs. Insert: Photograph of CQDs under the excitation of natural light and UV lamp with 365 nm. (B) Fluorescence emission spectra of the CQDs with a series of excitation wavelengths; Figure S4: (A) The continuous fluorescence intensity measurements of CQDs aqueous solutions in 30 days. (B) Fluorescence stability of CQDs in aqueous solution with different irradiation time by UV light. (C) Fluorescence intensity of CQD aqueous solutions at different pH values. (D) Fluorescence stability of CQDs after the addition of different concentrations of NaCl; Table S1: Parameters of fluorescence quantum yield of CQDs; Table S2: Recoveries of Fe3+ and L-Cys from spiked water and amino acid beverage samples; Table S3: The repeatability of the CQDs-Fe3+ system for L-Cys detection.

Author Contributions

D.Z.: Probe synthesis, data analysis and writing—original draft and editing. F.Z.: Characterization, fluorescence stability, selectivity sensitivity and data analysis. Y.L.: Conceptualization, supervision and data analysis. F.W.: Fe3+ and L-Cys detection in real samples, preparation of cellulose/CQDs composite hydrogels and CQD-based test papers. H.L.: Manuscript review & editing and data analysis. All authors have read and agreed to the published version of the manuscript.

Funding

This research was funded by the National Natural Science Foundation of China (No. 31822040), the National Key R&D Program of China (No. 2018YFC1602300), and Supported by the Research Foundation for Youth Scholars of Beijing Technology and Business University (QNJJ2021-11).

Institutional Review Board Statement

Not applicable.

Informed Consent Statement

Not applicable.

Data Availability Statement

Not applicable.

Conflicts of Interest

The authors declare no conflict of interest.

Sample Availability

Samples of the compounds are available from the authors.

References

  1. Xu, X.; Ray, R.; Gu, Y.; Ploehn, H.J.; Gearheart, L.; Raker, K.; Scrivens, W.A. Electrophoretic analysis and purification of fluorescent single-walled carbon nanotube fragments. J. Am. Chem. Soc. 2004, 126, 12736–12737. [Google Scholar] [CrossRef] [PubMed]
  2. Lim, S.Y.; Shen, W.; Gao, Z.Q. Carbon quantum dots and their applications. Chem. Soc. Rev. 2015, 44, 362–381. [Google Scholar] [CrossRef] [PubMed]
  3. Sun, S.; Zhang, L.; Jiang, K.; Wu, A.; Lin, H. Toward high-efficient red emissive carbon dots: Facile preparation, unique properties, and applications as multifunctional theranostic agents. Chem. Mater. 2016, 28, 8659–8668. [Google Scholar] [CrossRef]
  4. Wang, Y.; Zhu, Y.; Yu, S.; Jiang, C. Fluorescent carbon dots: Rational synthesis, tunable optical properties and analytical applications. RSC Adv. 2017, 7, 40973–40989. [Google Scholar] [CrossRef] [Green Version]
  5. Zhu, X.; Yuan, X.; Han, L.; Liu, H.; Sun, B. A smartphone-integrated optosensing platform based on red-emission carbon dots for real-time detection of pyrethroids. Biosens. Bioelectron. 2021, 191, 113460. [Google Scholar] [CrossRef]
  6. Hutton, G.A.M.; Reuillard, B.; Martindale, B.C.M.; Caputo, C.A.; Lockwood, C.W.J.; Butt, J.N.; Reisner, E. Carbon dots as versatile photosensitizers for solar-driven catalysis with redox enzymes. J. Am. Chem. Soc. 2016, 138, 16722–16730. [Google Scholar] [CrossRef] [Green Version]
  7. Kumar, P.; Bohidar, H.B. Physical and fluorescent characteristics of non-functionalized carbon nanoparticles from candle soot. J. Nanopart. Res. 2012, 14, 948. [Google Scholar] [CrossRef]
  8. Zhao, S.; Lan, M.; Zhu, X.; Xue, H.; Ng, T.; Meng, X.; Lee, C.; Wang, P.; Zhang, W. Green synthesis of bifunctional fluorescent carbon dots from garlic for cellular imaging and free radical scavenging. ACS Appl. Mater. Interfaces 2015, 7, 17054–17060. [Google Scholar] [CrossRef]
  9. Wang, G.; Guo, Q.; Chen, D.; Liu, Z.; Zheng, X.; Xu, A.; Yang, S.; Ding, G. Facile and highly effective synthesis of controllable lattice sulfur-doped graphene quantum dots via hydrothermal treatment of durian. ACS Appl. Mater. Interfaces 2018, 10, 5750–5759. [Google Scholar] [CrossRef]
  10. Yuan, X.; Jiang, W.; Wang, J.; Liu, H.; Sun, B. High-performance multiporous imprinted microspheres based on N-doped carbon dots exfoliated from covalent organic framework for flonicamid optosensing. ACS Appl. Mater. Interfaces 2020, 12, 25150–25158. [Google Scholar] [CrossRef]
  11. Huang, S.; Yang, E.; Yao, J.; Liu, Y.; Xiao, Q. Red emission nitrogen, boron, sulfur co-doped carbon dots for “on-off-on” fluorescent mode detection of Ag+ ions and L-cysteine in complex biological fluids and living cells. Anal. Chim. Acta 2018, 1035, 192–202. [Google Scholar] [CrossRef] [PubMed]
  12. Yan, F.; Shi, D.; Zheng, T.; Yun, K.; Zhou, X.; Chen, L. Carbon dots as nanosensor for sensitive and selective detection of Hg2+ and L-cysteine by means of fluorescence “off-on” switching. Sens. Actuator B Chem. 2016, 224, 926–935. [Google Scholar] [CrossRef]
  13. Zong, J.; Yang, X.; Trinchi, A.; Hardin, S.; Cole, I.; Zhu, Y.; Li, C.; Muster, T.; Wei, G. Carbon dots as fluorescent probes for “off-on” detection of Cu2+ and L-cysteine in aqueous solution. Biosens. Bioelectron. 2014, 51, 330–335. [Google Scholar] [CrossRef] [PubMed]
  14. Zou, S.; Hou, C.; Fa, H.; Zhang, L.; Ma, Y.; Dong, L.; Li, D.; Huo, D.; Yang, M. An efficient fluorescent probe for fluazinam using N, S co-doped carbon dots from L-cysteine. Sens. Actuator B-Chem. 2017, 239, 1033–1041. [Google Scholar] [CrossRef]
  15. Lars, J. Hazards of heavy metal contamination. Br. Med. Bull. 2003, 68, 167–182. [Google Scholar]
  16. Liu, Y.; Lv, X.; Hou, M.; Shi, Y.; Guo, W. Selective fluorescence detection of cysteine over homocysteine and glutathione based on a cysteine-triggered dual michael addition/retro-aza-aldol cascade reaction. Anal. Chem. 2015, 87, 11475–11483. [Google Scholar] [CrossRef]
  17. Zhou, Y.; Yoon, J. Recent progress in fluorescent and colorimetric chemosensors for detection of amino acids. Chem. Soc. Rev. 2012, 41, 52–67. [Google Scholar] [CrossRef]
  18. Mashhadizadeh, M.H.; Azimi, M.S.; Pesteh, M.; Sheikhshoaei, I.; Ardakani, M.M.; Karimi, M.A. Flame atomic absorption spectrometric determination of μg amounts of Fe(III) ions after solid phase extraction using modified octadecyl silica membrane disks. Spectrochim. Acta Part B At. Spectrosc. 2008, 63, 889–892. [Google Scholar] [CrossRef]
  19. Matusch, A.; Depboylu, C.; Palm, C.; Wu, B.; Hoglinger, G.U.; Schafer, M.K.H.; Becker, J.S. Cerebral bioimaging of Cu, Fe, Zn, and Mn in the MPTP mouse model of Parkinson’s disease using laser ablation inductively coupled plasma mass spectrometry (LA-ICP-MS). J. Am. Soc. Mass Spectrom. 2010, 21, 161–171. [Google Scholar] [CrossRef] [Green Version]
  20. Zhang, W.; Li, P.; Geng, Q.; Duan, Y.; Guo, M.; Cao, Y. Simultaneous determination of glutathione, cysteine, homocysteine, and cysteinylglycine in biological fluids by ion-pairing high-performance liquid chromatography coupled with precolumn derivatization. J. Agric. Food Chem. 2014, 62, 5845–5852. [Google Scholar] [CrossRef]
  21. Sun, D.; Liu, T.; Wang, C.; Yang, L.; Yang, S.; Zhuo, K. Hydrothermal synthesis of fluorescent carbon dots from gardenia fruit for sensitive on-off-on detection of Hg2+ and cysteine. Spectrochim. Acta Part A Mol. Biomol. Spectrosc. 2020, 240, 118598. [Google Scholar] [CrossRef] [PubMed]
  22. Tian, T.; He, Y.; Ge, Y.; Song, G. One-pot synthesis of boron and nitrogen codoped carbon dots as the fluorescence probe for dopamine based on the redox reaction between Cr(VI) and dopamine. Sens. Actuator B Chem. 2017, 240, 1265–1271. [Google Scholar] [CrossRef]
  23. Yuan, F.; Wang, Z.; Li, X.; Li, Y.; Tan, Z.; Fan, L.; Yang, S. Bright multicolor bandgap fluorescent carbon quantum dots for electroluminescent light-emitting diodes. Adv. Mater. 2017, 29, 1604436. [Google Scholar] [CrossRef] [PubMed]
  24. Ensafi, A.A.; Sefat, S.H.; Kazemifard, N.; Rezaei, B.; Moradi, F. A novel one-step and green synthesis of highly fluorescent carbon dots from saffron for cell imaging and sensing of prilocaine. Sens. Actuator B Chem. 2017, 253, 451–460. [Google Scholar] [CrossRef]
  25. Yu, J.; Song, N.; Zhang, Y.; Zhong, S.; Wang, A.; Chen, J. Green preparation of carbon dots by Jinhua bergamot for sensitive and selective fluorescent detection of Hg2+ and Fe3+. Sens. Actuator B Chem. 2015, 214, 29–35. [Google Scholar] [CrossRef]
  26. Yang, R.; Guo, X.; Jia, L.; Zhang, Y.; Zhao, Z.; Lonshakov, F. Green preparation of carbon dots with mangosteen pulp for the selective detection of Fe3+ ions and cell imaging. Appl. Surf. Sci. 2017, 423, 426–432. [Google Scholar] [CrossRef]
  27. Zhang, H.; Huang, Y.; Hu, S.; Huang, Q.; Wei, C.; Zhang, W.; Kang, L.; Huang, Z.; Hao, A. Fluorescent probes for “off-on” sensitive and selective detection of mercury ions and L-cysteine based on graphitic carbon nitride nanosheets. J. Mater. Chem. C 2015, 3, 2093–2100. [Google Scholar] [CrossRef]
  28. Sun, C.; Zhang, Y.; Wang, P.; Yang, Y.; Wang, Y.; Xu, J.; Wang, Y.; Yu, W. Synthesis of nitrogen and sulfur co-doped carbon dots from garlic for selective detection of Fe3+. Nanoscale Res. Lett. 2016, 11, 110. [Google Scholar] [CrossRef] [Green Version]
  29. Li, L.; Yu, B.; You, T. Nitrogen and sulfur co-doped carbon dots for highly selective and sensitive detection of Hg(Ⅱ) ions. Biosens. Bioelectron. 2015, 74, 263–269. [Google Scholar] [CrossRef]
  30. Lan, M.; Zhang, J.; Chui, Y.; Wang, H.; Yang, Q.; Zhu, X.; Wei, H.; Liu, W.; Ge, J.; Wang, P.; et al. A recyclable carbon nanoparticle-based fluorescent probe for highly selective and sensitive detection of mercapto biomolecules. J. Mater. Chem. B 2015, 3, 127–134. [Google Scholar] [CrossRef]
  31. Jiao, Y.; Gao, Y.; Meng, Y.; Lu, W.; Liu, Y.; Han, H.; Shuang, S.; Li, L.; Dong, C. One-step synthesis of label-free ratiometric fluorescence carbon dots for the detection of silver ions and glutathione and cellular imaging applications. ACS Appl. Mater. Interfaces 2019, 11, 16822–16829. [Google Scholar] [CrossRef] [PubMed]
  32. Wang, H.; Lu, Q.; Hou, Y.; Liu, Y.; Zhang, Y. High fluorescence S, N co-doped carbon dots as an ultra-sensitive fluorescent probe for the determination of uric acid. Talanta 2016, 155, 62–69. [Google Scholar] [CrossRef] [PubMed]
  33. Ju, J.; Zhang, R.; He, S.; Chen, W. Nitrogen-doped graphene quantum dots-based fluorescent probe for the sensitive turn-on detection of glutathione and its cellular imaging. RSC Adv. 2014, 4, 52583–52589. [Google Scholar] [CrossRef]
  34. Venkateswarlu, S.; Viswanath, B.; Reddy, A.S.; Yoon, M.Y. Fungus-derived photoluminescent carbon nanodots for ultrasensitive detection of Hg2+ ions and photoinduced bactericidal activity. Sens. Actuator B Chem. 2018, 258, 172–183. [Google Scholar] [CrossRef]
  35. Wang, W.; Kim, T.; Yan, Z.; Zhu, G.; Cole, I.; Nam-Trung, N.; Li, Q. Carbondots functionalized by organosilane with double-sided anchoring for nanomolar Hg2+ detection. J. Colloid Interface Sci. 2015, 437, 28–34. [Google Scholar] [CrossRef]
  36. Lu, M.; Duan, Y.; Song, Y.; Tan, J.; Zhou, L. Green preparation of versatile nitrogen-doped carbon quantum dots from watermelon juice for cell imaging, detection of Fe3+ ions and cysteine, and optical thermometry. J. Mol. Liq. 2018, 269, 766–774. [Google Scholar] [CrossRef]
  37. Jiang, W.; Zhao, Y.; Zhang, D.; Zhu, X.; Liu, H.; Sun, B. Efficient and robust dual modes of fluorescence sensing and smartphone readout for the detection of pyrethroids using artificial receptors bound inside a covalent organic framework. Biosens. Bioelectron. 2021, 194, 113582. [Google Scholar] [CrossRef]
Scheme 1. The detection principle for Fe3+ and L-Cys based on CQDs.
Molecules 27 04099 sch001
Figure 1. (A) TEM images of CQDs, insert: high-resolution TEM images of CQDs. (B) The size distribution histogram of CQDs. (C) FT−IR of CQDs. (D) XRD of CQDs. (E) XPS of CQDs. (FH) High-resolution spectra of C1s, N1s, and S2p for the CQDs.
Molecules 27 04099 g001
Figure 2. (A) Influences of metal ions (1 mM) on fluorescence intensity of CQDs. (B) Influences of metal ions (1 mM) on fluorescence intensity of CQDs/Fe3+ system. (C) Influences of amino acids (1 mM) on fluorescence intensity of CQDs/Fe3+/L-Cys system. (D) Selectivity experiments under sunlight and UV light (365 nm, red arrow is consistent with the abscissa of Figure 2A).
Molecules 27 04099 g002
Figure 3. (A) Fluorescence spectra of CQDs (0.01 mg/mL) with various Fe3+ concentrations of 0.1–160 µM. Insert: photograph of CQDs with Fe3+ solutions under UV light (concentrations of Fe3+ are 0.1, 6, 10, 20, 100, and 160 μM; follow red arrow). (B) Relationship of F0/F and Fe3+ concentration. (C) Fluorescence spectra of CQDs/Fe3+ systems of different concentrations of L-Cys. Insert: image of CQDs/Fe3+ aqueous solutions treated with different concentrations of L-Cys under UV light (concentrations of L-Cys are 0.4, 6, 16, 26, 40, and 85 µM; follow red arrow). (D) Relationship of F0/F and L-Cys concentration. Insert: Linear relationship between F0/F of CQDs and concentration of L-Cys from 0.4 µM to 85 µM.
Molecules 27 04099 g003
Figure 4. (A) UV-vis spectra and (B) fluorescence spectra of CQDs, CQDs/Fe3+, and CQDs/Fe3+/L-Cys.
Molecules 27 04099 g004
Figure 5. Photographs of the cellulose/CQD composite hydrogels and CQD-based test papers for the colorimetric and fluorescent detection of L-Cys under irradiation of sunlight and UV light (365 nm).
Molecules 27 04099 g005
Publisher’s Note: MDPI stays neutral with regard to jurisdictional claims in published maps and institutional affiliations.

