Article

Removal of Carbamazepine in Aqueous Solution by CoS2/Fe2+/PMS Process

1
Women’s Hospital, School of Medicine, Zhejiang University, Hangzhou 310006, China
2
Zhejiang Key Laboratory of Drinking Water Safety and Distribution Technology, Zhejiang University, Hangzhou 310058, China
3
WISDRI Engineering and Research Incorporation Limited, No.33, Daxueyuan Rd., Wuhan 430070, China
4
Ocean College, Zhejiang University, Hangzhou 310058, China
*
Authors to whom correspondence should be addressed.
Molecules 2022, 27(14), 4524; https://doi.org/10.3390/molecules27144524
Submission received: 20 June 2022 / Revised: 6 July 2022 / Accepted: 12 July 2022 / Published: 15 July 2022
(This article belongs to the Special Issue Advanced Oxidation Processes for Removal of Emerging Pollutants)

Abstract

:
Carbamazepine (CBZ), as a typical pharmaceutical and personal care product (PPCP), cannot be efficiently removed by the conventional drinking water and wastewater treatment process. In this work, the CoS2/Fe2+/PMS process was applied for efficient elimination of CBZ. The CBZ removal efficiency of CoS2/Fe2+/PMS was 2.5 times and 23 times higher than that of CoS2/PMS and Fe2+/PMS, respectively. The intensity of DMPO-HO• and DMPO- SO 4 followed the order of Fe2+/PMS < CoS2/PMS < CoS2/Fe2+/PMS, also suggesting the CoS2/Fe2+/PMS process has the highest oxidation activity. The effects of reaction conditions (e.g., CoS2 dosage, Fe2+ concentration, PMS concentration, initial CBZ concentration, pH, temperature) and water quality parameters (e.g., SO 4 2 , NO 3 , H 2 PO 4 , Cl , NH 4 + , humic acid) on the degradation of CBZ were also studied. Response surface methodology analysis was carried out to obtain the best conditions for the removal of CBZ, which are: Fe2+ = 70 µmol/L, PMS = 240 µmol/L, CoS2 = 0.59 g/L. The sustainability test demonstrated that the repeated use of CoS2 for 8 successive cycles resulted in little function decrease (<10%). These findings suggest that CoS2/Fe2+/PMS may be a promising method for advanced treatment of tailwater from sewage treatment plant.

1. Introduction

Pharmaceuticals and personal care products (PPCPs), which cover a series of chemical substances including various prescription drugs, over-the-counter drugs, cosmetics, and their metabolic transformation products, are a class of emerging organic pollutants that have been widely addressed [1]. There are more than 3000 kinds of drugs in the world that are used in human society. With the development of modern medicine and chemical technology, the types of PPCPs are increasing year by year. However, most of the PPCPs are not fully utilized or absorbed, but finally enter water bodies, including drinking water sources, through sewage discharge, making the water environment a major storage repository for PPCPs. More than 100 types of PPCPs with concentration range from ng/L to μg/L level have been detected in surface water, groundwater, drinking water, and sewage plants in the America, Europe, Asia, and other countries [2,3,4].
Although the concentration of PPCPs detected in the water environment is relatively low, PPCPs have pseudo-persistence, some of them even have bioaccumulation and slow biodegradability in the ecosystem, posing risks to the ecological environment and human health [5]. Considerable evidence suggests that PPCPs remaining in the water environment are affecting environmental organisms and humans in various ways. It can cause gender disorder in environmental organisms, affect the human endocrine system, nervous system, and immune system, and even cause cancer [6,7]. However, current municipal wastewater treatment and drinking water treatment processes cannot effectively remove these pollutants. Therefore, it is still a scientific challenge to develop new approach for PPCPs removal.
The activated persulfate (PS, i.e., peroxomonosulfate (PMS), peroxydisulfate (PDS)) oxidation process based on sulfate radical ( SO 4 ) is one of the effective methods to degrade micro-organic pollutants in water, which has received extensive attention in recent years [8]. The activations of PS by heat, ultraviolet, microwave, alkaline, zero-valent metal, transition metal ion/oxide, Fe-based metallic glass, carbon-based material, quinone organics, etc. have been extensively investigated in the past several decades [9,10,11,12,13]. Among these activation methods, activation of PS by transition metal ions such as Fe2+, Co2+, Mn2+, Ni2+, etc. [14,15,16] have been widely studied due to the good activation capability, easy accessibility, low energy consumption, and mild temperature requirement. PMS activation by Fe2+ (Fe2+/PMS) ranks among the options considered to be practical [17,18]. Unfortunately, limitations such as the competition consumption of SO 4 by Fe2+, slow regeneration of Fe2+, high acid consumption, iron mud production, and low PMS utilization rate, decrease the lure of the Fe2+/PMS process. Recently, metal sulfide such as MoS2 was reported to be capable of accelerating the Fe3+/Fe2+ conversion in the Fe2+/H2O2 process [19]. The S atoms on the surface of metal sulfides can capture protons to form H2S and expose Mo4+ active sites to greatly accelerate Fe3+/Fe2+ cycling, which could improve H2O2 decomposition to generate radicals. Metal sulfides may also enhance Fe2+/PMS to degrade micro-organic pollutants. Notably, little work has been reported about the depollution efficiency and mechanism of Fe2+/PMS in the presence of metal sulfide.
Herein, cobalt disulfide (CoS2), as a typical metal sulfide, was used as the aid catalyst of the Fe2+/PMS process to degrade PPCPs. Carbamazepine, which is widely used in the treatment of polyuria, arrhythmia, bipolar disorder, and other diseases, was used as a typical PPCP to study the degradation efficiency of CoS2-assisted Fe2+/PMS process (CoS2/Fe2+/PMS). The synesthetic mechanism of CoS2/PMS and Fe2+/PMS, the effects of water quality and operation parameters on CBZ removal efficiency, and response surface methodology (RSM) analysis, as well as the sustainability of the CoS2 co-catalyst, were investigated in detail. The purposes of this study are: (1) to offer a new process for CBZ removal and (2) to reveal the mechanism of CoS2 for boosting the oxidation activity of Fe2+/PMS process.

2. Results and Discussion

2.1. Degradation Effeciency of CBZ

The degradation of CBZ by six different processes including CoS2, PMS, CoS2/Fe2+, Fe2+/PMS, CoS2/PMS, and CoS2/Fe2+/PMS was studied, and the results are shown in Figure 1a. The removal rates of CBZ after 20 min of reaction were only 2.9% and 2.4%, respectively, by the processes of CoS2 or PMS alone, indicating that the adsorption of CBZ on CoS2 is very weak, and CBZ can hardly be removed by PMS without the addition of an activator. The CBZ percentage degradation rate of CoS2/Fe2+/PMS was 94.7%, which was 92%, 75.2%, and 26.5% higher than those of CoS2/Fe2+, Fe2+/PMS, and CoS2/PMS, respectively. Further analysis of reaction rate constants (k) was conducted to verify whether synesthetic effect between CoS2/PMS and Fe2+/PMS existed. The degradation curves of PMS-based processes were fitted by the pseudo–first–order kinetic model (Figure 1b), which can be expressed as Equation (1):
ln(C/C0) = kt
where C and C0 represent the concentrations of CBZ at the 0 and t time, respectively, k is the apparent rate constant. The k value of the CoS2/Fe2+/PMS process was 0.14 min−1, which is 2.5 times and 23 times higher than that the processes of CoS2/PMS and Fe2+/PMS, respectively. This means that the addition of CoS2 can significantly improve the degradation efficiency of CBZ by the process of Fe2+/PMS. The PMS and Fe2+ concentration evolution in the CoS2/Fe2+/PMS process was measured to evaluate PMS utilization rate and Fe2+ regeneration. CoS2/Fe2+/PMS showed a PMS utilization rate of 87.8%, which is 68.2% and 6.5% higher than those in the processes of Fe2+/PMS and CoS2/PMS, respectively (Figure 1c). As shown in Figure 1d, the Fe2+ was completely oxidized in the first 5 min for Fe2+/PMS, leaving most of the remaining PMS unutilized. By contrast, the Fe2+ concentration of CoS2/Fe2+/PMS was slightly increased during the whole reaction process, leading to the full utilization of the PMS.

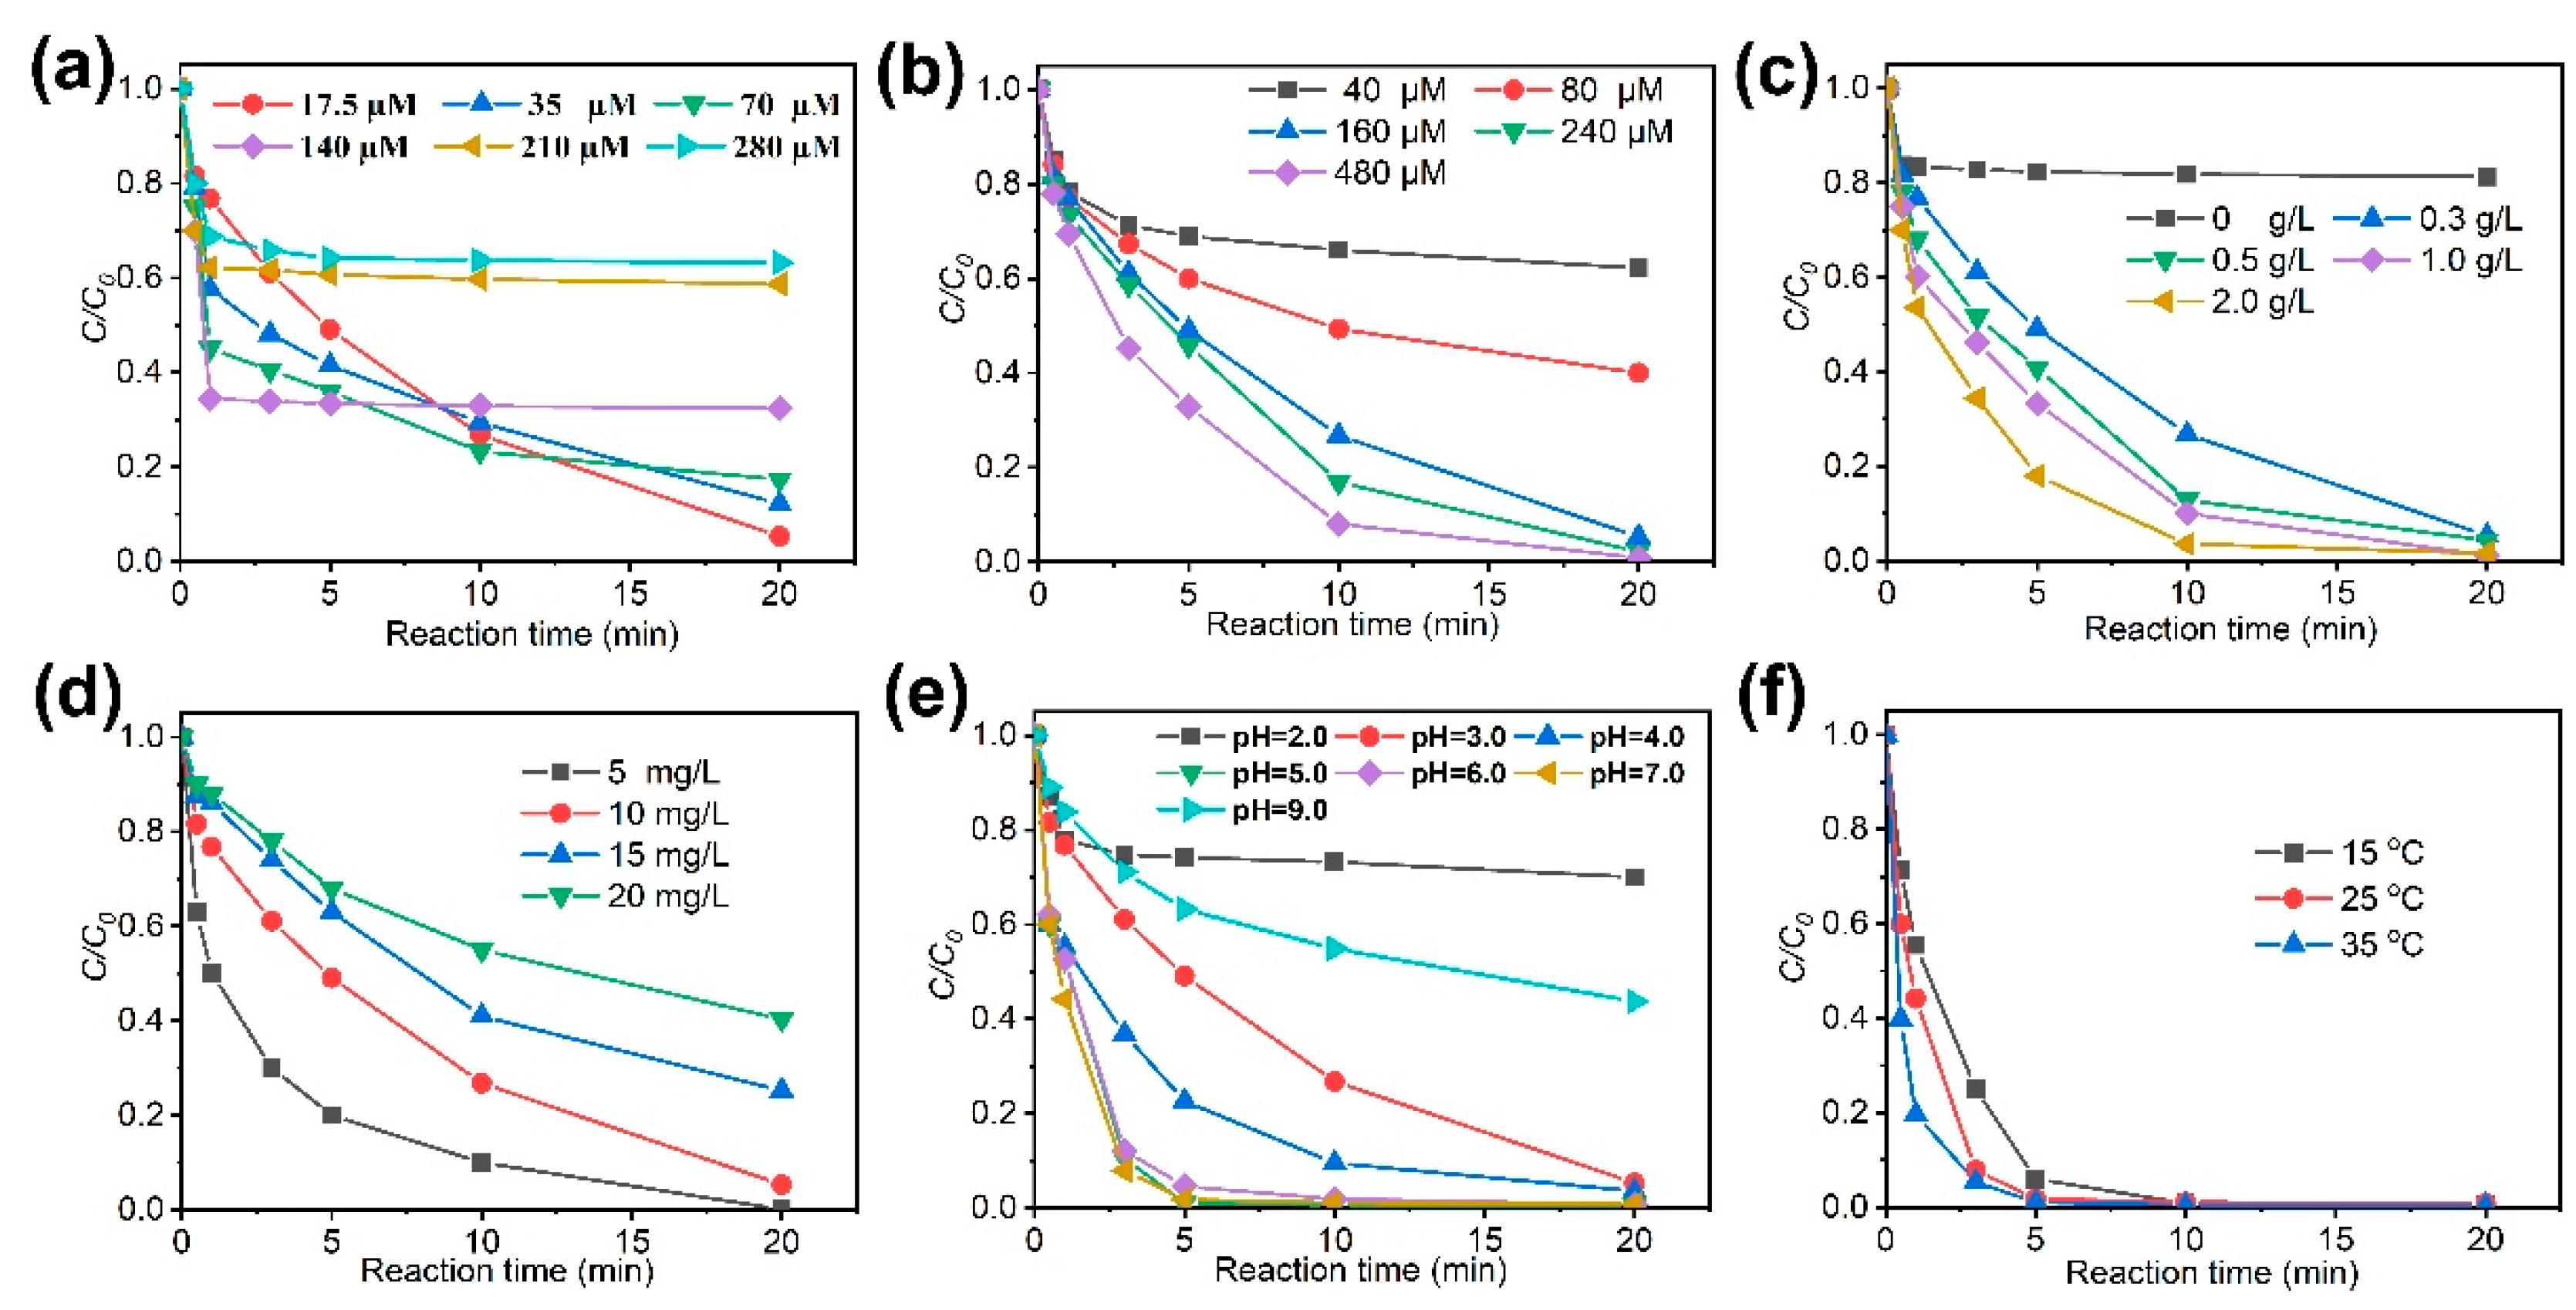
2.2. Effects of Operational Parameters on the Removal of CBZ

In order to optimize the degradation efficiency of the CoS2/Fe2+/PMS, the operational parameters such as CoS2 dosage, Fe2+ concentration, PMS concentration, initial CBZ concentration, pH, and temperature were studied. When the Fe2+ concentration gradually increased from 17.5 to 70 µM, the degradation efficiency of CBZ gradually increased (Figure 2a). However, when the Fe2+ concentration exceeded 140 µM, the degradation efficiency was inhibited. This may result from the competitive consumption of radicals by excessive Fe2+ [20]. The CBZ removal efficiency was enhanced with the increase of PMS concentration (Figure 2b) and CoS2 dosage (Figure 2c) since SO 4 can be produced by the reaction of PMS and CoS2. CBZ at concentration of 5, 10, 15, and 20 mg/L can be degraded by 99.9%, 94.7%, 74.8%, and 59.7% in the CoS2/Fe2+/PMS process after 20 min (Figure 2d). The gradually decreased CBZ removal rate can be attributed to the decreasing supply of radicals for per molar carbamazepine. The CoS2/Fe2+/PMS process showed the best CBZ removal efficiency at pH values ranged from 5–7. When the pH was <3 or >9, the removal rate of CBZ was significantly reduced (Figure 2e). This is because high pH value will decrease the amount of soluble Fe2+ and accelerate the participation of Fe3+, which undoubtedly inhibits CBZ degradation. At low pH, the SO 4 is possibly transformed to other side products as well as scavenging effect of H+, which is similar to HO• in Fenton process [21]. Furthermore, the Fe2+ forms hydrates such as [Fe(H2O)6]2+, [Fe(H2O)6]3+, [Fe(H2O)5]2+, which is not conducive to activation PMS [22]. Therefore, the CBZ degradation efficiency decreased under pH 2. The degradation rate of CBZ is positively related to the solution temperature ranging from 15 to 35 °C (Figure 2f). This phenomenon can be explained by the fact that high temperature is beneficial to reduce the activation energy of reactions and intensifies the thermal movement of the reaction molecules.

2.3. Effects of Water Quality Parameters on the Removal of CBZ

The effects of water quality parameters such as SO42–, NO3, H2PO4, Cl, NH4+, and humic acid (HA) on the degradation of CBZ by the CoS2/Fe2+/PMS process were also studied (Figure 3). When the concentration of Cl is low (0.5–1.0 mM), the addition of Cl showed an inhibitory effect (Figure 3a). This is because SO 4 and HO• can directly oxidize Cl to produce Cl•, which has lower reactivity toward CBZ than the SO 4 and HO• [23]. With the further increase of Cl concentration, the accumulation of reactive chlorine species such as Cl• and Cl 2 can compensate the loss of oxidation power. Compared with Cl, the effects of NO3 and SO42– on the degradation process were unremarkable (Figure 3b,c). As the concentration of NH4+ increased from 0 to 50 mmol/L (Figure 3e), the CBZ removal gradually decreased due to the consumption of free radicals to form NO3. As to H2PO4, it showed a weak inhibitory effect on the reaction process at low concentrations of 0–1 mM but decreased the removal rates of CBZ by over 10% at concentrations above 10 mM (Figure 3d). Such inhibition effect originates from the radical scavenging by H2PO4 and strong complexing between H2PO4 and Fe2+ [24,25]. HA is a typical representative of dissolved organic matter (DOM). The removal rate of CBZ decreased with the increased addition of HA (Figure 3f). This is because HA competes with CBZ, resulting in the decreased degradation rate of CBZ.

2.4. Response Surface Methodology Analysis

Response surface methodology (RSM) is a method of obtaining a quadratic multiple regression equation through simulation to predict the actual value [26,27]. RSM analyzes the influence of the interaction of various factors on the response value through mathematical and statistical optimization methods and can obtain equations that fit the actual results through limited experimental numerical fitting. To optimize the efficiency of CoS2/Fe2+/PMS process, three factors, namely A: Fe2+ concentration, B: PMS concentration, and C: CoS2 dosage, which have a relatively large impact on the CBZ removal rate (screening using Box–Behnken analysis method), were selected. The detailed analysis process is shown in Tables S1–S5 (Supplementary Materials). According to the software simulation, the optimal conditions for the best performance of CoS2/Fe2+/PMS (99.9% CBZ degradation) are: Fe2+ = 70 µM, PMS = 240 µM, and CoS2 = 0.59 g/L. Under this condition, the theoretical prediction value of CBZ degradation rate is 100%. The more elliptical shape of the contour line obtained by fitting, the greater the influence of their interaction on the degradation rate, and the rounder the shape of the contour map, the weaker the influence. As shown in Figure 4, the combination of PMS and Fe2+ showed the most obvious influence on the degradation process, and the combination of PMS and CoS2 ranked the second. The results also indicated that interaction between CoS2 and PMS was obvious.

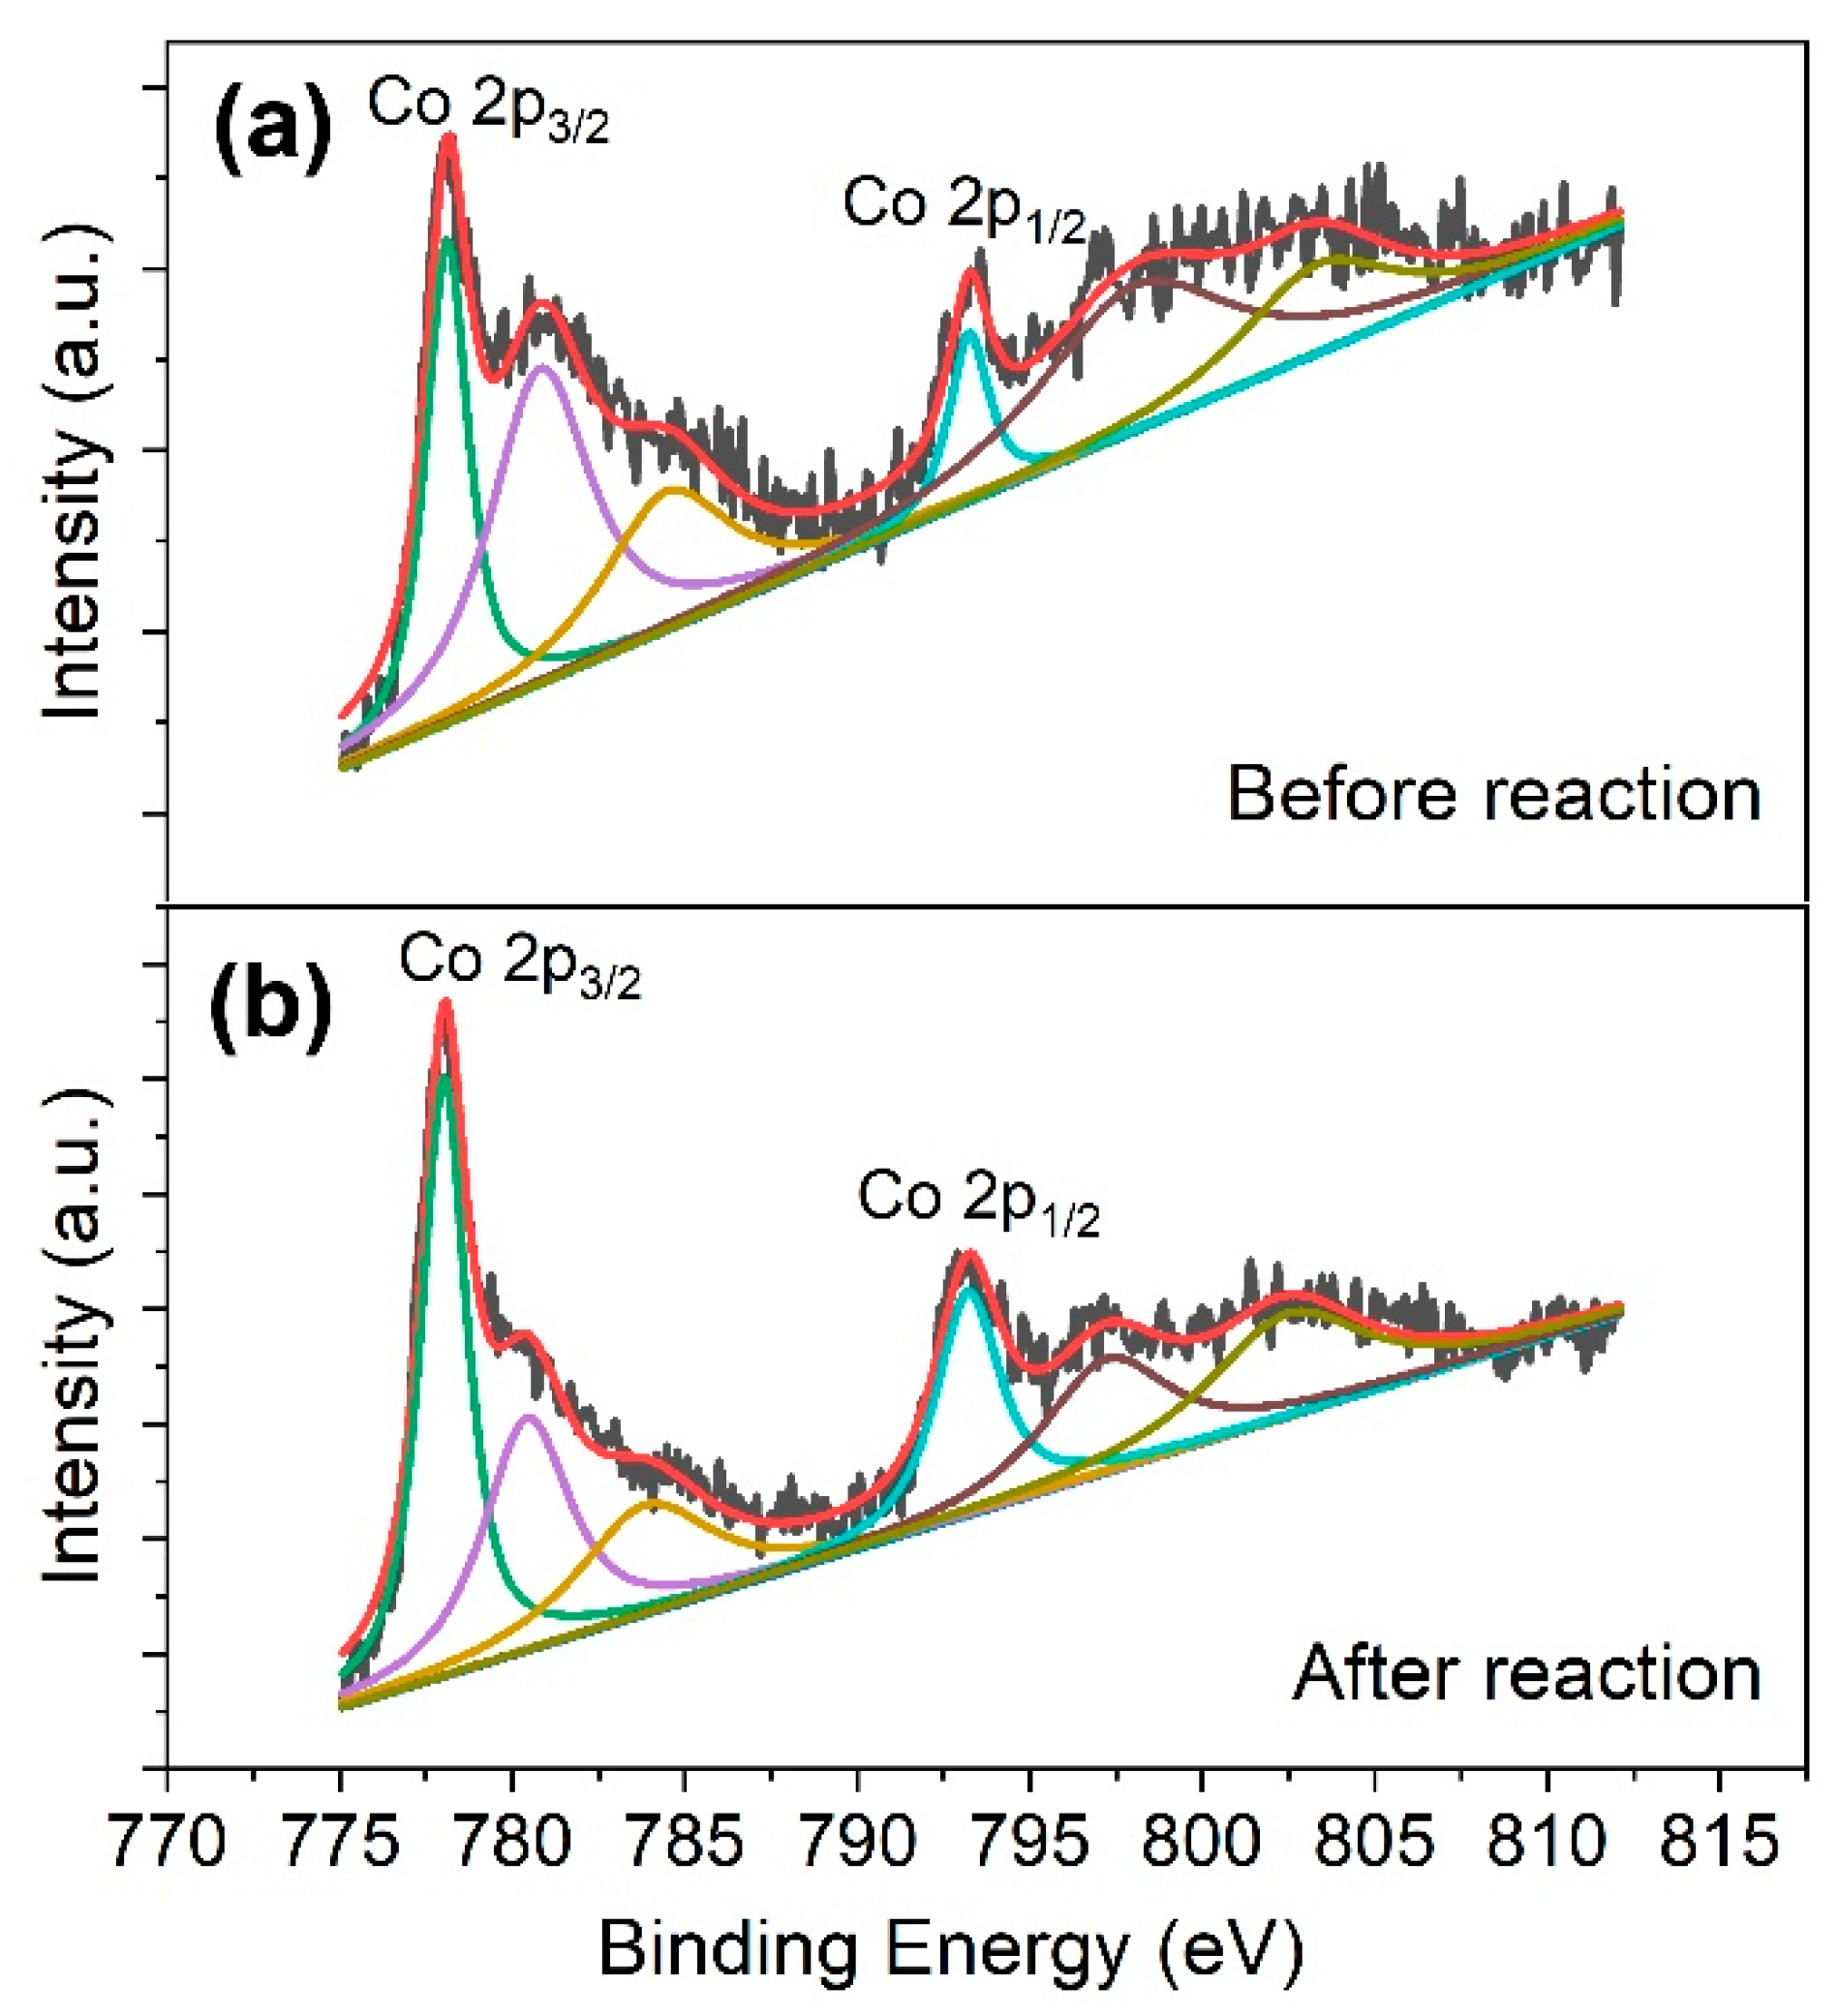
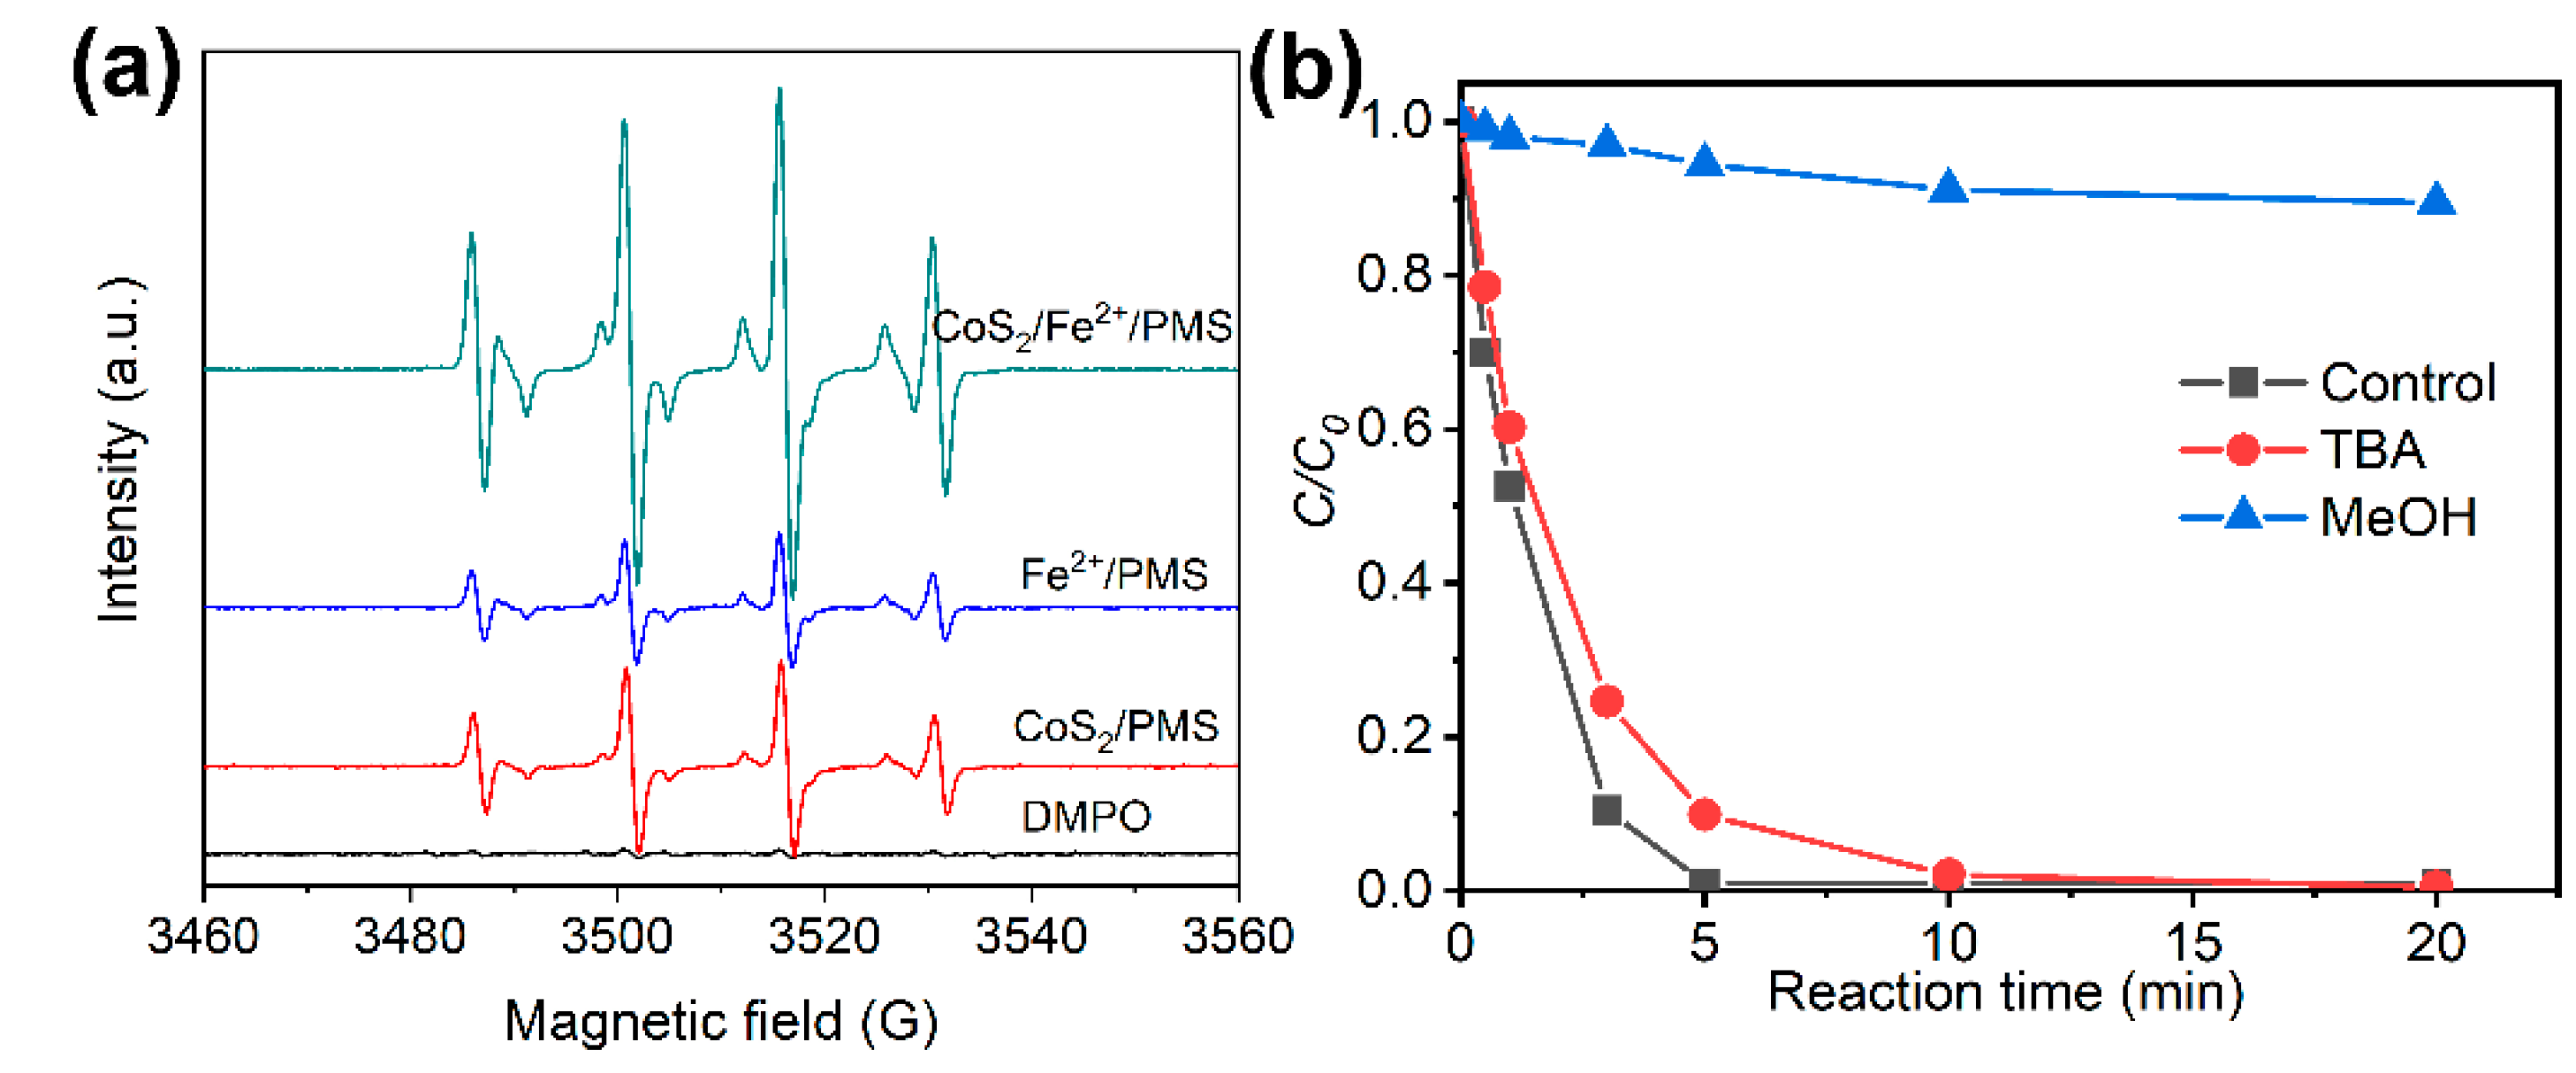
2.5. Reaction Mechanism

It has been reported that the S atoms on the surface of metal sulfides can capture protons to form H2S and expose metal active sites to greatly accelerate Fe3+/Fe2+ cycling, which could improve Fenton decomposition to generate HO• radicals [19]. In order to assess the change of the chemical valence of Co during reaction, the XPS analysis of the CoS2 before and after co-catalyst of Fe2+/PMS process was performed. Before reaction, two characteristic peaks were identified at 778.2 and 793.5 eV in the Co 2p XPS high-resolution spectrum are related to the spin-orbital splitting of Co 2p3/2 and Co 2p1/2 respectively (Figure 5a), mainly in the form of Co3+ [28,29]. Another two peaks at 780.9 and 797.1 eV are in accordance with Co 2p3/2 and Co 2p1/2 from Co2+ [28,29]. In addition, two peaks at 803.4 and 784.1 eV are ascribed to the satellite peak of Co 2p [28,29,30,31]. When CoS2 was dosed in Fe2+/PMS system, the characteristic peaks at 780.9 eV (Co2+) became smaller and the peak at 778.2 eV (Co3+) became larger (Figure 5b), which indicates the Co–S bonds decrease. This phenomenon can be explained by detachment of S on the surface, which will lead to the exposure of Co2+ and then facilitates reaction of Co2+ with Fe3+ to form Co3+ and Fe2+. In addition, the degradation capability exhibited by CoS2/PMS indicates that the exposed Co2+ may also be able to activate PMS, which is further confirmed by the EPR determination.
To further confirm the addition of the CoS2 can boost the oxidation activity of the Fe2+/PMS process, the EPR spectra of DMPO- SO 4 and DMPO-HO• in the PMS-based reaction processes including Fe2+/PMS, CoS2/PMS and CoS2/Fe2+/PMS were detected using an EPR spin trapping technique with the trapping agent DMPO. The typical signal peaks for SO 4 (six-line spins with intensity ratio of 1:1:1:1:1:1, αN = 13.51G, αβ-H = 9.93G, αγ-H1 = 1.34, αγ-H2 = 0.88) and HO• (four-line spins with intensity ratio of 1:2:2:1, αN = αβ-H = 14.9 G) were monitored in all of the PMS-based reaction processes (Figure 6a). The intensity of DMPO-HO• and DMPO- SO 4 in the PMS-based reaction processes followed the order of Fe2+/PMS < CoS2/PMS < CoS2/Fe2+/PMS, which was consistent with the law of their degradation efficiency (Figure 1a). It should be pointed out that the DMPO-HO• peak strength was significantly higher than that of DMPO- SO 4 . This is because SO 4 can quickly transform into HO• when it is produced in water solution [32] and the signal intensity of DMPO- SO 4 adduct spin was inherently much weaker than that of DMPO-HO• adduct spin. In order to identify whether HO• or SO 4 are the main species contributing to CBZ degradation in the CoS2/Fe2+/PMS system, competitive experiments with different quencher addition were conducted. MeOH and TBA were used for quenching the SO 4 and HO•, respectively. As shown in Figure 6b, the degradation efficiency was significantly reduced with the addition of MeOH (quencher for SO 4 and HO•) but slightly decreased with the addition of TBA (quencher for SO 4 and HO•), indicating that the SO 4 was the main active substance in the process of CoS2/Fe2+/PMS. Contributions of HO• and SO 4 are 10% and 85%, respectively.

2.6. Sustainability of CoS2

The cycle life and stability of the catalyst are important factors to measure the performance of the catalyst. After 8 cycles, the CBZ removal rate at reaction time of 20 min was still more than 90% by the CoS2/Fe2+/PMS process (Figure 7), indicating that CoS2 has good stability. Moreover, the dissolved Co2+ concentration after 8 cycles was only 0.8 mg/L, suggesting the good stability of the CoS2. In order to further confirm the stability of CoS2, the crystal structure and morphology of CoS2 before and after the reaction were analyzed by SEM, TEM, and XRD. After 8 cycles of use, the morphology of CoS2 did not change significantly (Figures S1 and S2, Supplementary Materials). The position and intensity of the XRD diffraction peaks did not change, indicating no crystal phase changing during reaction. The SEM, TEM, and XRD results also suggest the good chemical stability of the CoS2.

3. Materials and Methods

3.1. Materials

Cobalt disulfide particles, tert-butyl alcohol (TBA, ≥99%), and potassium peroxymonosulfate (KHSO5·0.5KHSO4·0.5K2SO4, ≥47%) were purchased from Shanghai Aladdin Reagent Co., Ltd. (Shanghai, China) Carbamazepine (C15H12N2O, ≥99.0%) was purchased from Tianjin Sinos Opto Technology Co., Ltd., address: Room 2001-14, No. 8 Gaoying Road, Beizhakou Demonstration Town, Jinnan District, Tianjin, China. Ferrous sulfate heptahydrate (FeSO4·7H2O, >99.0%), sulfuric acid (H2SO4, ≥99%), sodium hydroxide (NaOH, ≥99%), sodium sulfate (Na2SO4, ≥99%), sodium nitrate (NaNO3, ≥99%), sodium chloride (NaCl, ≥99%), potassium dihydrogen phosphate (KH2PO4, ≥99%), and ammonium chloride (NH4Cl, ≥99%) were purchased from Sinopharm Chemical Reagent Co., Shanghai, China. 5,5-dimethyl-1-pyrroline-Noxide (DMPO, >99%) was obtained from Dojin Chemical Research Institute Co., Ltd., Kumamoto, Japan.

3.2. Experimental Procedures

First, 200 mL of CBZ solution with concentrations ranging from 5 to 20 mg/L were added into a 250 mL glass beaker. Then, CoS2 suspension with concentrations ranging from 0.3 to 2.0 g/L and Fe2+ solutions with concentrations ranging from 17.5 to 280 µmol/L were added into the above CBZ solution under ultrasonication for 30 s. Subsequently, the solution pH was adjusted at the range of 2–9 by NaOH and/or H2SO4 solution. Finally, the PMS solution with concentrations ranging from 40 to 480 µmol/L were injected into the mixture to start the reaction. Water samples were taken at different time intervals with addition of methanol to quench the reaction. The samples were centrifuged at 10,000 r/min for 5 min to obtain the clean solutions for determination of CBZ concentrations.

3.3. Analysis Methods

The CBZ concentrations were determined by using a High-Performance Liquid Chromatography (HPLC) device equipped with a reversed-phase ZORBAX Eclipse XDB-C18 column (4.6 mm × 150 mm, 5 μm) at a UV wavelength of 245 nm. The mobile phase was set at 60/40 water/methanol. The flow rate was set at 1.0 mL/min with an injection volume of 20 µL. The concentration of dissolved Fe2+, total Fe ions, and dissolved Co2+ were detected by using the colorimetric method and Inductively Coupled Plasma Mass Spectrometry (ICP-MS, PerkinElmer NexION 350Q, Waltham, MA, USA). The crystalline phase and morphologies of the CoS2 particles before and after reaction were monitored by an Rigaku X-ray diffractometer (XRD) and an FEI FEG650 field-emission scanning electron microscope (SEM), respectively. Radicals (HO• and SO 4 ) were determined by a Bruker A300 Electron paramagnetic resonance (EPR) Spectrometer. The EPR spectrometer settings in the spin trapping experiments were as follows: modulation amplitude, 0.1 mT; center field, 351.194 mT; sweep width, 10.00 mT; sweep time, 41 s; microwave power, 2.25 mW; microwave frequency, 9.858 GHz; and receiver gain, 1.42 × 10⁴. X-ray photoelectron spectroscopy (XPS) was used to observe Co valence change.
The PMS concentration was measured by the iodometric method, which was divided into several steps: Step 1: prepare a mixed solution of potassium iodide and sodium bicarbonate with concentration of 100 g/L and 5 g/L, respectively. Step 2: 5 mL of the above mixed solution was added in a 10 mL colorimetric tube, then 0.5 mL of the PMS solution with concentrations of 0.00, 0.01, 0.02, 0.04, 0.06, 0.08, 0.10 mmol/L were added. Step 3: the above solution was shaken vigorously to mix evenly and placed for 20 min to develop color. The absorbance of the colored solution was measured at a wavelength of 352 nm via a UV spectrophotometer. Finally, a standard curve of PMS concentration and absorbance intensity can be obtained (Figure S3, Supplementary Materials).

3.4. RSM Experimental Design and Results

The RSM experimental was designed with three factors and three levels. Fe2+ concentration (A), PMS concentration (B), and CoS2 dosage (C) were selected as the three factors. The three levels in this experiment refer to the low, medium, and high concentrations of the selected factors, which can be represented by −1, 0, +1 respectively. The conversion equation between the code and the actual value is shown in Equation (2):
N i = X i X 0 Δ X
Among them, Ni is the variable code value, X0 is the concentration of the independent variable at the center point of the experiment, and ΔX is the change step length of the concentration. The removal rate of CBZ (%) is taken as the response value Y. The experimental data were fitted and analyzed using the design software Design Expert. The experimental design scheme shown in Table S1, Supplementary Materials. There are 17 groups of experiments. The experimental scheme is randomly generated and given according to the software.
The experimental data were fitted by Design Expert, and a model including multiple independent variables and response values was obtained. The relationship can be described by Equation (3):
Y = β 0 + i = 1 k β i x i + i = 1 k β i i x i 2 + i = 1 j 1 j = 1 k β i j x i x j
Equation (4) can be obtained by fitting the data in Table S2, Supplementary Materials.
Y 1 = 83.30 8.78 × Fe + 18.34 × PMS + 29.44 × Co S 2 2.33 × Fe × PMS 6.28 × Fe × Co S 2 + 1.45 × PMS × Co S 2 9.68 × Fe × Fe 7.00 × PMS × PMS 23.60 × Co S 2 × Co S 2
The analysis of variance of the regression model is shown in Table S3, Supplementary Materials. The F value is 110.66 and p value is <0.0001, which means that the Y1 model is extremely significant.
Figure S4 represents the residual probability distribution diagrams of the model predicted value and the actual value. The residual probability of the actual value and the predicted value are all distributed on a straight line, and the actual value and the predicted value are not much different. By comparing the value of F, it can be seen that the factors affecting the reaction process from large to small are: C(CoS2) > B(PMS) > A(Fe2+).
The simulation model is relatively complex and includes some factors that do not have a significant impact on the experimental results. An overly complex model may cause partial distortion of the model. Therefore, it is necessary to make simple corrections to the model and eliminate the insignificant factors to obtain a better simulation model. A new simulation model (Y2, Equation (5)) was obtained by fitting the data in Table S4 with two insignificant items (p > 0.05) deleted. The analysis of variance of the regression model is shown in Table S5.
Y 2 = 83.30 8.78 × Fe + 18.34 × PMS + 29.44 × Co S 2 6.27 × Fe × Co S 2 9.68 × Fe × Fe 7.00 × PMS × PMS 23.60 × Co S 2 × Co S 2
In order to explore the influence of each factor pairwise interaction on CBZ removal rate, Design Expert software was used to draw contour plots and response surface plots of the AB, BC, and AC terms in the regression equation. The more elliptical shape of the contour line obtained by fitting, the greater the influence of their interaction on the degradation rate, and the rounder the shape of the contour map, the weaker the influence. As shown in Figure 4, the interaction between PMS and CoS2 concentration was obvious.

4. Conclusions

In conclusion, we have demonstrated that carbamazepine (CBZ) can be efficiently removed by the CoS2/Fe2+/PMS process. The apparent degradation rate constant of CBZ was 0.14 min−1 for CoS2/Fe2+/PMS, which was 2.5 times and 23 times higher than that for CoS2/PMS and Fe2+/PMS, respectively. The HO• and SO 4 were the two main oxidation species in the reaction processes, which followed the order of Fe2+/PMS < CoS2/PMS < CoS2/Fe2+/PMS. The enhanced removal efficiency was due to the reduction of Fe3+ by the exposed Co2+ on the CoS2 particles. We believe the high catalytic oxidation activity, low catalyst dosage, and good stability make the CoS2/Fe2+/PMS process potential application for CBZ wastewater treatment.

Supplementary Materials

The following supporting information can be downloaded at: https://www.mdpi.com/article/10.3390/molecules27144524/s1, Figure S1: TEM of CoS2 (a) before and (b) after 8-cycle reaction; SEM of CoS2 (c) before and (d) after 8-cycle reaction. Figure S2: XRD patterns of CoS2 before and after 8-cycle reaction. Figure S3: Standard curve for PMS concentration. Figure S4: (a) The residual probability distribution of predicted and actual values; (b) Comparison of actual and predicted values. Table S1: Response surface experimental design. Table S2: Experimental design and results. Table S3: Model analysis of variance. Table S4: Analysis of variance of the regression model Y1. Table S5: Analysis of variance of the regression model Y2.

Author Contributions

Conceptualization, X.L. and T.W.; methodology, H.P.; validation, T.W., R.W. and X.L.; investigation, T.W. and H.P.; resources, X.L.; data curation, H.P. and T.W.; writing—original draft preparation, T.W. and X.L.; writing—review and editing, X.L.; supervision, X.L. and R.W.; project administration, X.L.; funding acquisition, T.W. and R.W. All authors have read and agreed to the published version of the manuscript.

Funding

This work was financially supported by the General Project of Zhejiang Medicine and Health Science and Technology Plan (No. 2020KY621).

Institutional Review Board Statement

Not applicable.

Informed Consent Statement

Not applicable.

Data Availability Statement

Not applicable.

Conflicts of Interest

The authors declare no conflict of interest.

Sample Availability

Samples of the compounds are not available from the authors.

References

  1. Daughton, C.G.; Ternes, T.A. Pharmaceuticals and personal care products in the environment: Agents of subtle change? Environ. Health Perspect. 1999, 107 (Suppl. S6), 907–938. [Google Scholar] [CrossRef] [PubMed]
  2. Yu, C.-P.; Chu, K.-H. Occurrence of pharmaceuticals and personal care products along the West Prong Little Pigeon River in east Tennessee, USA. Chemosphere 2009, 75, 1281–1286. [Google Scholar] [CrossRef] [PubMed]
  3. Kosma, C.I.; Lambropoulou, D.A.; Albanis, T.A. Occurrence and removal of PPCPs in municipal and hospital wastewaters in Greece. J. Hazard. Mater. 2010, 179, 804–817. [Google Scholar] [CrossRef] [PubMed]
  4. Kim, S.D.; Cho, J.; Kim, I.S.; Vanderford, B.J.; Snyder, S.A. Occurrence and removal of pharmaceuticals and endocrine disruptors in South Korean surface, drinking, and waste waters. Water Res. 2007, 41, 1013–1021. [Google Scholar] [CrossRef]
  5. Nassef, M.; Kim, S.G.; Seki, M.; Kang, I.J.; Hano, T.; Shimasaki, Y.; Oshima, Y. In ovo nanoinjection of triclosan, diclofenac and carbamazepine affects embryonic development of medaka fish (Oryzias latipes). Chemosphere 2010, 79, 966–973. [Google Scholar] [CrossRef]
  6. Lindström, A.; Buerge, I.J.; Poiger, T.; Bergqvist, P.-A.; Müller, M.D.; Buser, H.-R. Occurrence and environmental behavior of the bactericide triclosan and its methyl derivative in surface waters and in wastewater. Environ. Sci. Technol. 2002, 36, 2322–2329. [Google Scholar] [CrossRef]
  7. Kasprzyk-Hordern, B.; Dinsdale, R.M.; Guwy, A.J. The removal of pharmaceuticals, personal care products, endocrine disruptors and illicit drugs during wastewater treatment and its impact on the quality of receiving waters. Water Res. 2009, 43, 363–380. [Google Scholar] [CrossRef]
  8. Zhao, Q.; Mao, Q.; Zhou, Y.; Wei, J.; Liu, X.; Yang, J.; Luo, L.; Zhang, J.; Chen, H.; Tang, L. Metal-free carbon materials-catalyzed sulfate radical-based advanced oxidation processes: A review on heterogeneous catalysts and applications. Chemosphere 2017, 189, 224–238. [Google Scholar] [CrossRef]
  9. Qi, C.; Liu, X.; Lin, C.; Zhang, X.; Ma, J.; Tan, H.; Ye, W. Degradation of sulfamethoxazole by microwave-activated persulfate: Kinetics, mechanism and acute toxicity. Chem. Eng. J. 2014, 249, 6–14. [Google Scholar] [CrossRef]
  10. Ji, Y.; Dong, C.; Kong, D.; Lu, J.; Zhou, Q. Heat-activated persulfate oxidation of atrazine: Implications for remediation of groundwater contaminated by herbicides. Chem. Eng. J. 2015, 263, 45–54. [Google Scholar] [CrossRef]
  11. Aseev, D.G.; Batoeva, A.A.; Sizykh, M.R. Sono-Photocatalytic Degradation of 4-Clorophenol in Aqueous Solutions. Russ. J. Phys. Chem. A 2018, 92, 1813–1819. [Google Scholar]
  12. Liang, S.-X.; Wang, X.; Zhang, W.; Liu, Y.-J.; Wang, W.; Zhang, L.-C. Selective laser melting manufactured porous Fe-based metallic glass matrix composite with remarkable catalytic activity and reusability. Appl. Mater. Today 2020, 19, 100543. [Google Scholar] [CrossRef]
  13. Liang, S.; Jia, Z.; Zhang, W.; Li, X.F.; Wang, W.M.; Lin, H.C.; Zhang, L.C. Ultrafast activation efficiency of three peroxides by Fe78Si9B13 metallic glass under photo-enhanced catalytic oxidation: A comparative study. Appl. Catal. B Environ. 2018, 221, 108–118. [Google Scholar] [CrossRef]
  14. Thendral, P.; Shailaja, S.; Ramachandran, M. Nickel peroxide: A more probable intermediate in the Ni (II)-catalyzed decomposition of peroxomonosulfate. Int. J. Chem. Kinet. 2007, 39, 320–327. [Google Scholar] [CrossRef]
  15. Chai, C.; Fan, C.; Liu, J.; Zhang, X.; Wang, Y.; Li, R.; Duan, D.; Wang, Y. Photoinduced g–C3N4–promoted Mn2+/Mn3+/Mn4+ redox cycles for activation of peroxymonosulfate. J. Solid State Chem. 2019, 277, 466–474. [Google Scholar] [CrossRef]
  16. Rodriguez-Narvaez, O.M.; Pacheco-Alvarez, M.O.A.; Wróbel, K.; Páramo-Vargas, J.; Bandala, E.R.; Brillas, E.; Peralta-Hernandez, J.M. Development of a Co2+/PMS process involving target contaminant degradation and PMS decomposition. Int. J. Environ. Sci. Technol. 2020, 17, 17–26. [Google Scholar] [CrossRef]
  17. Huang, Y.; Wang, Z.; Fang, C.; Liu, W.; Lou, X.; Liu, J. Importance of reagent addition order in contaminant degradation in an Fe(II)/PMS system. RSC Adv. 2016, 6, 70271–70276. [Google Scholar] [CrossRef]
  18. Cheng, X.; Liang, H.; Ding, A.; Tang, X.; Liu, B.; Zhu, X.; Gan, Z.; Wu, D.; Li, G. Ferrous iron/peroxymonosulfate oxidation as a pretreatment for ceramic ultrafiltration membrane: Control of natural organic matter fouling and degradation of atrazine. Water Res. 2017, 113, 32–41. [Google Scholar] [CrossRef] [Green Version]
  19. Xing, M.; Xu, W.; Dong, C.; Bai, Y.; Zeng, J.; Zhou, Y.; Zhang, J.; Yin, Y. Metal sulfides as excellent co-catalysts for H2O2 decomposition in advanced oxidation processes. Chem 2018, 4, 1359–1372. [Google Scholar] [CrossRef] [Green Version]
  20. Monteagudo, J.M.; Durán, A.; González, R.; Expósito, A.J. In situ chemical oxidation of carbamazepine solutions using persulfate simultaneously activated by heat energy, UV light, Fe2+ ions, and H2O2. Appl. Catal. B Environ. 2015, 176, 120–129. [Google Scholar] [CrossRef]
  21. Masomboon, N.; Ratanatamskul, C.; Lu, M.-C. Chemical oxidation of 2,6-dimethylaniline in the fenton process. Environ. Sci. Technol. 2009, 43, 8629–8863. [Google Scholar] [CrossRef] [PubMed]
  22. Xu, X.; Li, X. Degradation of azo dye Orange G in aqueous solutions by persulfate with ferrous ion. Sep. Purif. Technol. 2010, 72, 105–111. [Google Scholar] [CrossRef] [Green Version]
  23. Hong, Y.; Peng, J.; Zhao, X.; Yan, Y.; Lai, B.; Yao, G. Efficient degradation of atrazine by CoMgAl layered double oxides catalyzed peroxymonosulfate: Optimization, degradation pathways and mechanism. Chem. Eng. J. 2019, 370, 354–363. [Google Scholar] [CrossRef]
  24. Huang, G.X.; Wang, C.Y.; Yang, C.W.; Guo, P.C.; Yu, H.Q. Degradation of bisphenol A by peroxymonosulfate catalytically activated with Mn1.8Fe1.2O4 nanospheres: Synergism between Mn and Fe. Environ. Sci. Technol. 2017, 51, 12611–12618. [Google Scholar] [CrossRef]
  25. Ma, J.; Yang, Y.; Jiang, X.; Xie, Z.; Li, X.; Chen, C.; Chen, H. Impacts of inorganic anions and natural organic matter on thermally activated persulfate oxidation of BTEX in water. Chemosphere 2018, 190, 296–306. [Google Scholar] [CrossRef]
  26. Bezerra, M.A.; Santelli, R.E.; Oliveira, E.P.; Villar, L.S.; Escaleira, L.A. Response surface methodology (RSM) as a tool for optimization in analytical chemistry. Talanta 2008, 76, 965–977. [Google Scholar] [CrossRef]
  27. Bhatia, V.; Dhir, A.; Ray, A.K. Photocatalytic degradation of atenolol with graphene oxide/zinc oxide composite: Optimization of process parameters using statistical method. J. Photochem. Photobiol. A 2021, 409, 113136. [Google Scholar] [CrossRef]
  28. Chen, P.; Zhou, T.; Chen, M.; Tong, Y.; Zhang, N.; Peng, X.; Chu, W.; Wu, X.; Wu, C.; Xie, Y. Enhanced catalytic activity in nitrogen-anion modified metallic cobalt disulfide porous nanowire arrays for hydrogen evolution. ACS Catal. 2017, 7, 7405–7411. [Google Scholar] [CrossRef]
  29. Liao, S.-Y.; Cui, T.-T.; Zhang, S.-Y.; Cai, J.-J.; Zheng, F.; Liu, Y.-D.; Min, Y.-G. Cross-nanoflower CoS2 in-situ self-assembled on rGO sheet as advanced anode for lithium/sodium ion battery. Electrochim. Acta 2019, 326, 134992. [Google Scholar] [CrossRef]
  30. Xu, J.; Liu, Y.; Li, X.; Li, Y. Hydrothermal synthesis of Mn3O4/CoS2 as a promising photocatalytic material for boosting visible-light photocatalytic hydrogen production. Phys. Status Solidi A 2021, 218, 2100025. [Google Scholar] [CrossRef]
  31. Senthil, R.A.; Wang, Y.; Osman, S.; Pan, J.; Lin, Y.; Shu, X.; Jin, X.; Sun, Y. A facile one-pot synthesis of microspherical-shaped CoS2/CNT composite as Pt-free electrocatalyst for efficient hydrogen evolution reaction. Int. J. Hydrogen Energy 2019, 44, 16537–16547. [Google Scholar] [CrossRef]
  32. Dong, X.; Ren, B.; Sun, Z.; Li, C.; Zhang, X.; Kong, M.; Zheng, S.; Dionysiou, D.D. Monodispersed CuFe2O4 nanoparticles anchored on natural kaolinite as highly efficient peroxymonosulfate catalyst for bisphenol A degradation. Appl. Catal. B Environ. 2019, 253, 206–217. [Google Scholar] [CrossRef]
Figure 1. (a) The removal efficiency of CBZ by different processes; (b) pseudo–first–order kinetic fitting of different processes; (c) evolution of PMS concentration in the PMS–based reaction processes; (d) evolution of concentrations of Fe2+ and Fe3+ in the CoS2/Fe2+/PMS and Fe2+/PMS processes. Reaction conditions: T = 25 °C, pH = 3, Fe2+ = 17.5 µM, CBZ = 10 mg/L, PMS = 160 µM, CoS2 = 0.3 g/L.
Molecules 27 04524 g001
Figure 2. The effects of (a) Fe2+ concentration, (b) PMS concentration, (c) CoS2 dosage, (d) initial CBZ concentration, (e) pH, and (f) temperature on the removal rates of CBZ by the process of CoS2/Fe2+/PMS.
Molecules 27 04524 g002
Figure 3. The effects of (a) Cl, (b) NO3, (c) SO42–, (d) H2PO4, (e) NH4+, and (f) HA on the removal rates of CBZ by the process of CoS2/Fe2+/PMS.
Molecules 27 04524 g003
Figure 4. Response surface plots for the effects of any two variables on extraction rate of CBZ degradation rate.
Molecules 27 04524 g004
Figure 5. XPS high-resolution spectrum of Co atom before and after reaction in the process of CoS2/Fe2+/PMS.
Molecules 27 04524 g005
Figure 6. (a) EPR spectra of PMS-based reaction processes; (b) CBZ degradation by CoS2/Fe2+/PMS in presence of different quenchers.
Molecules 27 04524 g006
Figure 7. Eight cycles of the degradation of CBZ by the CoS2/Fe2+/PMS process.
Molecules 27 04524 g007
Publisher’s Note: MDPI stays neutral with regard to jurisdictional claims in published maps and institutional affiliations.

