Article

A Novel Turn-On Fluorescence Probe Based on Cu(II) Functionalized Metal–Organic Frameworks for Visual Detection of Uric Acid

College of Chemistry and Materials Science, Sichuan Normal University, Chengdu 610068, China
*
Author to whom correspondence should be addressed.
Molecules 2022, 27(15), 4803; https://doi.org/10.3390/molecules27154803
Submission received: 2 July 2022 / Revised: 24 July 2022 / Accepted: 25 July 2022 / Published: 27 July 2022
(This article belongs to the Special Issue Fluorescence Chemosensors: Design, Synthesis, and Application)

Abstract

:
As an important biomarker in urine, the level of uric acid is of importance for human health. In this work, a Cu(II) functionalized metal–organic framework (Cu2+@Tb-MOFs) is designed and developed as a novel fluorescence probe for wide-range uric acid detection in human urine. The study shows that this fluorescence platform demonstrated excellent pH-independent stability, high water tolerance, and good thermal stability. Based on the strong interaction between metal ions and uric acid, the designed Cu2+@Tb-MOFs can be employed as efficient turn-on fluorescent probes for the detection of uric acid with wide detection range (0~104 µM) and high sensitivity (LOD = 0.65 µM). This probe also demonstrates an anti-interference property, as other species coexisted, and the possibility for recycling. The sensing mechanisms are further discussed at length. More importantly, we experimentally constructed a molecular logic gate operation based on this fluorescence probe for intelligent detection of uric acid. These results suggest the Cu(II) functionalized metal–organic framework can act as a prominent candidate for personalized monitoring of the concentration of uric acid in the human urine system.

1. Introduction

Uric acid (2,6,8-trihydroxypurine, UA), a major metabolite in birds and mammals, is the ultimate metabolized product of purine nucleotide metabolism in body fluid [1,2]. An abnormal level of UA will affect the physiological system and even other normal functions. A risen level of UA causes gout, chronic kidney disease, hyperuricemia, hypertension, cardiovascular disease, etc. [3,4]. The content of UA in serum and urine has become an important indicator for the prediction and diagnosis of diseases. Therefore, the sensitive and precise determination of UA is significant in, for instance, disease screening and physiological studies [5]. In recent years, many methods have been developed for the estimation and detection of UA levels, such as enzymatic assays [6,7], electrochemical sensors [8,9,10,11], spectrophotometric methods [12,13,14,15], Raman spectroscopy [16], chromatography [17,18,19], and fluorescent spectrometry [20,21,22,23,24]. Although enzymatic assays are the conventional method for the detection of UA, this method has challenges, including the high purification costs and the thermal instability of enzyme. In addition, most of these methods generally have some intrinsic disadvantages, such as the use of expensive instruments and time-consuming and laborious manipulation procedures, which greatly limit their practical and wide applications in the determination of UA. Thus, it is crucial to develop a simple, precise and low-cost method for identification of UA.
Fluorescent probes have been rapidly developed and have widely received increasing attention [25,26,27,28], because of their distinctive advantages, including easy modification, adjustable luminescence, good biocompatibility, facile operation, use of simple instrumentation, excellent analysis sensitivity, fast response, and highly sensitive fluorescence. Owing to their prominent fluorescence properties, lanthanide rare-earth metal–organic frameworks have been made for UA detection [29,30,31]. However, most of these cannot detect UA over other common components in human urine. In addition, few of these have a noteworthy fluorescence enhancement response to UA. Therefore, the fabrication of a fluorescent probe for UA with outstanding selectivity and high sensitivity is of great challenge.
Logic gates are the basic components of integrated circuits for information processing and storage [32,33]. If molecules are used to describe the input and output signals in a logic gate and thus realize the logic operations at the molecular level, such a logic system is called a molecular logic gate [34,35]. In recent years, the field has evolved from a single physical or chemical input to a combinatorial and sequential operation, showing great potential and broad promise. Molecular logic gates are gradually replacing traditional semiconductor electronic computers with their significant advantages and are used for heavy metal ion detection, environmental monitoring, food safety detection, pre-disease diagnosis, and biosensor research [36,37,38]. MOFs-based fluorescent probes are highly selective and sensitive, allowing the construction of chemical sensors for sensing various analytes by host–guest interactions. Due to the different fluorescence changes (such as “quenching” or “enhancement” effect) of MOFs [39] in detecting analytes, molecular logic gates can be further constructed for programmed detection.
Here, in this work, we synthesize a novel fluorescence nanoprobe based on Cu(II) functionalized metal–organic frameworks (Cu2+@Tb-MOFs) and explore its application in fluorescence detection (Scheme 1). Ten kinds of related substance in urine were detected, and their impacts on the fluorescence of the Cu2+@Tb-MOFs compound was analyzed. The Cu2+@Tb-MOFs can specially and selectively recognize UA by fluorescence recovering and exhibit high sensitivity for UA. In addition, a molecular logic gate was constructed based on the whole system, and finally a molecular logic network system for uric acid detection connecting basic and integrated logic operations was implemented. This strategy is simple and practical, and provides a guiding method for constructing molecular-level logic gates for uric acid detection on a simple platform.

2. Results and Discussion

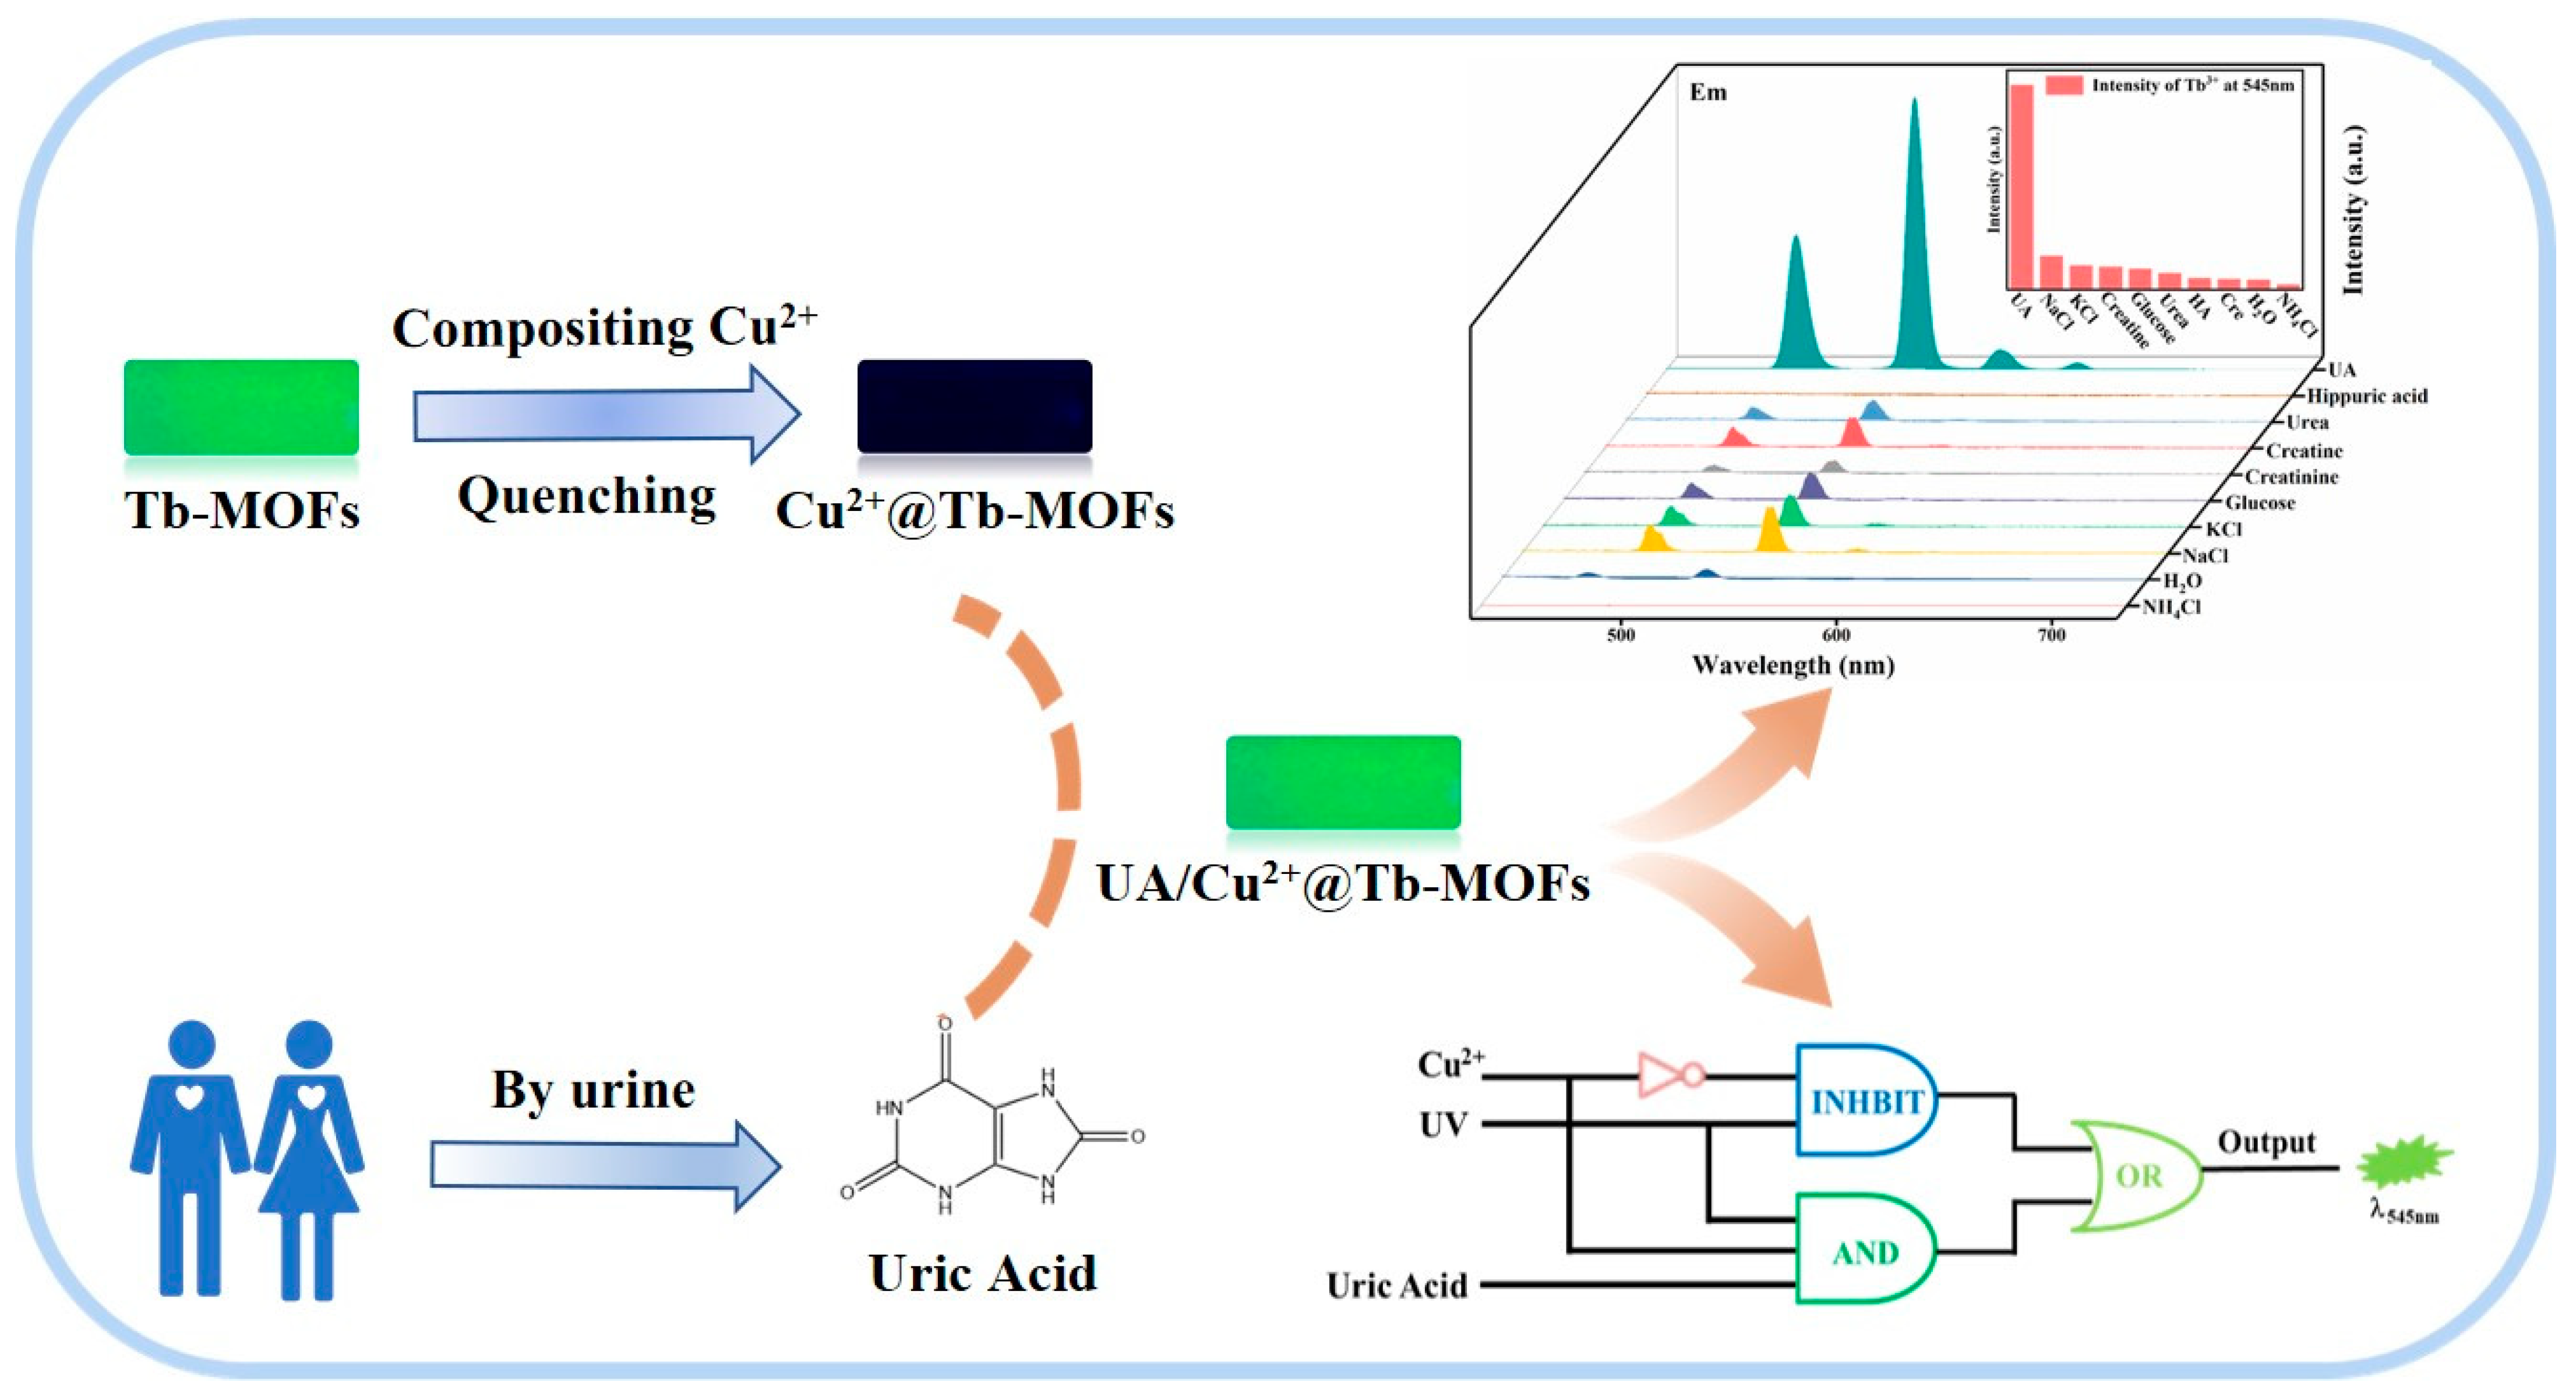
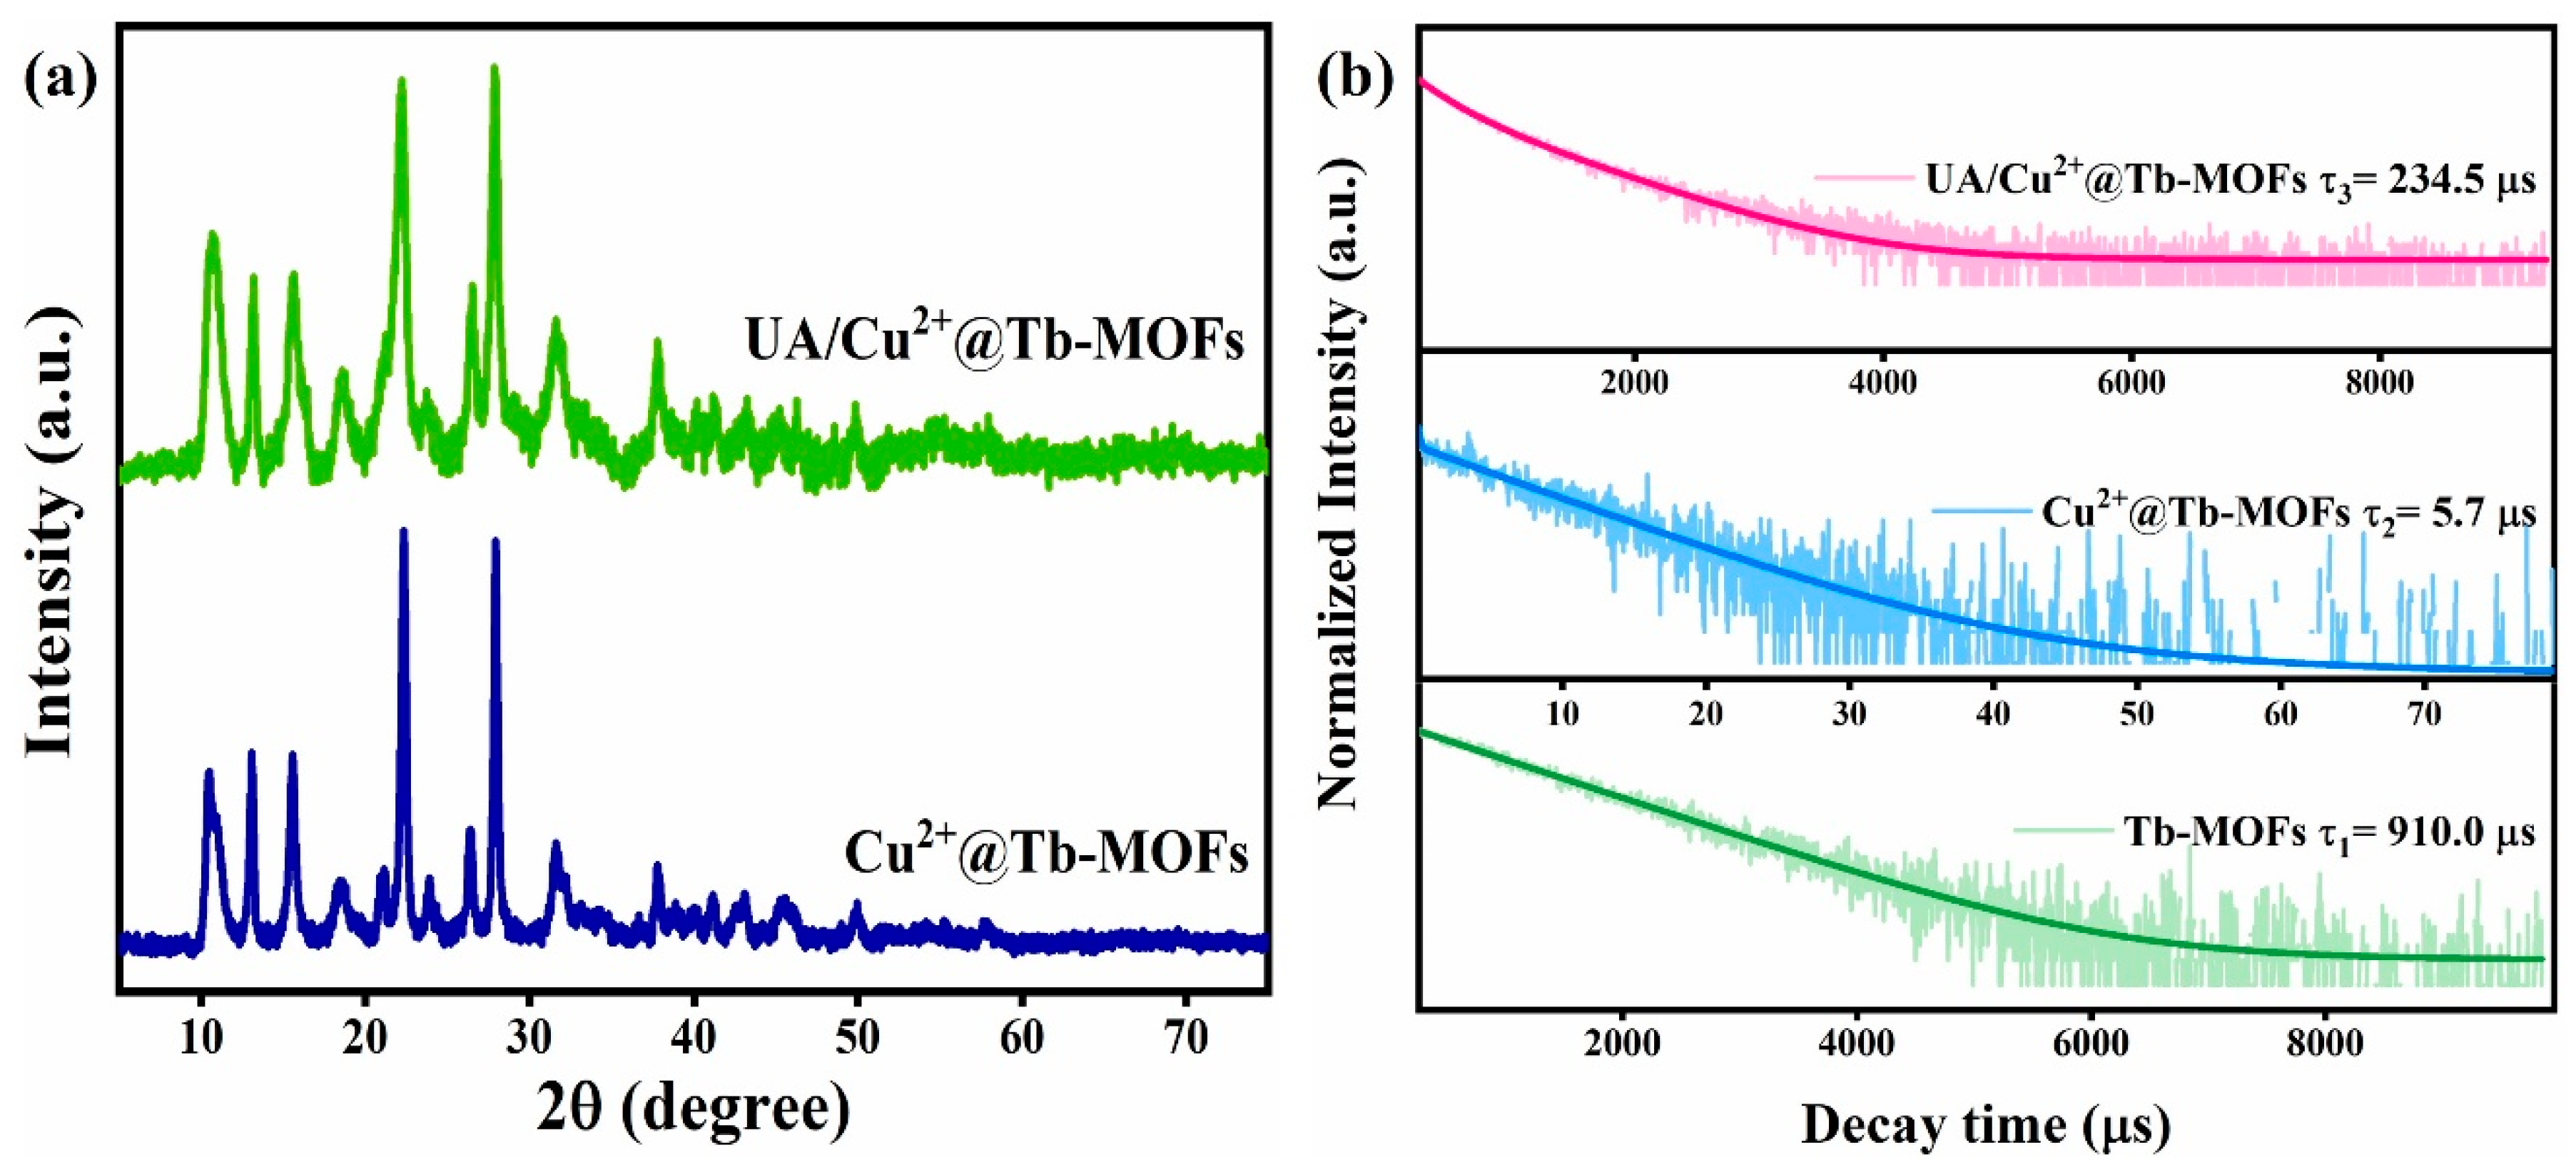
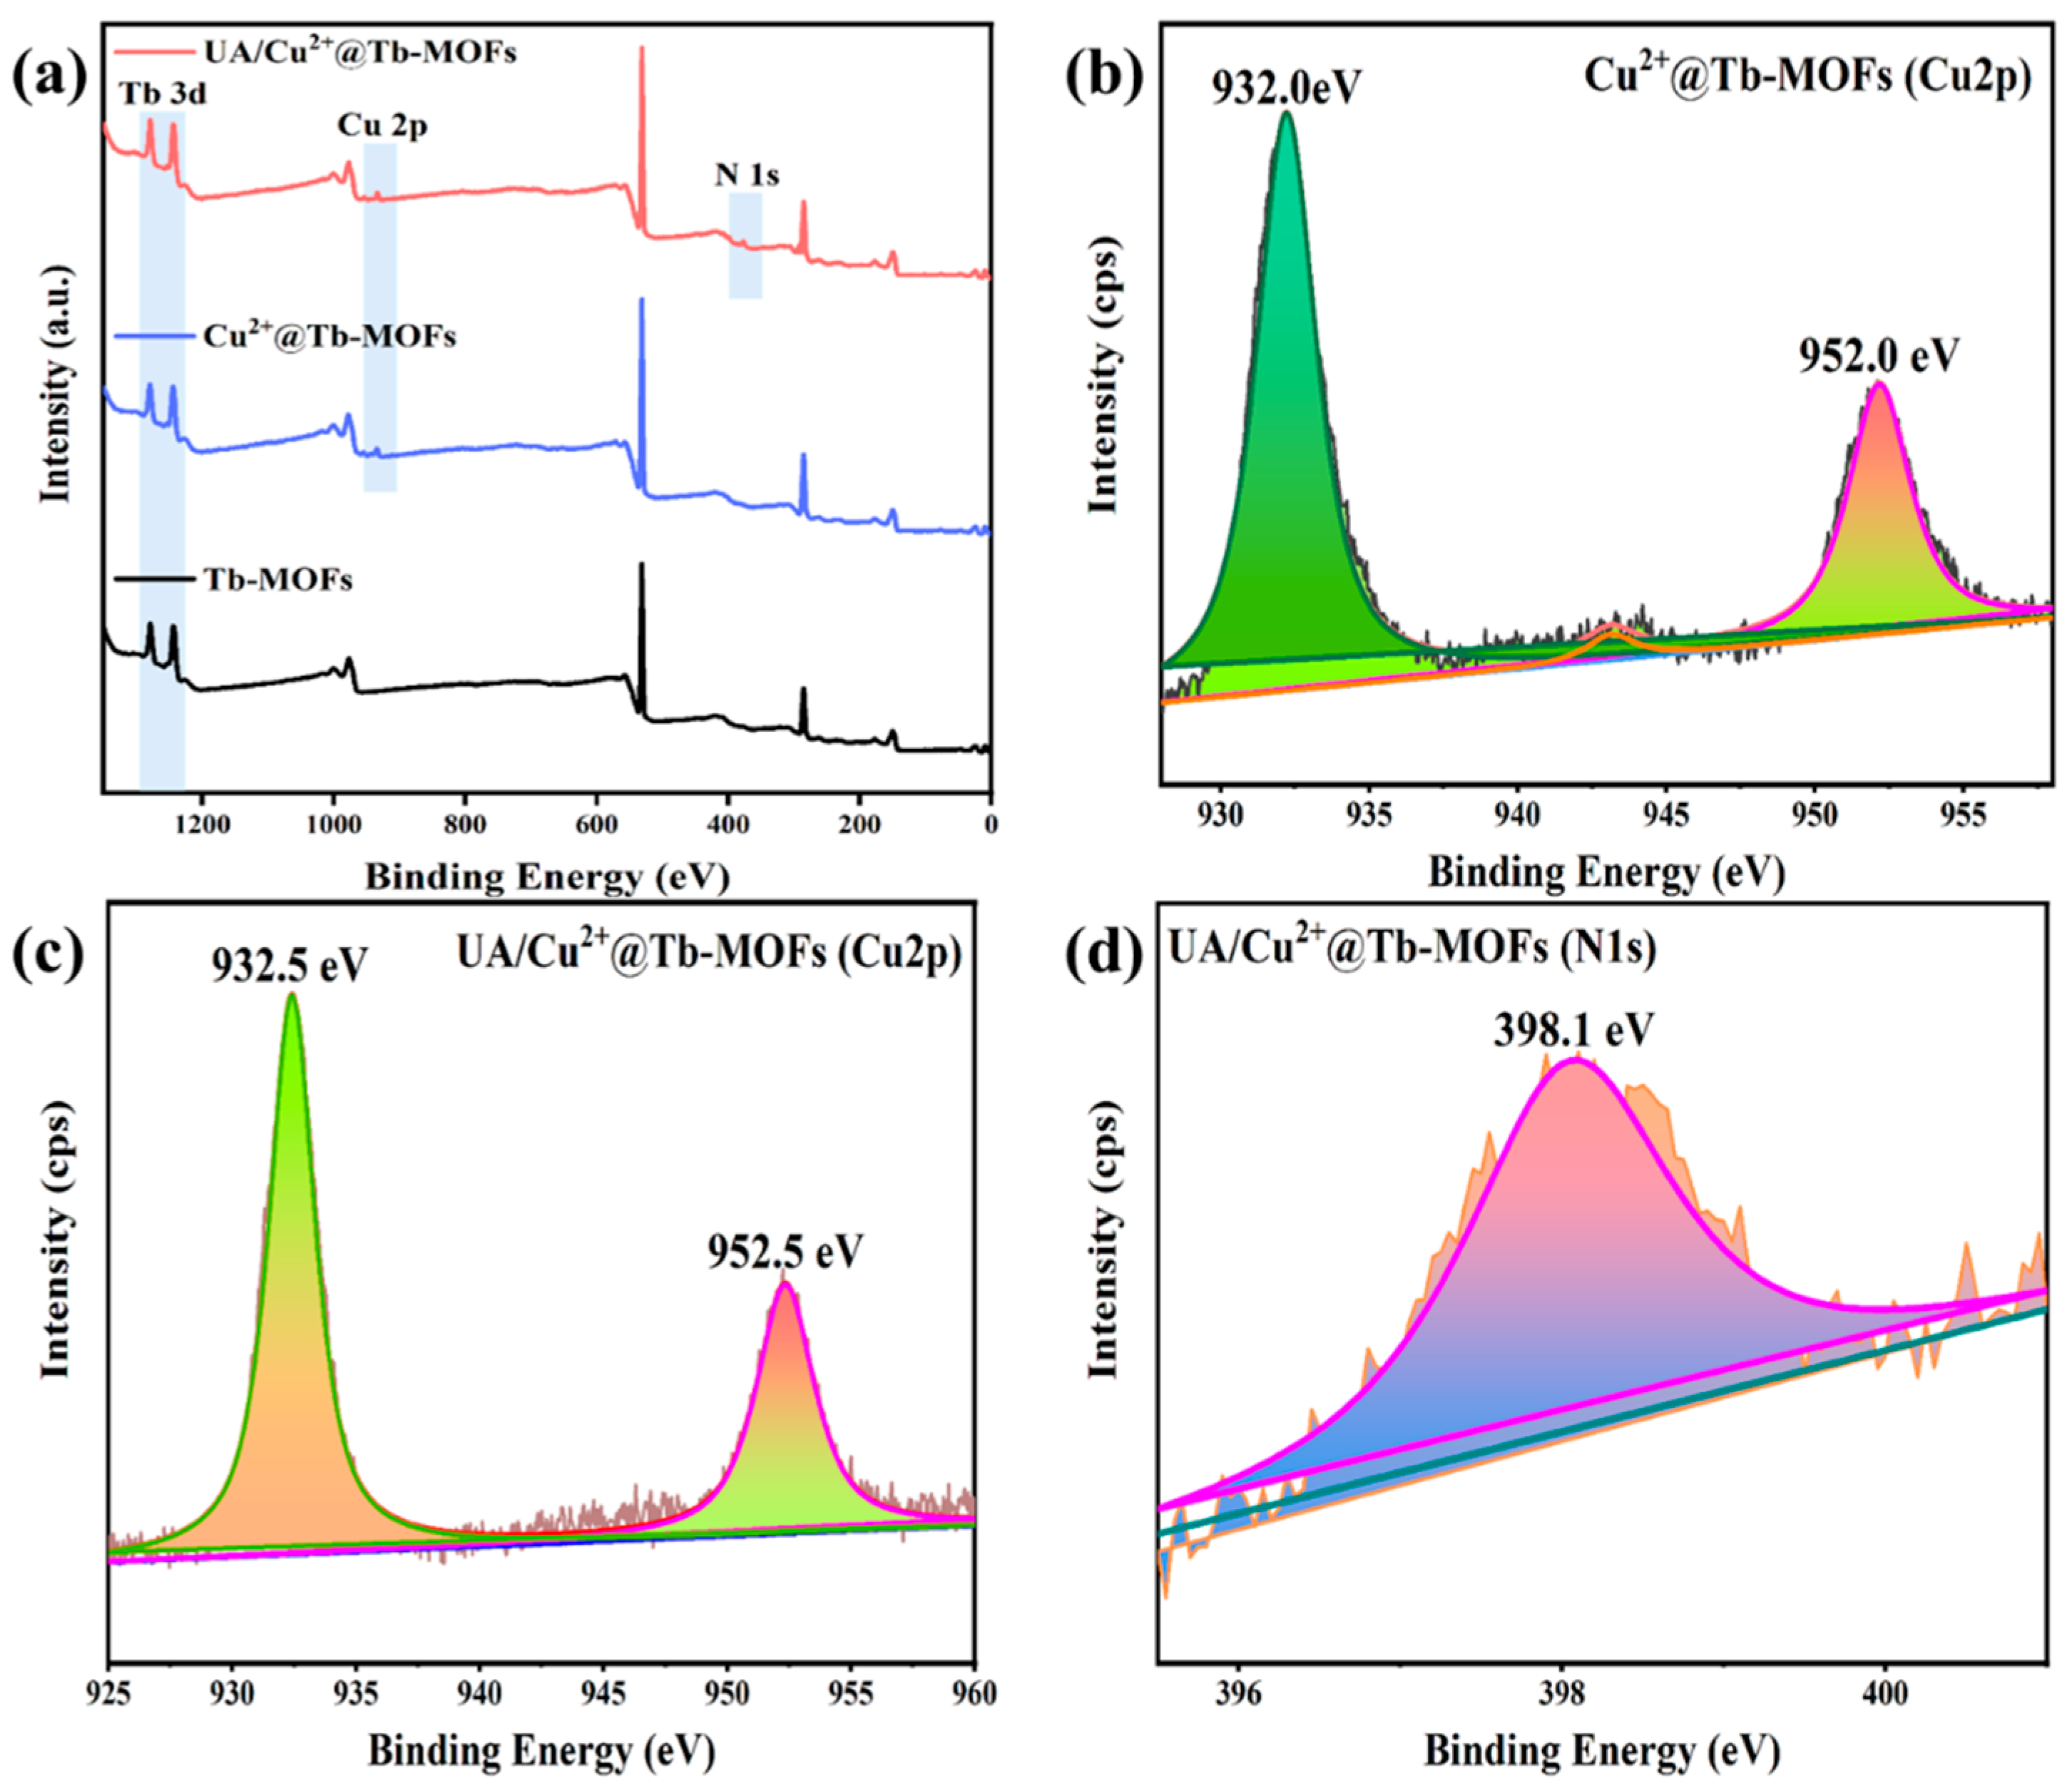
2.1. Characterization of Cu2+@Tb-MOFs Fluorescent Probe

The powder X-ray diffraction patterns (PXRD) of the reported Tb-MOFs, the synthetic crystalline Tb-MOFs and Cu2+@Tb-MOFs samples are shown in Figure 1a. The main diffraction peaks of the prepared Tb-MOFs match well with that of the reported one [40], suggesting that the pure Tb-MOFs samples can be synthesized by this fast and facile method at room temperature. Moreover, the structure of the as-obtained Cu2+@Tb-MOFs is also verified by XRD. Compared with the Tb-MOFs, the positions of the diffraction peaks of Cu2+@Tb-MOFs are basically the same and the intensity varies slightly, indicating that the addition of Cu2+ would not cause a structural change in the Tb-MOFs samples. Moreover, the Cu2+@Tb-MOFs samples were immersed in water, for 12 h and 24 h, or in an environment with different pH values (pH = 3.0~9.0) to test their corresponding XRD patterns. As shown in Figure S1, the crystal structure has hardly changed, indicating that the composite Cu2+@Tb-MOFs have good structural stability in different pH and water environments. The thermogravimetric analysis of Cu2+@Tb-MOFs and Tb-MOFs (Figure S2a) show that there are about three weight-loss intervals. The weight loss of (14.37%) Tb-MOFs sample at the first stage appears at a platform before 200 °C, which is mainly due to the loss of the free water and coordination water molecules in the system. In the second stage, at 200~400 °C, the weight loss (30.9%) is due to the lack of ligand mucus acid. At the third stage, the final weight loss (25.85%) after 400 °C may be due to the pyrolysis of the whole system. The result basically corresponded to the theoretical weight loss rates of the assumed structure of Tb-MOFs. Moreover, the weight loss rates of Cu2+@Tb-MOFs in three stages are 15.43%, 26.73% and 24.93%, respectively. It can be also seen that the structure of Cu2+@Tb-MOFs and Tb-MOFs are the similar. In addition, from the thermal decomposition rate by DTG curve (Figure S2b), it can be observed that the unmodified material Tb-MOFs (orange) and the copper ion modified material Cu2+@Tb-MOFs (green) have similar pyrolysis at about 200 °C. As the pyrolysis temperature is about 400 °C, Tb-MOFs has obvious pyrolysis, whereas Cu2+@Tb-MOFs does not have this process, indicating that Cu2+@Tb-MOFs has better high-temperature anti-pyrolysis ability.
Morphology of Cu2+@Tb-MOFs was studied by scanning electron micrograph (SEM). As shown in Figure 1b, the Cu2+@Tb-MOFs samples are composed of a large number of cracked spheres with a diameter of 3–5 μm. Comparing the SEM image of Tb-MOFs samples (Figure S3a), the morphology of Cu2+@Tb-MOFs samples had not changed significantly, which is consistent with XRD results. Subsequently, the composition changes of Cu2+@Tb-MOFs (Figure 1c) and Tb-MOFs (Figure S3b) were measured by energy-dispersive X-ray analysis (EDX). The Cu2+@Tb-MOFs samples contained several elements of Tb, C, H, O, and Cu (except Au) and the Tb-MOFs sample contained several elements of Tb, C, H, O (except Au). It can be seen that Cu element is detected in the Cu2+@Tb-MOFs samples, and the mole ratio of Cu and Tb (Cu:Tb = 1.8) is close to the stoichiometric ratio of the addition amount (Cu:Tb = 2.0). Moreover, the loading levels of Cu2+ onto the Tb-MOFs samples have been further evaluated by inductively coupled plasma (ICP) analysis. The experimental molar ratio of Cu/Tb ions in Cu2+@Tb-MOFs was checked to be 1.81, which is also consistent with the analysis result of Cu2+@Tb-MOFs.
The emission spectra of Tb-MOFs and Cu2+@Tb-MOFs are presented in Figure S4. Under the excitation of 227 nm at room temperature, several emission spectra (EM) of Tb3+ appeared at 450~700 nm, belonging to 5D47Fj (j = 6, 5, 4, 3) [41,42], respectively. The maximum emission wavelength is 545 nm (5D47F5), which in principle leads to green emission [43]. However, the Cu2+@Tb-MOFs overall fluorescence emission peak is considerably lower than the normal level of the original Tb-MOFs, so the actual green fluorescence does not appear under UV irradiation. In addition, the fluorescence stability of Cu2+@Tb-MOFs in water and different pH environments was also studied. There was no significant change in the fluorescence spectrum and the corresponding fluorescence intensity histogram (Figure S5), indicating that Cu2+ was locked in the composite Cu2+@Tb-MOFs and had high stability in different pH and water environments. The results show that Cu2+@Tb-MOFs has good pH and water stability and can adapt to various environments, which makes the fluorescent sensor better in practical application.

2.2. Detection of Uric Acid in Aqueous Solutions

To test the potential of Cu2+@Tb-MOFs as fluorescent probes for uric acid, it was immersed in various aqueous solutions of common components in human urine, including uric acid (UA), NaCl, KCl, creatine, glucose (Glu), urea, hippuric acid (HA), creatinine (Cre), NH4Cl, and H2O. Figure 2a shows the fluorescence emission spectra of Cu2+@Tb-MOFs sample materials immersed in aqueous solutions of different urine components after sonicating for 20 min. The results show that only uric acid induced a remarkable rebound of the fluorescence spectrum of Cu2+@Tb-MOFs showing a turn-on response, whereas other urine chemicals showed almost no changes. The inset shows the fluorescence measurement of Cu2+@Tb-MOFs in suspension state, the fluorescence intensity 2D-histogram showed that after the addition of UA solution to the composite Cu2+@Tb-MOFs, the fluorescence intensity of Tb3+ at 545 nm was restored and was considerably higher than that of other urine components, suggesting the composite material Cu2+@Tb-MOFs has a good selectivity for UA in biological metabolites. Therefore, the composite Cu2+@Tb-MOFs has specific recognition for the detection of UA in aqueous solution and high selectivity for UA.
The anti-interference of fluorescent nanoprobes is a very significant characteristic of their practical analytical performance. Actual biological samples (in human urine) contain a large number of other molecules that coexist and compete with each other. Therefore, in order to test the effect of the coexistence of other competitive substances on the identification capability of Cu2+@Tb-MOFs, the competitive uric acid response of Cu2+@Tb-MOFs probe in the presence of potentially interfering species in urine was studied under the same experimental conditions. As shown in Figure 2b, as other biological metabolites (except UA) were added, the fluorescence of the composites did not recover, and the intensity did not change significantly; whereas, the luminescence of the composite at 545 nm was restored by the addition of UA, and its fluorescence intensity was significantly improved compared with that before the addition of uric acid. This indicates that other common biological metabolites have little influence on the luminescence of the composite, and that the composite has superior selectivity and strong anti-interference ability for UA detection.
The sensitivity of fluorescent nanoprobes is also one of the important factors in measuring the comprehensive properties of composite materials. Concentration-dependent luminescence was carried out in aqueous solution. The fluorescence response test of the composite material Cu2+@Tb-MOFs was explored for the quantitative detection of uric acid in aqueous solution. The fluorescence titration spectra are showed in Figure S6. It can be clearly that the emission intensity of Cu2+@Tb-MOFs at 545 nm gradually increased with incremental UA concentration. As shown in Figure 2c, the emission intensity of composite material Cu2+@Tb-MOFs has a good linear relationship with UA concentration in the range of 0~104 µM (correlation coefficient R2 = 0.9866). Linear fitting equation: I = (0.310 ± 0.013) [UA] − 174.2 (170 ± 70) ([UA] is the uric acid concentration in the equation, and I is the fluorescence intensity of uric acid aqueous solutions with different concentrations). According to the IUPAC 3σ criterion formula: 3σ/K (σ is the standard deviation of 20 repeated fluorescence measurements of blank solution, K is the slope of the fitting line). The detection limit (LOD) [44] is calculated to be 0.65 µM, which is much lower than the normal concentration of uric acid in blood (0.21~0.42 mM) and urine (0.95~4.50 mM) [16]. This linear relationship can be used to quantitatively measure unknown concentrations of UA in real biological samples. So, the composite MOFs Cu2+@Tb-MOFs is a fluorescence monitoring material with excellent response to UA, and that has excellent selectivity and high sensitivity. In addition, the performance comparison of different nanoprobes for uric acid detection is listed in Table 1. Comparing different probes, Cu2+@Tb-MOFs has a wider detection range and a lower LOD value, which makes its performance comparable or better than other probes reported in the literature.
In order to make the fluorescence sensor easier and more intuitive in practical application, it is designed as a portable test paper for uric acid detection. As shown in Figure 2d, the test paper was immersed in uric acid solutions, and the results could be directly observed under UV irradiation (Figure 2d, d-2) after drying in the air. The test paper showed a dull color with almost no fluorescence before being soaked in uric acid solution, whereas the test paper treated with uric acid solution showed a bright green color. Thus, the fluorescence color of the test paper can be directly distinguished by the naked eye. General information about uric acid concentration can be obtained, which can be used for preliminary detection to determine whether the related diseases are caused by high uric acid. Therefore, the composite probe based on Cu2+@Tb-MOFs showed excellent performance in the detection of uric acid.
Recyclable performance plays an important role in practical applications when composite materials are used as sensors. To investigate the reversibility of Cu2+@Tb-MOFs material, the fluorescence intensity of Cu2+@Tb-MOFs at 545 nm was monitored. After completing the test of UA detection, Cu2+ was added into the composite solution for the next measurement. As illustrated in Figure S7, the fluorescence intensity of Cu2+@Tb-MOFs recovered as a result of UA addition, whereas the intensity decreased when Cu2+ existed. After four recycles, performed by successive addition of UA and Cu2+, the fluorescence intensity of the Cu2+@Tb-MOFs material sensor obtained changed little compared with that of the initial cycle, which indicates that the Cu2+@Tb-MOFs material sensor can be used for recyclable detection of UA.

2.3. Sensing Mechanism

The possible mechanism of the Cu2+@Tb-MOFs sample for UA detection was investigated in detail. As shown in Figure 3a, the powder X-ray diffraction pattern of UA/Cu2+@Tb-MOFs collected from UA aqueous solution is in good agreement with that of Cu2+@Tb-MOFs and Tb-MOFs. This result not only indicates the structural stability of Cu2+@Tb-MOFs, but also excludes the possibility of fluorescence recovery caused by structural collapse or reorganization [48,49]. The luminescence lifetime is a very important parameter to explore the fluorescence recovery mechanism of Cu2+@Tb-MOFs; we determined the fluorescence lifetime of Tb-MOFs, Cu2+@Tb-MOFs and UA/Cu2+@Tb-MOFs samples. As shown in the Figure 3b, the fluorescence lifetime of the generated Cu2+@Tb-MOFs (5.7 μs) decreases greatly compared with that of Tb-MOFs (910.0 μs). After adding UA to Cu2+@Tb-MOFs, the fluorescence life of UA/Cu2+@Tb-MOFs was partially recovered and enhanced (from 5.7 μs to 234.5 μs) [50]. This restored emission lifetime indicates the interaction between UA sites and Cu2+ promotes the recovery of the fluorescent probes [51].
The XPS patterns of Tb-MOFs, Cu2+@Tb-MOFs and UA/Cu2+@Tb-MOFs are shown in Figure 4. After the introduction of UA, the peak position of Cu 2p of UA/Cu2+@Tb-MOFs exhibits a higher binding energy (932.5 and 952.5 eV) compared to that of Cu2+@Tb-MOFs (932.0 and 952.0 eV) (Figure 4b,c), which is also direct proof of the interaction between Cu2+ and UA in Cu2+@Tb-MOFs [34]; whereas, a new peak position of N 1s (Figure 4d) appeared in the XPS sub-peak of UA/Cu2+@Tb-MOFs. Considering N element does not exist in Cu2+@Tb-MOFs structure, the signal of N 1s of UA/Cu2+@Tb-MOFs could be caused by the addition of uric acid (Figure S8), giving another powerful proof of successful coordination. Therefore, it can be speculated that, after the addition of uric acid recognition, Cu2+ reacts with uric acid in the UA/Cu2+@Tb-MOFs system fixed on the surface or in the holes of MOFs.
The mechanism of fluorescence recovery was further studied. Shown in Figure S9 are the fluorescence spectra of Tb-MOFs in water (a) and uric acid (d), as well as the fluorescence spectra of Cu2+@Tb-MOFs suspension with uric acid (b) and without uric acid (c). The fluorescence spectrum of UA/Tb-MOFs formed by Tb-MOFs combining with uric acid was similar to that of the initial Tb-MOFs. Therefore, uric acid did not affect the fluorescence of Tb-MOFs. However, Cu2+@Tb-MOFs composites have almost no fluorescence emission, and Cu2+ has an obvious quenching effect on the 4f–4f transition of Tb3+. The fluorescence intensity recovered when uric acid was added to Cu2+@Tb-MOFs suspension. As shown in Figure S10, under UV irradiation, the observed results of the corresponding substance are consistent with the change of fluorescence intensity in Figure S9. Compared with the Cu2+@Tb-MOFs, the fluorescence intensity of UA/Cu2+@Tb-MOFs formed by UA doping was significantly recovered, and under UV lamp irradiation, the results can be clearly identified with the eye.
In order to further explore the mechanism of fluorescence recovery of Cu2+@Tb-MOFs composite to UA, the visible absorption spectra of a Cu2+ solution and a mixed solution of Cu2+ and UA were tested. As shown in Figure S11, compared with the visible absorption spectra of the Cu2+ solution, the absorption peaks of the mixed solution of Cu2+ and UA have changed, further indicating that there is an intense reaction between Cu2+ and UA [52]. Therefore, based on the above experiments, it can be reasonably inferred that the interaction between Cu2+ and UA is the main factor. The nitrogen/oxygen-containing group in the structure of uric acid was employed as a strong Cu2+ chelator to Cu2+@Tb-MOFs composites, and Cu2+ was removed from the surface of Cu2+@Tb-MOFs composites, leading to fluorescence recovery of Cu2+@Tb-MOFs composites.

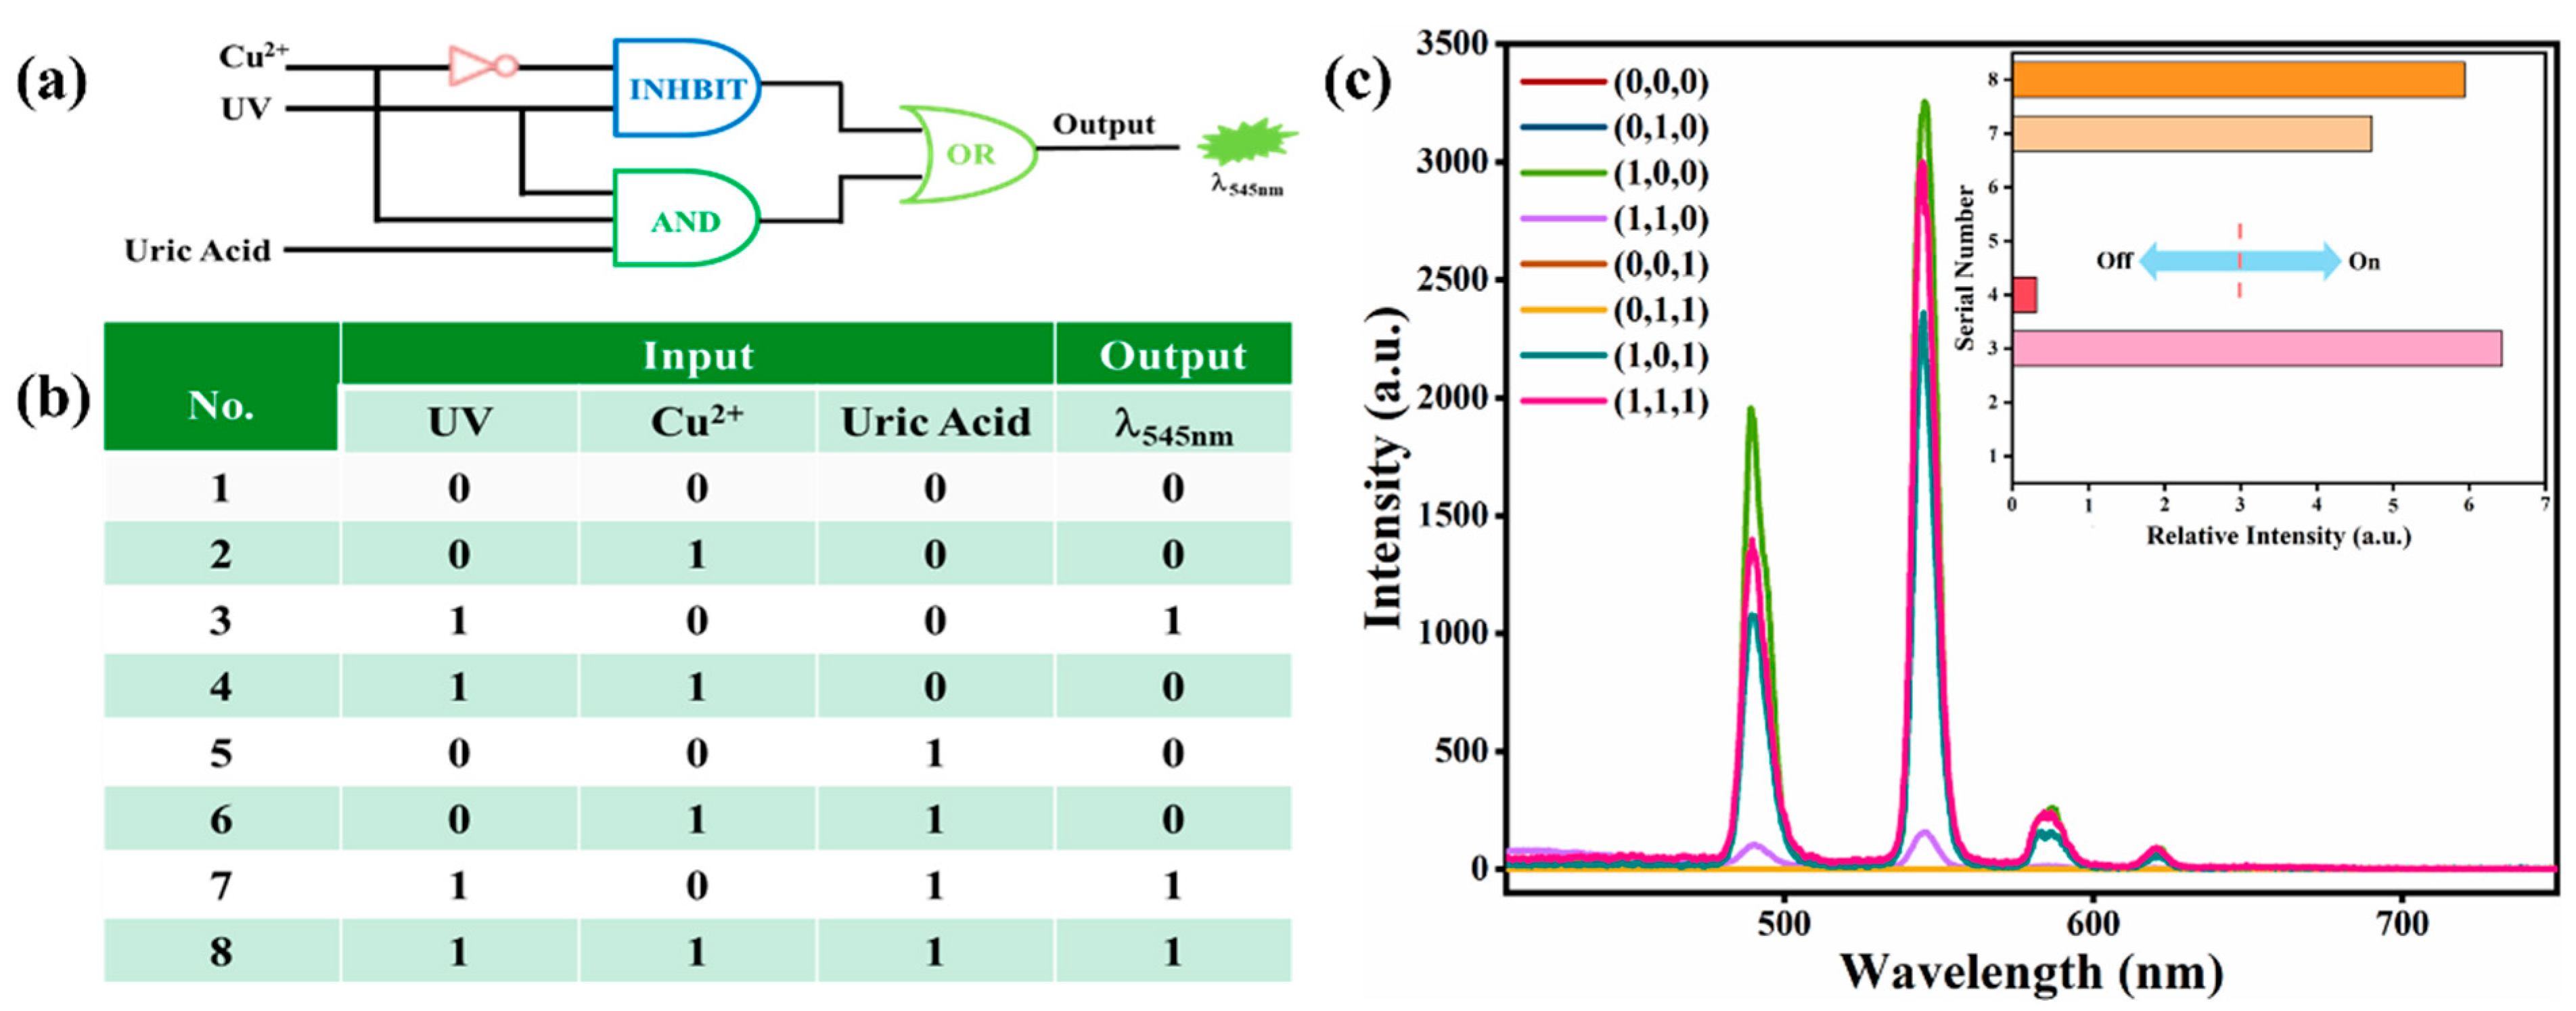
2.4. Construction of Luminescent Logic Gate

Based on the successful observation of Cu2+@Tb-MOFs selective analysis ability toward UA, we have developed a fluorescent logic gate system capable of multipath analysis of UA substance in the system. In the logical operation, Tb-MOFs act as gates, while the substance to be detected (Cu2+, UA and the necessary premise of UV) and fluorescence emission changes serve as chemical input and output at 545 nm (λ545nm), respectively (Figure 5). As shown in Figure 5a, the input is “off” (i.e., 0) when the detection substances (Cu2+, UA and UV) are not injected and the input is “on” (i.e., 1) when the substances are added. The output value is defined as 1 (fluorescence recovery “ON”) or 0 (fluorescence quenching “OFF”) by comparing with the output threshold (fluorescence emission relative intensity at 545 nm). Then, INHIBIT, AND, and OR logical operations are driven by different input scenarios. The truth table (Figure 5b) has 8 input cases, among which the output is 1 when the input is (1/0/0, 1/0/1, 1/1/1) and 0 when the input is other cases. It can be seen from Figure 5c that the threshold of the system is related to the fluorescence intensity at 545 nm emission center. The threshold is expressed as the relative intensity below and above 3 under different input conditions. The output is “1” when the relative intensity is higher than the threshold value, whereas the output is “0” when the relative intensity is lower than the threshold value, and the output response signals can be observed by the naked eye as fluorescence recovery and fluorescence quenching, respectively. This molecular logic gate sensor can directly carry out visual detection of UA through logic operation and analyze the changes of these different inputs. To the best of our knowledge, this is the first example of the design of a logic gate system for detecting uric acid using Cu(II) functionalized metal–organic frameworks.

3. Experimental Section

3.1. Reagents and Instruments

All chemical reagents and solvents are commercially available.

3.2. Synthesis of Tb-MOFs and Cu2+@Tb-MOFs

The Tb-MOFs (Tb(L)1.5·5H2O, L = C6H10O8) sample was synthesized according to our previous report via a modified procedure [53]. Firstly, 0.4 mmol mucic acid was dissolved in 20 mL of distilled water and vigorously stirred for 20 min. Then, 2.5 mL of 0.35 M KOH solution was added into the solution and stirred vigorously for 30 min. After the solution was completely dissolved, a transparent solution was obtained. Then, 8 mL of 0.025 M Tb(NO3)3 solution was added. The whole reaction process was kept at room temperature with vigorous stirring until the reaction stopped after 30 min. The resulting precipitates were washed alternately with distilled water and ethanol solution several times, and then dried for 24 h in an oven at 55 °C.
The Cu2+@Tb-MOFs sample was synthesized using a simple ultrasonic immersion method. Firstly, the as-synthesized Tb-MOFs were immersed in 1 mM aqueous solution of Cu2+ and then the mixture was shaken uniformly and equilibrated evenly for 30 min by ultrasound treatment. Finally, the precipitates obtained were collected centrifugally and dried in an oven for 24 h.

3.3. Fluorescence Sensing of Detection UA

In a typical process for sensing urine chemicals, 3.0 mg of Cu2+@Tb-MOFs powders were simply added into the aqueous solutions (5 mL, 10 mM) of different urine chemicals, including uric acid (UA), NaCl, KCl, creatine, glucose (Glu), urea, hippuric acid (HA), creatinine (Cre), NH4Cl, and H2O. The luminescence spectra of these suspensions were measured after sonicating for 20 min. Each measurement was repeated three times, and the average value was used. In the selectivity experiment, 2 mL of the Cu2+@Tb-MOFs suspension was added into a mixture containing both interfering analyte and UA.
The pH value and water stability of Cu2+@Tb-MOFs were determined by soaking 20 mg Cu2+@Tb-MOFs powder in 10 mL solution with pH values of 3~9 and standing for 24 h before centrifugal drying. In addition, 20 mg Cu2+@Tb-MOFs powder was immersed in 10 mL aqueous solution and stood for 24 h and 48 h, respectively. Then the PXRD and luminescence spectra were measured.
The preparation of portable uric acid test paper: the filter paper (3 cm × 1 cm) was dipped in the dispersion of Cu2+@Tb-MOFs solution for 24 h, and then dried at room temperature.

4. Conclusions

In summary, a novel composite metal–organic framework Cu2+@Tb-MOFs is proposed for the detection of uric acid, a purine metabolite in living organisms. The prepared Cu2+@Tb-MOFs not only has good water stability and pH stability, but also has high sensitivity and anti-interference ability when other urine components coexist. The accurate determination of uric acid is achieved through the “turn on” fluorescence trigger mode, with a wide linear detection range (0~104 µM) and a LOD as low as 0.65 µM, which improves the reliability of uric acid detection analysis and reduces the possibility of resulting false diagnosis. These results show that the composite material Cu2+@Tb-MOFs can be used as a promising fluorescence sensor for the detection of uric acid in urine. More importantly, a molecular logic gate was constructed, providing a promising technology for UA detection by intelligent control. This research may help to design other biochemical sensors and further open fluorescence applications in logic devices.

Supplementary Materials

The following supporting information can be downloaded at: https://www.mdpi.com/article/10.3390/molecules27154803/s1, Characterization; Figure S1: (a) XRD patterns of Cu2+@Tb-MOFs in different pH aqueous solutions; (b) XRD patterns of Cu2+@Tb-MOFs after immersing in aqueous solutions for a few hours. Figure S2: (a) TGA of Tb-MOFs and Cu2+@Tb-MOFs samples; (b) DTG of Tb-MOFs and Cu2+@Tb-MOFs samples. Figure S3: (a) SEM and (b) EDX of Tb-MOFs samples. Figure S4: Emission (red line) spectra of as-prepared Cu2+@Tb-MOFs samples; emission (blue line) spectra of as-prepared Tb-MOFs samples. Figure S5: (a)The fluorescence intensity of Cu2+@Tb-MOFs at various immersion pH solutions; (b)The histogram of fluorescence intensity of Cu2+@Tb-MOFs at various immersion pH solutions; (c)The fluorescence intensity of Cu2+@Tb-MOFs at various immersion times; (d)The histogram of fluorescence intensity of Cu2+@Tb-MOFs at various immersion times. Figure S6: The fluorescence recovery response of UA to Cu2+@Tb-MOFs. Figure S7: The histogram of relative fluorescence intensity of Cu2+@Tb-MOFs at 545 nm after four recycles. Figure S8: The Chemical structural formula of uric acid. Figure S9: The fluorescence emission spectrum of Tb-MOFs (red), Cu2+@Tb-MOFs (blue), UA/Cu2+@Tb-MOFs (green) and UA/Tb-MOFs (purple), respectively. Figure S10: The corresponding photograph of samples under light (side view) and UV-light irradiation (top view), respectively: (a) Tb-MOFs; (b) Cu2+@Tb-MOFs; (c) UA/Cu2+@Tb-MOFs; (d) UA/Tb-MOFs. Figure S11: The UV-Vis absorption spectra of Cu2+ solution and mixed solution of Cu2+ and UA.

Author Contributions

Conceptualization, J.Y. and J.C.; methodology, J.Y.; software, X.J. and Y.F.; investigation, J.C. and Y.F.; resources, D.G.; data curation, J.C.; writing—original draft preparation, J.Y.; writing—review and editing, J.B. and Z.N.; project administration, J.B.; funding acquisition, D.G. and Z.N.; supervision, Z.N. All authors have read and agreed to the published version of the manuscript.

Funding

This work was financially supported by the National Key R&D Program of China (No. 2017YFC0504903) and the Project of Science & Technology Department of Sichuan Province (No. 2021YFG0277).

Institutional Review Board Statement

Not applicable.

Informed Consent Statement

Not applicable.

Data Availability Statement

Not applicable.

Conflicts of Interest

The authors declare no conflict of interest.

Sample Availability

Samples of the compounds are available from the authors.

References

  1. Dincer, H.E.; Dincer, A.P.; Levinson, D.J. Asymptomatic Hyperuricemia: To Treat or Not to Treat. Clevel. Clin. J. Med. 2002, 69, 594–608. [Google Scholar] [CrossRef] [PubMed] [Green Version]
  2. Vitart, V.; Rudan, I.; Hayward, C.; Gray, N.K.; Floyd, J.; Palmer, C.N.; Knott, S.A.; Kolcic, I.; Polasek, O.; Graessler, J. SLC2A9 is a newly identified urate transporter influencing serum urate concentration, urate excretion and gout. Nat. Genet. 2008, 40, 437–442. [Google Scholar] [CrossRef] [PubMed]
  3. Westley, C.; Xu, Y.; Carnell, A.J.; Turner, N.J.; Goodacre, R. Label-free surface enhanced Raman scattering approach for high-throughput screening of biocatalysts. Anal. Chem. 2016, 88, 5898–5903. [Google Scholar] [CrossRef] [PubMed]
  4. Ragab, G.; Elshahaly, M.; Bardin, T. Gout: An old disease in new perspective—A review. J. Adv. Res. 2017, 8, 495–511. [Google Scholar] [CrossRef] [PubMed]
  5. Zheng, Q.; Xiong, L.; Yu, L.; Wu, D.; Yang, C.; Xiao, Y. An enzyme-free fluorescent sensing platform for the detection of uric acid in human urine. J. Lumin. 2021, 236, 118076. [Google Scholar] [CrossRef]
  6. Kim, M.-C.; Kwak, J.; Lee, S.-Y. Sensing of uric acid via cascade catalysis of uricase and a biomimetic catalyst. Sens. Actuators B 2016, 232, 744–749. [Google Scholar] [CrossRef]
  7. Liu, X.; Qi, W.; Wang, Y.; Lin, D.; Yang, X.; Su, R.; He, Z. Rational design of mimic multienzyme systems in hierarchically porous biomimetic metal–organic frameworks. ACS Appl. Mater. Interfaces 2018, 10, 33407–33415. [Google Scholar] [CrossRef] [PubMed]
  8. Guo, J. Uric acid monitoring with a smartphone as the electrochemical analyzer. Anal. Chem. 2016, 88, 11986–11989. [Google Scholar] [CrossRef] [Green Version]
  9. Su, C.-H.; Sun, C.-L.; Liao, Y.-C. Printed combinatorial sensors for simultaneous detection of ascorbic acid, uric acid, dopamine, and nitrite. ACS Omega 2017, 2, 4245–4252. [Google Scholar] [CrossRef] [Green Version]
  10. Cai, X.; Hu, A.; Feng, F. Synthesis of a sulfonated methylene blue-backboned polymer for biodetections. Dyes Pigm. 2022, 203, 110360. [Google Scholar] [CrossRef]
  11. Samoson, K.; Soleh, A.; Saisahas, K.; Promsuwan, K.; Saichanapan, J.; Kanatharana, P.; Thavarungkul, P.; Chang, K.H.; Lim Abdullah, A.F.; Tayayuth, K.; et al. Facile fabrication of a flexible laser induced gold nanoparticle/chitosan/porous graphene electrode for uric acid detection. Talanta 2022, 243, 123319. [Google Scholar] [CrossRef] [PubMed]
  12. Sun, Z.; Liang, P. Determination of Cr (III) and total chromium in water samples by cloud point extraction and flame atomic absorption spectrometry. Microchim. Acta 2008, 162, 121–125. [Google Scholar] [CrossRef]
  13. Dey, N.; Bhattacharya, S. Nanomolar level detection of uric acid in blood serum and pest-infested grain samples by an amphiphilic probe. Anal. Chem. 2017, 89, 10376–10383. [Google Scholar] [CrossRef] [PubMed]
  14. Xin, X.; Zhang, M.; Zhao, J.; Han, C.; Liu, X.; Xiao, Z.; Zhang, L.; Xu, B.; Guo, W.; Wang, R. Fluorescence turn-on detection of uric acid by a water-stable metal–organic nanotube with high selectivity and sensitivity. J. Mater. Chem. C 2017, 5, 601–606. [Google Scholar] [CrossRef]
  15. Gavrilenko, N.A.; Volgina, T.N.; Pugachev, E.V.; Gavrilenko, M.A. Visual determination of malachite green in sea fish samples. Food Chem. 2019, 274, 242–245. [Google Scholar] [CrossRef]
  16. Westley, C.; Xu, Y.; Thilaganathan, B.; Carnell, A.J.; Turner, N.J.; Goodacre, R. Absolute quantification of uric acid in human urine using surface enhanced Raman scattering with the standard addition method. Anal. Chem. 2017, 89, 2472–2477. [Google Scholar] [CrossRef] [Green Version]
  17. Cheng, F.-C.; Kuo, J.-S.; Chang, W.-H.; Juang, D.-J.; Shih, Y.; Lai, J.-S. Rapid and reliable high-performance liquid chromatographic method for analysing human plasma serotonin, 5-hydroxyindoleacetic acid, homovanillic acid and 3,4-dihydroxyphenylacetic acid. J. Chromatogr. B 1993, 617, 227–232. [Google Scholar] [CrossRef]
  18. Dai, X.; Fang, X.; Zhang, C.; Xu, R.; Xu, B. Determination of serum uric acid using high-performance liquid chromatography (HPLC)/isotope dilution mass spectrometry (ID-MS) as a candidate reference method. J. Chromatogr. B 2007, 857, 287–295. [Google Scholar] [CrossRef]
  19. Zhou, S.; Zuo, R.; Zhu, Z.; Wu, D.; Vasa, K.; Deng, Y.; Zuo, Y. An eco-friendly hydrophilic interaction HPLC method for the determination of renal function biomarkers, creatinine and uric acid, in human fluids. Anal. Methods 2013, 5, 1307–1311. [Google Scholar] [CrossRef]
  20. Shi, Q.; Shen, L.-Y.; Xu, H.; Wang, Z.-Y.; Yang, X.-J.; Huang, Y.-L.; Redshaw, C.; Zhang, Q.-L. A 1-Hydroxy-2,4-Diformylnaphthalene-Based Fluorescent Probe and Its Detection of Sulfites/Bisulfite. Molecules 2021, 26, 3064. [Google Scholar] [CrossRef]
  21. Dalapati, R.; Biswas, S. A Pyrene-Functionalized Metal–Organic Framework for Nonenzymatic and Ratiometric Detection of Uric Acid in Biological Fluid via Conformational Change. Inorg. Chem. 2019, 58, 5654–5663. [Google Scholar] [CrossRef] [PubMed]
  22. Geng, L.-Y.; Zhao, Y.; Kamya, E.; Guo, J.-T.; Sun, B.; Feng, Y.-K.; Zhu, M.-F.; Ren, X.-K. Turn-off/on fluorescent sensors for Cu2+ and ATP in aqueous solution based on a tetraphenylethylene derivative. J. Mater. Chem. C 2019, 7, 2640–2645. [Google Scholar] [CrossRef]
  23. Huang, L.-X.; Guo, Q.; Chen, Y.; Verwilst, P.; Son, S.; Wu, J.-B.; Cao, Q.-Y.; Kim, J.S. Nanomolar detection of adenosine triphosphate (ATP) using a nanostructured fluorescent chemosensing ensemble. Chem. Commun. 2019, 55, 14135–14138. [Google Scholar] [CrossRef]
  24. Lobas, M.A.; Tao, R.; Nagai, J.; Kronschläger, M.T.; Borden, P.M.; Marvin, J.S.; Looger, L.L.; Khakh, B.S. A genetically encoded single-wavelength sensor for imaging cytosolic and cell surface ATP. Nat. Commun. 2019, 10, 711. [Google Scholar] [CrossRef] [Green Version]
  25. Han, L.-J.; Kong, Y.-J.; Zhang, X.-M.; Hou, G.-Z.; Chen, H.-C.; Zheng, H.-G. Fluorescence recognition of adenosine triphosphate and uric acid by two Eu-based metal–organic frameworks. J. Mater. Chem. C 2021, 9, 6051–6061. [Google Scholar] [CrossRef]
  26. Ma, C.; Li, P.; Xia, L.; Qu, F.; Kong, R.-M.; Song, Z.-L. A novel ratiometric fluorescence nanoprobe for sensitive determination of uric acid based on CD@ZIF-CuNC nanocomposites. Microchim. Acta 2021, 188, 259. [Google Scholar] [CrossRef] [PubMed]
  27. Feng, L.; Dong, C.; Li, M.; Li, L.; Jiang, X.; Gao, R.; Wang, R.; Zhang, L.; Ning, Z.; Gao, D.; et al. Terbium-based metal-organic frameworks: Highly selective and fast respond sensor for styrene detection and construction of molecular logic gate. J. Hazard. Mater. 2020, 388, 121816. [Google Scholar] [CrossRef]
  28. Dong, C.-L.; Li, M.-F.; Yang, T.; Feng, L.; Ai, Y.-W.; Ning, Z.-L.; Liu, M.-J.; Lai, X.; Gao, D.-J. Controllable synthesis of Tb-based metal–organic frameworks as an efficient fluorescent sensor for Cu2+ detection. Rare Met. 2021, 40, 505–512. [Google Scholar] [CrossRef]
  29. Zhu, Z.-X.; Wang, C.-J.; Luo, D.; Liu, C.; Liu, D.-N.; Xiao, Y.-M.; Chen, S.; Wang, Y.-Y. Six new lanthanide metal–organic frameworks as luminescent sensors for the detection of 1-N, TDGA, UA, and HA in urine. J. Coord. Chem. 2019, 72, 3526–3543. [Google Scholar] [CrossRef]
  30. Han, L.-J.; Kong, Y.-J.; Hou, G.-Z.; Chen, H.-C.; Zhang, X.-M.; Zheng, H.-G. A europium-based MOF fluorescent probe for efficiently detecting malachite green and uric acid. Inorg. Chem. 2020, 59, 7181–7187. [Google Scholar] [CrossRef]
  31. Liu, K.; Chen, Y.; Dong, X.; Huang, H. Simultaneous voltammetric determination of dopamine and uric acid based on MOF-235 nanocomposite. Inorg. Chem. Commun. 2022, 142, 109584. [Google Scholar] [CrossRef]
  32. Erbas-Cakmak, S.; Kolemen, S.; Sedgwick, A.C.; Gunnlaugsson, T.; James, T.D.; Yoon, J.; Akkaya, E.U. Molecular logic gates: The past, present and future. Chem. Soc. Rev. 2018, 47, 2228–2248. [Google Scholar] [CrossRef] [PubMed] [Green Version]
  33. Pawar, S.; Duadi, H.; Fleger, Y.; Fixler, D. Carbon Dots-Based Logic Gates. Nanomaterials 2021, 11, 232. [Google Scholar] [CrossRef] [PubMed]
  34. Liu, L.; Liu, P.; Ga, L.; Ai, J. Advances in Applications of Molecular Logic Gates. ACS Omega 2021, 6, 30189–30204. [Google Scholar] [CrossRef]
  35. Bu, X.; Fu, Y.; Jiang, X.; Jin, H.; Gui, R. Self-assembly of DNA-templated copper nanoclusters and carbon dots for ratiometric fluorometric and visual determination of arginine and acetaminophen with a logic-gate operation. Microchim. Acta 2020, 187, 154. [Google Scholar] [CrossRef]
  36. Fu, L.; Yu, D.; Zou, D.; Qian, H.; Lin, Y. Engineering the Stability of Nanozyme-Catalyzed Product for Colorimetric Logic Gate Operations. Molecules 2021, 26, 6494. [Google Scholar] [CrossRef]
  37. Li, B.; Zhao, D.; Wang, F.; Zhang, X.; Li, W.; Fan, L. Recent advances in molecular logic gate chemosensors based on luminescent metal organic frameworks. Dalton Trans. 2021, 50, 14967–14977. [Google Scholar] [CrossRef]
  38. Yuan, X.; Bai, F.; Ye, H.; Zhao, H.; Zhao, L.; Xiong, Z. Smartphone-assisted ratiometric fluorescence sensing platform and logical device based on polydopamine nanoparticles and carbonized polymer dots for visual and point-of-care testing of glutathione. Anal. Chim. Acta 2021, 1188, 339165. [Google Scholar] [CrossRef]
  39. Li, B.-N.; Liu, Y.-Y.; Wang, Y.-P.; Pan, M. Visual Detection of Triethylamine and a Dual Input/Output Logic Gate Based on a Eu3+-Complex. Molecules 2021, 26, 3244. [Google Scholar] [CrossRef]
  40. Wong, K.-L.; Law, G.-L.; Yang, Y.-Y.; Wong, W.-T. A Highly Porous Luminescent Terbium–Organic Framework for Reversible Anion Sensing. Adv. Mater. 2006, 18, 1051–1054. [Google Scholar] [CrossRef]
  41. Wang, H.; Yang, T.; Feng, L.; Ning, Z.; Liu, M.; Lai, X.; Gao, D.; Bi, J. Energy Transfer and Multicolor Tunable Luminescence Properties of NaGd0.5Tb0.5−xEux(MoO4)2 Phosphors for UV-LED. J. Electron. Mater. 2018, 47, 6494–6506. [Google Scholar] [CrossRef]
  42. Wu, S.; Zhu, M.; Zhang, Y.; Kosinova, M.; Fedin, V.P.; Gao, E. A Water-Stable Lanthanide Coordination Polymer as Multicenter Platform for Ratiometric Luminescent Sensing Antibiotics. Chem.—Eur. J. 2020, 26, 3137–3144. [Google Scholar] [CrossRef] [PubMed]
  43. Wu, S.; Zhu, M.; Zhang, Y.; Kosinova, M.; Fedin, V.P.; Gao, E. Luminescent sensors based on coordination polymers with adjustable emissions for detecting biomarker of pollutant ethylbenzene and styrene. Appl. Organomet. Chem. 2021, 35, e6058. [Google Scholar] [CrossRef]
  44. Gontcharenko, V.E.; Lunev, A.M.; Taydakov, I.V.; Korshunov, V.M.; Drozdov, A.A.; Belousov, Y.A. Luminescent Lanthanide-Based Sensor for H2O Detection in Aprotic Solvents and D2O. IEEE Sens. J. 2019, 19, 7365–7372. [Google Scholar] [CrossRef]
  45. Lian, X.; Yan, B. Phosphonate MOFs Composite as Off–On Fluorescent Sensor for Detecting Purine Metabolite Uric Acid and Diagnosing Hyperuricuria. Inorg. Chem. 2017, 56, 6802–6808. [Google Scholar] [CrossRef] [PubMed]
  46. Liu, X.; Qi, W.; Wang, Y.; Su, R.; He, Z. A facile strategy for enzyme immobilization with highly stable hierarchically porous metal–organic frameworks. Nanoscale 2017, 9, 17561–17570. [Google Scholar] [CrossRef]
  47. Liang, X.; Chen, Y.; Wen, K.; Han, H.; Li, Q. Urate oxidase loaded in PCN-222(Fe) with peroxidase-like activity for colorimetric detection of uric acid. J. Mater. Chem. B 2021, 9, 6811–6817. [Google Scholar] [CrossRef]
  48. Li, A.; Chu, Q.; Zhou, H.; Yang, Z.; Liu, B.; Zhang, J. Effective nitenpyram detection in a dual-walled nitrogen-rich In(iii)/Tb(iii)–organic framework. Inorg. Chem. Front. 2021, 8, 2341–2348. [Google Scholar] [CrossRef]
  49. Jin, Y.; Yan, B. A bi-functionalized metal-organic framework based on N-methylation and Eu3+ post-synthetic modification for highly sensitive detection of 4-Aminophenol (4-AP), a biomarker for aniline in urine. Talanta 2021, 227, 122209. [Google Scholar] [CrossRef]
  50. Sahoo, J.; Arunachalam, R.; Subramanian, P.S.; Suresh, E.; Valkonen, A.; Rissanen, K.; Albrecht, M. Coordinatively Unsaturated Lanthanide(III) Helicates: Luminescence Sensors for Adenosine Monophosphate in Aqueous Media. Angew. Chem. Int. Ed. 2016, 55, 9625–9629. [Google Scholar] [CrossRef]
  51. Zhang, Y.; Qu, X.; Yan, B. A visual logic alarm sensor for diabetic patients towards diabetic polyneuropathy based on a metal–organic framework functionalized by dual-cation exchange. J. Mater. Chem. C 2021, 9, 3440–3446. [Google Scholar] [CrossRef]
  52. Zhang, L.; Xu, Y.; Xu, J.; Zhang, H.; Zhao, T.; Jia, L. Intelligent multicolor nano-sensor based on nontoxic dual fluoroprobe and MOFs for colorful consecutive detection of Hg2+ and cysteine. J. Hazard. Mater. 2022, 430, 128478. [Google Scholar] [CrossRef] [PubMed]
  53. Yang, T.; Feng, L.; Chen, B.; Tang, L.; Wang, J.; Ning, Z.; Bi, J.; Gao, D.; Lai, X.; Li, W. Magnolia-like terbium-based metal-organic frameworks hierarchical architectures: Solvent-induced synthesis, microstructure and enhanced luminescent properties. Opt. Mater. 2018, 81, 64–70. [Google Scholar] [CrossRef]
Scheme 1. Schematic diagram of UA detection and application.
Molecules 27 04803 sch001
Figure 1. (a) PXRD patterns of the reported Tb-MOFs, the synthetic crystalline Tb-MOFs and Cu2+@Tb-MOFs samples; (b) SEM image and (c) EDX of Cu2+@Tb-MOFs samples.
Molecules 27 04803 g001
Figure 2. (a)The emission spectra of Cu2+@Tb-MOFs sample materials immersed in various urine composition solutions (the inset is 2D-histogram based on the intensity of 5D47F5 transition of Tb3+ in Cu2+@Tb-MOFs toward various urine chemicals, λex = 337 nm); (b) The fluorescence intensity of Cu2+@Tb-MOFs in the presence of other components in urine (green bars), and the subsequent addition of UA (orange bars); (c) The linear relationship the fluorescence intensity and the concentration of UA; (d) Comparison of Cu2+@Tb-MOFs test paper for uric acid recognition under light (d-1) and UV (d-2) irradiation.
Molecules 27 04803 g002
Figure 3. (a) PXRD pattern of Cu2+@Tb-MOFs and UA/Cu2+@Tb-MOFs; (b) Luminescence decay curve of Tb-MOFs, Cu2+@Tb-MOFs and UA/Cu2+@Tb-MOFs at 545 nm.
Molecules 27 04803 g003
Figure 4. (a) The XPS spectra for Tb-MOFs, Cu2+@Tb-MOFs, UA/Cu2+@Tb-MOFs; (b) The XPS peaks of Cu2+ in Cu2+@Tb-MOFs samples; (c) The XPS peaks of Cu2+ in UA/Cu2+@Tb-MOFs samples; (d) The XPS peaks of N in UA/Cu2+@Tb-MOFs samples.
Molecules 27 04803 g004
Figure 5. (a) Electronic equivalent circuitry of the logic gate; (b) The truth table of the logic gate; (c) Emission spectra of the logic gates (the inset is the relative emission intensity at 545 nm).
Molecules 27 04803 g005
Table 1. The performance of different probes to detect UA.
ProbeWork Range (μM)LOD (μM)Ref.
Eu-BDC@FM0~2000.6[5]
MBP-SO3@Nafion30~300011.3[10]
CD-MONT-21.5~9.14.3[14]
Hf-UiO-66-Py0~301.4[21]
Eu-TDA0~3270.689[30]
MOF-23510~903.46[31]
Cu2+@MIL-91(Al:Eu)0~12001.6[45]
URICASE and HRP@HP-DUT-55~1000.8[46]
PCN-222(Fe)10~8003.5[47]
Cu2+@Tb-MOFs0~1040.65This work
Publisher’s Note: MDPI stays neutral with regard to jurisdictional claims in published maps and institutional affiliations.

