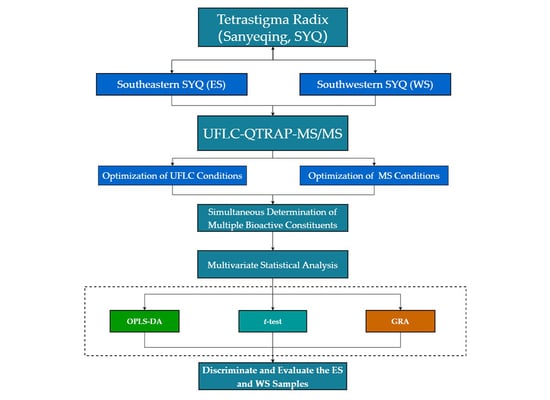
Quality Evaluation of Tetrastigmae Radix from Two Different Habitats Based on Simultaneous Determination of Multiple Bioactive Constituents Combined with Multivariate Statistical Analysis
Abstract
1. Introduction
2. Results
2.1. Optimization of Extraction Conditions
2.2. Optimization of UFLC Conditions
2.3. Optimization of Mass Spectrometry (MS) Conditions
2.4. Method Validation
2.5. Quantitative Analysis of Samples
2.6. OPLS-DA of Samples
2.7. T-Test of Samples
2.8. GRA of Samples
3. Discussion
4. Materials and Methods
4.1. Plant Materials
4.2. Chemicals and Reagents
4.3. Preparation of Standard Solutions
4.4. Preparation of Sample Solutions
4.5. Chromatographic and Mass Spectrometric Conditions
4.6. Validation of the Method
4.7. Multivariate Statistical Analysis
5. Conclusions
Supplementary Materials
Author Contributions
Funding
Institutional Review Board Statement
Informed Consent Statement
Data Availability Statement
Conflicts of Interest
Sample Availability
References
- China State Administration of Traditional Chinese Materia Medica. Chinese Materia Medica. Part 5; Shanghai Scientific and Technical Press: Shanghai, China, 1998; Volume 13, p. 296. [Google Scholar]
- Editorial Committee of Chinese Flora; Chinese Academy of Sciences. Flora of China. Part 48; Science Press: Beijing, China, 1998; Volume 2, p. 122. [Google Scholar]
- Zhu, R.; Xu, X.; Ying, J.; Cao, G.; Wu, X. The Phytochemistry, Pharmacology, and Quality Control of Tetrastigma hemsleyanum Diels & Gilg in China: A Review. Front. Pharmacol. 2020, 11, 550497. [Google Scholar] [CrossRef] [PubMed]
- Chen, X.; Tao, L.; Ru, Y.; Weng, S.; Chen, Z.; Wang, J.; Guo, L.; Lin, Z.; Pan, W.; Qiu, B. Antibacterial mechanism of Tetrastigma hemsleyanum Diels et Gilg’s polysaccharides by metabolomics based on HPLC/MS. Int. J. Biol. Macromol. 2019, 140, 206–215. [Google Scholar] [CrossRef] [PubMed]
- Zhu, B.; Qian, C.; Zhou, F.; Guo, J.; Chen, N.; Gao, C.; Jin, B.; Ding, Z. Antipyretic and antitumor effects of a purified polysaccharide from aerial parts of Tetrastigma hemsleyanum. J. Ethnopharmacol. 2020, 253, 112663. [Google Scholar] [CrossRef]
- Zhou, J.; Hao, W.; Lin, X.; Fan, D.; Feng, Z. Antitumor activity of total flavonoids from Tetrastigma hemsleyanum Diels et Gilg is associated with the inhibition of regulatory T cells in mice. OncoTargets Ther. 2014, 7, 947–956. [Google Scholar] [CrossRef][Green Version]
- Huang, Q.; He, W.; Khudoyberdiev, I.; Ye, C.L. Characterization of polysaccharides from Tetrastigma hemsleyanum Diels et Gilg Roots and their effects on antioxidant activity and H2O2-induced oxidative damage in RAW 264.7 cells. BMC Chem. 2021, 15, 9. [Google Scholar] [CrossRef] [PubMed]
- Chen, S.; Luo, M.; Ma, L.; Lin, W. Ethylacetate extract from Tetrastigma hemsleyanum inhibit-s proliferation and induces apoptosis in HepG2 and SMMC-7721 cells. Cancer Manag. Res. 2018, 10, 3793–3799. [Google Scholar] [CrossRef] [PubMed]
- Sun, Y.; Guo, F.; Peng, X.; Cheng, K.; Xiao, L.; Zhang, H.; Li, H.; Jiang, L.; Deng, Z. Metabolism of Phenolics of Tetrastigma hemsleyanum Roots under In Vitro Digestion and Colonic Fermentation as Well as Their In Vivo Antioxidant Activity in Rats. Foods 2021, 10, 2123. [Google Scholar] [CrossRef]
- Zhou, F.M.; Chen, Y.C.; Jin, C.Y.; Qian, C.D.; Zhu, B.Q.; Zhou, Y.; Ding, Z.S.; Wang, Y.Q. Polysaccharide Isolated from Tetrastigma hemsleyanum Activates TLR4 in Macrophage Cell Lines and Enhances Immune Responses in OVA-Immunized and LLC-Bearing Mouse Models. Front. Pharmacol. 2021, 12, 609059. [Google Scholar] [CrossRef]
- Xiang, Q.; Hu, S.; Ligaba-Osena, A.; Yang, J.; Tong, F.; Guo, W. Seasonal Variation in Transcriptomic Profiling of Tetrastigma hemsleyanum Fully Developed Tuberous Roots Enriches Candidate Genes in Essential Metabolic Pathways and Phytohormone Signaling. Front. Plant Sci. 2021, 12, 659645. [Google Scholar] [CrossRef]
- Ru, Y.; Chen, X.; Xu, J.; Huang, L.; Jiang, M.; Guo, L.; Lin, Z.; Qiu, B.; Wong, K.Y. Hypoglycemic Effects of a Polysaccharide from Tetrastigma hemsleyanum Diels & Gilg in Alloxan-Induced Diabetic Mice. Chem. Biodivers. 2018, 15, e1800070. [Google Scholar] [CrossRef] [PubMed]
- Zhan, L.; Pu, J.; Zheng, J.; Hang, S.; Pang, L.; Dai, M.; Ji, C. Tetrastigma hemsleyanum Diels et Gilg ameliorates lipopolysaccharide induced sepsis via repairing the intestinal mucosal barrier. Biomed. Pharmacother. 2022, 148, 112741. [Google Scholar] [CrossRef] [PubMed]
- Li, Y.; Feng, X.; Zhang, Y.; Wang, Y.; Yu, X.; Jia, R.; Yu, T.; Zheng, X.; Chu, Q. Dietary flavone from the Tetrastigma hemsleyanum vine triggers human lung adenocarcinoma apoptosis via autophagy. Food Funct. 2020, 11, 9776–9788. [Google Scholar] [CrossRef] [PubMed]
- Zhang, H.Q.; Liu, P.; Zhu, Z.H.; Dong, L.; Li, W.W.; Qian, D.W.; Duan, J. Analysis and Evaluation of Amino Acids and Nucleosides in Different Parts of Ripe Fruit of Trichosanthes rosthornii Harms. Mod. Chin. Med. 2017, 19, 1683–1687. [Google Scholar] [CrossRef]
- Huang, Z.; Mao, Q.Q. Protective Effects of Total Amino Acids from Radix Tetrastigmae on Acute Hepatic Injury Induced by CCl4. Chin. J. Mod. 2007, 3, 190–192. [Google Scholar] [CrossRef]
- Li, H.; Chen, W.D. HPLC fingerprinting of Tetrastigma Hemsleyanum Diels et Gilg from different habitats. J. Chin. Med. Mater. 2021, 44, 2896–2898. [Google Scholar] [CrossRef] [PubMed]
- Cai, X.J.; Sun, H.J.; Chen, Y.S.; Ding, D.W.; Lu, W.J.; Miu, Q. Comparison and Cluster Analysis of Agronomic Characters of Germplasm Resources of Tetrastigma hemsleyanum Diels et Gilg. Mol. Plant Breed. 2022, 10, 1–11. [Google Scholar]
- Hu, X.T.; Liu, S.Z.; Bai, Y.; Xu, L.Y.; Ding, Y.; Wu, X.Q.; Xu, H.S.; Zhen, B.S. Effects of Different Shading Treatments on Physiology, Biochemistry, and Total Flavonoids of Tetrastigma hemsleyanum in Zhejiang Province. Guihaia 2019, 39, 925–932. [Google Scholar]
- Chen, X.; Guo, H.B.; Liu, T.; Xu, J.J.; Zheng, G.P. Effects of Different Drying Technologies and Slicing on the Quality of Tetrastigma hemsleyanum by Multi-indexes Evaluation. China Pharm. 2017, 28, 4441–4444. [Google Scholar]
- Jiang, Y.L.; Xu, Z.J.; Cao, Y.F.; Wang, F.; Chu, C.; Zhang, C.; Tao, Y.; Wang, P. HPLC fingerprinting-based multivariate analysis of chemical components in Tetrastigma Hemsleyanum Diels et Gilg: Correlation to their antioxidant and neuraminidase inhibition activities. J. Pharm. Biomed. Anal. 2021, 205, 114314. [Google Scholar] [CrossRef] [PubMed]
- Zhu, J.L.; Zhang, X.Q.; Zhang, N.N.; Liang, X.M.; Lin, N.; Lei, H.X. HPLC Method for Simultaneous Determination of Six Flavonoids in Tetrastigma Hemsleyanum Diels et Gilg from Different Habitats. J. Chin. Med. Mater. 2020, 43, 1431–1433. [Google Scholar] [CrossRef]
- Li, P.; Cheng, X.F.; Cen, H.; Li, C. HPLC was Used to Determine the Contents of 7 Components in Tetrastigma Hemsleyanum Diels et Gilg from Different Habitats. J. Chin. Med. Mater. 2020, 43, 2749–2752. [Google Scholar] [CrossRef]
- Wu, H.; Chang, X.; Sang, X.F.; Qiu, B.; Cui, H.F.; Pen, X. Comprehensive Evaluation of Twenty-seven Varieties of Mineral Elements in Tetrastigma hemsleyanum from Different Growing Areas. Chin. Tradit. Pat. Med. 2018, 40, 2475–2480. [Google Scholar]
- Zeng, M.-L. Analysis on Chemical Constituents in Tetrastigma hemsleyanum by UPLC-Triple-TOF/MS. Chin. Tradit. Herb. Drugs 2017, 48, 874–883. [Google Scholar]
- Xu, W.; Fu, Z.Q.; Lin, J.; Huang, X.C.; Chen, D.; Yu, H.M.; Huang, Z.H.; Fan, S.M. Qualitative and Quantitative Study of Main Components of Tetrastigma hemsleyanum Based on HPLC-Q-TOF-MS and UPLC-QQQ-MS. China J. Chin. Mater. Med. 2014, 39, 4365–4372. [Google Scholar]
- Deng, S.S.; Liu, H.X.; Ma, L.H.; Wang, T.T.; Wang, Y.D.; Huang, X.P. UPLC-MS/MS Qualitative Analysis and HPLC Determination of Flavonoids in Leaves of Tetrastigma hemsleyanum. China Med. Her. 2018, 15, 80–84+88. [Google Scholar]
- Feng, G.W.; Li, C.B.; Liao, S.G.; Zhang, L.J.; Li, Y.J.; Long, Q.D.; Wang, Y.L. Rapid Detectionand Identification of Two Isomeric C-glycosides, Orientin /Isoorientin and Vitexin /Isovitexin. Chin. J. Pharm. Anal. 2011, 31, 1263–1268. [Google Scholar] [CrossRef]
- He, J.; Sun, R.B. Multivariate Statistical Analysis for Metabolomic Data: The Key Points in Principal Component Analysis. Acta Pharm. Sin. 2018, 53, 929–937. [Google Scholar] [CrossRef]


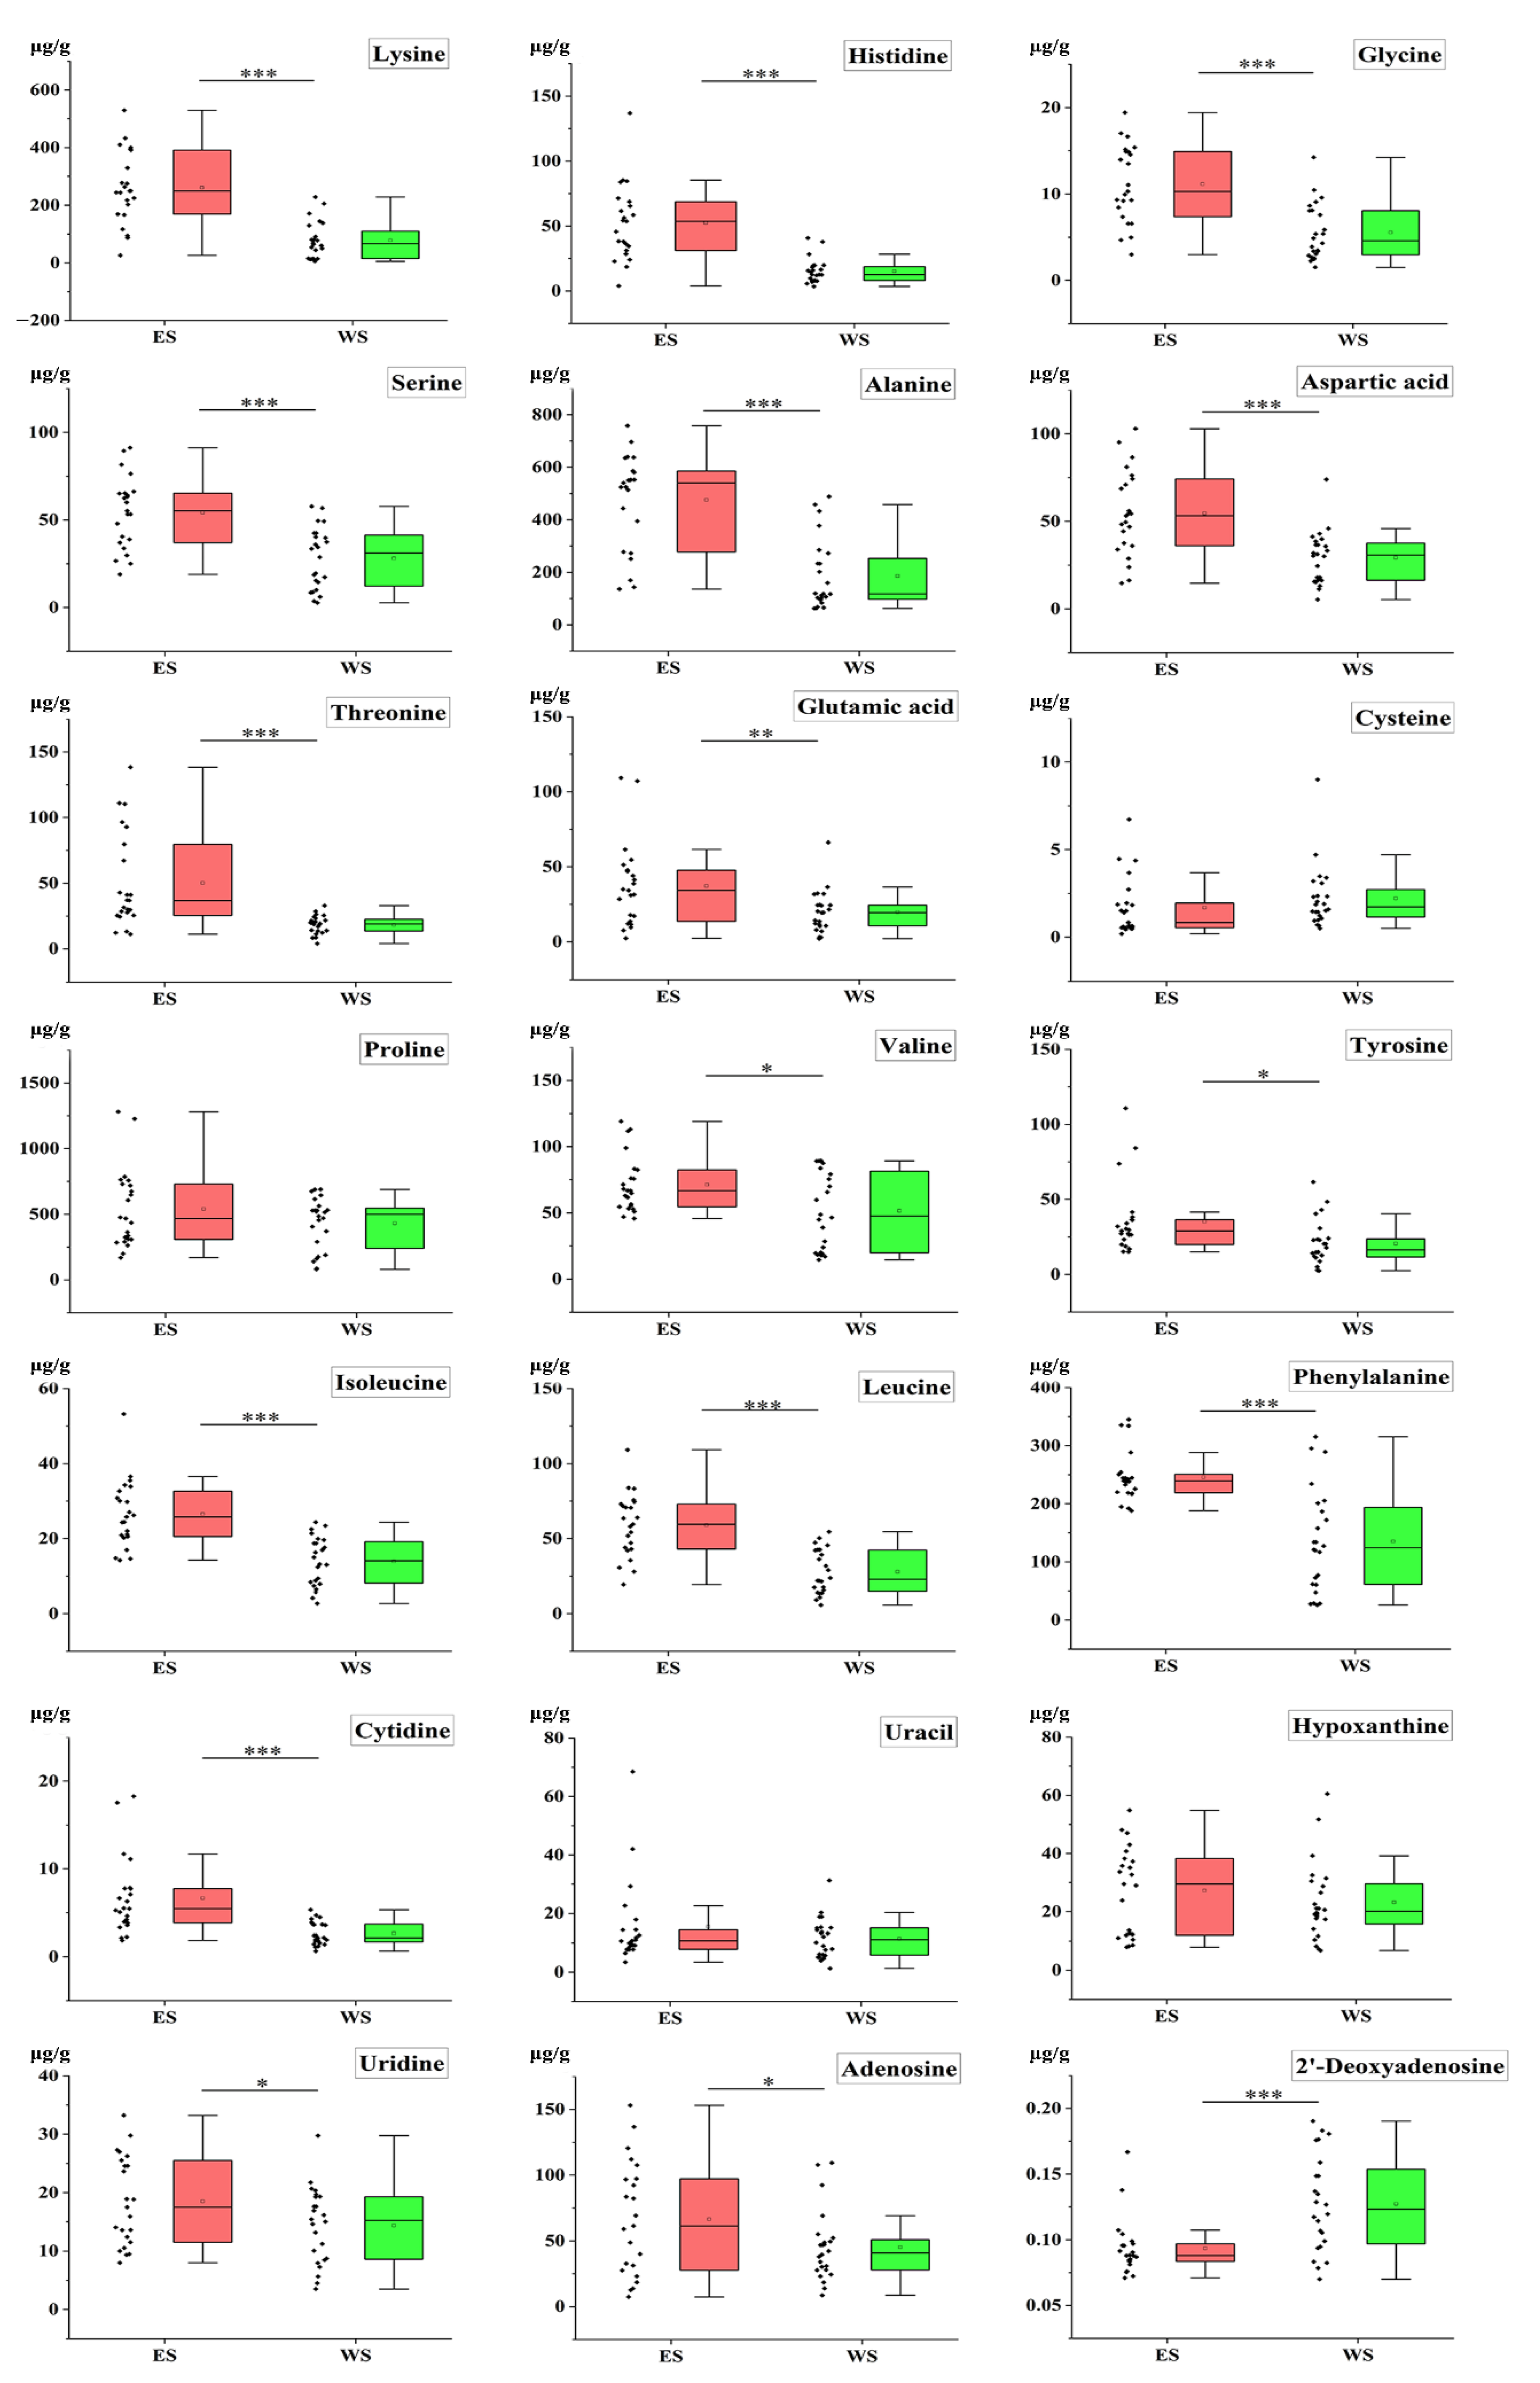
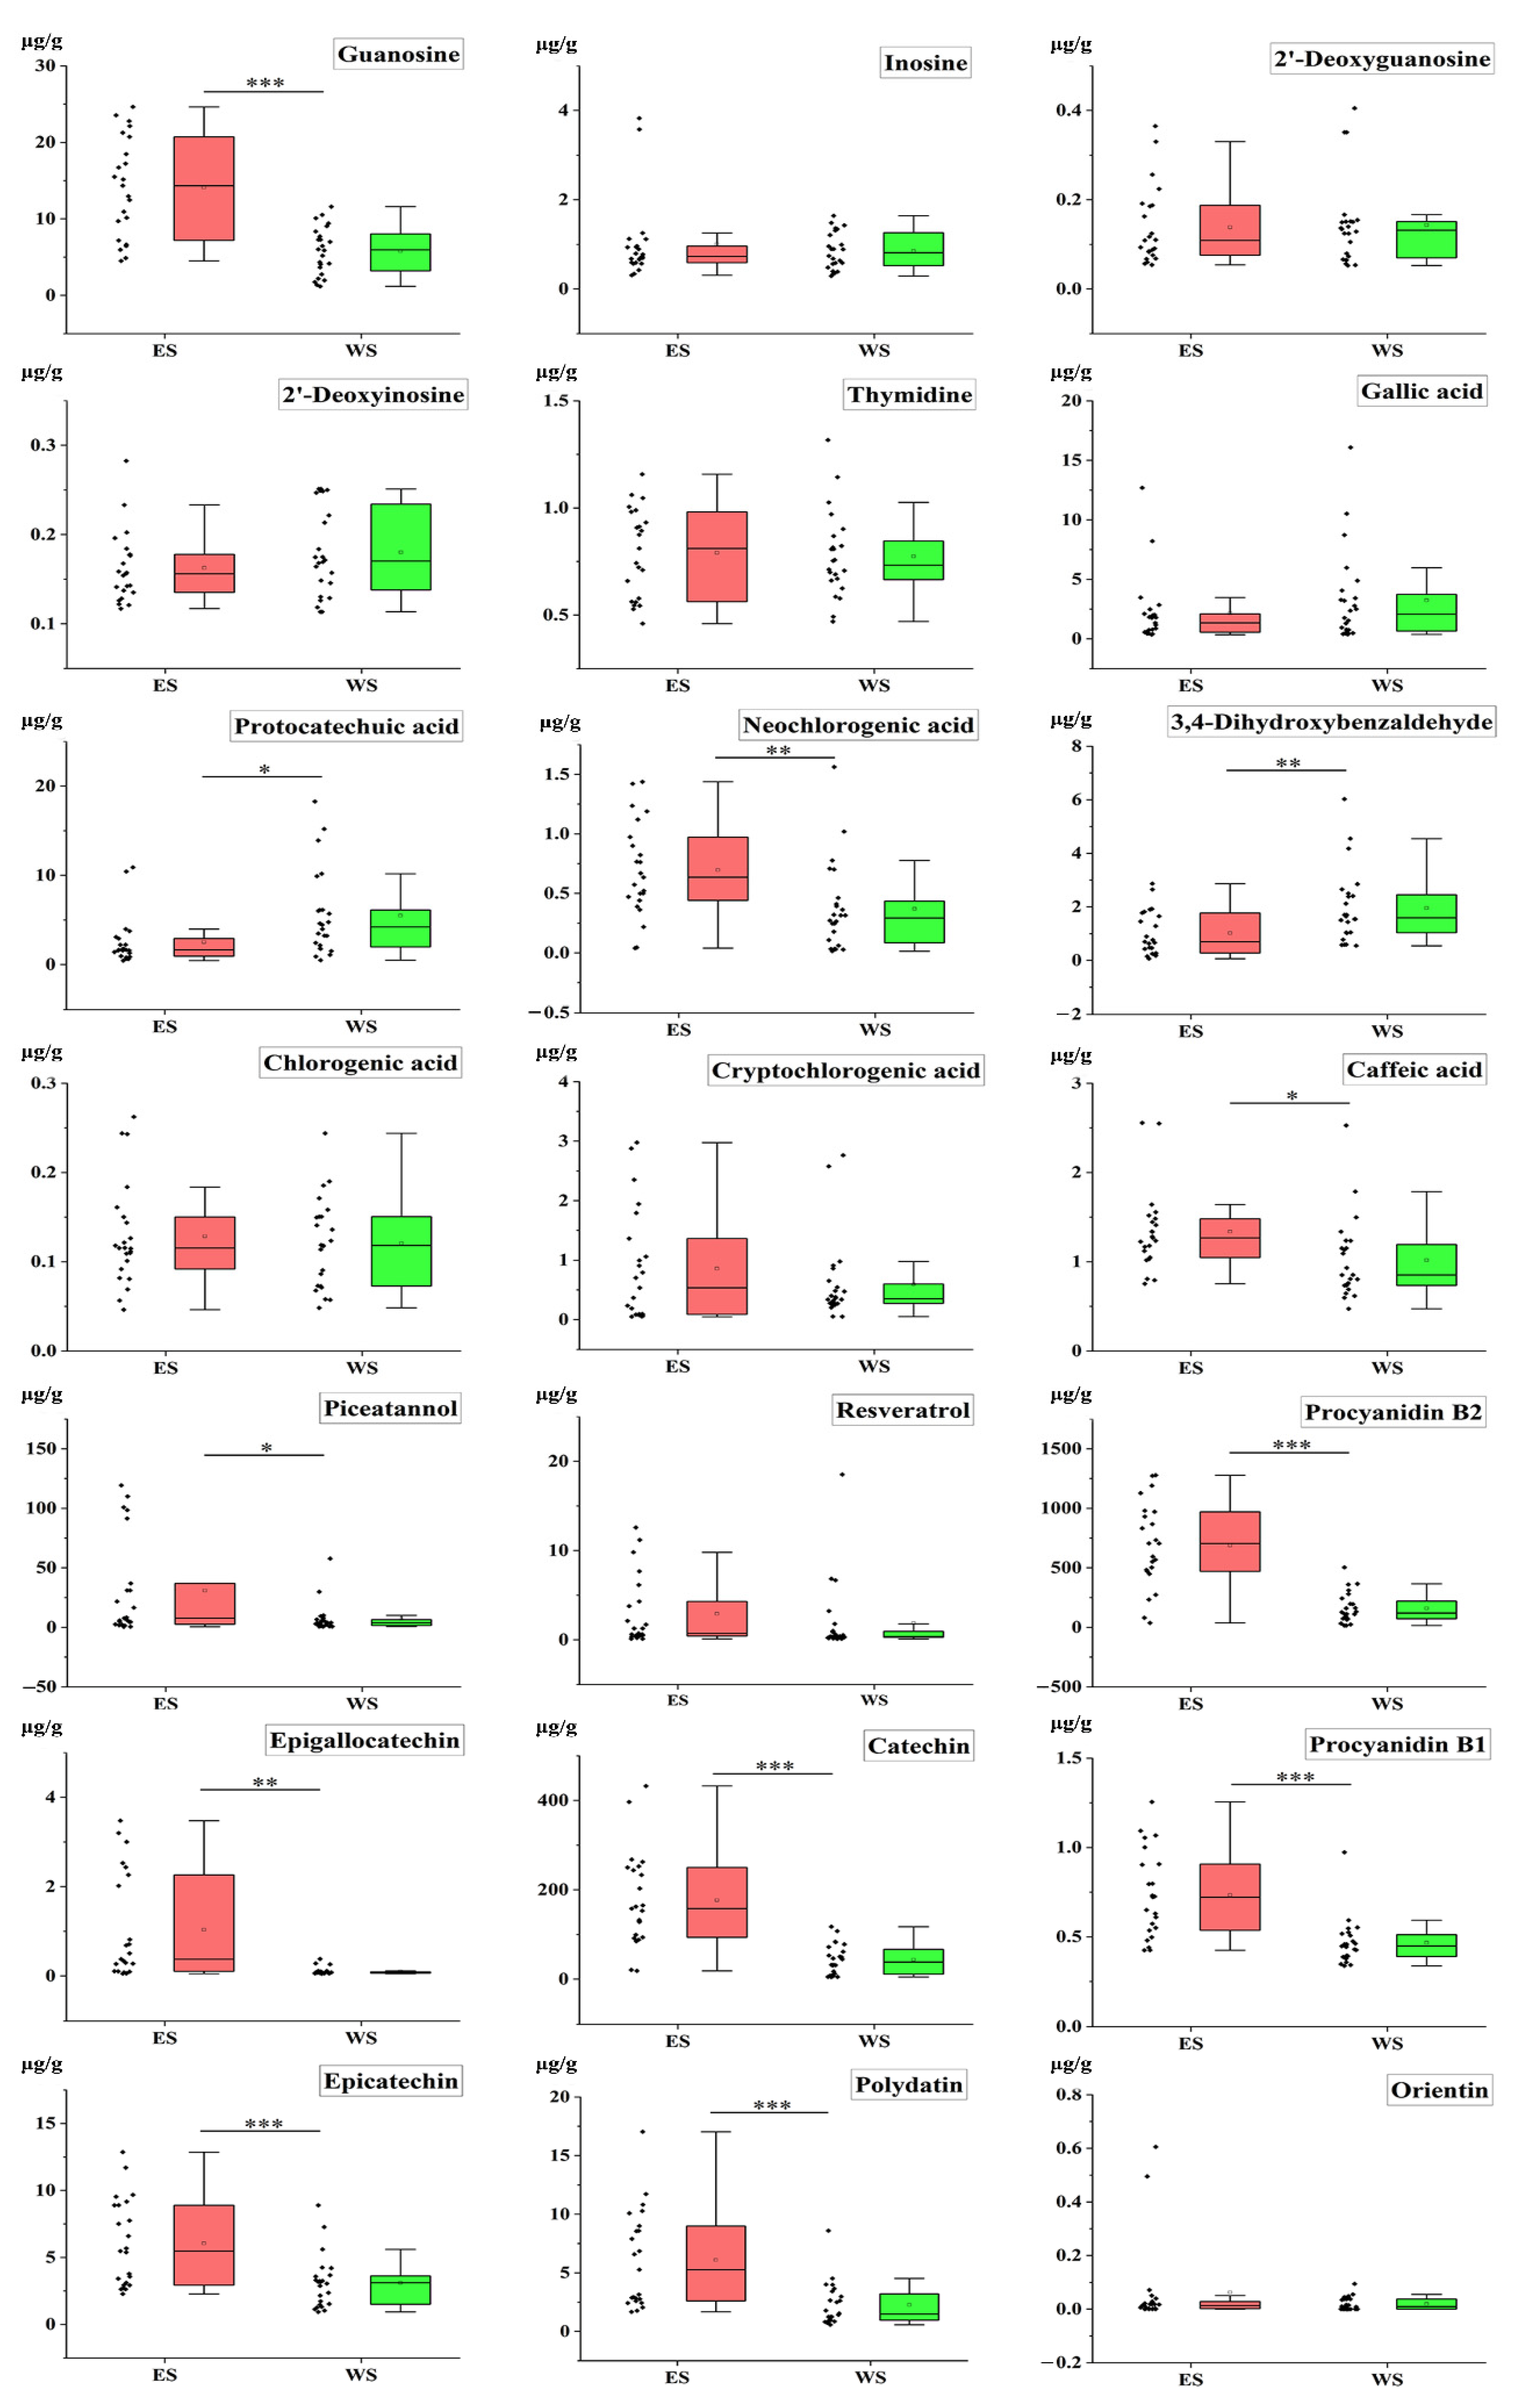
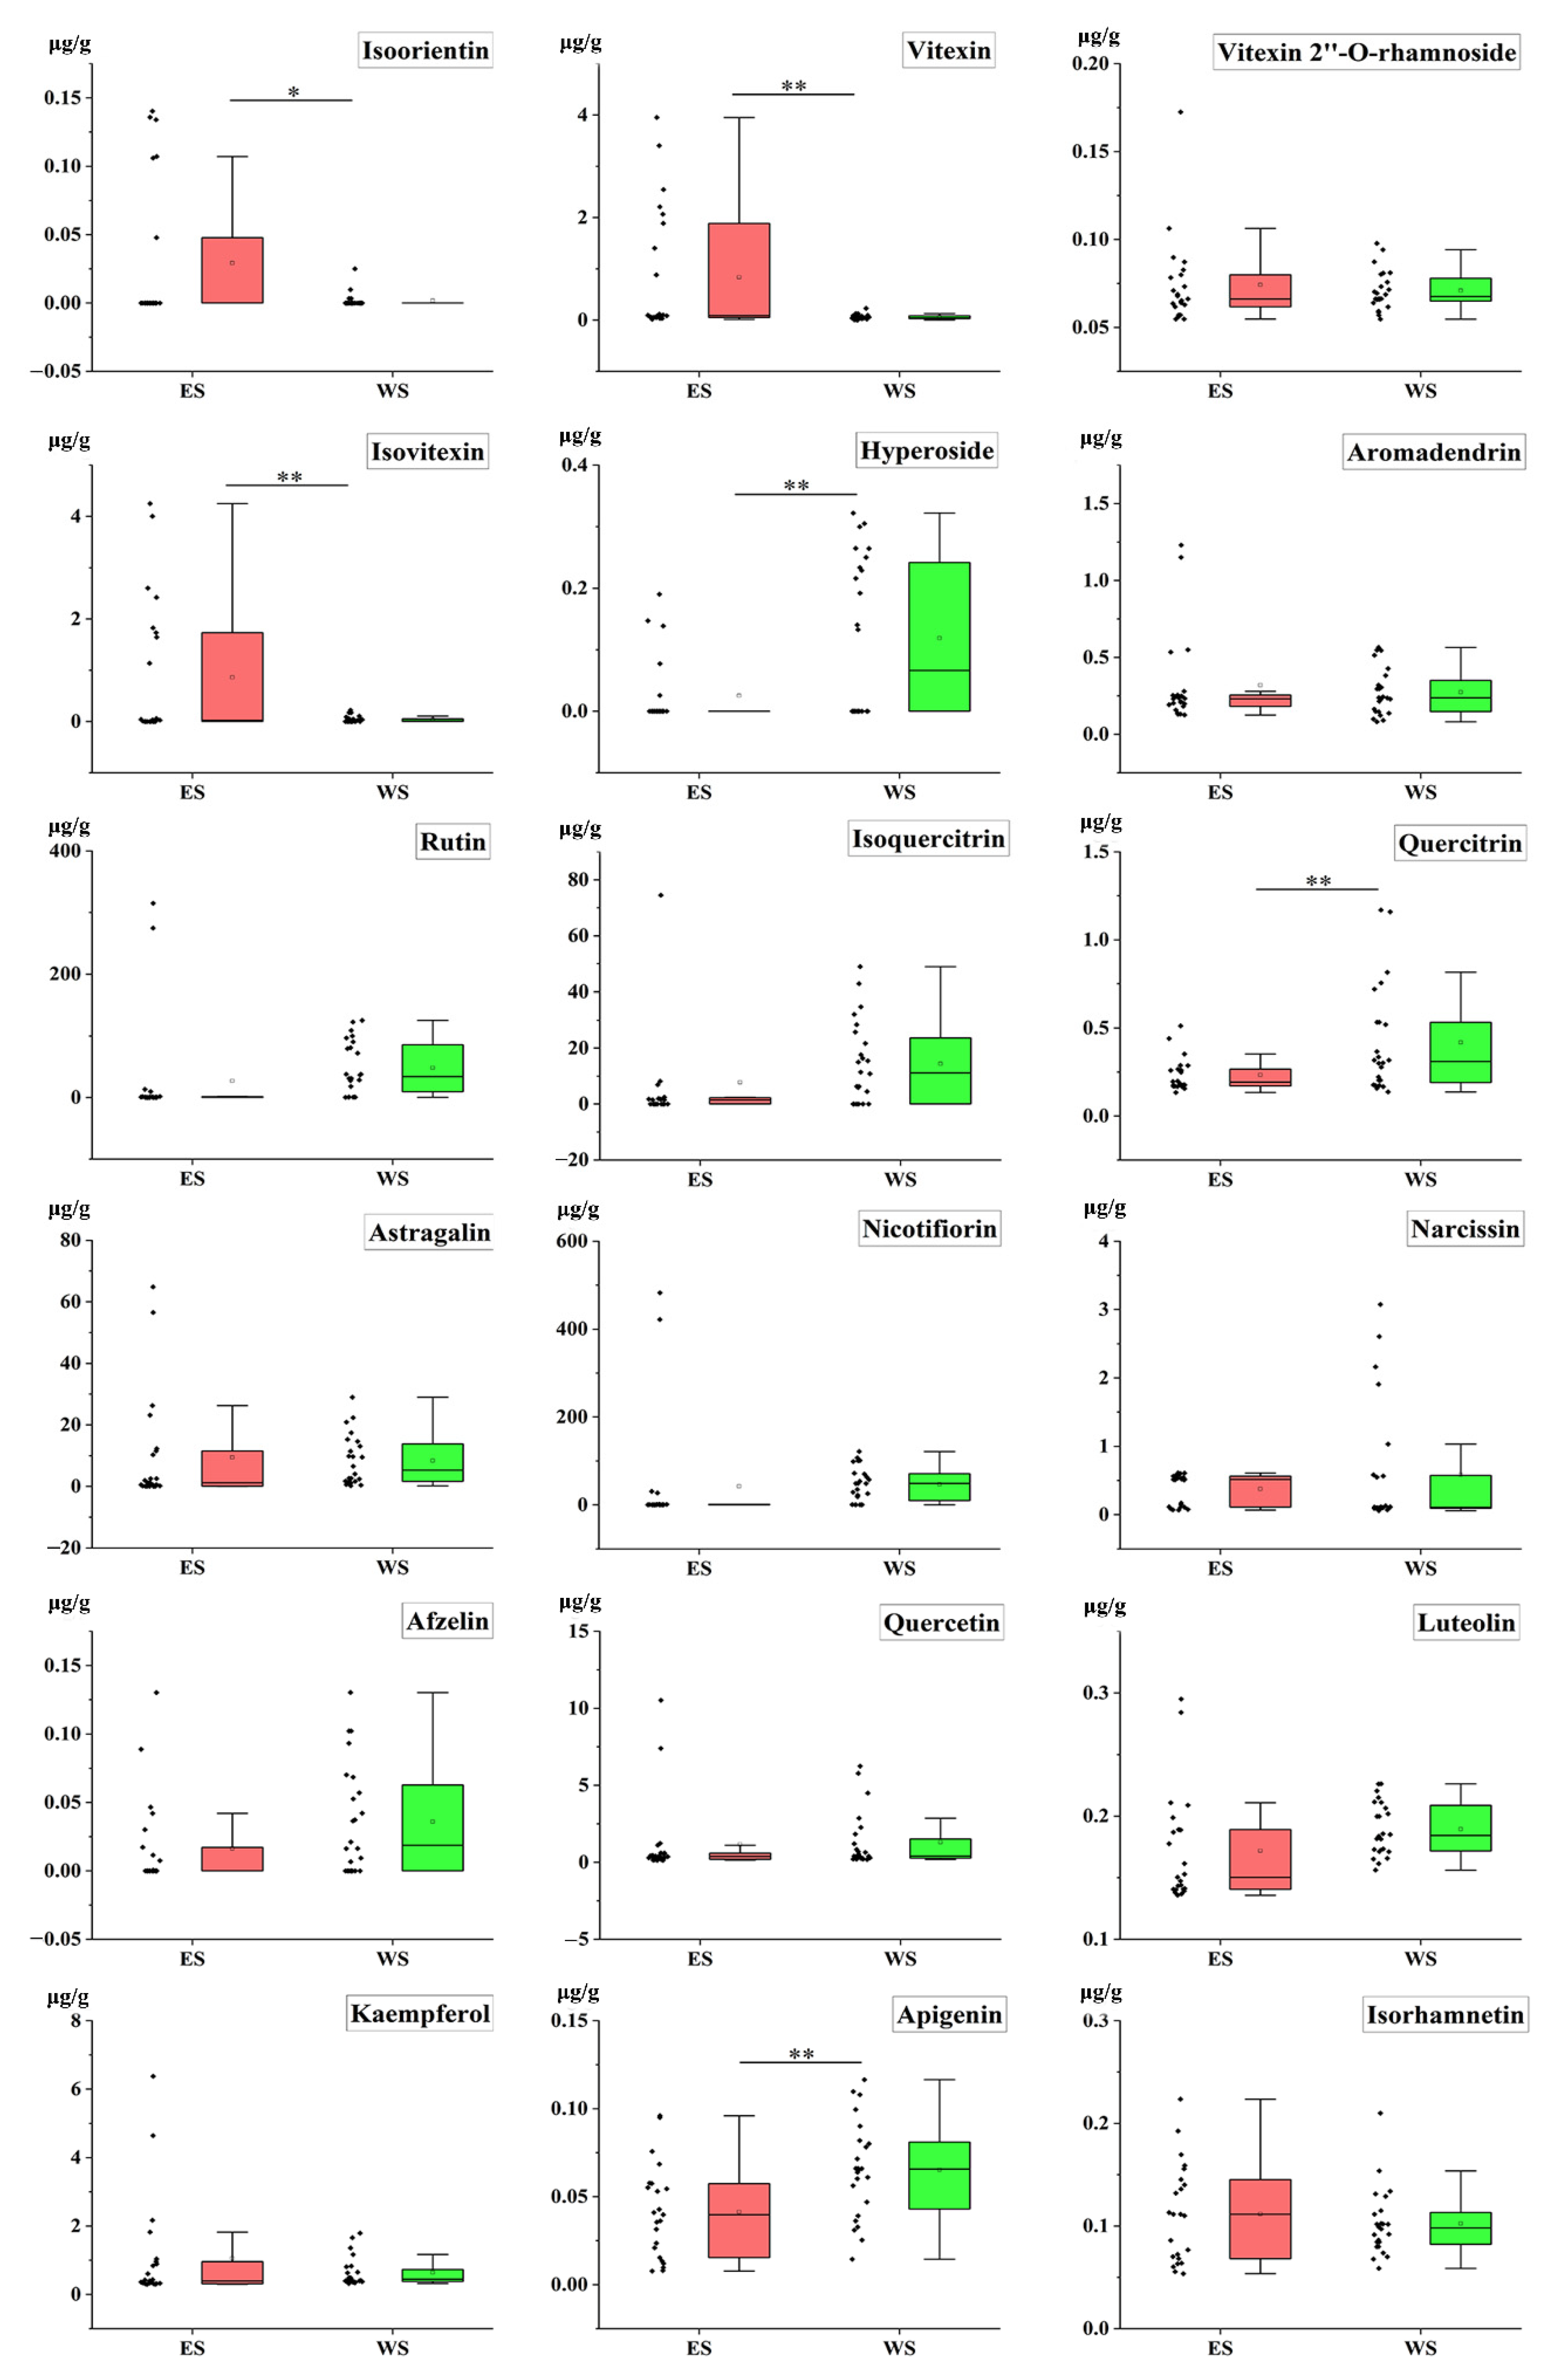
| No. | Constituents | Formula | tR (min) | Precursor Ion (m/z) | Product Ion (m/z) | DP (V) | CE (eV) | CXP (eV) | Ion Mode |
|---|---|---|---|---|---|---|---|---|---|
| 1 | Lysine | C6H14N2O2 | 1.14 | 147.11 | 83.91 | 100 | 14 | 14 | ESI+ |
| 2 | Histidine | C6H9N3O2 | 1.14 | 156.08 | 110.03 | 100 | 16 | 14 | ESI+ |
| 3 | Glycine | C2H5NO2 | 1.20 | 76.04 | 30.00 | 73 | 6 | 14 | ESI+ |
| 4 | Serine | C3H7NO3 | 1.20 | 106.05 | 59.99 | 100 | 8 | 14 | ESI+ |
| 5 | Alanine | C3H7NO2 | 1.26 | 90.06 | 44.02 | 100 | 10 | 14 | ESI+ |
| 6 | Aspartic acid | C4H7NO4 | 1.26 | 134.05 | 87.96 | 59 | 10 | 14 | ESI+ |
| 7 | Threonine | C4H9NO3 | 1.26 | 120.17 | 74.00 | 100 | 20 | 14 | ESI+ |
| 8 | Glutamic acid | C5H9NO4 | 1.26 | 148.10 | 83.90 | 12 | 14 | 14 | ESI+ |
| 9 | Cysteine | C3H7NO2S | 1.32 | 122.03 | 75.93 | 85 | 17 | 14 | ESI+ |
| 10 | Proline | C5H9NO2 | 1.32 | 116.07 | 70.02 | 68 | 10 | 14 | ESI+ |
| 11 | Cytidine | C9H13N3O5 | 1.39 | 244.09 | 112.00 | 61 | 10 | 14 | ESI+ |
| 12 | Uracil | C4H4N2O2 | 1.63 | 113.00 | 70.00 | 111 | 21 | 14 | ESI+ |
| 13 | Valine | C5H11NO2 | 1.75 | 118.09 | 72.06 | 100 | 10 | 14 | ESI+ |
| 14 | Hypoxanthine | C5H4N4O | 1.76 | 137.00 | 119.03 | 80 | 27 | 12 | ESI+ |
| 15 | Uridine | C9H12N2O6 | 2.04 | 243.01 | 199.96 | −115 | −14 | −13 | ESI− |
| 16 | Adenosine | C10H13N5O4 | 2.05 | 268.10 | 136.10 | 31 | 23 | 14 | ESI+ |
| 17 | 2′-Deoxyadenosine | C10H13N5O3 | 2.42 | 251.81 | 136.08 | 80 | 9 | 6 | ESI+ |
| 18 | Tyrosine | C9H11NO3 | 2.66 | 182.10 | 136.00 | 16 | 16 | 14 | ESI+ |
| 19 | Guanosine | C10H13N5O5 | 2.77 | 284.30 | 152.10 | 42 | 16 | 14 | ESI+ |
| 20 | Inosine | C10H12N4O5 | 2.89 | 269.00 | 137.07 | 46 | 15 | 14 | ESI+ |
| 21 | Gallic acid | C7H6O5 | 2.94 | 169.00 | 125.00 | −35 | −15 | −15 | ESI− |
| 22 | 2′-Deoxyguanosine | C10H13N5O4 | 3.02 | 268.10 | 152.10 | 61 | 15 | 14 | ESI+ |
| 23 | Isoleucine | C6H13NO2 | 3.24 | 132.10 | 86.05 | 64 | 10 | 14 | ESI+ |
| 24 | 2′-Deoxyinosine | C10H12N4O4 | 3.25 | 253.02 | 136.90 | 11 | 11 | 16 | ESI+ |
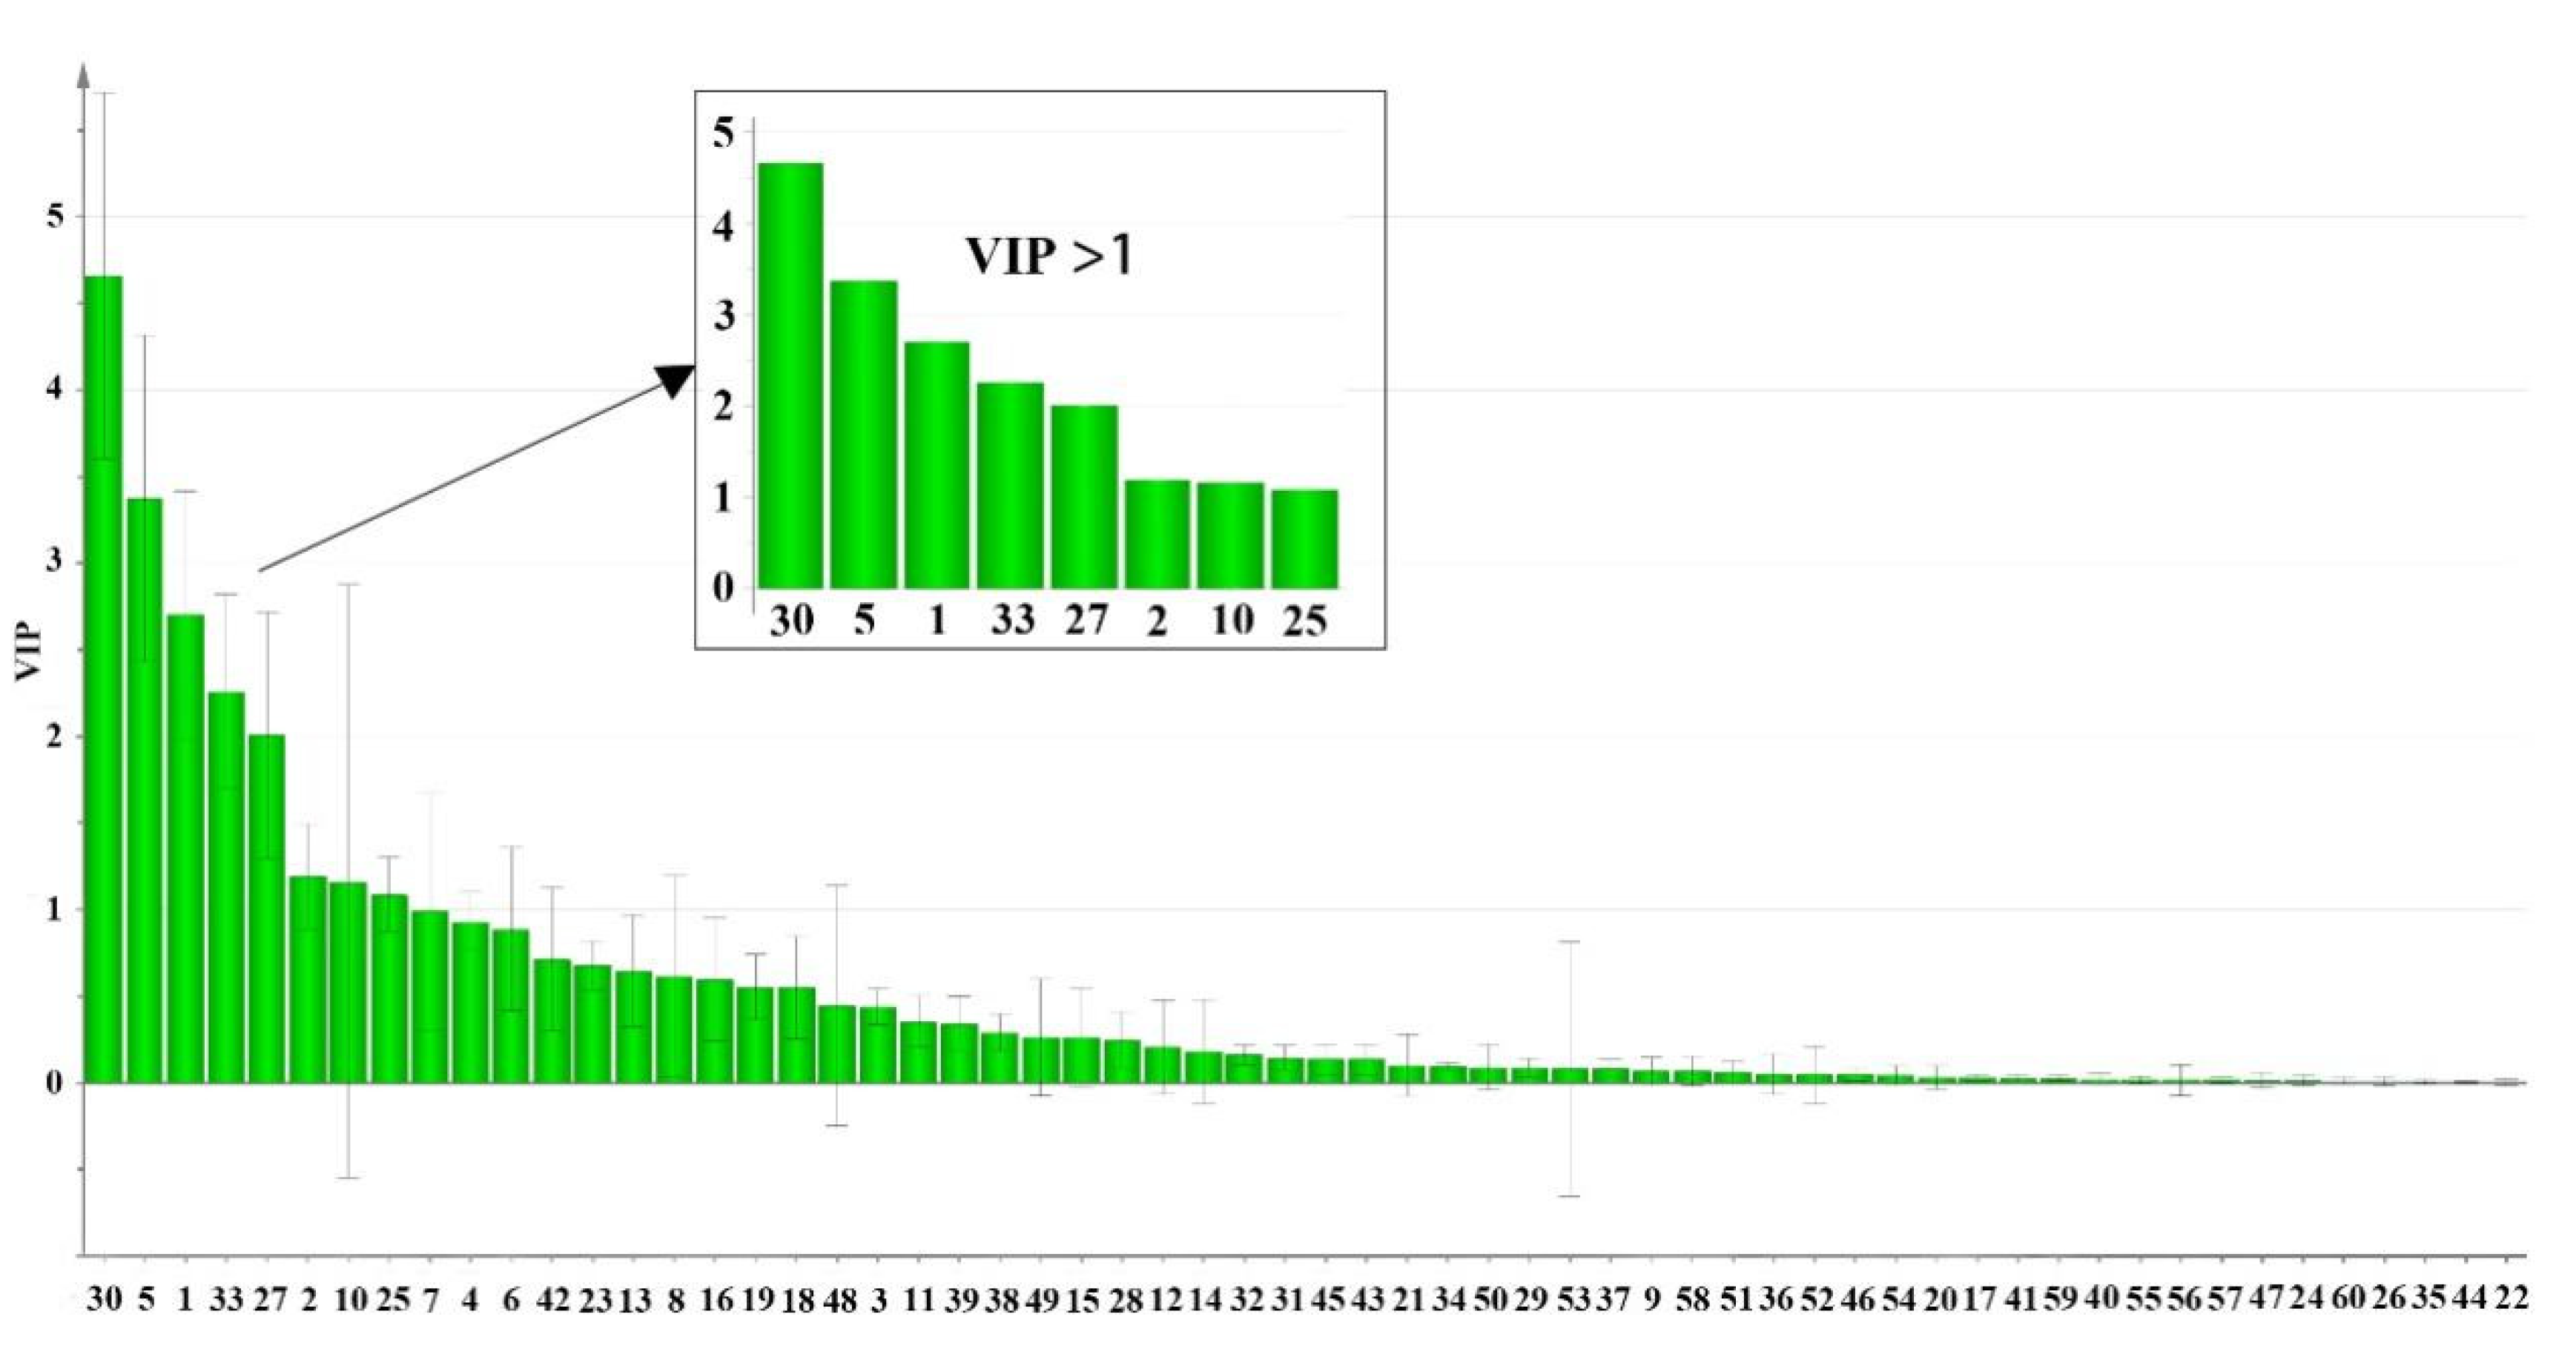
| 25 | Leucine | C6H13NO2 | 3.58 | 132.10 | 86.05 | 100 | 16 | 14 | ESI+ |
| 26 | Thymidine | C10H14N2O5 | 4.72 | 243.10 | 127.07 | 61 | 13 | 14 | ESI+ |
| 27 | Phenylalanine | C9H11NO2 | 5.75 | 166.10 | 120.05 | 100 | 14 | 14 | ESI+ |
| 28 | Protocatechuic acid | C7H6O4 | 5.88 | 152.90 | 109.00 | −85 | −18 | −15 | ESI− |
| 29 | Neochlorogenic acid | C16H18O9 | 7.03 | 353.02 | 190.96 | −90 | −24 | −21 | ESI− |
| 30 | Procyanidin B2 | C30H26O12 | 7.32 | 579.20 | 291.10 | 120 | 13 | 14 | ESI+ |
| 31 | 3,4-Dihydroxybenzaldehyde | C7H6O3 | 7.71 | 137.00 | 108.00 | −53 | −30 | −15 | ESI− |
| 32 | Epigallocatechin | C15H14O7 | 7.97 | 305.08 | 125.02 | −155 | −26 | −55 | ESI− |
| 33 | Catechin | C15H14O6 | 8.21 | 289.00 | 244.80 | −135 | −20 | −15 | ESI− |
| 34 | Procyanidin B1 | C30H26O12 | 8.69 | 577.07 | 288.96 | −185 | −32 | −15 | ESI− |
| 35 | Chlorogenic acid | C16H18O9 | 8.95 | 353.05 | 191.03 | −120 | −22 | −13 | ESI− |
| 36 | Cryptochlorogenic acid | C16H18O9 | 9.44 | 353.07 | 191.01 | −105 | −20 | −21 | ESI− |
| 37 | Caffeic acid | C9H8O4 | 9.75 | 179.03 | 134.60 | −125 | −20 | −15 | ESI− |
| 38 | Epicatechin | C15H14O6 | 10.12 | 289.00 | 244.80 | −135 | −20 | −15 | ESI− |
| 39 | Polydatin | C20H22O8 | 11.94 | 389.00 | 226.90 | −140 | −27 | −15 | ESI− |
| 40 | Orientin | C21H20O11 | 12.29 | 449.20 | 329.20 | 35 | 25 | 14 | ESI+ |
| 41 | Isoorientin | C21H20O11 | 12.30 | 449.20 | 299.10 | 35 | 25 | 14 | ESI+ |
| 42 | Piceatannol | C14H12O4 | 12.69 | 243.00 | 159.03 | −200 | −34 | −15 | ESI− |
| 43 | Vitexin | C21H20O10 | 13.17 | 431.10 | 310.90 | −100 | −30 | −15 | ESI− |
| 44 | Vitexin-2″-O-rhamnoside | C27H30O14 | 13.36 | 577.00 | 413.00 | −100 | −30 | −15 | ESI− |
| 45 | Isovitexin | C21H20O10 | 14.03 | 431.10 | 311.05 | −80 | −35 | −15 | ESI− |
| 46 | Hyperoside | C21H20O12 | 14.46 | 463.00 | 300.00 | −160 | −36 | −15 | ESI− |
| 47 | Aromadendrin | C15H12O6 | 14.59 | 286.66 | 125.02 | −165 | −26 | −13 | ESI− |
| 48 | Rutin | C27H30O16 | 14.69 | 609.06 | 300.00 | −170 | −48 | −15 | ESI− |
| 49 | Isoquercitrin | C21H20O12 | 14.76 | 463.00 | 300.00 | −180 | −36 | −15 | ESI− |
| 50 | Resveratrol | C14H12O3 | 15.27 | 227.00 | 142.70 | −150 | −35 | −15 | ESI− |
| 51 | Quercitrin | C21H20O11 | 16.61 | 447.00 | 301.00 | −165 | −30 | −15 | ESI− |
| 52 | Astragalin | C21H20O11 | 16.84 | 447.10 | 283.90 | −100 | −36 | −15 | ESI− |
| 53 | Nicotifiorin | C27H30O15 | 16.86 | 593.19 | 285.03 | −300 | −40 | −19 | ESI− |
| 54 | Narcissin | C28H32O16 | 17.18 | 623.00 | 315.00 | −240 | −30 | −15 | ESI− |
| 55 | Afzelin | C21H20O10 | 18.79 | 431.10 | 285.00 | −130 | −40 | −13 | ESI− |
| 56 | Quercetin | C15H10O7 | 19.28 | 301.10 | 151.00 | −62 | −28 | −15 | ESI− |
| 57 | Luteolin | C15H10O6 | 19.93 | 285.09 | 132.98 | −170 | −40 | −15 | ESI− |
| 58 | Kaempferol | C15H10O6 | 21.01 | 285.00 | 116.90 | −120 | −36 | −15 | ESI− |
| 59 | Apigenin | C15H10O5 | 21.21 | 268.80 | 116.90 | −129 | −40 | −15 | ESI− |
| 60 | Isorhamnetin | C16H12O7 | 21.27 | 315.00 | 300.00 | −150 | −20 | −15 | ESI− |
| No. | Constituents | Regression Equation | r | Liner Range (ng/mL) | LOD (ng/mL) | LOQ (ng/mL) | Precision (RSD, %) | Repeatability (RSD, %) (n = 6) | Stability (RSD, %) (n = 6) | Recovery (%) | Matrix Effect | ||
|---|---|---|---|---|---|---|---|---|---|---|---|---|---|
| Intra-Day (n = 6) | Inter-Day (n = 9) | Mean | RSD | ||||||||||
| 1 | Lysine | Y = 690X + 33,500 | 0.9990 | 52.90–20,160 | 7.96 | 26.53 | 4.69 | 4.80 | 2.74 | 1.31 | 99.79 | 1.11 | 0.96 |
| 2 | Histidine | Y = 2650X − 108,000 | 0.9990 | 43.10–6000 | 0.96 | 3.19 | 4.73 | 4.74 | 4.58 | 2.09 | 99.94 | 1.41 | 1.01 |
| 3 | Glycine | Y = 94.9X + 2210 | 0.9992 | 3.05–5800 | 0.88 | 2.93 | 4.54 | 4.90 | 2.51 | 4.69 | 96.10 | 4.27 | 0.97 |
| 4 | Serine | Y = 439X + 18,700 | 0.9998 | 2.89–35,400 | 0.09 | 0.31 | 4.96 | 4.64 | 3.73 | 3.17 | 96.21 | 2.08 | 0.99 |
| 5 | Alanine | Y = 300X + 1700 | 0.9998 | 9.26–22,000 | 2.73 | 9.10 | 4.43 | 4.21 | 4.96 | 4.93 | 99.77 | 0.60 | 0.98 |
| 6 | Aspartic acid | Y = 374X − 84.9 | 0.9993 | 9.48–9440 | 2.43 | 8.10 | 4.91 | 4.83 | 4.42 | 2.48 | 97.46 | 2.55 | 1.02 |
| 7 | Threonine | Y = 245X + 6090 | 0.9995 | 44–5800 | 10.50 | 35.00 | 4.11 | 4.44 | 4.84 | 4.41 | 97.85 | 2.09 | 0.99 |
| 8 | Glutamic acid | Y = 1490X + 17,400 | 0.9990 | 5.59–4800 | 1.53 | 5.10 | 4.84 | 4.66 | 4.59 | 3.80 | 99.05 | 1.63 | 1.02 |
| 9 | Cysteine | Y = 106X − 52.3 | 0.9995 | 22.40–5120 | 2.13 | 7.10 | 3.75 | 3.07 | 4.54 | 4.99 | 98.43 | 1.40 | 0.92 |
| 10 | Proline | Y = 591X + 28,800 | 0.9991 | 13.40–31,380 | 0.38 | 1.26 | 4.70 | 4.21 | 4.98 | 4.85 | 99.66 | 1.67 | 1.03 |
| 11 | Cytidine | Y = 3530X + 9460 | 0.9991 | 0.42–4810 | 0.12 | 0.40 | 4.85 | 4.97 | 4.88 | 1.87 | 101.76 | 4.75 | 0.93 |
| 12 | Uracil | Y = 284X − 2720 | 0.9992 | 18.70–30,300 | 3.18 | 10.60 | 3.46 | 3.54 | 4.59 | 2.40 | 101.28 | 4.73 | 1.05 |
| 13 | Valine | Y = 1650X − 29,700 | 0.9992 | 21.90–10,100 | 5.91 | 19.70 | 1.87 | 2.03 | 2.78 | 4.84 | 98.56 | 1.28 | 1.02 |
| 14 | Hypoxanthine | Y = 269X + 482 | 0.9996 | 18.40–4990 | 4.98 | 16.60 | 4.91 | 4.77 | 3.92 | 2.34 | 98.71 | 1.14 | 0.97 |
| 15 | Uridine | Y = 301X − 13,500 | 0.9991 | 46–21,280 | 4.04 | 13.47 | 0.93 | 1.00 | 4.72 | 3.54 | 97.90 | 1.88 | 0.95 |
| 16 | Adenosine | Y = 4780X + 5990 | 0.9995 | 6.28–15,680 | 0.93 | 3.10 | 2.91 | 2.74 | 2.54 | 4.22 | 97.75 | 2.01 | 1.04 |
| 17 | 2′-Deoxyadenosine | Y = 3810X + 9950 | 0.9998 | 4.21–4850 | 0.45 | 1.50 | 4.41 | 4.78 | 3.64 | 4.31 | 97.57 | 2.19 | 1.05 |
| 18 | Tyrosine | Y = 678X − 6340 | 0.9999 | 16.30–50,000 | 0.16 | 0.54 | 3.12 | 2.65 | 3.16 | 2.06 | 96.77 | 2.91 | 0.99 |
| 19 | Guanosine | Y = 4540X − 11,000 | 0.9999 | 2.95–4950 | 0.39 | 1.30 | 3.25 | 2.79 | 4.82 | 4.65 | 98.21 | 2.78 | 0.93 |
| 20 | Inosine | Y = 3020X − 12,900 | 0.9999 | 6.57–5520 | 1.82 | 6.07 | 3.02 | 2.84 | 3.64 | 4.19 | 98.70 | 2.26 | 0.95 |
| 21 | Gallic acid | Y = 1610X − 10,300 | 0.9993 | 11.10–4850 | 3.01 | 10.03 | 1.77 | 1.51 | 4.92 | 4.86 | 98.36 | 2.46 | 1.02 |
| 22 | 2′-Deoxyguanosine | Y = 5990X − 11,300 | 0.9994 | 3.08–5080 | 0.31 | 1.02 | 2.71 | 2.29 | 1.90 | 4.67 | 98.10 | 1.69 | 1.01 |
| 23 | Isoleucine | Y = 4210X + 3820 | 0.9998 | 1.94–535 | 0.56 | 1.86 | 2.80 | 2.67 | 1.82 | 2.51 | 96.12 | 1.33 | 0.94 |
| 24 | 2′-Deoxyinosine | Y = 2630X + 10,600 | 0.9997 | 6.69–5390 | 1.26 | 4.20 | 4.65 | 4.42 | 3.18 | 4.37 | 98.14 | 1.68 | 0.95 |
| 25 | Leucine | Y = 3010X − 31,600 | 0.9991 | 13.30–6072 | 3.00 | 9.99 | 4.74 | 4.58 | 4.96 | 2.65 | 97.75 | 2.01 | 0.98 |
| 26 | Thymidine | Y = 1390X − 23,200 | 0.9990 | 19.10–5070 | 3.78 | 12.60 | 4.58 | 4.81 | 4.66 | 4.83 | 100.29 | 1.78 | 1.03 |
| 27 | Phenylalanine | Y = 1380X + 30,600 | 0.9999 | 5.56–34,920 | 1.62 | 5.40 | 1.30 | 1.14 | 3.45 | 1.45 | 99.34 | 0.12 | 1.04 |
| 28 | Protocatechuic acid | Y = 2640X − 38,300 | 0.9990 | 15.40–5180 | 3.03 | 10.10 | 0.96 | 0.88 | 1.96 | 3.48 | 97.74 | 4.09 | 0.93 |
| 29 | Neochlorogenic acid | Y = 617X + 1810 | 0.9997 | 2.80–4800 | 0.16 | 0.52 | 4.74 | 4.63 | 3.60 | 4.89 | 96.14 | 3.50 | 0.96 |
| 30 | Procyanidin B2 | Y = 21X − 1360 | 0.9997 | 82.30–54,800 | 13.59 | 45.30 | 4.96 | 4.97 | 3.47 | 0.89 | 99.96 | 1.09 | 0.99 |
| 31 | 3,4-Dihydroxybenzaldehyde | Y = 2420X + 9420 | 0.9999 | 0.50–5770 | 0.12 | 0.40 | 3.11 | 2.78 | 4.47 | 4.80 | 97.56 | 2.57 | 0.97 |
| 32 | Epigallocatechin | Y = 373X − 503 | 0.9999 | 2.73–6204 | 0.58 | 1.92 | 4.43 | 4.94 | 3.71 | 2.42 | 97.49 | 3.80 | 1.01 |
| 33 | Catechin | Y = 383X − 9360 | 0.9997 | 37–52,200 | 0.66 | 2.20 | 3.07 | 2.95 | 3.32 | 4.99 | 96.95 | 2.75 | 1.01 |
| 34 | Procyanidin B1 | Y = 3190X − 41,900 | 0.9992 | 14.90–5375 | 0.22 | 0.72 | 3.83 | 4.21 | 4.84 | 3.77 | 98.64 | 1.21 | 1.03 |
| 35 | Chlorogenic acid | Y = 3240X − 3950 | 0.9997 | 3.03–4920 | 0.38 | 1.26 | 3.20 | 3.29 | 4.84 | 4.23 | 96.94 | 1.41 | 0.95 |
| 36 | Cryptochlorogenic acid | Y = 422X + 9830 | 0.9999 | 1.44–19,860 | 0.35 | 1.16 | 2.32 | 2.50 | 3.75 | 4.29 | 97.92 | 3.38 | 0.92 |
| 37 | Caffeic acid | Y = 3070X − 39,100 | 0.9996 | 15.10–5260 | 2.27 | 7.56 | 2.90 | 2.67 | 4.71 | 4.02 | 97.06 | 2.23 | 0.97 |
| 38 | Epicatechin | Y = 488X − 14,600 | 0.9996 | 39.80–41,360 | 0.63 | 2.10 | 3.73 | 3.87 | 4.90 | 3.58 | 98.56 | 2.84 | 1.05 |
| 39 | Polydatin | Y = 1600X − 17,600 | 0.9999 | 12–5310 | 3.18 | 10.60 | 3.17 | 3.03 | 3.09 | 4.93 | 101.00 | 4.62 | 0.96 |
| 40 | Orientin | Y = 521X − 1260 | 0.9996 | 8.30–5170 | 0.10 | 0.34 | 4.54 | 4.40 | 4.91 | 4.95 | 100.33 | 2.68 | 1.01 |
| 41 | Isoorientin | Y = 929X + 7750 | 0.9996 | 5.36–5840 | 0.12 | 0.39 | 4.54 | 4.38 | 4.60 | 2.02 | 100.19 | 3.10 | 0.93 |
| 42 | Piceatannol | Y = 1110X − 20,600 | 0.9999 | 21.50–29,880 | 2.12 | 7.07 | 3.00 | 3.35 | 1.68 | 4.14 | 100.40 | 4.11 | 1.04 |
| 43 | Vitexin | Y = 2850X + 2430 | 0.9996 | 2.32–5590 | 0.08 | 0.28 | 2.86 | 2.84 | 1.08 | 4.64 | 100.94 | 3.05 | 0.97 |
| 44 | Vitexin-2″-O-rhamnoside | Y = 789X − 1580 | 0.9991 | 4.80–5280 | 0.64 | 2.14 | 3.53 | 3.64 | 4.26 | 4.62 | 100.50 | 1.73 | 0.95 |
| 45 | Isovitexin | Y = 2090X + 7750 | 0.9994 | 1.68–4970 | 0.11 | 0.36 | 3.28 | 2.67 | 4.32 | 4.47 | 101.39 | 4.41 | 0.92 |
| 46 | Hyperoside | Y = 2540X + 46,700 | 0.9997 | 4.25–5616 | 0.30 | 1.01 | 4.97 | 4.79 | 3.06 | 4.70 | 100.08 | 3.41 | 1.03 |
| 47 | Aromadendrin | Y = 941X − 2560 | 0.9995 | 4.60–4850 | 0.41 | 1.36 | 4.97 | 4.86 | 3.38 | 4.93 | 97.84 | 3.84 | 1.02 |
| 48 | Rutin | Y = 701X + 24,700 | 0.9995 | 21.50–51,000 | 1.24 | 4.12 | 1.36 | 1.46 | 2.42 | 4.96 | 100.18 | 2.53 | 0.94 |
| 49 | Isoquercitrin | Y = 1720X + 246,000 | 0.9994 | 25.50–21,880 | 0.46 | 1.53 | 1.50 | 1.26 | 1.00 | 4.69 | 100.02 | 2.01 | 0.97 |
| 50 | Resveratrol | Y = 93.2X + 184 | 0.9996 | 1.18–8288 | 0.23 | 0.78 | 4.78 | 4.48 | 4.93 | 4.75 | 100.53 | 4.87 | 0.98 |
| 51 | Quercitrin | Y = 2500X − 10,500 | 0.9993 | 10.10–5160 | 1.60 | 5.33 | 2.09 | 1.98 | 4.54 | 2.91 | 98.49 | 1.35 | 1.05 |
| 52 | Astragalin | Y = 1380X + 9790 | 0.9991 | 16.50–30,120 | 0.03 | 0.09 | 2.46 | 2.13 | 3.36 | 4.65 | 98.44 | 3.38 | 0.93 |
| 53 | Nicotifiorin | Y = 806X + 2030 | 0.9994 | 8.34–29,760 | 1.07 | 3.58 | 2.46 | 2.13 | 1.58 | 4.82 | 96.85 | 4.76 | 0.96 |
| 54 | Narcissin | Y = 952X − 19,100 | 0.9994 | 23.90–4910 | 0.69 | 2.31 | 2.04 | 1.75 | 3.02 | 4.82 | 98.16 | 3.10 | 0.95 |
| 55 | Afzelin | Y = 1140X + 3300 | 0.9996 | 6.95–8660 | 0.08 | 0.27 | 2.81 | 2.67 | 3.73 | 4.16 | 98.66 | 3.77 | 0.92 |
| 56 | Quercetin | Y = 3280X − 5780 | 0.9995 | 3.72–5160 | 0.77 | 2.56 | 4.24 | 4.31 | 2.26 | 4.68 | 98.37 | 3.52 | 0.99 |
| 57 | Luteolin | Y = 5040X − 24,500 | 0.9992 | 6.47–5640 | 1.23 | 4.10 | 3.74 | 3.78 | 4.60 | 4.99 | 98.49 | 1.35 | 1.04 |
| 58 | Kaempferol | Y = 280X − 3160 | 0.9997 | 13.50–2560 | 2.48 | 8.26 | 4.47 | 4.65 | 4.75 | 3.14 | 100.17 | 1.31 | 1.03 |
| 59 | Apigenin | Y = 3130X − 342 | 0.9999 | 1.28–5320 | 0.09 | 0.29 | 3.77 | 3.44 | 2.96 | 3.03 | 98.29 | 2.28 | 0.98 |
| 60 | Isorhamnetin | Y = 2330X − 4310 | 0.9996 | 4.37–5310 | 0.57 | 1.89 | 2.56 | 2.61 | 4.77 | 4.61 | 98.23 | 1.37 | 0.96 |
| No. | ri | Ranking | Difference of (ri%) | No. | ri | Ranking | Difference of (ri%) |
|---|---|---|---|---|---|---|---|
| S1 | 0.3363 | 38 | 30.80 | S24 | 0.3621 | 31 | 25.47 |
| S2 | 0.3925 | 9 | 19.23 | S25 | 0.3485 | 35 | 28.29 |
| S3 | 0.3743 | 21 | 22.97 | S26 | 0.3610 | 32 | 25.71 |
| S4 | 0.4471 | 4 | 7.98 | S27 | 0.3480 | 36 | 28.37 |
| S5 | 0.4499 | 3 | 7.41 | S28 | 0.3638 | 28 | 25.13 |
| S6 | 0.3812 | 16 | 21.56 | S29 | 0.3655 | 27 | 24.79 |
| S7 | 0.4007 | 6 | 17.55 | S30 | 0.3146 | 43 | 35.26 |
| S8 | 0.3919 | 12 | 19.35 | S31 | 0.2980 | 47 | 38.67 |
| S9 | 0.3858 | 14 | 20.60 | S32 | 0.3771 | 17 | 22.40 |
| S10 | 0.3673 | 24 | 24.40 | S33 | 0.3656 | 26 | 24.75 |
| S11 | 0.3716 | 22 | 23.53 | S34 | 0.3921 | 11 | 19.31 |
| S12 | 0.3660 | 25 | 24.68 | S35 | 0.3635 | 29 | 25.20 |
| S13 | 0.3621 | 30 | 25.47 | S36 | 0.3224 | 41 | 33.65 |
| S14 | 0.3923 | 10 | 19.26 | S37 | 0.3105 | 44 | 36.09 |
| S15 | 0.3506 | 33 | 27.84 | S38 | 0.3097 | 45 | 36.26 |
| S16 | 0.3974 | 8 | 18.22 | S39 | 0.3049 | 46 | 37.25 |
| S17 | 0.4859 | 1 | 0.00 | S40 | 0.3676 | 23 | 24.35 |
| S18 | 0.3764 | 20 | 22.54 | S41 | 0.3176 | 42 | 34.63 |
| S19 | 0.4024 | 5 | 17.19 | S42 | 0.3304 | 39 | 32.00 |
| S20 | 0.3844 | 15 | 20.90 | S43 | 0.3765 | 19 | 22.51 |
| S21 | 0.3887 | 13 | 20.01 | S44 | 0.3441 | 37 | 29.18 |
| S22 | 0.4580 | 2 | 5.75 | S45 | 0.3284 | 40 | 32.41 |
| S23 | 0.3997 | 7 | 17.73 | S46 | 0.3493 | 34 | 28.11 |
| S47 | 0.3767 | 18 | 22.47 |
| Samples | No. | Habitats | Samples | No. | Habitats |
|---|---|---|---|---|---|
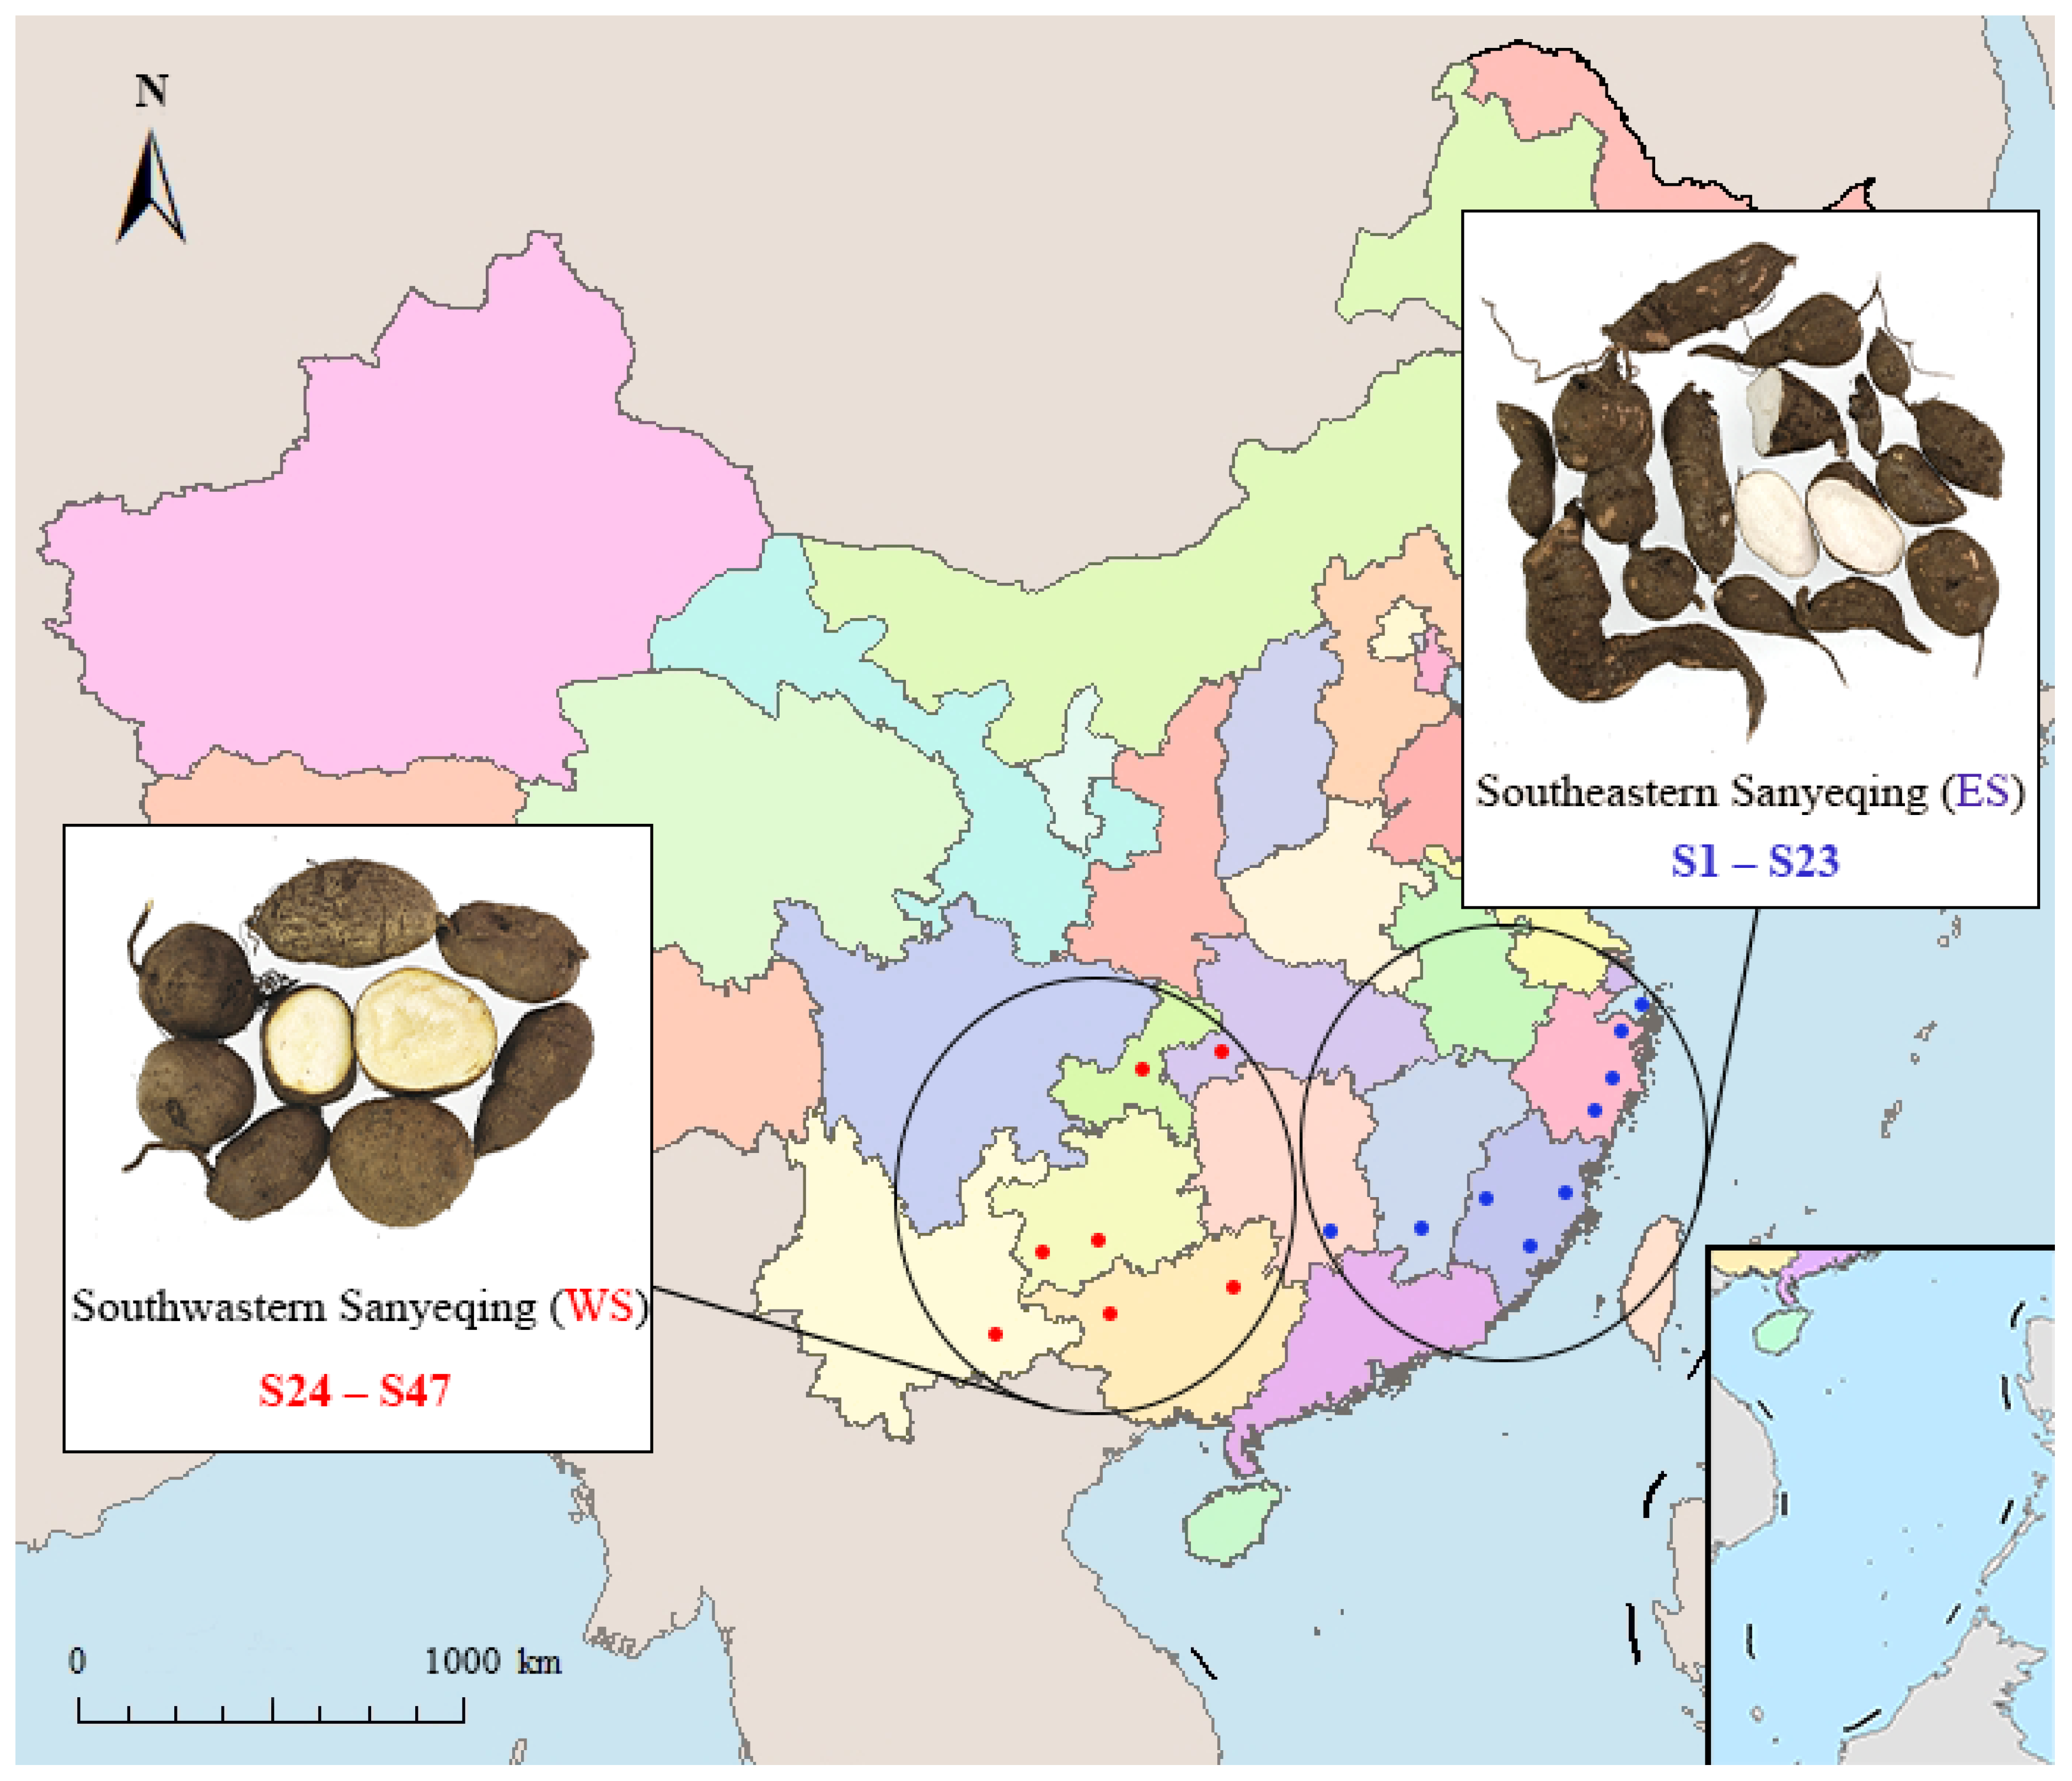
| ES | S1 | Fuzhou, Fujian | WS | S24 | Shizhu, Chongqing |
| S2 | Sanming, Fujian | S25 | Shizhu, Chongqing | ||
| S3 | Sanming, Fujian | S26 | Shizhu, Chongqing | ||
| S4 | Sanming, Fujian | S27 | Guilin, Guangxi | ||
| S5 | Quanzhou, Fujian | S28 | Guilin, Guangxi | ||
| S6 | Quanzhou, Fujian | S29 | Guilin, Guangxi | ||
| S7 | Yongzhou, Hunan | S30 | Guilin, Guangxi | ||
| S8 | Yongzhou, Hunan | S31 | Baise, Guangxi | ||
| S9 | Ganzhou, Jiangxi | S32 | Baise, Guangxi | ||
| S10 | Ganzhou, Jiangxi | S33 | Baise, Guangxi | ||
| S11 | Ganzhou, Jiangxi | S34 | Baise, Guangxi | ||
| S12 | Ganzhou, Jiangxi | S35 | Baise, Guangxi | ||
| S13 | Ganzhou, Jiangxi | S36 | Luodian, Guizhou | ||
| S14 | Taizhou, Zhejiang | S37 | Luodian, Guizhou | ||
| S15 | Taizhou, Zhejiang | S38 | Luodian, Guizhou | ||
| S16 | Ningbo, Zhejiang | S39 | Luodian, Guizhou | ||
| S17 | Ningbo, Zhejiang | S40 | Luodian, Guizhou | ||
| S18 | Ningbo, Zhejiang | S41 | Luodian, Guizhou | ||
| S19 | Ningbo, Zhejiang | S42 | Xingren, Guizhou | ||
| S20 | Lishui, Zhejiang | S43 | Xingren, Guizhou | ||
| S21 | Lishui, Zhejiang | S44 | Enshi, Hubei | ||
| S22 | Lishui, Zhejiang | S45 | Guangnan, Yunnan | ||
| S23 | Zhoushan, Zhejiang | S46 | Guangnan, Yunnan | ||
| S47 | Guangnan, Yunnan |
Publisher’s Note: MDPI stays neutral with regard to jurisdictional claims in published maps and institutional affiliations. |
© 2022 by the authors. Licensee MDPI, Basel, Switzerland. This article is an open access article distributed under the terms and conditions of the Creative Commons Attribution (CC BY) license (https://creativecommons.org/licenses/by/4.0/).
Share and Cite
Chen, H.; Zhou, Y.; Xue, J.; Yuan, J.; Cai, Z.; Wu, N.; Zou, L.; Yin, S.; Yang, W.; Liu, X.; et al. Quality Evaluation of Tetrastigmae Radix from Two Different Habitats Based on Simultaneous Determination of Multiple Bioactive Constituents Combined with Multivariate Statistical Analysis. Molecules 2022, 27, 4813. https://doi.org/10.3390/molecules27154813
Chen H, Zhou Y, Xue J, Yuan J, Cai Z, Wu N, Zou L, Yin S, Yang W, Liu X, et al. Quality Evaluation of Tetrastigmae Radix from Two Different Habitats Based on Simultaneous Determination of Multiple Bioactive Constituents Combined with Multivariate Statistical Analysis. Molecules. 2022; 27(15):4813. https://doi.org/10.3390/molecules27154813
Chicago/Turabian StyleChen, Haijie, Yongyi Zhou, Jia Xue, Jiahuan Yuan, Zhichen Cai, Nan Wu, Lisi Zou, Shengxin Yin, Wei Yang, Xunhong Liu, and et al. 2022. "Quality Evaluation of Tetrastigmae Radix from Two Different Habitats Based on Simultaneous Determination of Multiple Bioactive Constituents Combined with Multivariate Statistical Analysis" Molecules 27, no. 15: 4813. https://doi.org/10.3390/molecules27154813
APA StyleChen, H., Zhou, Y., Xue, J., Yuan, J., Cai, Z., Wu, N., Zou, L., Yin, S., Yang, W., Liu, X., Cheng, J., & Tang, L. (2022). Quality Evaluation of Tetrastigmae Radix from Two Different Habitats Based on Simultaneous Determination of Multiple Bioactive Constituents Combined with Multivariate Statistical Analysis. Molecules, 27(15), 4813. https://doi.org/10.3390/molecules27154813


