
Rapid Limit Test of Seven Pesticide Residues in Tea Based on the Combination of TLC and Raman Imaging Microscopy

Abstract
:1. Introduction
2. Materials and Methods
2.1. Materials
2.2. Apparatus and Conditions
2.3. Solutions Preparation
2.4. The TLC
2.5. The TLC-RIM
3. Results and Discussion
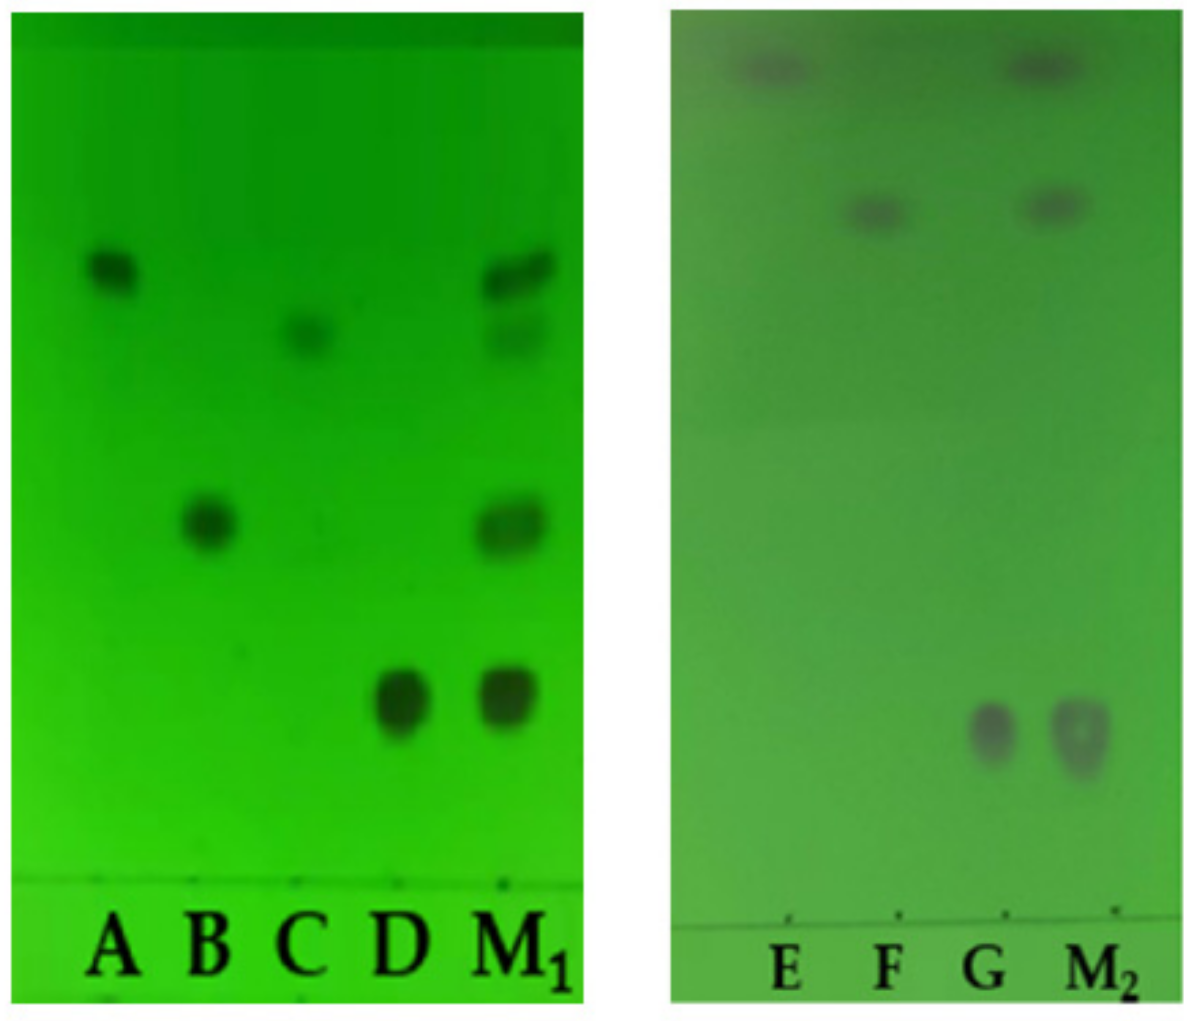
3.1. Separation by the TLC
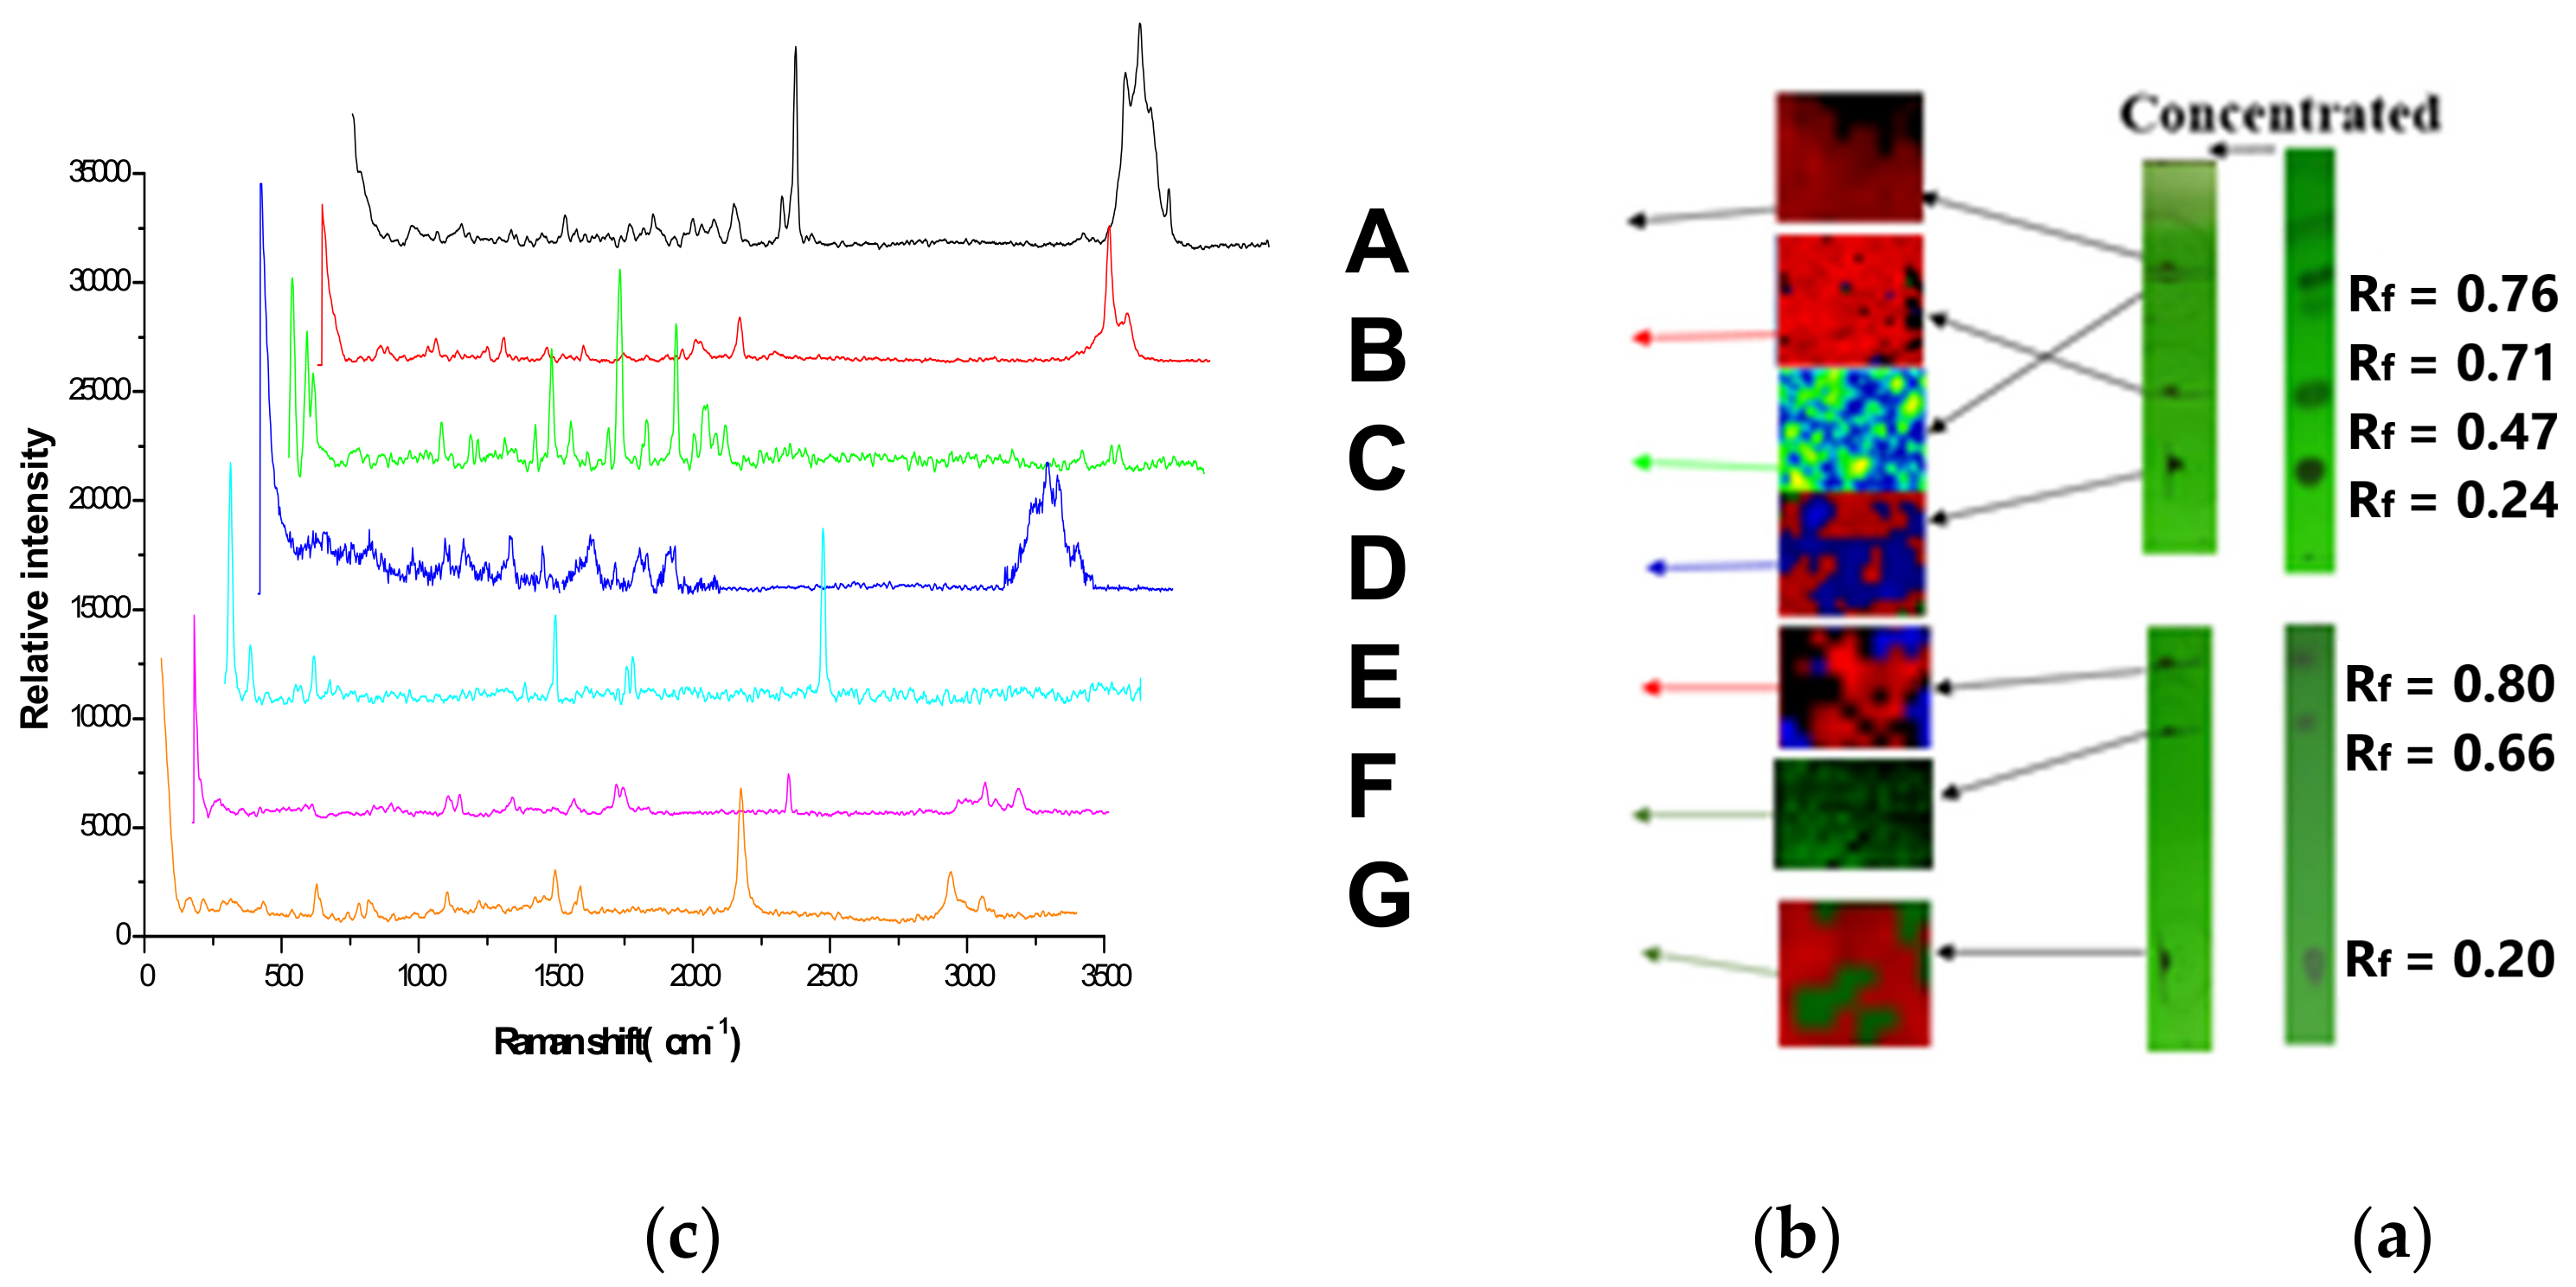
3.2. Limit Test by the TLC-RIM
3.3. The Influence of GF254 and the Developing Agents on the Raman Spectra of the Pesticides
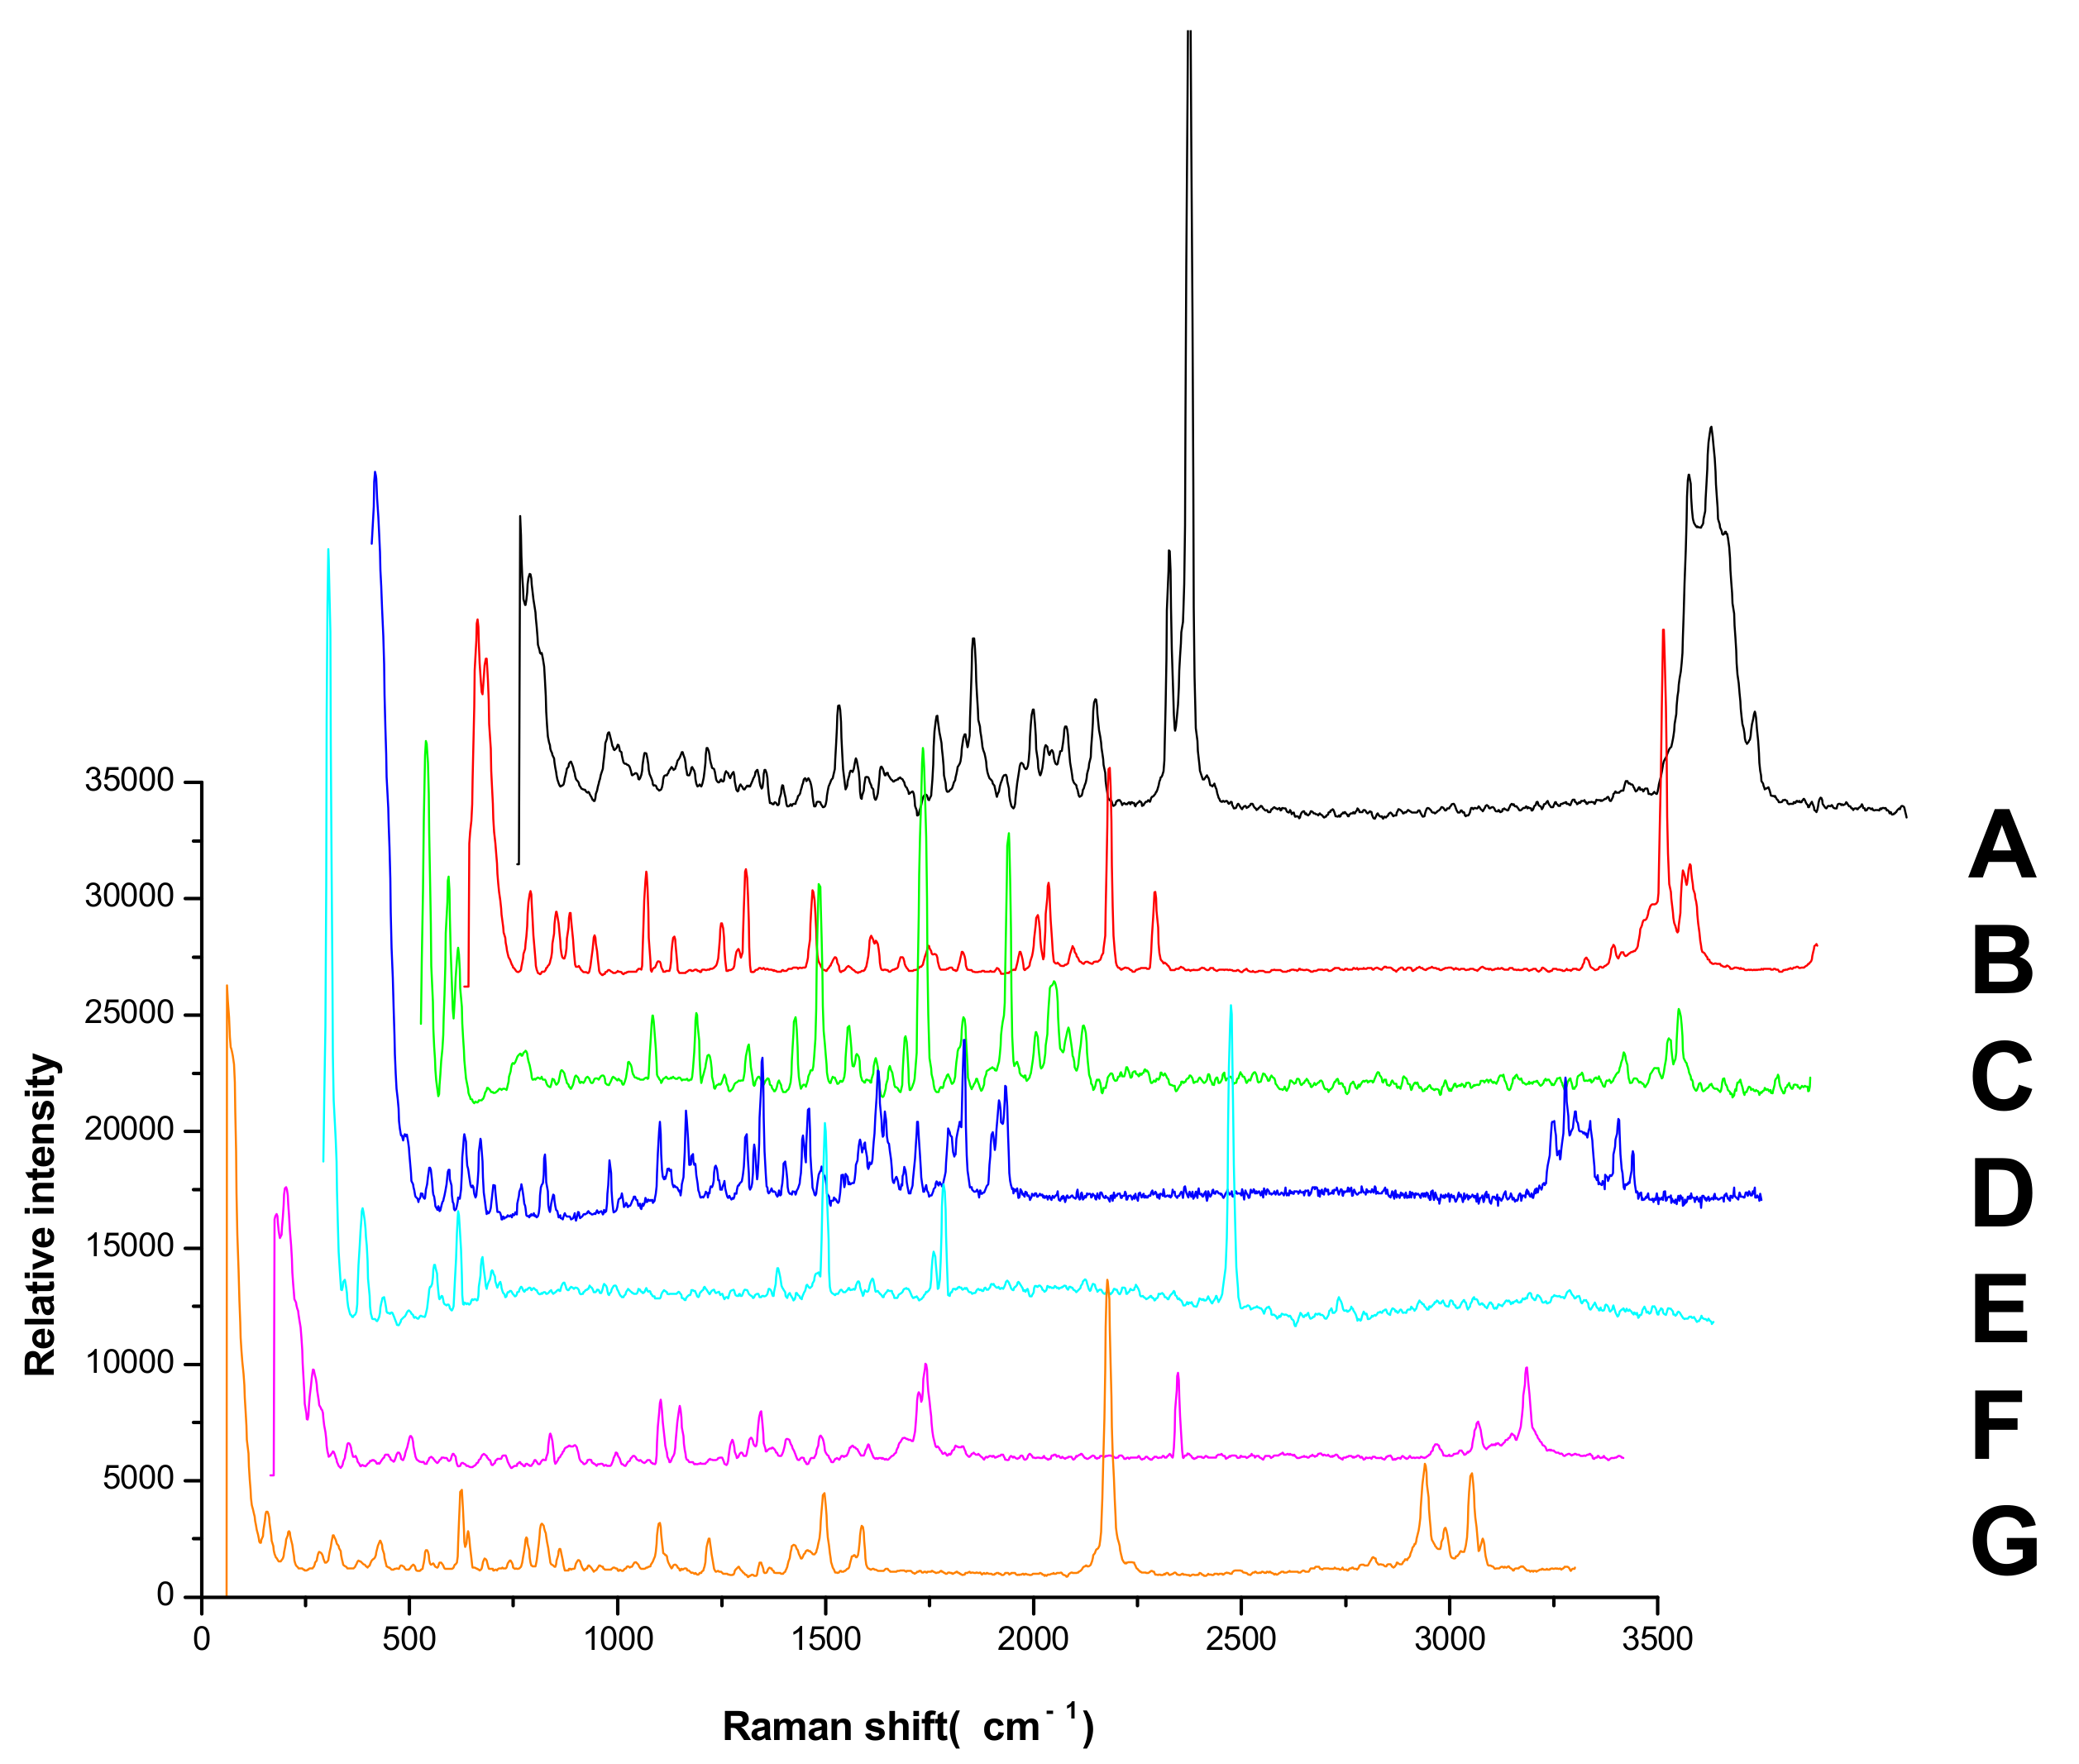
3.4. Analysis of Characteristic Peaks of Seven Pesticides
3.5. Experiment of Simulated Positive Samples
3.6. Stability Test
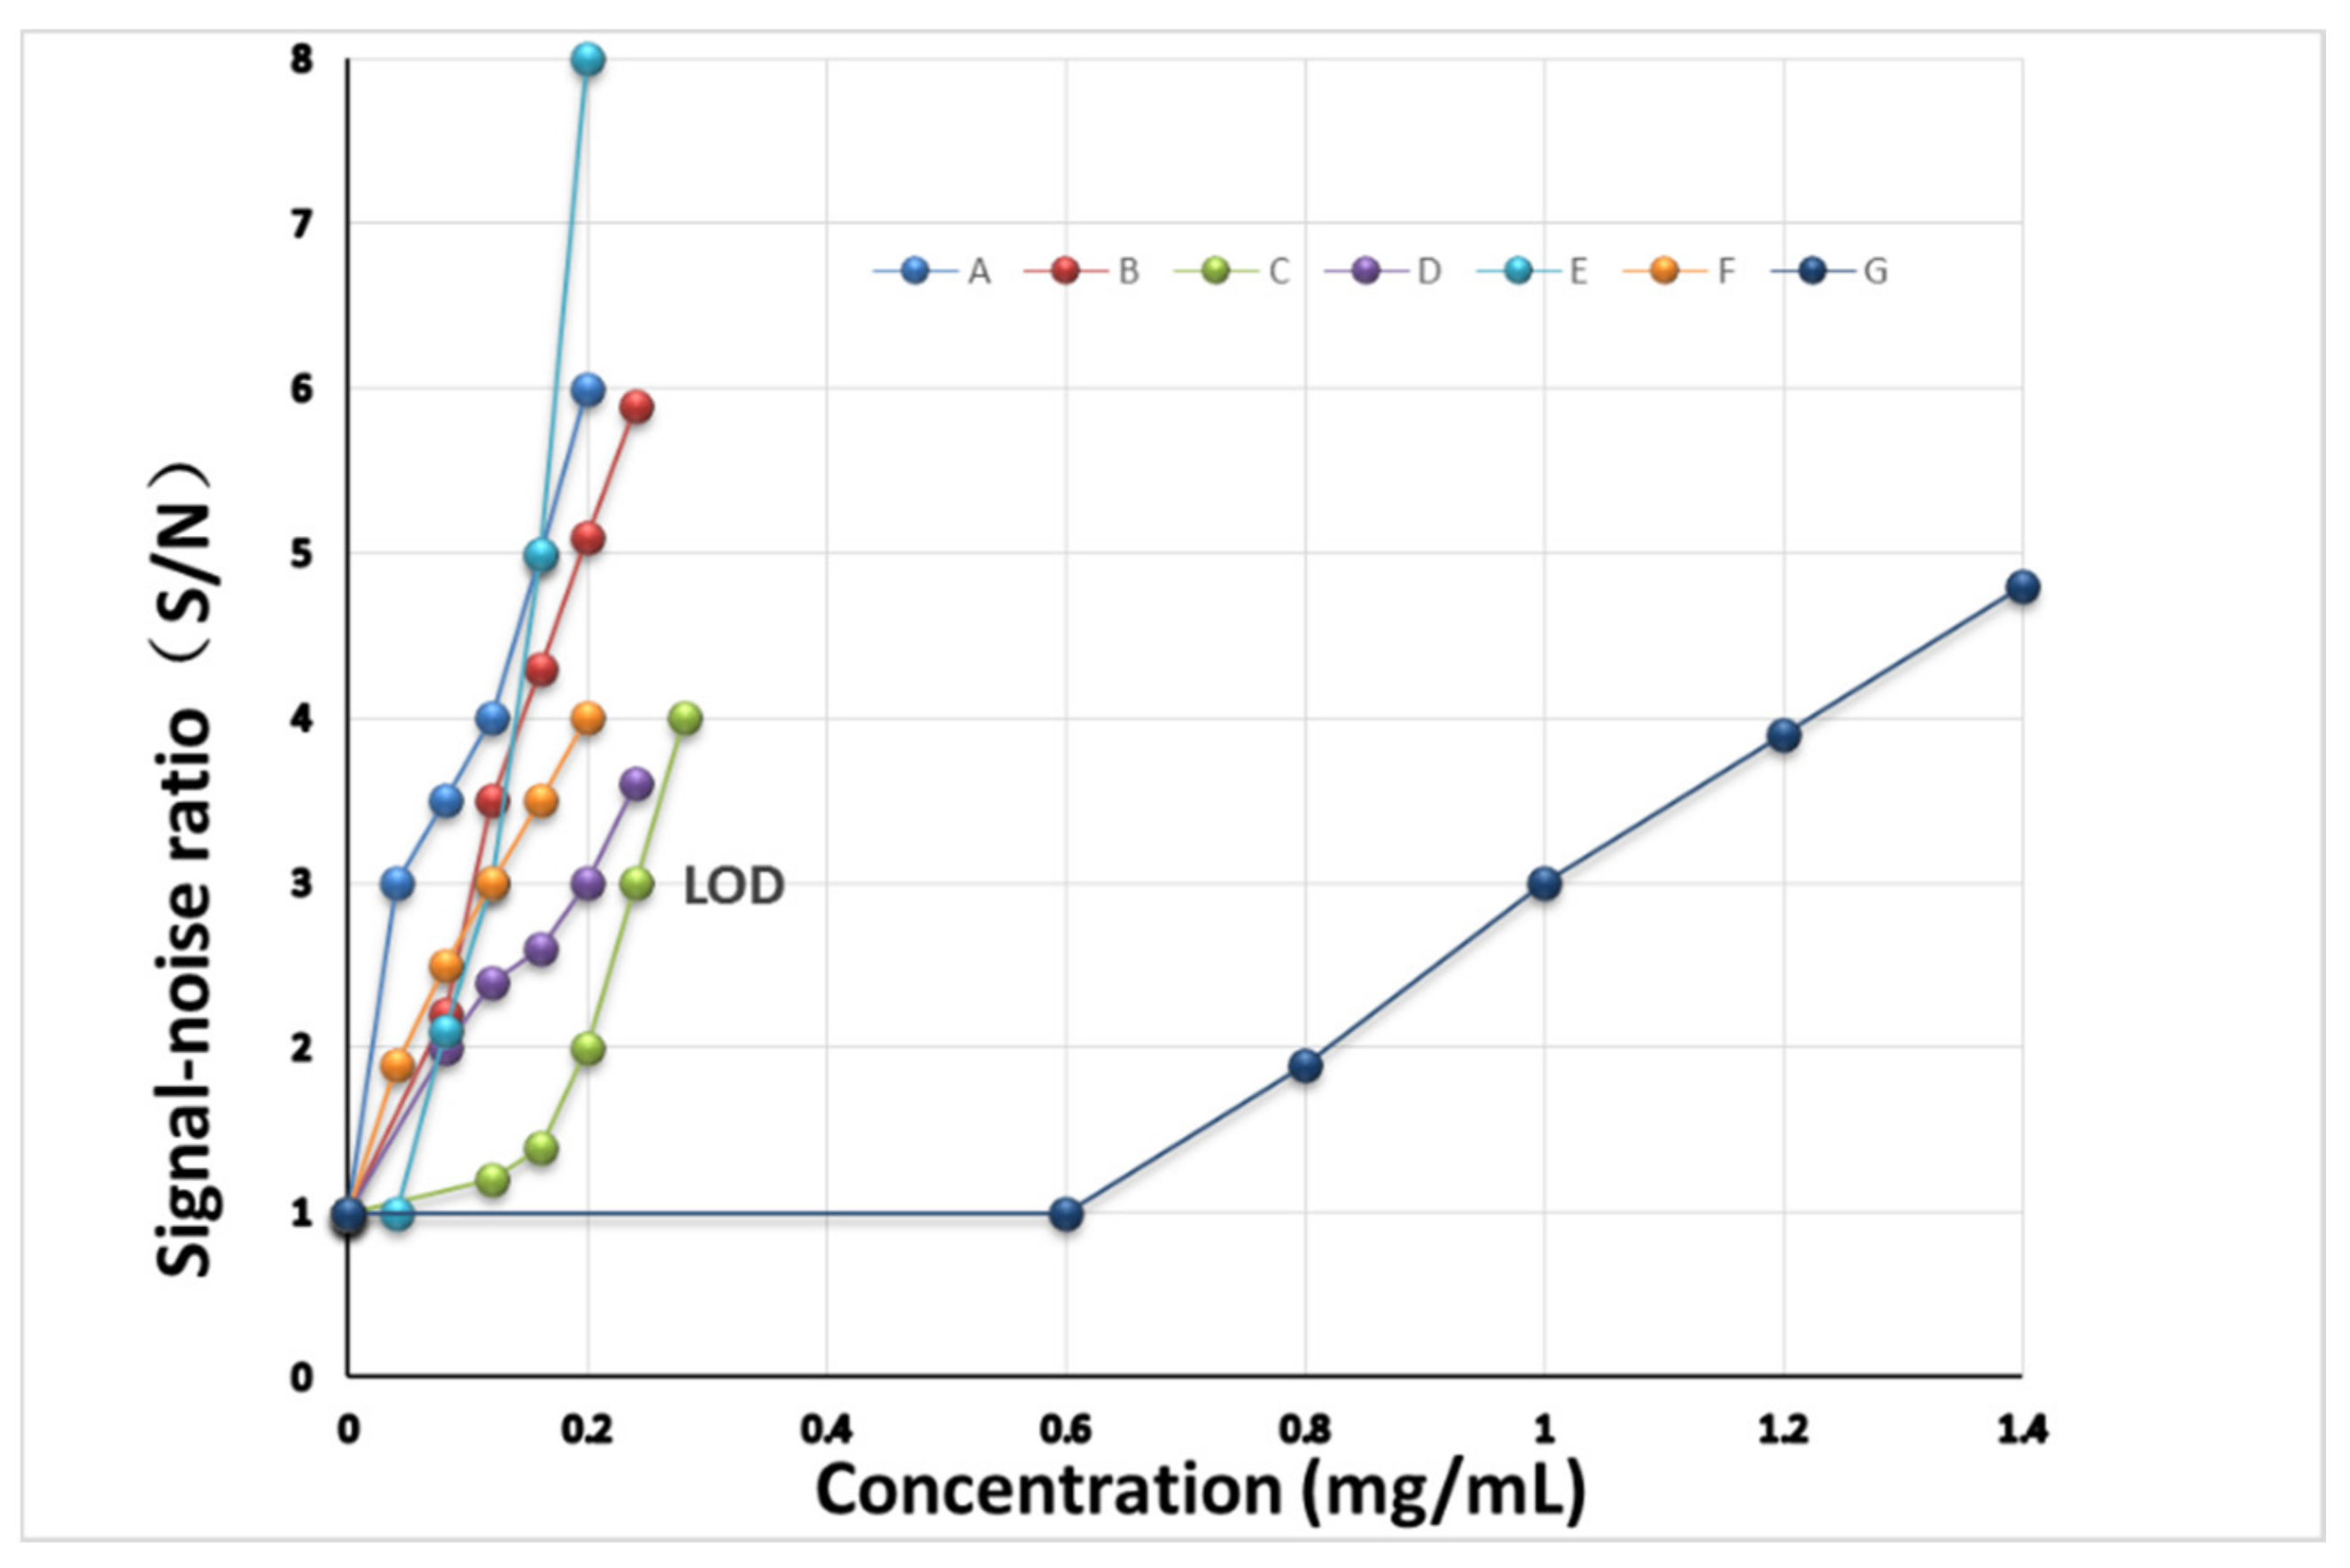
3.7. Inspection of the Limit of Detection
3.8. Limit Test of Real Samples
4. Conclusions
Supplementary Materials
Author Contributions
Funding
Institutional Review Board Statement
Informed Consent Statement
Data Availability Statement
Conflicts of Interest
Sample Availability
References
- Karak, T.; Bhagat, R.M. Trace elements in tea leaves, made tea and tea infusion: A review. Food Res. Int. 2010, 43, 2234–2252. [Google Scholar] [CrossRef]
- Lu, C.; Liu, X.; Dong, F.; Xu, J.; Song, W.; Zhang, C.; Li, Y.; Zheng, Y. Simultaneous determination of pyrethrins residues in teas by ultra-performance liquid chromatography/tandem mass spectrometry. Anal. Chim. Acta 2010, 678, 56–62. [Google Scholar] [CrossRef] [PubMed]
- Xu, X.-M.; Yu, C.; Han, J.-L.; Li, J.-P.; El-Sepai, F.; Zhu, A.; Huang, B.-F.; Cai, Z.-X.; Wu, H.-W.; Ren, Y.-P. Multi-residue analysis of insecticides in tea by online SEC-GC/MS. J. Sep. Sci. 2011, 34, 210–216. [Google Scholar] [CrossRef] [PubMed]
- Raal, A.; Orav, A.; Püssa, T.; Valner, C.; Malmiste, B.; Arak, E. Content of essential oil, terpenoids and polyphenols in commercial chamomile (Chamomilla recutita L. Rauschert) teas from different countries. Food Chem. 2012, 131, 632–638. [Google Scholar] [CrossRef]
- Deng, X.; Guo, Q.; Chen, X.; Xue, T.; Wang, H.; Yao, P. Rapid and effective sample clean-up based on magnetic multiwalled carbon nanotubes for the determination of insecticide residues in tea by gas chromatography–mass spectrometry. Food Chem. 2014, 145, 853–858. [Google Scholar] [CrossRef] [PubMed]
- Han, Y.; Zou, N.; Song, L.; Li, Y.; Qin, Y.; Liu, S.; Li, X.; Pan, C. Simultaneous determination of 70 insecticide residues in leek, leaf lettuce and garland chrysanthemum using modified QuEChERS method with multi-walled carbon nanotubes as reversed-dispersive solid-phase extraction materials. J. Chromatogr. B 2015, 1005, 56–64. [Google Scholar] [CrossRef] [PubMed]
- GB 2763-2021; National Food Safety Standard—Maximum Residue Limits for Pesticides in Food. National standards of the People’s Republic of China; National Health Commission, Ministry of Agriculture and Rural Affairs, State Administration for Market Regulation: China, 2021.
- European Food Safety Authority; Medina-Pastor, P.; Triacchini, G. The 2018 European Union report on pesticide residues in food. EFSA J. 2020, 18, e06057. [Google Scholar] [CrossRef] [PubMed]
- European Food Safety Authority. The 2013 European Union report on insecticide residues in food. EFSA J. 2015, 13, 4038. [Google Scholar]
- European Food Safety Authority. The 2012 European Union Report on insecticide residues in food. EFSA J. 2016, 12, 3942. [Google Scholar]
- European Food Safety Authority. The 2014 European Union Report on Insecticide Residues in Food. EFSA J. 2016, 14, 4611. [Google Scholar]
- Gilden, R.C.; Hufing, K.; Sattler, B. Pesticides and health risks. J. Obstet. Gynecol. Neonatal Nurs. Jognn 2010, 39, 103–110. [Google Scholar] [CrossRef]
- Samsidar, A.; Siddiquee, S.; Shaarani, S.M. A review of extraction, analytical and advanced methods for determination of pesticides in environment and foodstufs. Trends Food Sci. Technol. 2018, 71, 188–201. [Google Scholar] [CrossRef]
- Jin, B.; Xie, L.; Guo, Y.; Pang, G. Multi-residue detection of pesticides in juice and fruit wine: A review of extraction and detection methods. Food Res. Int. 2012, 46, 399–409. [Google Scholar] [CrossRef]
- Sulaiman, N.S.; Rovina, K.; Joseph, V.M. Classifcation, extraction and current analytical approaches for detection of pesticides in various food products. J. Consum. Prot. Food Saf. 2019, 14, 209–221. [Google Scholar] [CrossRef]
- Yue, Y.; Li, L.; Liang, Y.; Dong, L.; Dong, Q.; Zhong, H. Effects of co-existed proteins on measurement of insecticide residues in blood by gas chromatography—Mass spectrometry. J. Chromatogr. B 2010, 878, 3089–3094. [Google Scholar] [CrossRef] [PubMed]
- Reyzer, M.L.; Brodbelt, J.S. Analysis of fre ant pesticides in water by solid-phase microextraction and gas chromatography/mass spectrometry or high-performance liquid chromatography/mass spectrometry. Anal. Chim Acta 2001, 436, 11–20. [Google Scholar] [CrossRef]
- Zuo, Y.; Chen, H.; Deng, Y. Simultaneous determination of catechins, caffeine and gallic acids in green, Oolong, black and pu-erh teas using HPLC with a photodiode array detector. Talanta 2002, 57, 307–316. [Google Scholar] [CrossRef]
- Thuy, N.T.N.; Luan, H.N.T.; Hieu, V.V.K.; Ngan, M.T.T.; Trung, N.T.; Hung, L.V.T.; Van, T.T.T. Optimum fabrication parameters for preparing high performance SERS substrates based on Si pyramid structure and silver nanoparticles. R. Soc. Chem. 2021, 11, 31189–31196. [Google Scholar] [CrossRef]
- Parnsubsakul, A.; Ngoensawat, U.; Wutikhun, T.; Sukmanee, T.; Sapcharoenkun, C.; Pienpinijtham, P.; Ekgasit, S. Silver nanoparticle/bacterial nanocellulose paper composites for paste-andread SERS detection of pesticides on fruit surfaces. Carbohydr. Polym. 2020, 235, 115956. [Google Scholar] [CrossRef]
- Dhas, D.A.; Joe, I.H.; Roy, S.D.D.; Freeda, T.H. DFT computations and spectroscopic analysis of a pesticide: Chlorothalonil. Spectrochim. Acta Part A Mol. Biomol. Spectrosc. 2010, 77, 36–44. [Google Scholar] [CrossRef]
- Huang, X.; Zhang, N.; Li, Z.; Shi, J.; Tahir, H.E.; Sun, Y.; Zhang, Y.; Zhang, X.; Holmes, M.; Zou, X. Rapid Detection of Carbendazim Residue in Apple Using Surface-Enhanced Raman Scattering and Coupled Chemometric Algorithm. Foods 2022, 11, 1287. [Google Scholar] [CrossRef] [PubMed]
- Li, X.; Tan, L.L.; Liu, J.C.; Li, L.; Jia, S.S. Rapid Detection of Four Chemical Components Added Illegally in Slimming Health Food with TLC Situ Raman Spectroscopy. Spectrosc. Spectr. Anal. 2018, 38, 830–836. [Google Scholar]
- Shen, Z.D.; Fan, Q.Z.; Qian, Y.; Wang, R.; Wang, H.; Kong, X. Facile detection of carbendazim in food using TLC-SERS on diatomite thin layer chromatography. Spectrochim. Acta A Mol. Biomol. Spectrosc. 2021, 247, 119037. [Google Scholar] [CrossRef]
- Tan, A.; Zhao, Y.; Sivashanmugan, K.; Squire, K.; Wang, A.X. Quantitative TLC-SERS detection of histamine in seafood with support vector machine analysis. Food Control. 2019, 103, 111–118. [Google Scholar] [CrossRef] [PubMed]
- Qu, L.L.; Jia, Q.; Liu, C.Y.; Wang, W.; Duan, L.F.; Yang, G.H.; Han, C.Q.; Li, H.T. Thin layer chromatography combined with surface-enhanced raman spectroscopy for rapid sensing aflatoxins. J. Chromatogr. A 2018, 1579, 115–120. [Google Scholar] [CrossRef]
- Zhao, Y.; Tan, A.L.; Squire, K.; Sivashanmugan, K.; Wang, A.X. Quaternion-based Parallel Feature Extraction: Extending the Horizon of Quantitative Analysis using TLC-SERS Sensing. Sens. Actuators B Chem. 2019, 299, 126902. [Google Scholar] [CrossRef] [PubMed]
- Yaseen, T.; Sun, D.-W.; Cheng, J.-H. Raman Imaging for Food Quality and Safety Evaluation: Fundamentals and Applications. Trends Food Sci. Technol 2017, 62, 177–189. [Google Scholar] [CrossRef]
- Stewart, S.; Priore, R.J.; Nelson, M.P.; Treado, P.J. Raman Imaging. Annu. Rev. Anal. Chem 2012, 5, 337–360. [Google Scholar] [CrossRef]
- Petersen, M.; Yu, Z.; Lu, X. Application of Raman Spectroscopic Methods in Food Safety: A Review. Biosensors 2021, 11, 187. [Google Scholar] [CrossRef]
- Finnie, P.; Ouyang, J.; Lefebvre, J. Full Spectrum Raman Excitation Mapping Spectroscopy. Sci. Rep. 2020, 10, 9172. [Google Scholar] [CrossRef]
- Fazio, E.; Corsaro, C.; Mallamace, D. Paper aging and degradation monitoring by the non-destructive two-dimensional micro-Raman mapping. Spectrochim. Acta Part A Mol. Biomol. Spectrosc. 2020, 228, 117660. [Google Scholar] [CrossRef] [PubMed]


| Chemical Structure | Raman Shift Value (cm−1) of Reference Powders (Relative Peak Intensity) | Raman Shift Value (cm−1) by TLC-RIM (Relative Peak Intensity) | Assignments |
|---|---|---|---|
Abamectin (A) | 3035 (0.4) | 3045 (0.4) | ν=CH |
| 2968 (1.0) | 2982 (1.0) | νasCH3 | |
| 2928 (1.3) | 2946 (1.3) | νasCH2 | |
| 2876 (1.2) | 2894 (1.2) | νsCH3 | |
| 1674 (2.9)~1626 (0.9) | 1674 (1.3)~1626 (0.3) * | νC=C | |
| 1450 (0.5) | 1450 (0.4) | βCH3 | |
| 1156 (0.7) | 1157(0.3) * | νC-C | |
| 834 (0.5) | 838(0.2) * | γ=CH | |
Methomyl (B)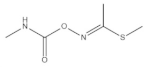 | 2995 (1.0) | 2996 (1.0) | νasCH3 |
| 2932 (3.0) | 2931 (2.8) * | νsCH3 | |
| 1709 (1.0) | 1709 (0.2) * | νC=O amide I band | |
| 1599 (2.0) | 1593 (1.0) * | βNH amide II band | |
| ~1453 double (1.0) | ~1453 double (0.5) * | βCH3 | |
| 887 (1.0) | 881 (0.4) * | νC-N-C | |
| 726 (1.2) | 726 (0.5) * | νC-S | |
Carbendazim (C)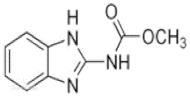 | 3085 (1.6)~3065 (1.2) | 3087 (1.2)~3060 (1.2) * | ν=CH within phenyl rings |
| 2954 (1.0) | 2954 (1.0) | νCH3 | |
| 1544~1656 quartet (2.3)~ | 1544~1654 quartet (2.3) | νC=C within phenyl rings | |
| 1473 (5.1) | 1473 (5.1) | βCH3 | |
| 1267 (6.9) | 1267 (6.9) | νC-N | |
| 1018 (4.6) | 1018 (4.6) | νC-C | |
| 728~624 (2.0) | 726~621 (1.9) | γ=CH within phenyl rings | |
Imidacloprid (D)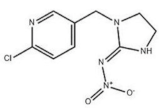 | 3094 (0.4), 3063 (0.7) | 3094 (0.4), 3059 (0.1) * | νs=CH within pyridine rings |
| ~2935 (1.0) quartet | ~2944 (1.0) quartet * | νCH2 | |
| ~1584 double (1.0) | ~1586 double (0.4) * | νC=C within pyridine rings | |
| 1484 (1.3) | 1484 (0.4) * | βCH2 | |
| 1277 (1.1) | 1276 (0.5) * | νC-N | |
| 1113~998 (1.2) | 1115~998 (0.3) * | νC-C | |
| 821~758 (0.5) | 818~753 (0.3) * | γ=CH within pyridine rings | |
| ~636 (0.1) | ~636 (0.06) * | νC-CI | |
Chlorothalonil (E)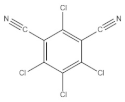 | 2241 (1.0) | 2242 (1.0) | ν-C≡N |
| 1553~1533 double (0.4) | 1551~1530 double (0.2) * | νC=C | |
| 1265~1156 double (0.6) | 1265~1152 double (0.5) * | νC-C | |
| 391 (0.3) | 391 (0.2) * | ||
Azoxystrobin (F) | 3069 (1.0) | 3069 (0.3) * | ν=CH within phenyl rings |
| 2951 (0.4) | 2956 (0.4) | νasCH3 | |
| 2855 (0.2) | 2854 (0.2) | νsCH3 | |
| 2230 (1.0) | 2230 (1.0) | ν-C≡N | |
| ~1624 double (1.0) | ~1624 double (0.8) | νC=C within phenyl rings | |
| 1227 (0.5) | 1227 (0.4) | β=CH within phenyl rings | |
| 1037~990 double (0.6) | 1040~995 double (0.5) | νC-C within phenyl rings | |
| 727 (0.1) | 724 (0.1) | γ=CH within phenyl rings | |
Acetamiprid (G) | 3057 (0.3) | 3052 (0.2) * | ν=CH within phenyl rings |
| 2943 (0.4) | 2941 (0.3) * | νasCH3 | |
| 2177 (1.0) | 2177 (1.0) | ν-C≡N | |
| 1587~1502 double (0.3) | 1590~1496 double (0.25) * | νC=C within phenyl rings | |
| 1427 (0.1) | 1427 (0.06) * | βCH2 within phenyl rings | |
| 1222 (0.1) | 1224 (0.06) * | νC-N | |
| 1106 (0.2) | 1106 (0.1) * | νC-C | |
| 819~784 double (0.3) | 822~782 double (0.2) * | γ=CH within phenyl rings | |
| ~625 double (0.3) | ~628 double (0.2) * | νC-CI |
| Drug | MRL (mg/kg) | LOD (mg/kg) | MRL (mg/mL) | LOD (mg/mL) |
|---|---|---|---|---|
| Abamectin (A) | 0.1 | 0.08 | 0.05 | 0.04 |
| Methomyl (B) | 0.2 | 0.20 | 0.10 | 0.10 |
| Carbendazim (C) | 5.0 | 0.48 | 2.50 | 0.24 |
| Imidacloprid (D) | 0.5 | 0.40 | 0.25 | 0.20 |
| Chlorothalonil (E) | 10.0 | 0.24 | 5.00 | 0.12 |
| Azoxystrobin (F) | 0.5 | 0.24 | 0.25 | 0.12 |
| Acetamiprid (G) | 10.0 | 2.00 | 5.00 | 1.00 |
Publisher’s Note: MDPI stays neutral with regard to jurisdictional claims in published maps and institutional affiliations. |
© 2022 by the authors. Licensee MDPI, Basel, Switzerland. This article is an open access article distributed under the terms and conditions of the Creative Commons Attribution (CC BY) license (https://creativecommons.org/licenses/by/4.0/).
Share and Cite
Liang, X.; Li, L.; Han, C.; Dong, Y.; Xu, F.; Lv, Z.; Zhang, Y.; Qu, Z.; Dong, W.; Sun, Y. Rapid Limit Test of Seven Pesticide Residues in Tea Based on the Combination of TLC and Raman Imaging Microscopy. Molecules 2022, 27, 5151. https://doi.org/10.3390/molecules27165151
Liang X, Li L, Han C, Dong Y, Xu F, Lv Z, Zhang Y, Qu Z, Dong W, Sun Y. Rapid Limit Test of Seven Pesticide Residues in Tea Based on the Combination of TLC and Raman Imaging Microscopy. Molecules. 2022; 27(16):5151. https://doi.org/10.3390/molecules27165151
Chicago/Turabian StyleLiang, Xin, Li Li, Cuiyan Han, Yan Dong, Feng Xu, Zhen Lv, Ying Zhang, Zhijie Qu, Wei Dong, and Yongqiang Sun. 2022. "Rapid Limit Test of Seven Pesticide Residues in Tea Based on the Combination of TLC and Raman Imaging Microscopy" Molecules 27, no. 16: 5151. https://doi.org/10.3390/molecules27165151
APA StyleLiang, X., Li, L., Han, C., Dong, Y., Xu, F., Lv, Z., Zhang, Y., Qu, Z., Dong, W., & Sun, Y. (2022). Rapid Limit Test of Seven Pesticide Residues in Tea Based on the Combination of TLC and Raman Imaging Microscopy. Molecules, 27(16), 5151. https://doi.org/10.3390/molecules27165151