
Silver Nanoparticles Incorporated on Natural Clay as an Inhibitor against the New ISO SS Bacteria Isolated from Sewage Sludge, Involved in Malachite Green Dye Oxidation

 ,
,  ,
,  ,
,  ,
, 
Abstract
:1. Introduction
2. Results
2.1. Experimental Protocol for the Synthesis of BN-Ag0
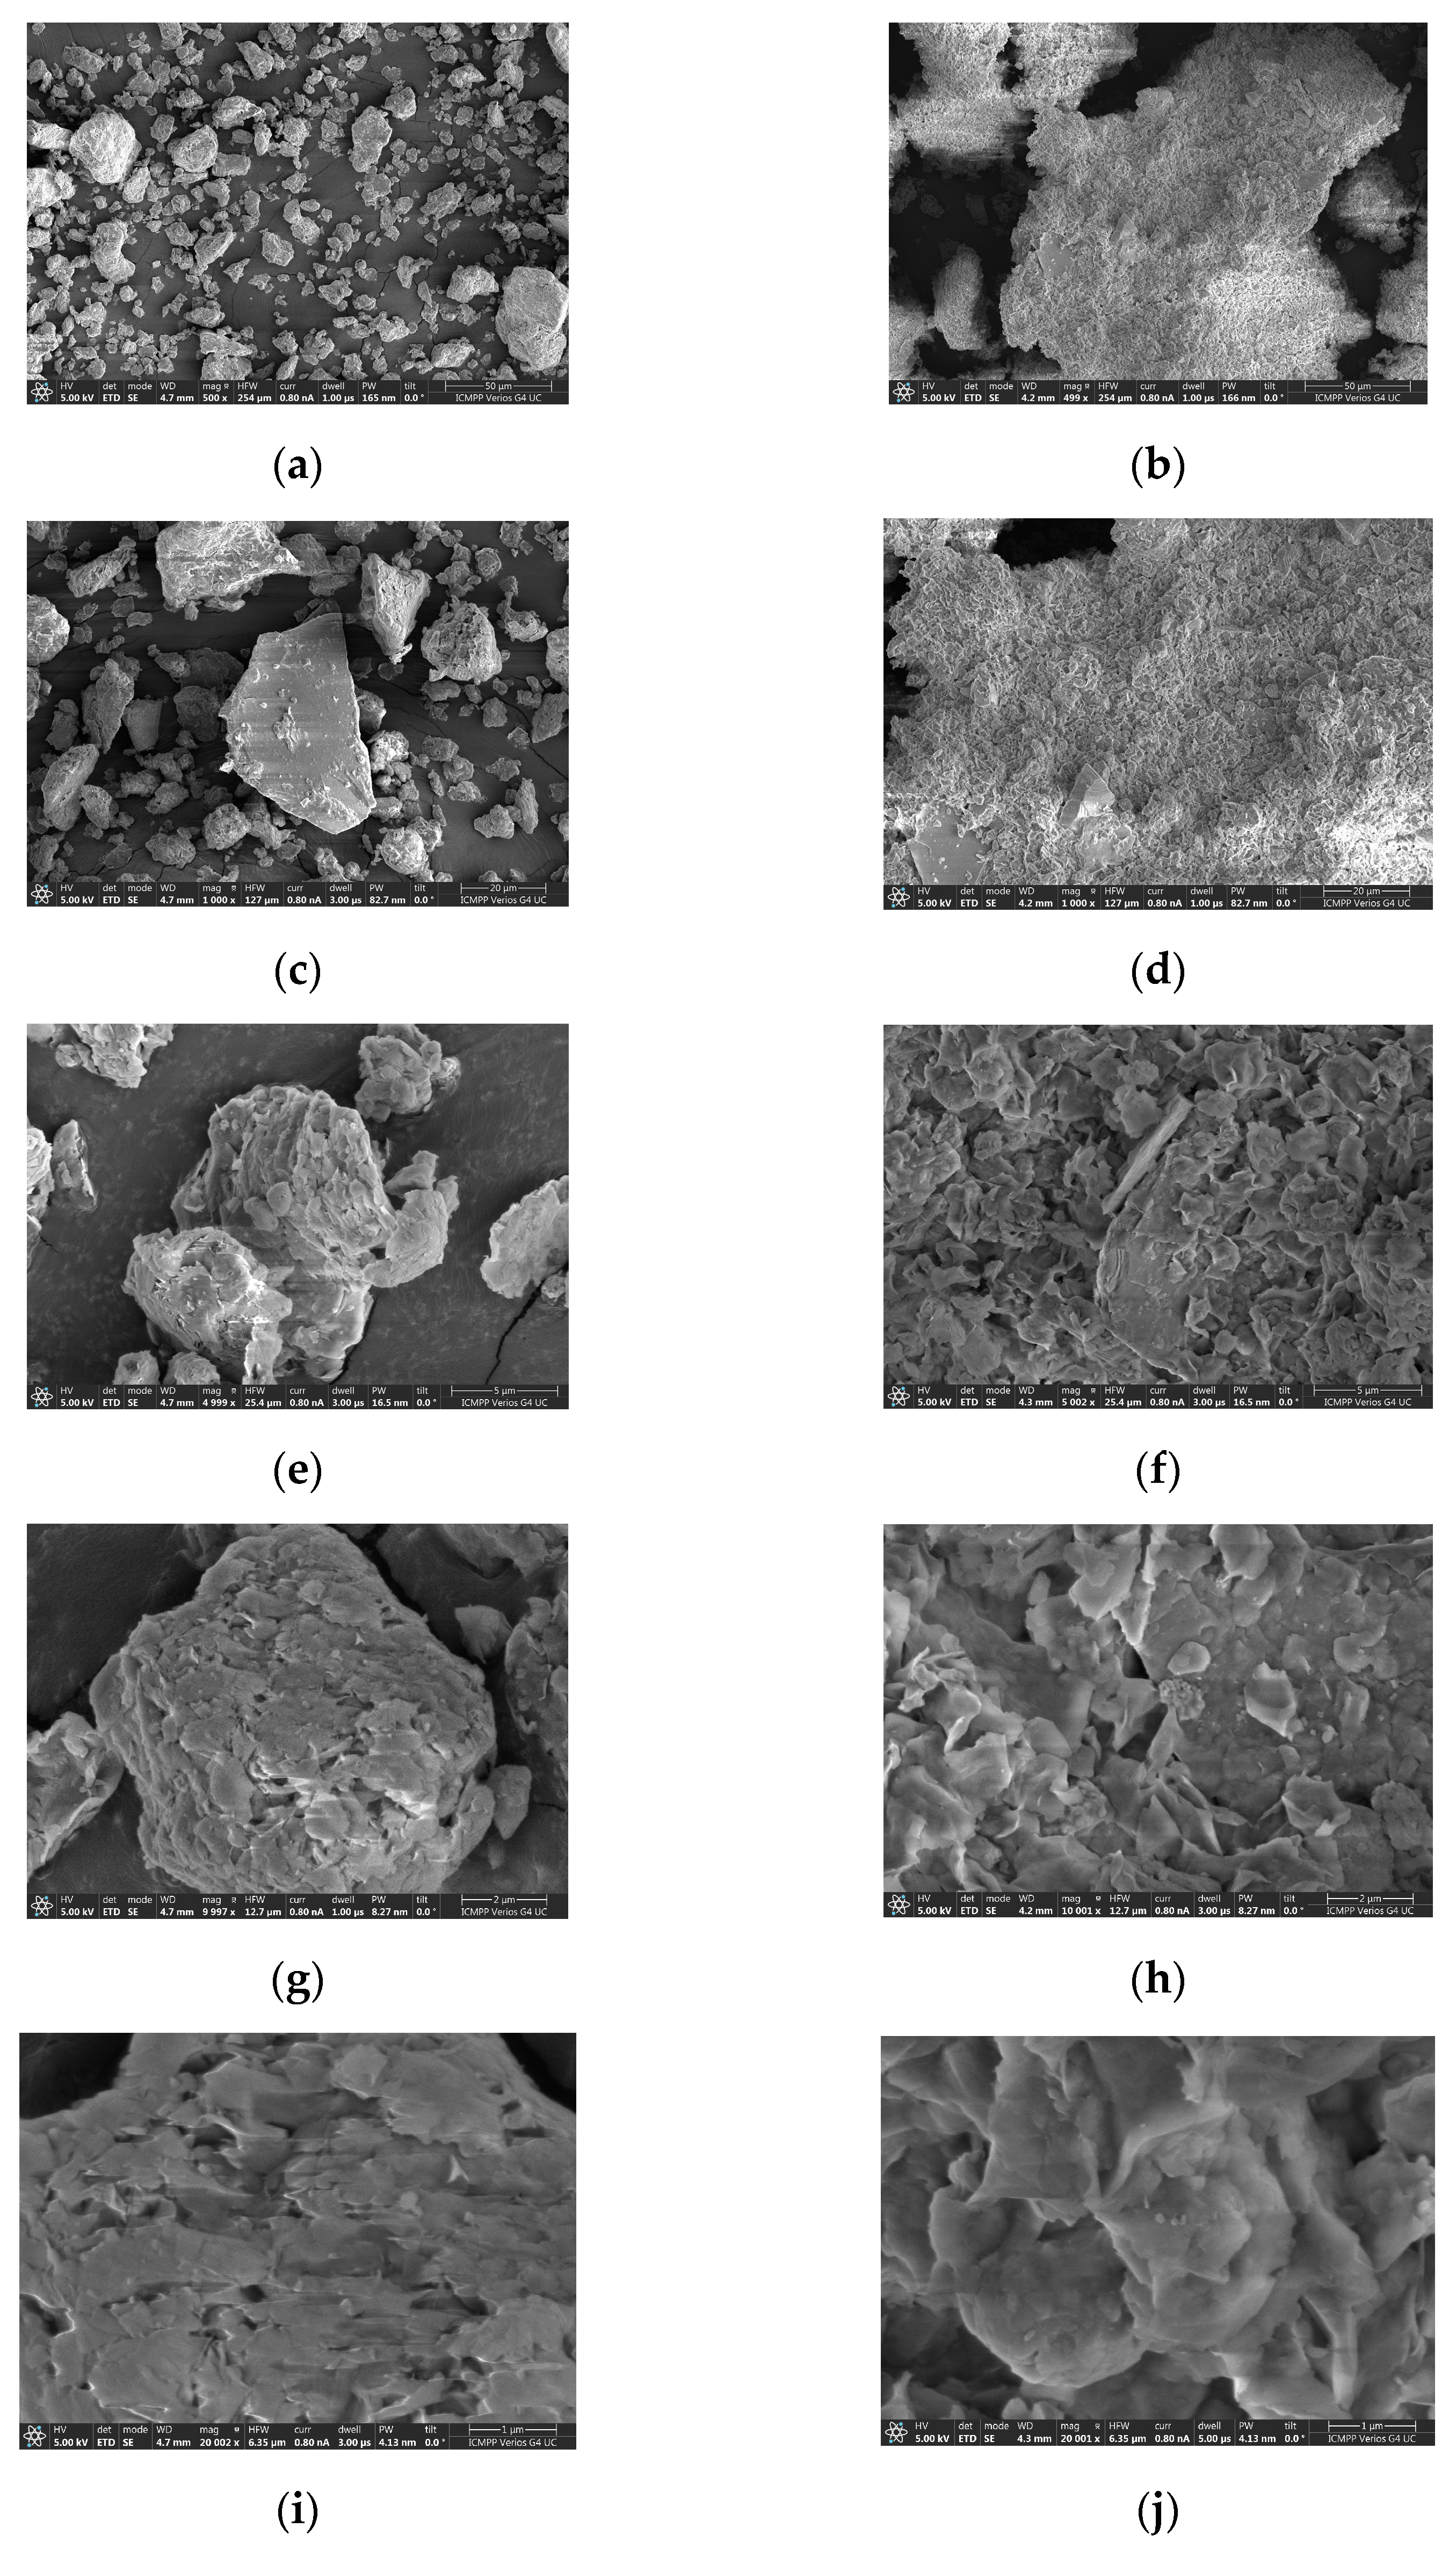
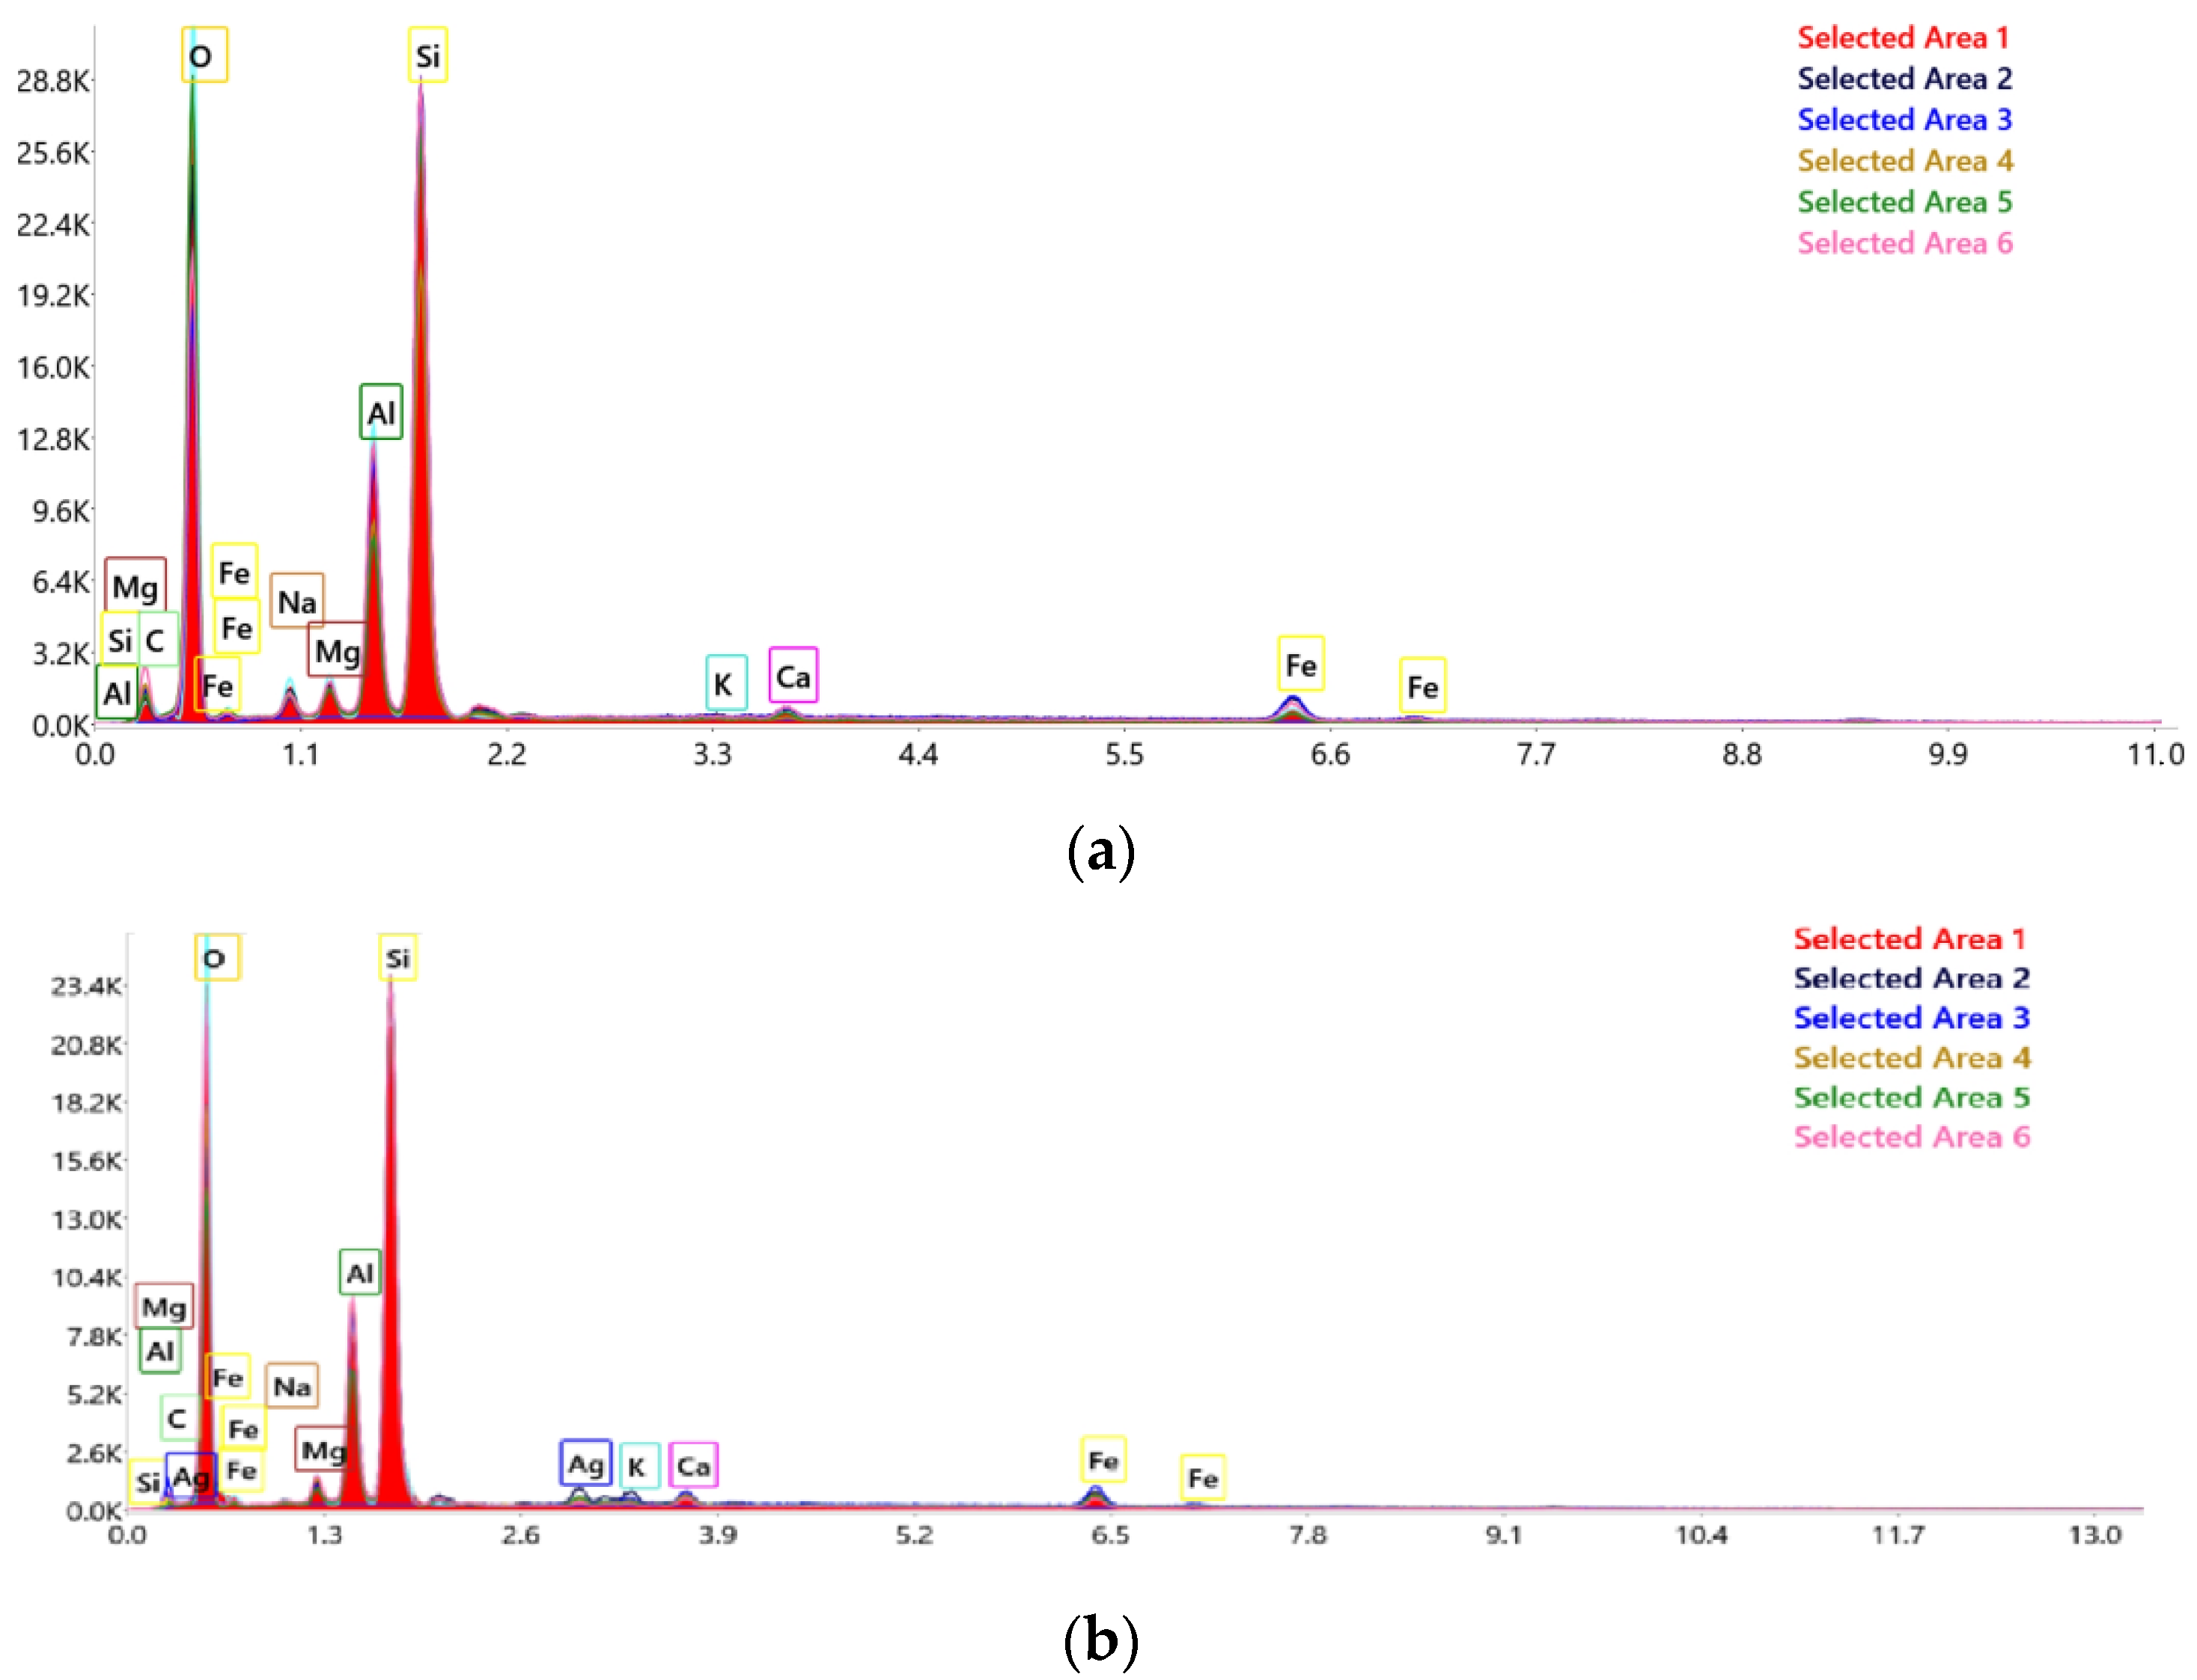
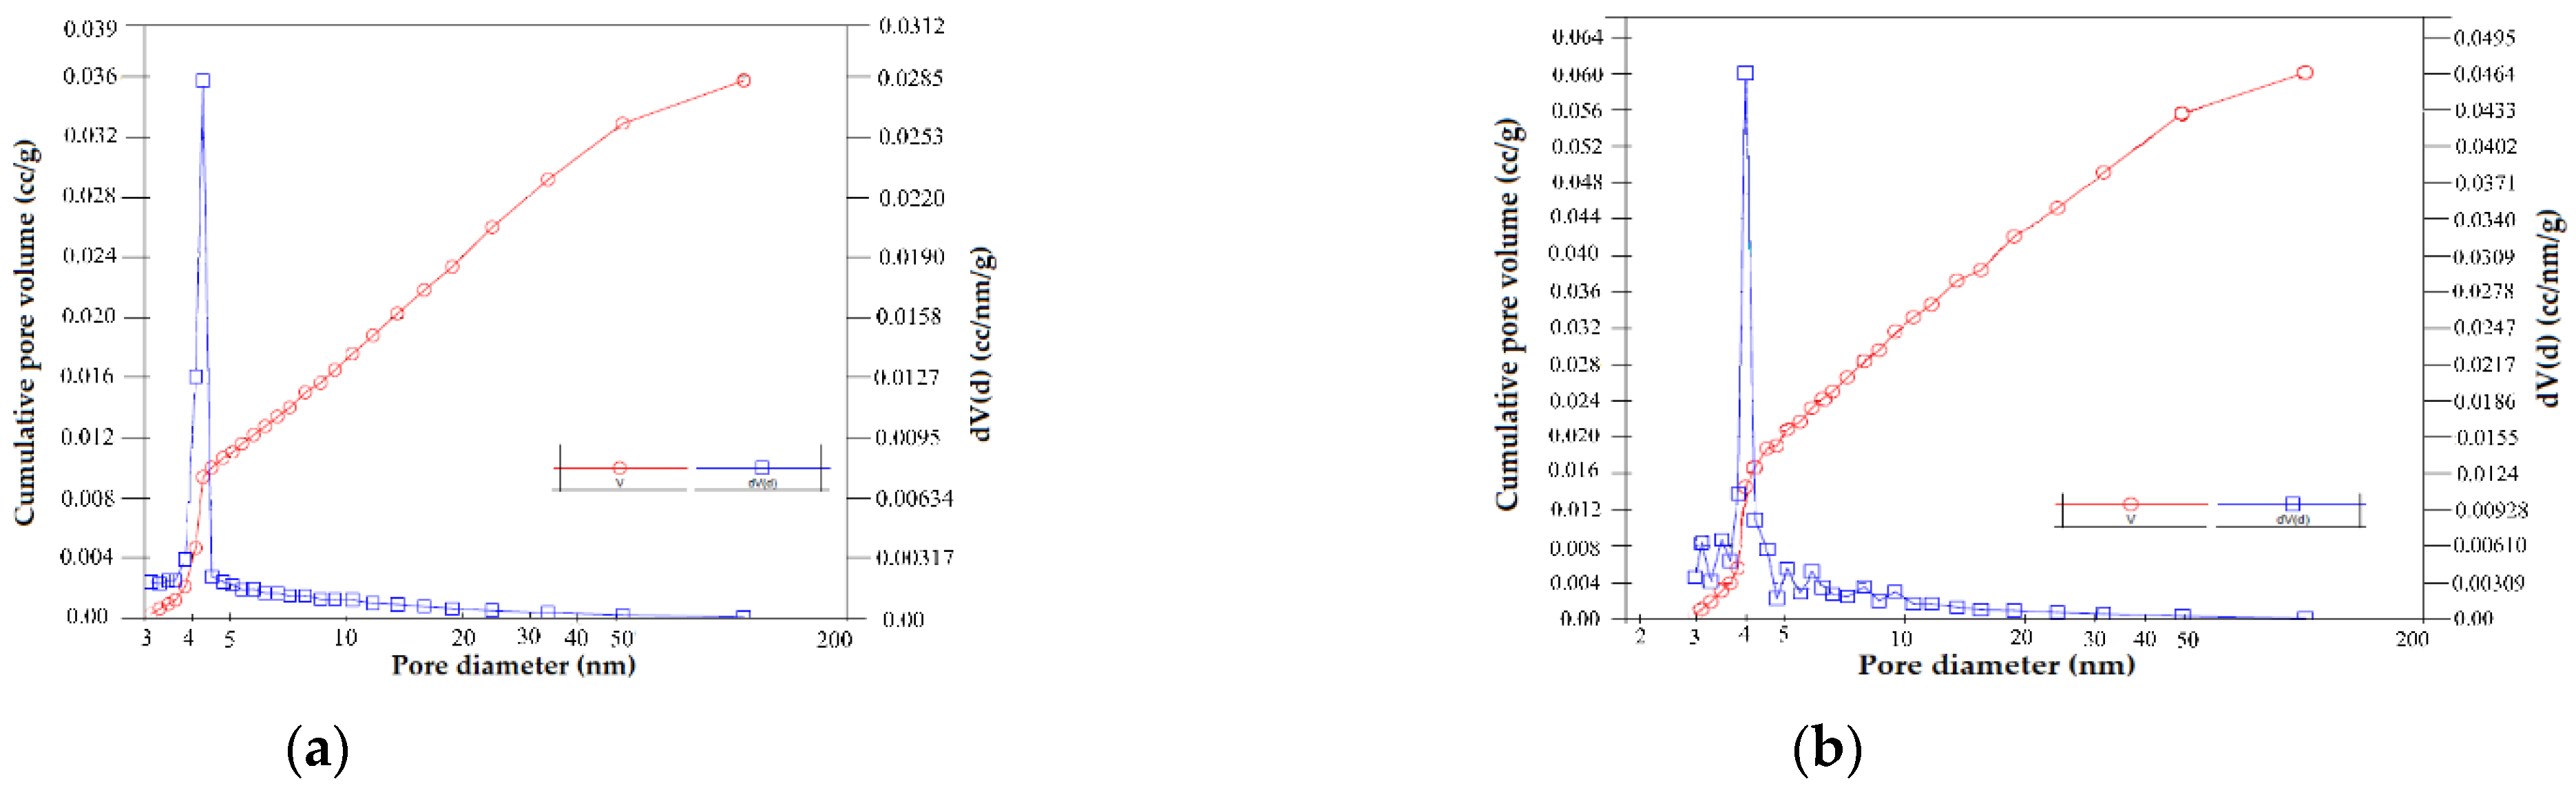
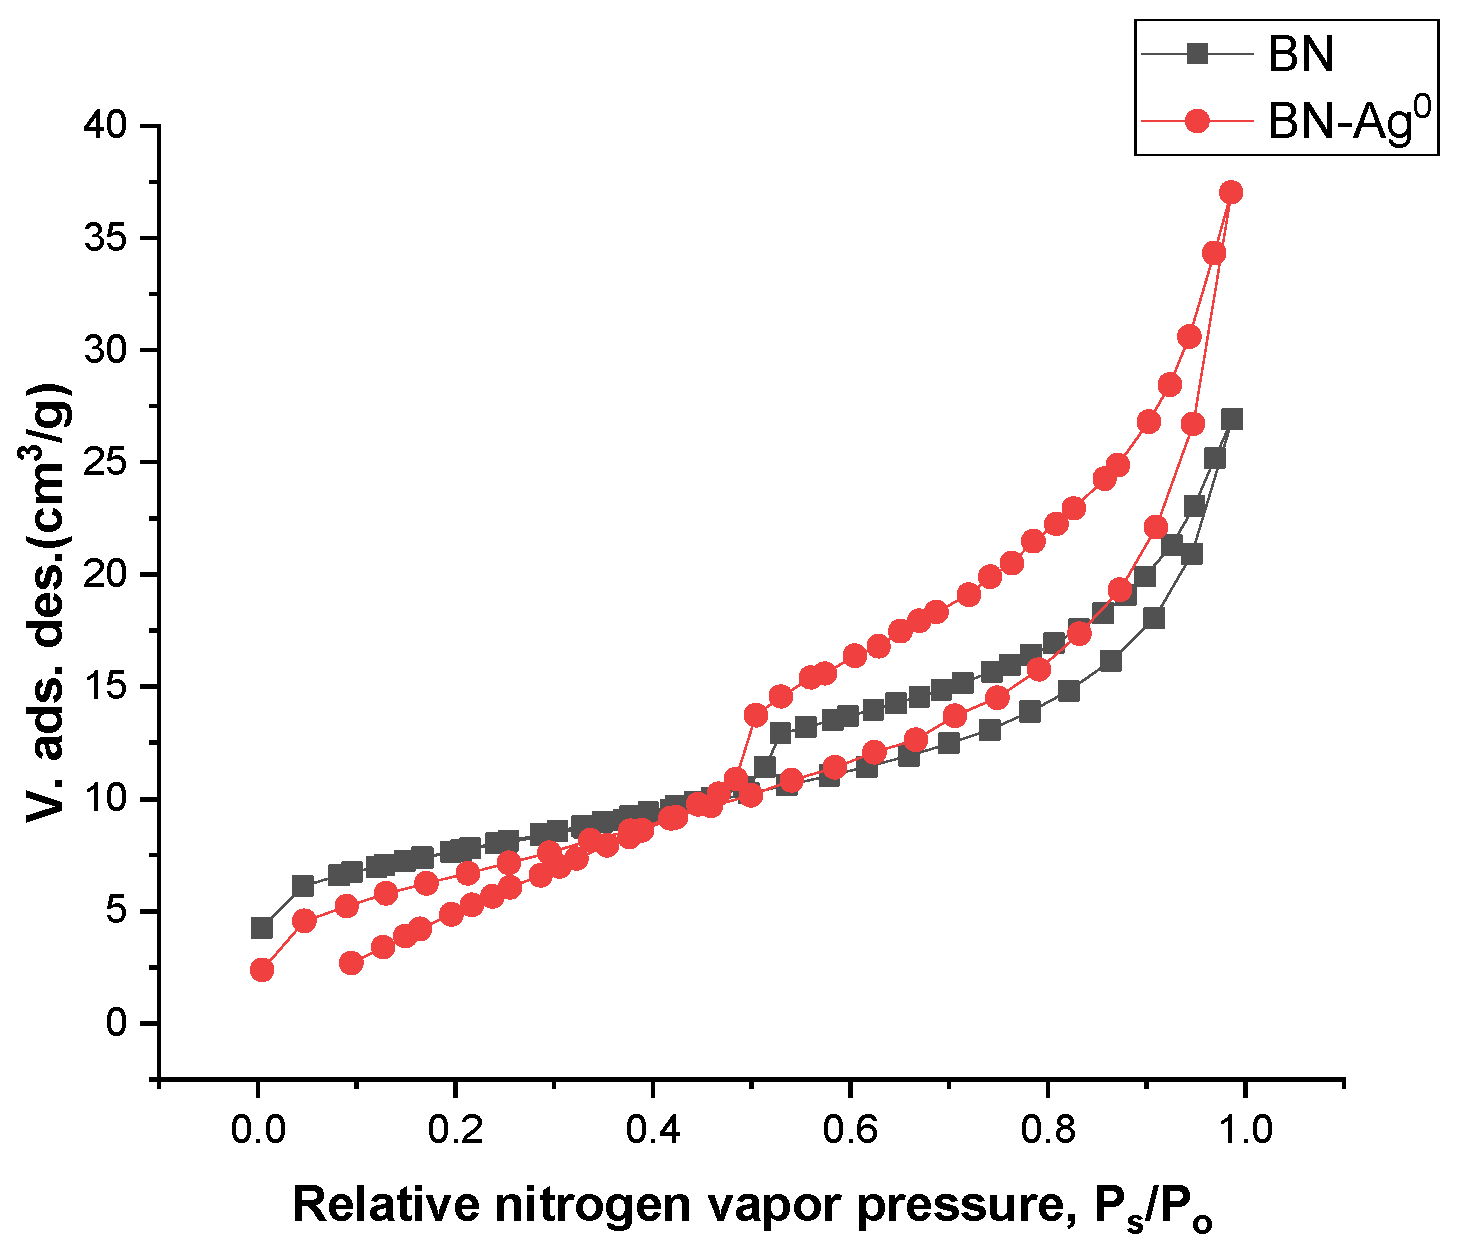
2.2. Material Characterization
2.3. Bacterium Characterization
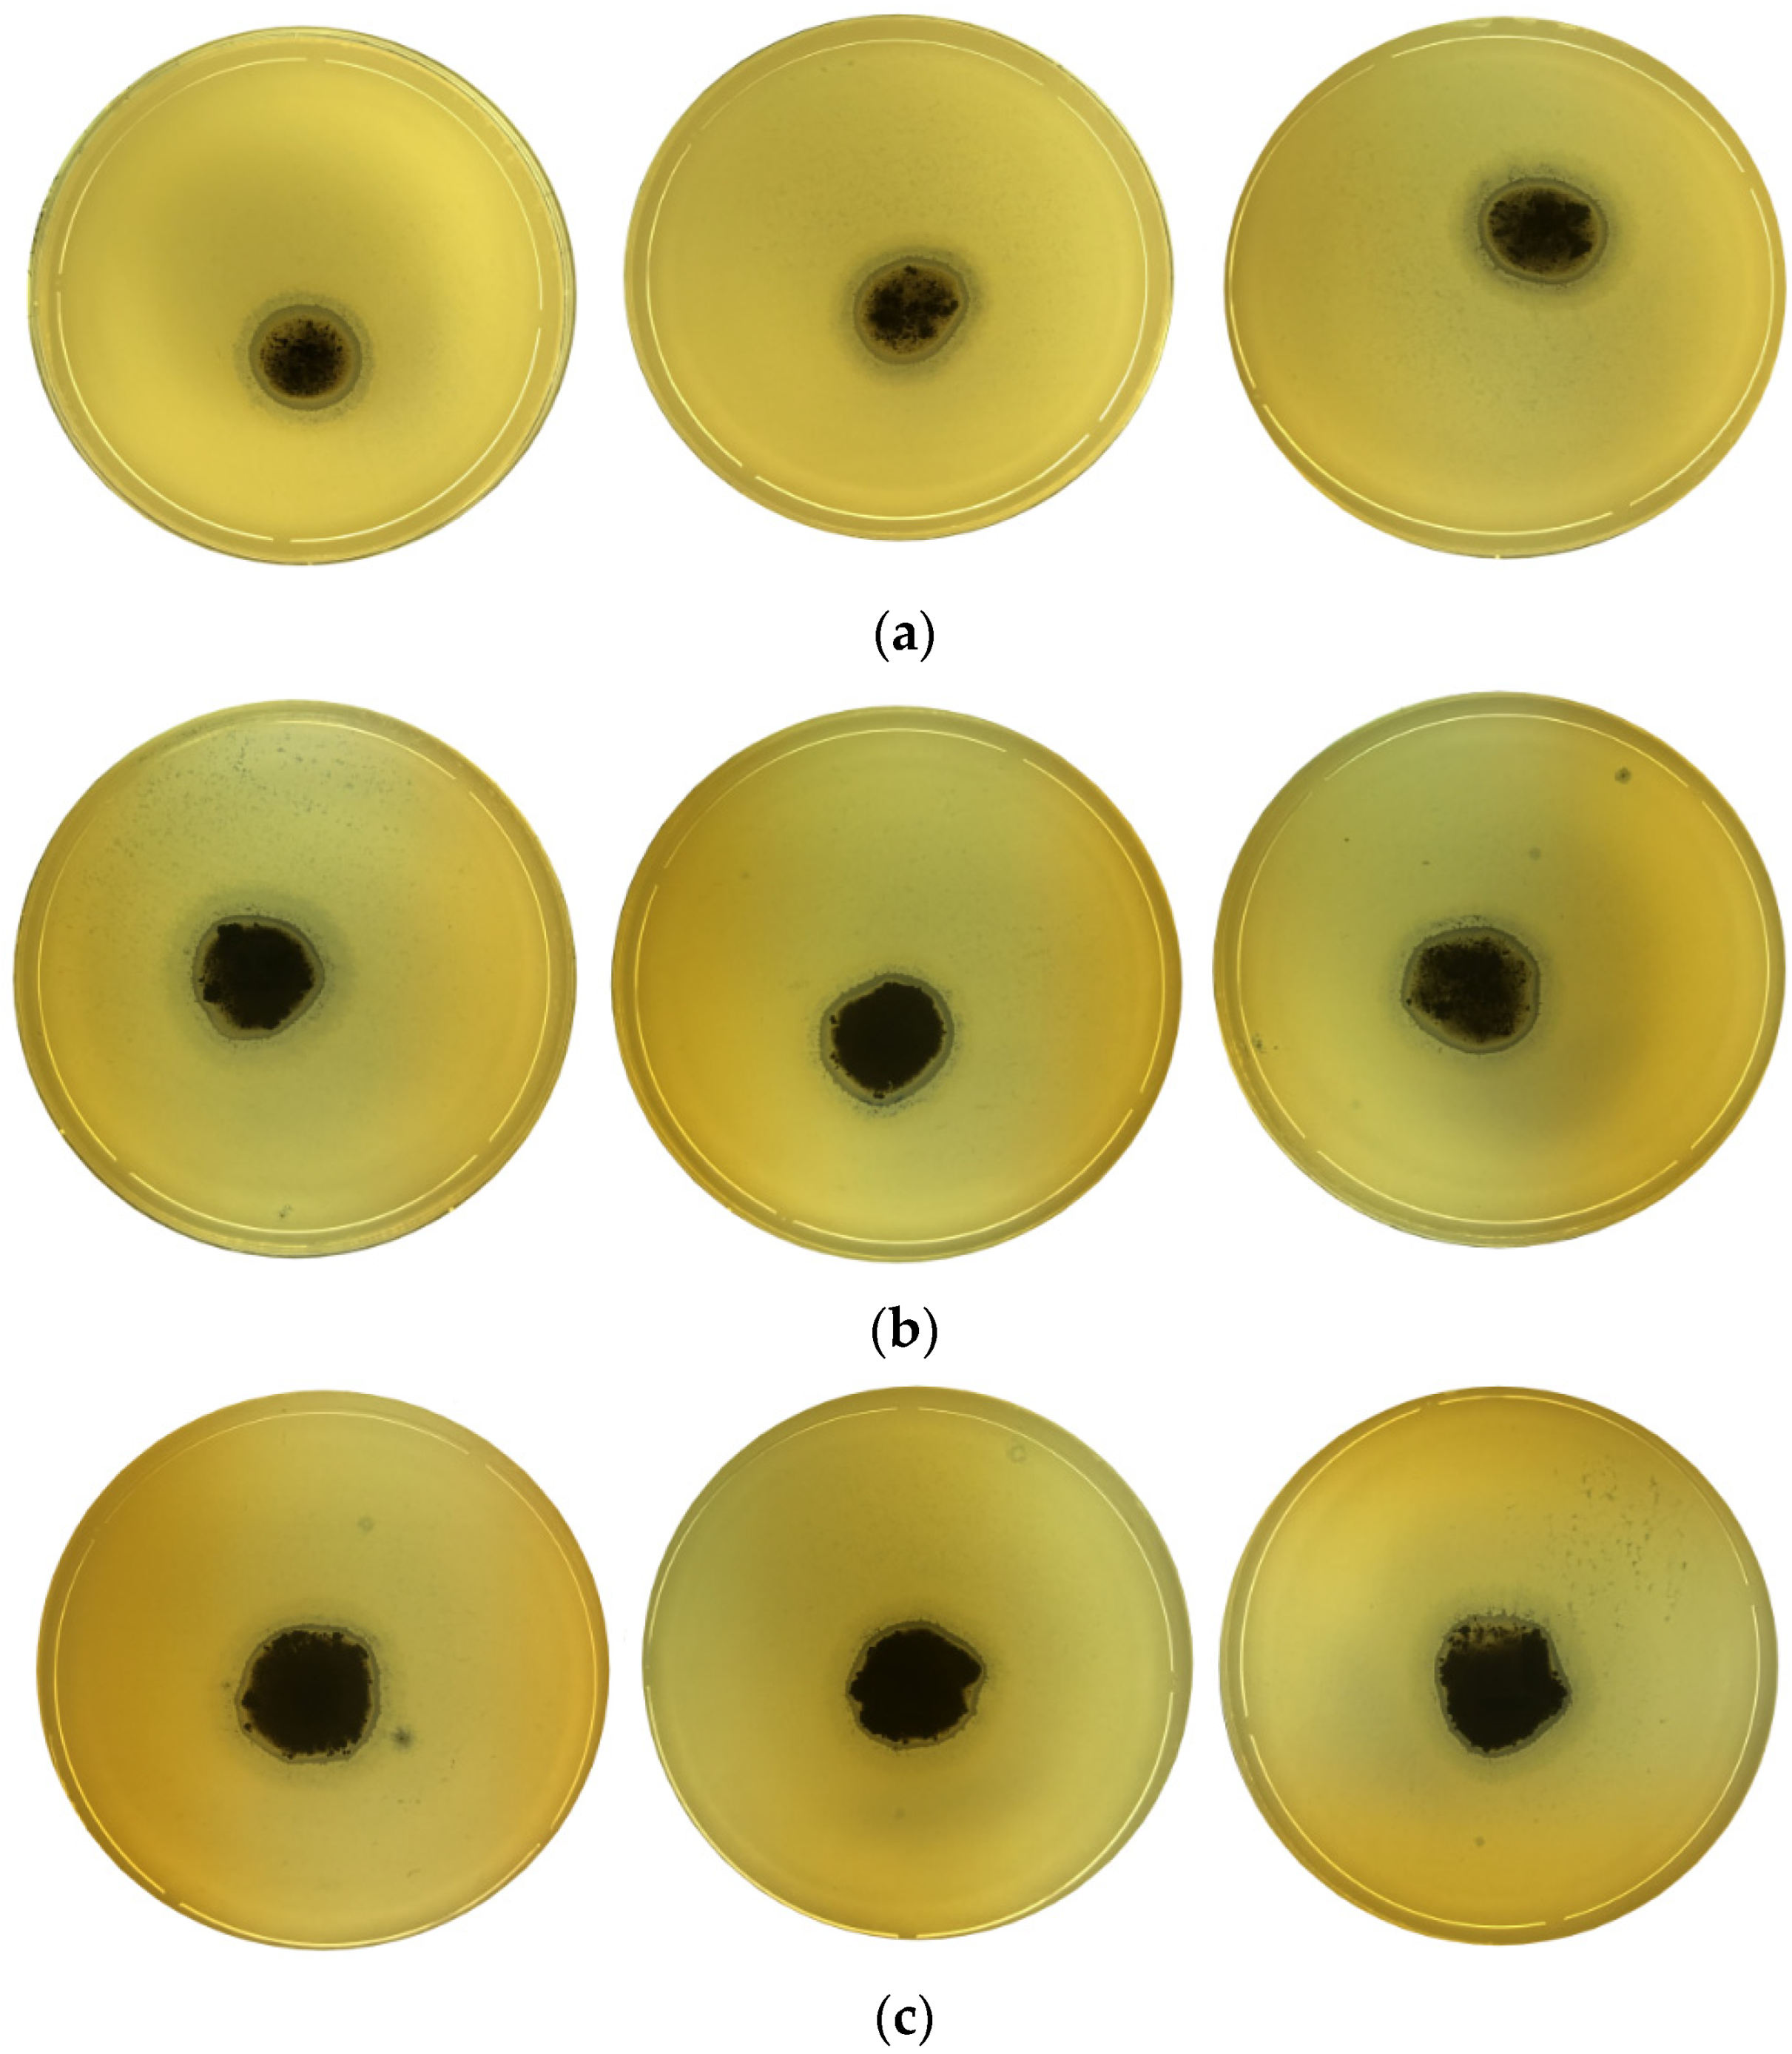
2.4. Antibacterial Activity
2.5. Catalytic Activity
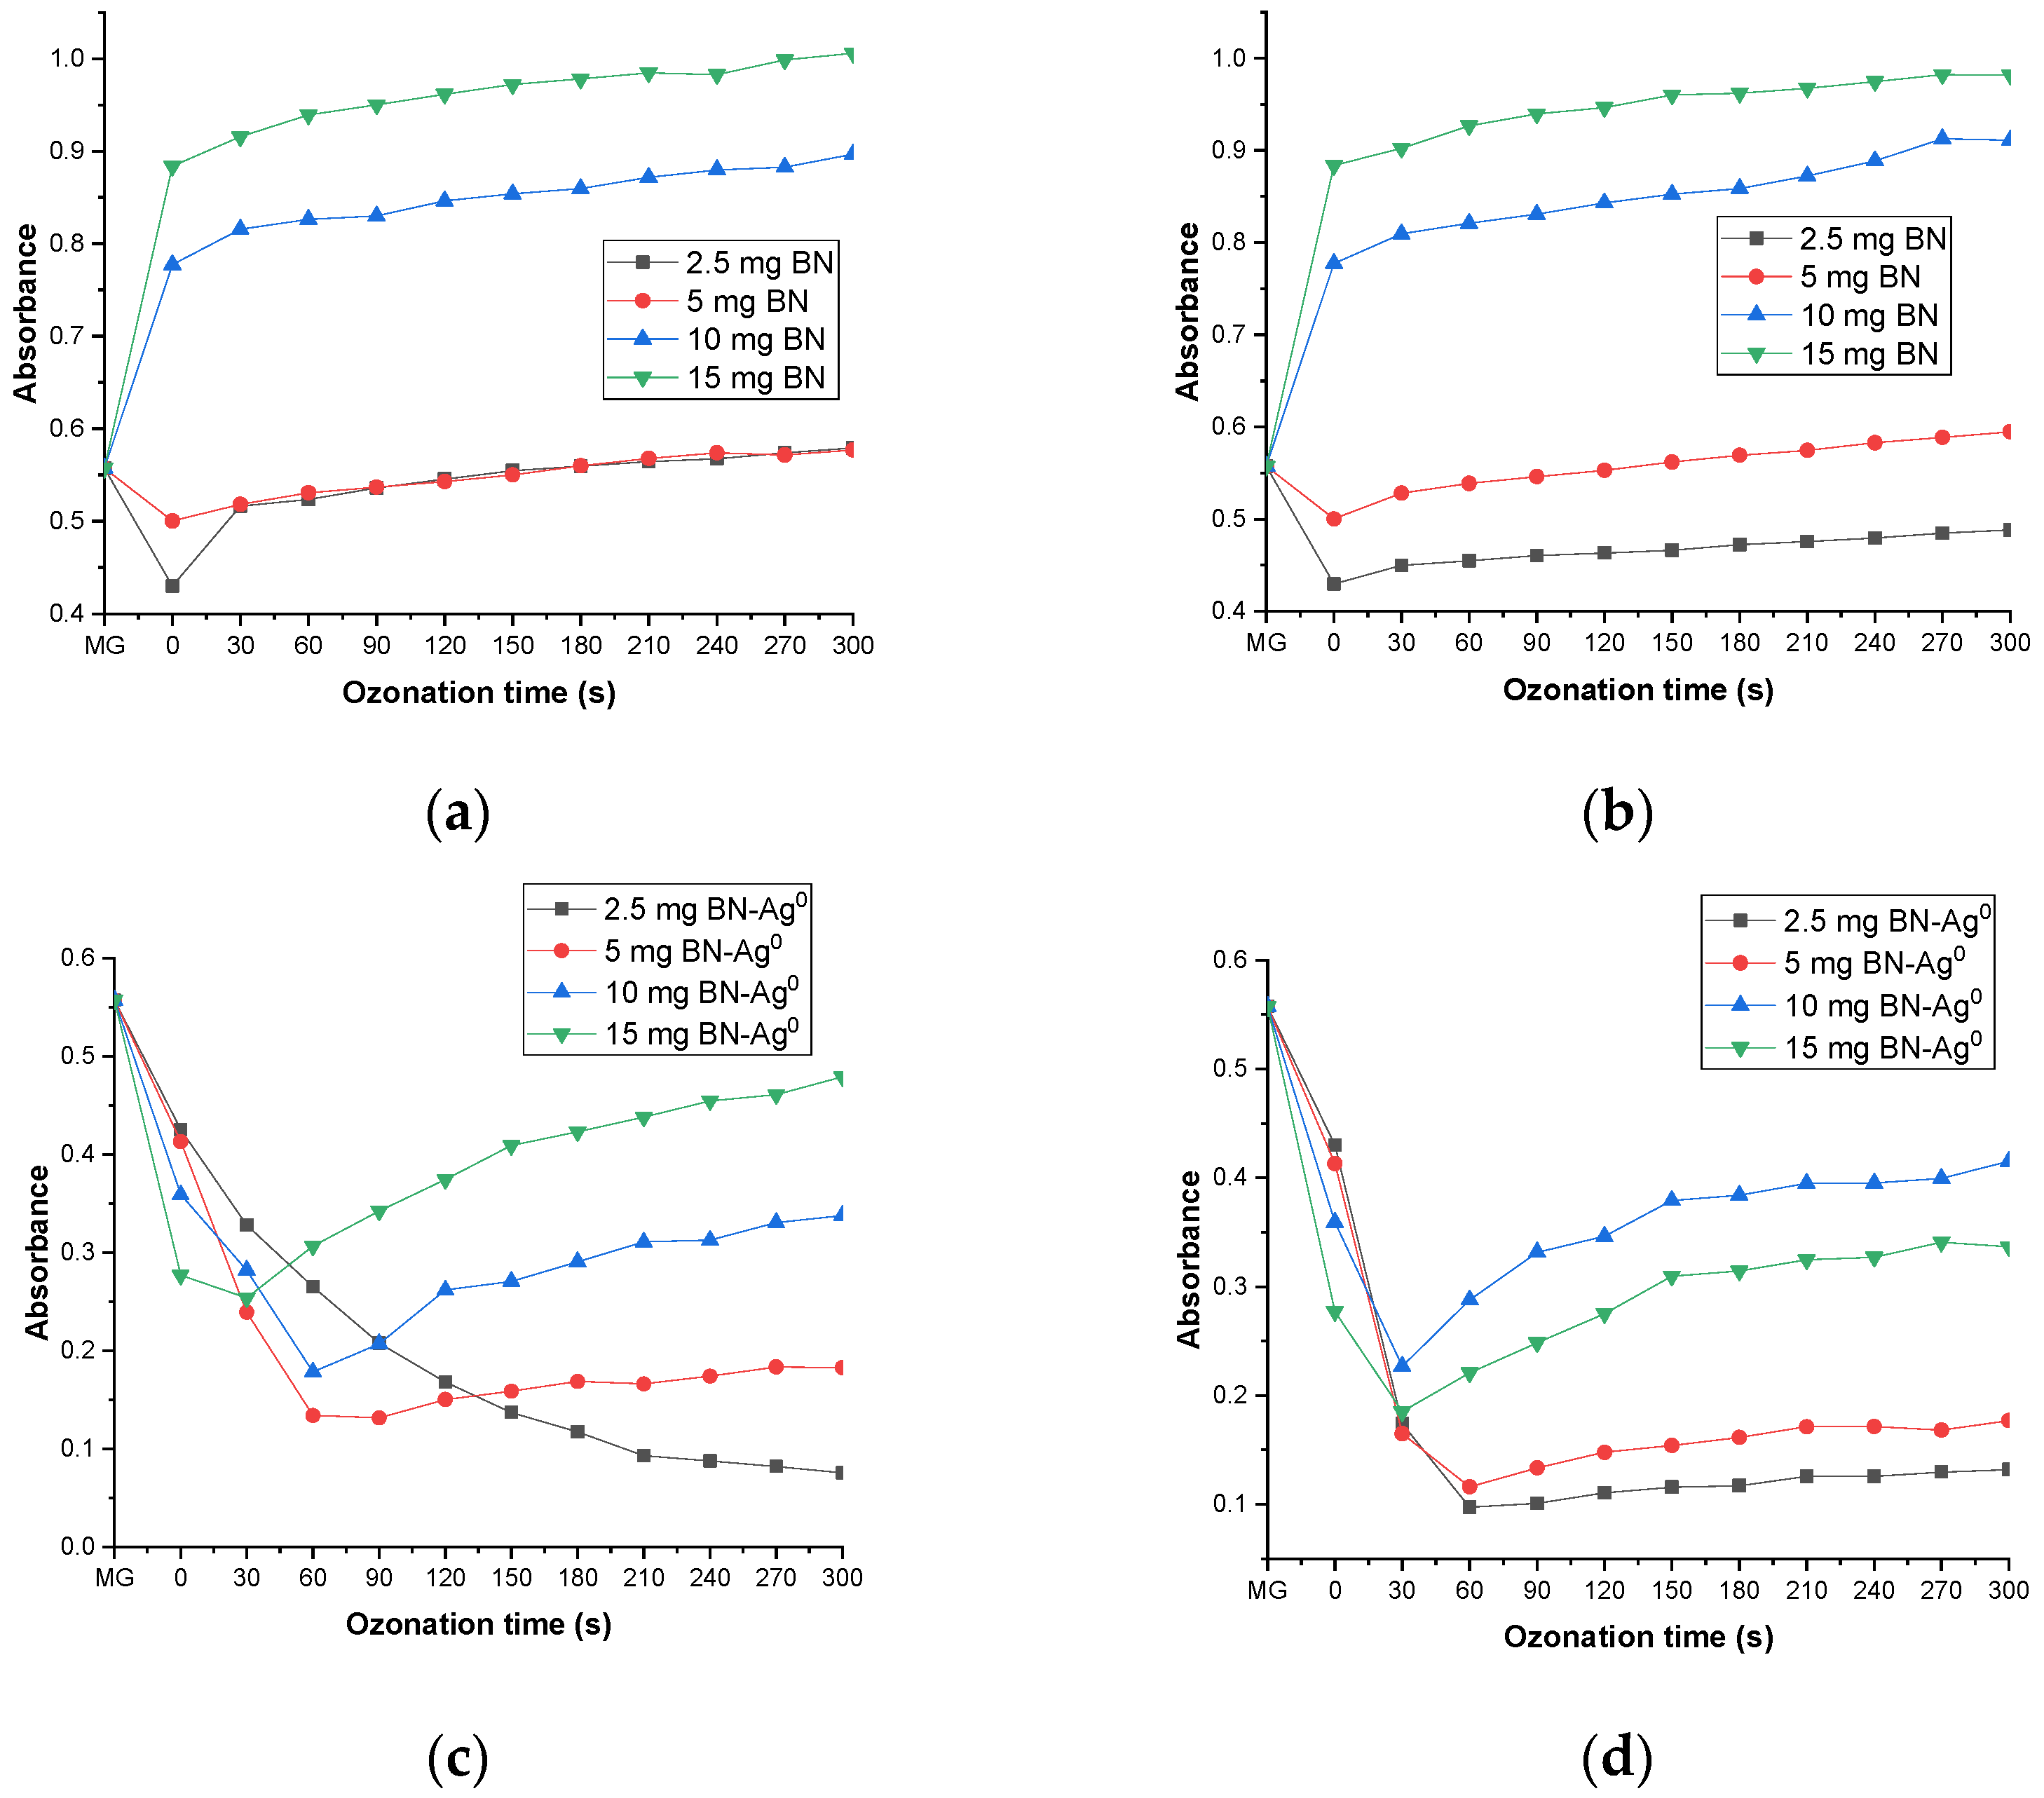
2.5.1. The Effect of Catalyst and Ozone Dose
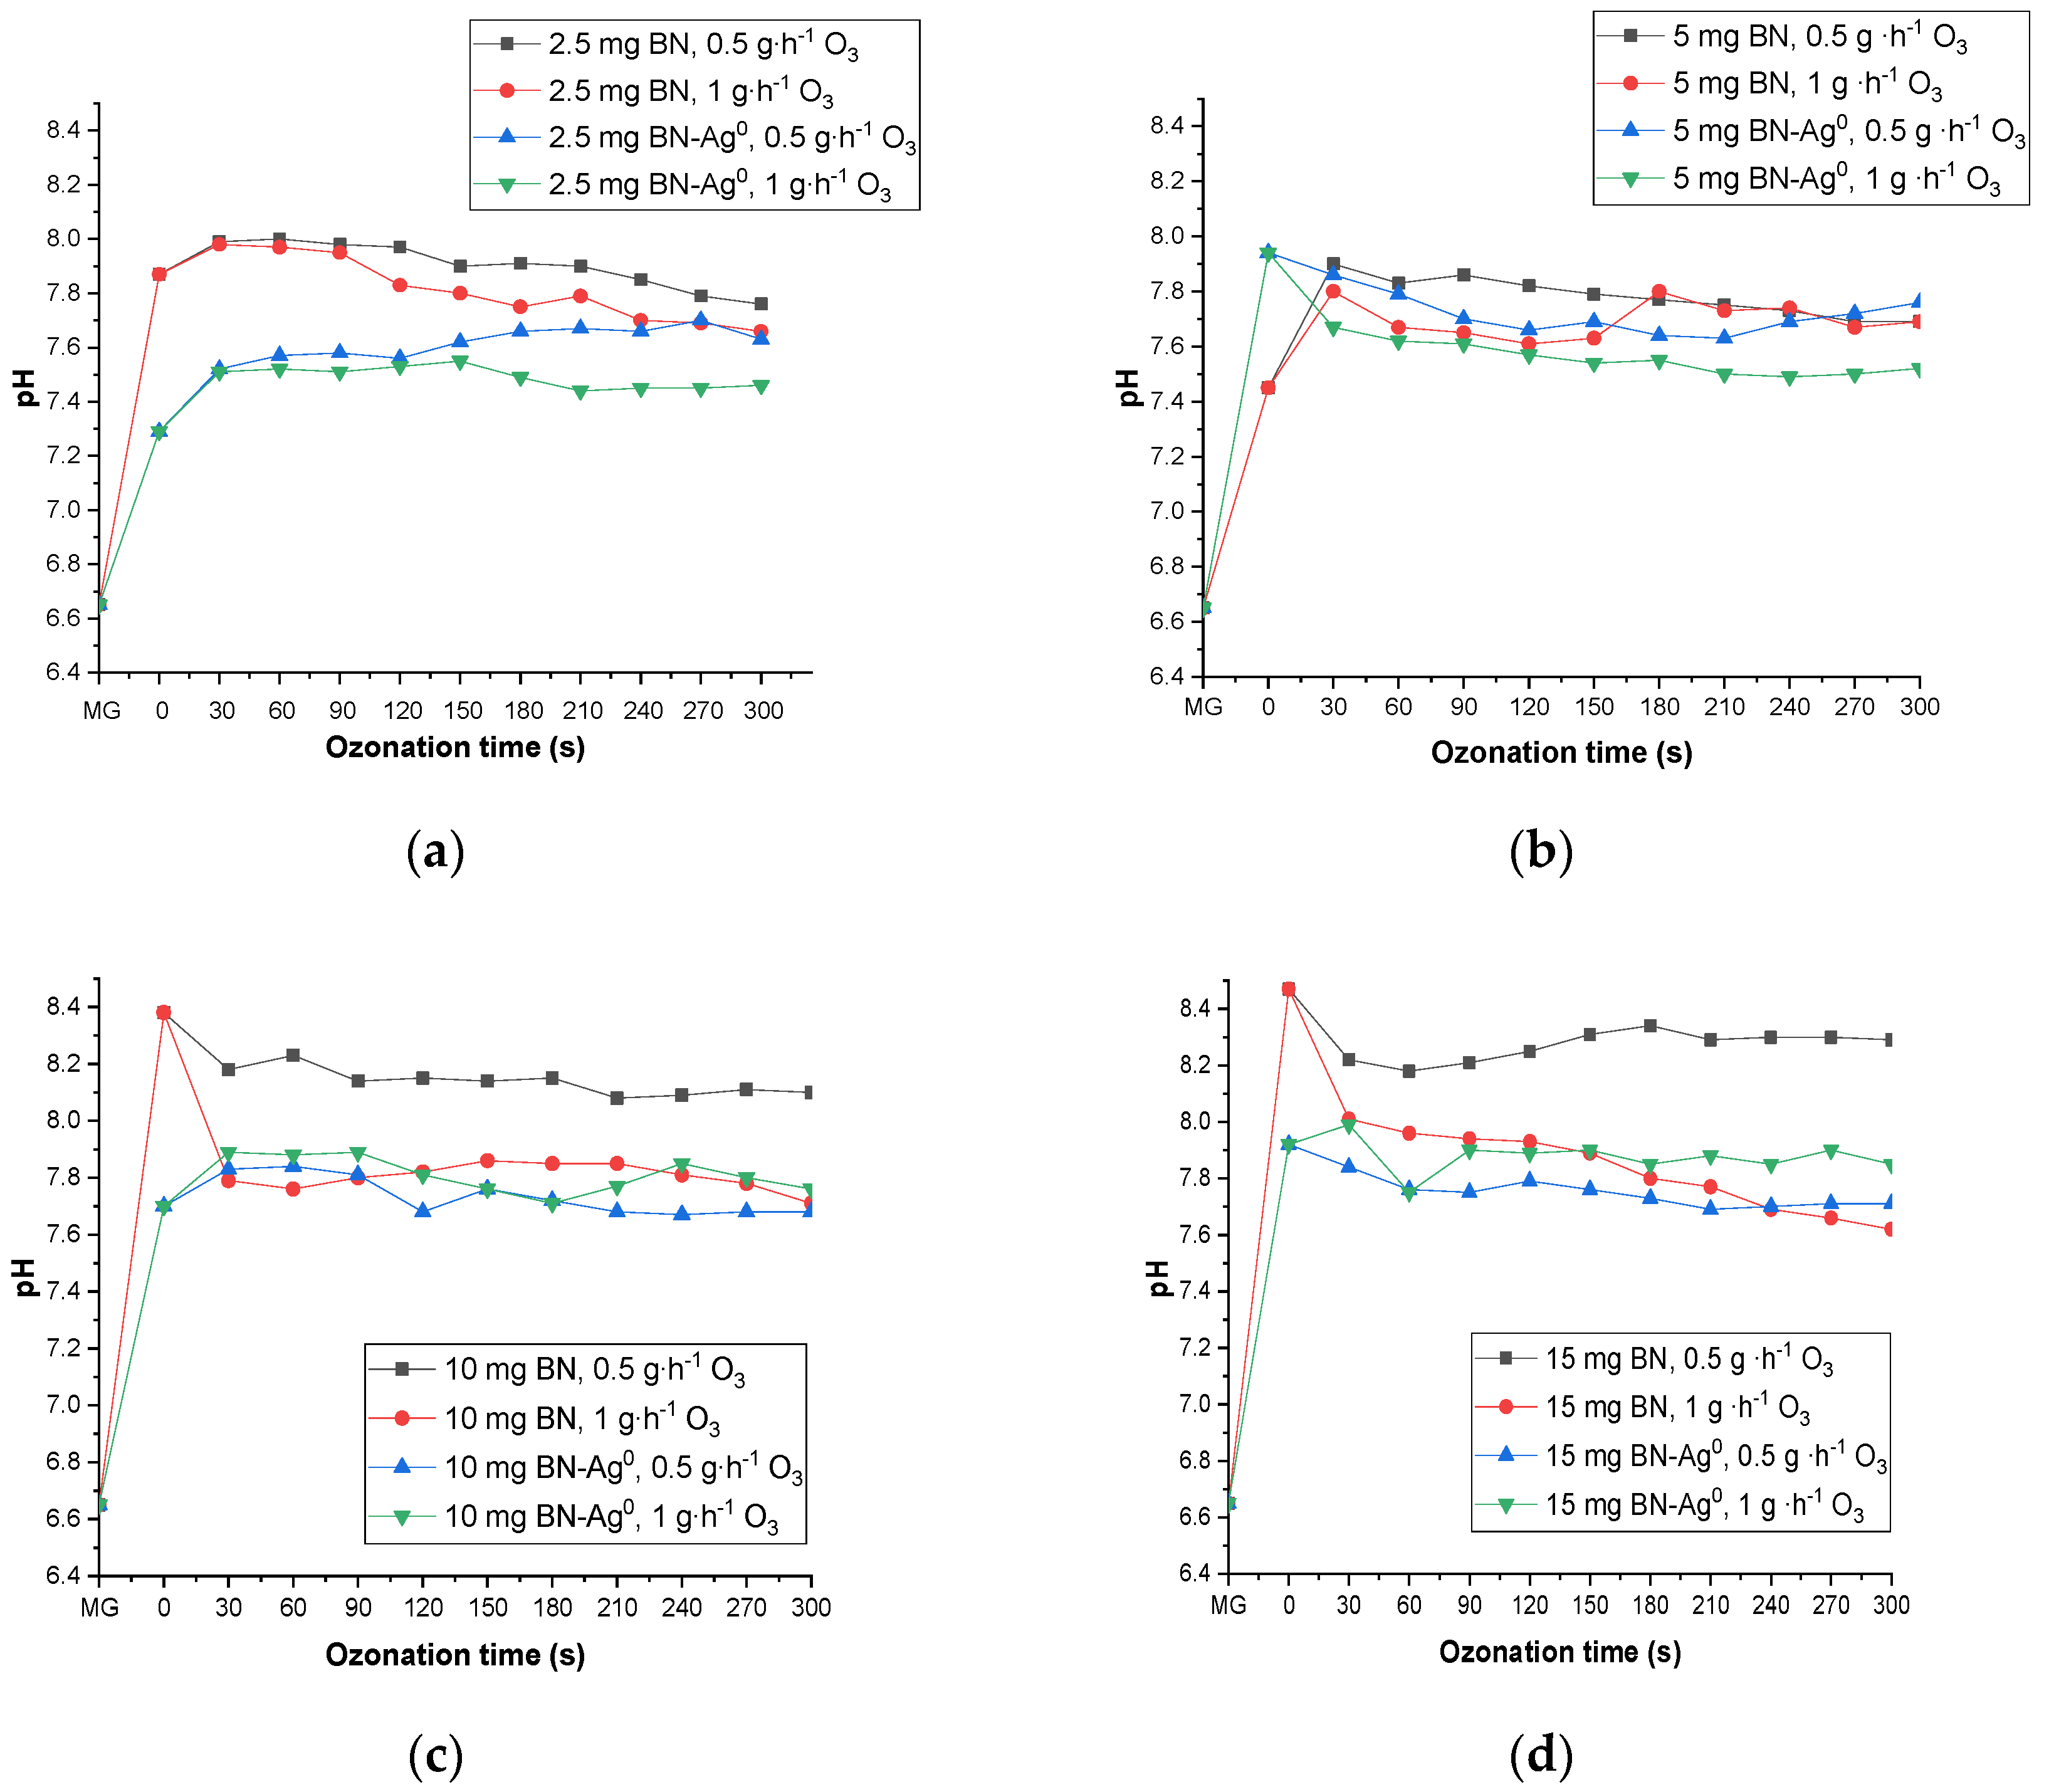
2.5.2. The Effect of pH during Catalytic Ozonation
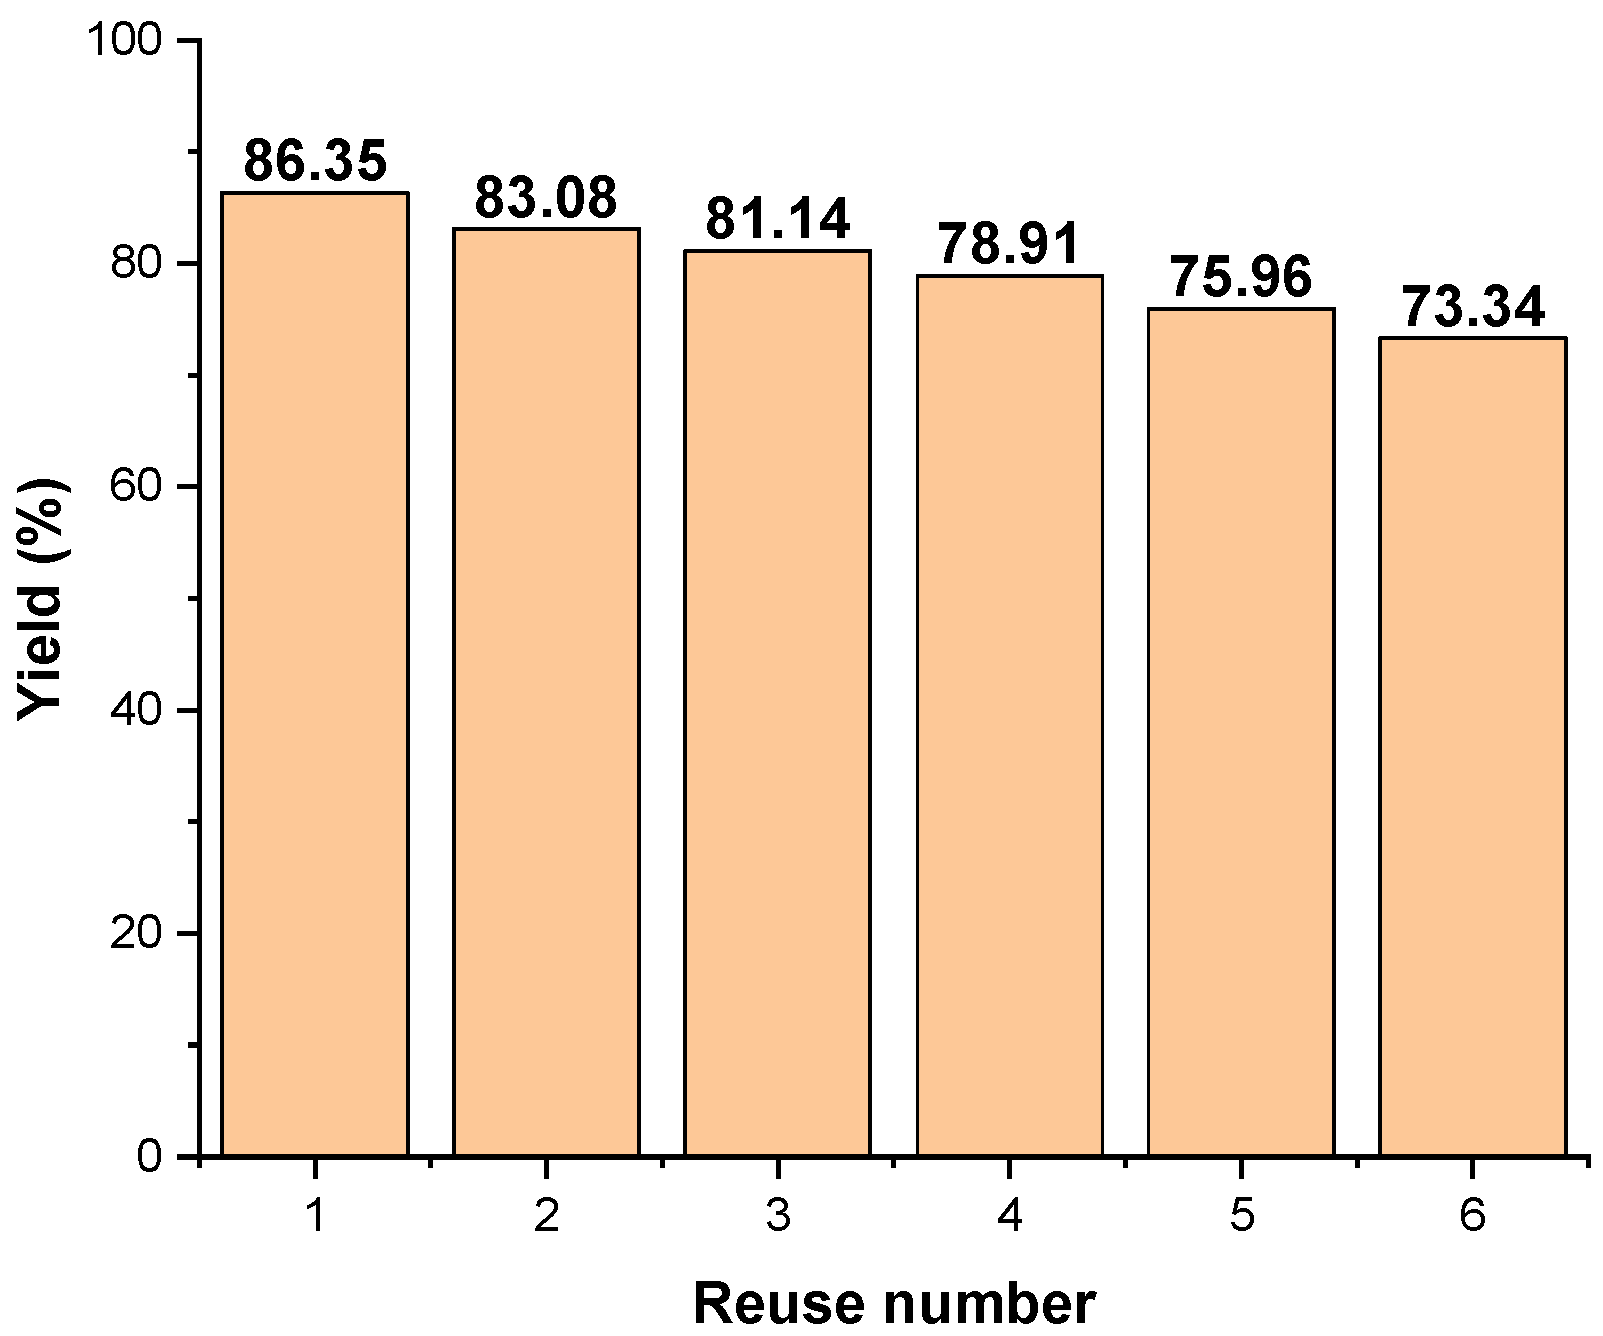
2.5.3. Catalyst Recyclability
3. Discussion Regarding the Damage of ISO SS Bacteria Cell
4. Materials and Methods
4.1. Materials
4.2. Inoculation of the Bacteria
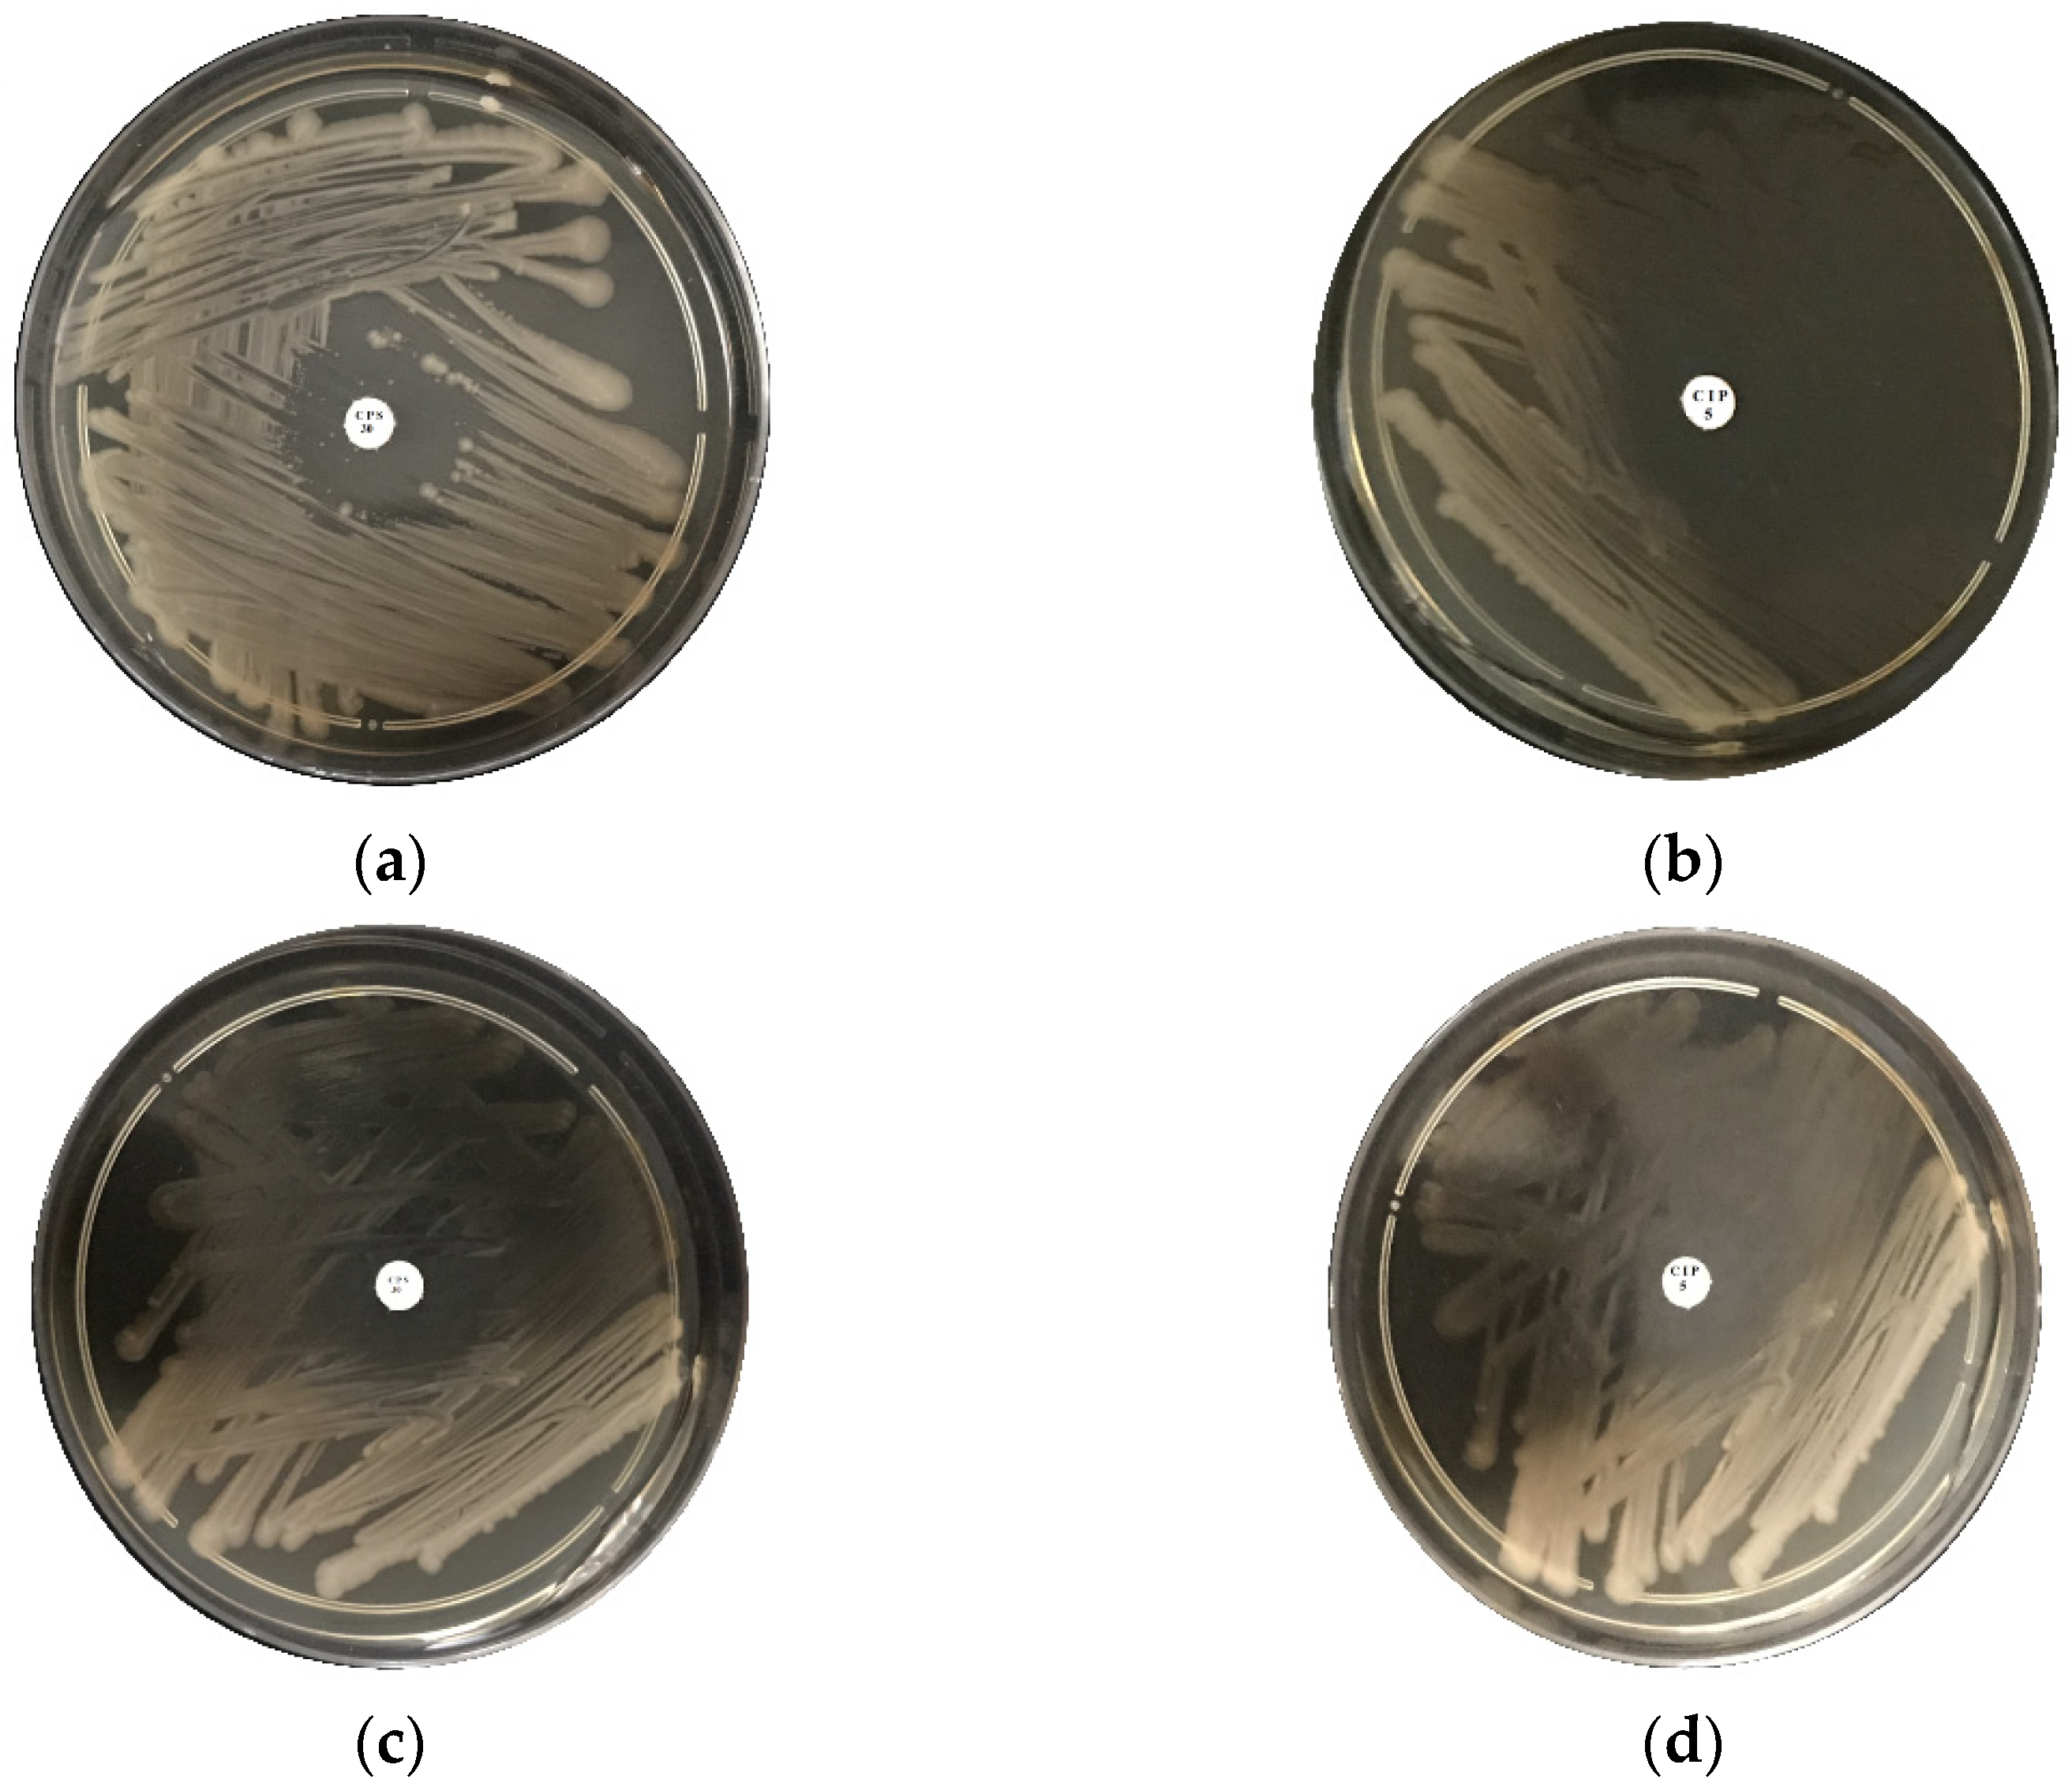
4.3. Antimicrobial Behavior of Ceftaroline Fosamil CPS 30, Ciprofloxacin CIP 5 and BN-Ag0 against ISO SS and E. coli
4.4. Catalytic Ozonation Working Protocol
4.5. Devices
5. Conclusions
Author Contributions
Funding
Institutional Review Board Statement
Data Availability Statement
Acknowledgments
Conflicts of Interest
Sample Availability
References
- Thavasi, V.; Singh, G.; Ramakrishna, S. Electrospun nanofibers in energy and environmental applications. Energy Environ. Sci. 2008, 1, 205–221. [Google Scholar]
- Bouazizi, N.; Vieillard, J.; Thebault, P.; Desriac, F.; Clamens, T.; Bargougui, R.; Couvrat, N.; Thoumire, O.; Brun, N.; Ladam, G. Silver nanoparticle embedded copper oxide as an efficient core–shell for the catalytic reduction of 4-nitrophenol and antibacterial activity improvement. Dalton Trans. 2018, 47, 9143–9155. [Google Scholar]
- Kim, S.; Won, S.W.; Cho, C.-W.; Yun, Y.-S. Valorization of Escherichia coli waste biomass as a biosorbent for removing reactive dyes from aqueous solutions. Desalination Water Treat. 2016, 57, 20084–20090. [Google Scholar] [CrossRef]
- Azzouz, A.; Mirila, D.C.; Nistor, D.I.; Boudissa, F.; Roy, R. Catalytic Oxidation: Types, Catalysts and Applications, Chapter: Advances in the Oxidative Degradation of Organic Pollutants: Prospects for Catalyzed Oxidation Processes Targeting Total Mineralization; Nova Science: New York, NY, USA, 2018. [Google Scholar]
- Munter, R. Advanced oxidation processes–current status and prospects. Proc. Est. Acad. Sci. Chem 2001, 50, 59–80. [Google Scholar]
- Shahidi, D.; Moheb, A.; Abbas, R.; Larouk, S.; Roy, R.; Azzouz, A. Total mineralization of sulfamethoxazole and aromatic pollutants through Fe2+-montmorillonite catalyzed ozonation. J. Hazard. Mater. 2015, 298, 338–350. [Google Scholar]
- Rai, M.; Yadav, A.; Gade, A. Silver nanoparticles as a new generation of antimicrobials. Biotechnol. Adv. 2009, 27, 76–83. [Google Scholar]
- Morones, J.R.; Elechiguerra, J.L.; Camacho, A.; Holt, K.; Kouri, J.B.; Ramírez, J.T.; Yacaman, M.J. The bactericidal effect of silver nanoparticles. Nanotechnology 2005, 16, 2346. [Google Scholar]
- Chopra, I. The increasing use of silver-based products as antimicrobial agents: A useful development or a cause for concern? J. Antimicrob. Chemother. 2007, 59, 587–590. [Google Scholar]
- Rolim, W.R.; Lamilla, C.; Pieretti, J.C.; Díaz, M.; Tortella, G.R.; Cristina Diez, M.; Barrientos, L.; Seabra, A.B.; Rubilar, O. Comparison of antibacterial and antibiofilm activities of biologically synthesized silver nanoparticles against several bacterial strains of medical interest. Energy Ecol. Environ. 2019, 4, 143–159. [Google Scholar] [CrossRef]
- Flores-López, L.Z.; Espinoza-Gómez, H.; Somanathan, R. Silver nanoparticles: Electron transfer, reactive oxygen species, oxidative stress, beneficial and toxicological effects. Mini review. J. Appl. Toxicol. 2019, 39, 16–26. [Google Scholar]
- Verma, P.; Maheshwari, S.K. Applications of Silver nanoparticles in diverse sectors. Int. J. Nano Dimens. 2019, 10, 18–36. [Google Scholar]
- Durán, N.; Durán, M.; De Jesus, M.B.; Seabra, A.B.; Fávaro, W.J.; Nakazato, G. Silver nanoparticles: A new view on mechanistic aspects on antimicrobial activity. Nanomed. Nanotechnol. Biol. Med. 2016, 12, 789–799. [Google Scholar]
- Errais, E. Réactivité de Surface d’Argiles Naturelles: Etude de l’Adsorption de Colorants Anioniques. Ph.D. Thesis, University of Strasbourg, Strasbourg, France, 2011. [Google Scholar]
- Ali, I.; Gupta, V. Advances in water treatment by adsorption technology. Nat. Protoc. 2006, 1, 2661–2667. [Google Scholar]
- Gupta, V.K.; Carrott, P.; Ribeiro Carrott, M.; Suhas. Low-cost adsorbents: Growing approach to wastewater treatment—A review. Crit. Rev. Environ. Sci. Technol. 2009, 39, 783–842. [Google Scholar]
- Luo, Y.; Guo, W.; Ngo, H.H.; Nghiem, L.D.; Hai, F.I.; Zhang, J.; Liang, S.; Wang, X.C. A review on the occurrence of micropollutants in the aquatic environment and their fate and removal during wastewater treatment. Sci. Total Environ. 2014, 473, 619–641. [Google Scholar]
- Mirila, D.C.; Pîrvan, M.-Ș.; Platon, N.; Georgescu, A.-M.; Zichil, V.; Nistor, I.D. Total Mineralization of Malachite Green Dye by Advanced Oxidation Processes. Acta Chem. Iasi 2018, 26, 263–280. [Google Scholar]
- Hameed, B.; El-Khaiary, M. Batch removal of malachite green from aqueous solutions by adsorption on oil palm trunk fibre: Equilibrium isotherms and kinetic studies. J. Hazard. Mater. 2008, 154, 237–244. [Google Scholar]
- Papinutti, L.; Mouso, N.; Forchiassin, F. Removal and degradation of the fungicide dye malachite green from aqueous solution using the system wheat bran–Fomes sclerodermeus. Enzym. Microb. Technol. 2006, 39, 848–853. [Google Scholar]
- Culp, S.J.; Beland, F.A. Malachite green: A toxicological review. J. Am. Coll. Toxicol. 1996, 15, 219–238. [Google Scholar]
- Mirilă, D.-C.; Boudissa, F.; Beltrao-Nuñes, A.-P.; Platon, N.; Didi, M.-A.; Nistor, I.-D.; Roy, R.; Azzouz, A. Organic Dye Ozonation Catalyzed by Chemically Modified Montmorillonite K10– Role of Surface Basicity and Hydrophilic Character. Ozone Sci. Eng. 2020, 42, 517–530. [Google Scholar] [CrossRef]
- Mühling, M.; Bradford, A.; Readman, J.W.; Somerfield, P.J.; Handy, R.D. An investigation into the effects of silver nanoparticles on antibiotic resistance of naturally occurring bacteria in an estuarine sediment. Mar. Environ. Res. 2009, 68, 278–283. [Google Scholar]
- Georgescu, A.-M.; Nardou, F.; Zichil, V.; Nistor, I.D. Adsorption of lead (II) ions from aqueous solutions onto Cr-pillared clays. Appl. Clay Sci. 2018, 152, 44–50. [Google Scholar]
- Rouquerol, J.; Rouquerol, F.; Llewellyn, P.; Maurin, G.; Sing, K.S. Adsorption by Powders and Porous Solids: Principles, Methodology and Applications, 2nd ed.; Academic Press: New York, NY, USA, 2013. [Google Scholar]
- Nistor, D.; Miron, N.D.; Surpateanu, G.G.; Azzouz, A. Etude par desorption thermique programmee des proprietes des argiles modifiees. J. Therm. Anal. Calorim. 2004, 76, 913–920. [Google Scholar] [CrossRef]
- Rieppo, L.; Saarakkala, S.; Jurvelin, J.; Rieppo, J. Prediction of compressive stiffness of articular cartilage using Fourier transform infrared spectroscopy. J. Biomech. 2013, 46, 1269–1275. [Google Scholar]
- Raducanu, D.; Stefanescu, I.; Irina, I.; Zirnea, S.; Nicuta, D.; Rati, V.; Lazar, I. Ecotoxicological assessment of anaerobic stabilized sewage sludge subjected to sanitization treatments. Environ. Eng. Manag. J. 2014, 13, 1693–1706. [Google Scholar]
- Movasaghi, Z.; Rehman, S.; ur Rehman, D.I. Fourier transform infrared (FTIR) spectroscopy of biological tissues. Appl. Spectrosc. Rev. 2008, 43, 134–179. [Google Scholar]
- Fung, M.F.K.; Senterman, M.K.; Mikhael, N.Z.; Lacelle, S.; Wong, P.T. Pressure-tuning fourier transform infrared spectroscopic study of carcinogenesis in human endometrium. Biospectroscopy 1996, 2, 155–165. [Google Scholar]
- Dovbeshko, G.I.; Gridina, N.Y. IR Spectroscopic Studies of Tumor DNA. In Spectroscopy of Biological Molecules: Modern Trends; Carmona, P., Navarro, R., Hernanz, A., Eds.; Springer: Dordrecht, The Netherlands, 1997. [Google Scholar] [CrossRef]
- Davis, R.; Mauer, L.J. Fourier transform infrared (FT-IR) spectroscopy: A rapid tool for detection and analysis of foodborne pathogenic bacteria. Curr. Res. Technol. Educ. Top. Appl. Microbiol. Microb. Biotechnol. 2010, 2, 1582–1594. [Google Scholar]
- San-Blas, E.; Cubillán, N.; Guerra, M.; Portillo, E.; Esteves, I. Characterization of Xenorhabdus and Photorhabdus bacteria by Fourier transform mid-infrared spectroscopy with attenuated total reflection (FT-IR/ATR). Spectrochim. Acta Part A Mol. Biomol. Spectrosc. 2012, 93, 58–62. [Google Scholar]
- Raducanu, D.M. Ecotoxicological Studies on Anaerobically Stabilized Sewage Sludge; “Vasile Alecsandri” University of Bacău: Bacau, Romania, 2014. [Google Scholar]
- Smidt, E.; Böhm, K.; Schwanninger, M. The application of FT-IR spectroscopy in waste management. In Fourier Transforms-New Analytical Approaches and FTIR Strategies; InTech: Rijeka, Croatia, 2011; pp. 405–430. [Google Scholar]
- Larouk, S.; Ouargli, R.; Shahidi, D.; Olhund, L.; Shiao, T.C.; Chergui, N.; Sehili, T.; Roy, R.; Azzouz, A. Catalytic ozonation of Orange-G through highly interactive contributions of hematite and SBA-16–To better understand azo-dye oxidation in nature. Chemosphere 2017, 168, 1648–1657. [Google Scholar]
- Bollela, V.; Sato, D.; Fonseca, B. McFarland nephelometer as a simple method to estimate the sensitivity of the polymerase chain reaction using Mycobacterium tuberculosis as a research tool. Braz. J. Med. Biol. Res. 1999, 32, 1073–1076. [Google Scholar]


| No.crt. | Component | Content (%) |
|---|---|---|
| 1 | Montmorillonite | 62 |
| 2 | Cristobalite | 35 |
| 3 | Quartz | 3 |
| 4 | Illite | - |
| 5 | Feldspars | - |
| Sample Name | Specific Surface Area (m2/g) | Total Pore Volume (cm3/g) | Average Pore Diameter (nm) | Total Surface Acidity × 103 (Moles of Desorbed NH3/g Clay) |
|---|---|---|---|---|
| BN | 25.70 | 0.0316 | 6.356 | 0.50 |
| BN-Ag0 | 24.19 | 0.0473 | 9.332 | 0.65 |
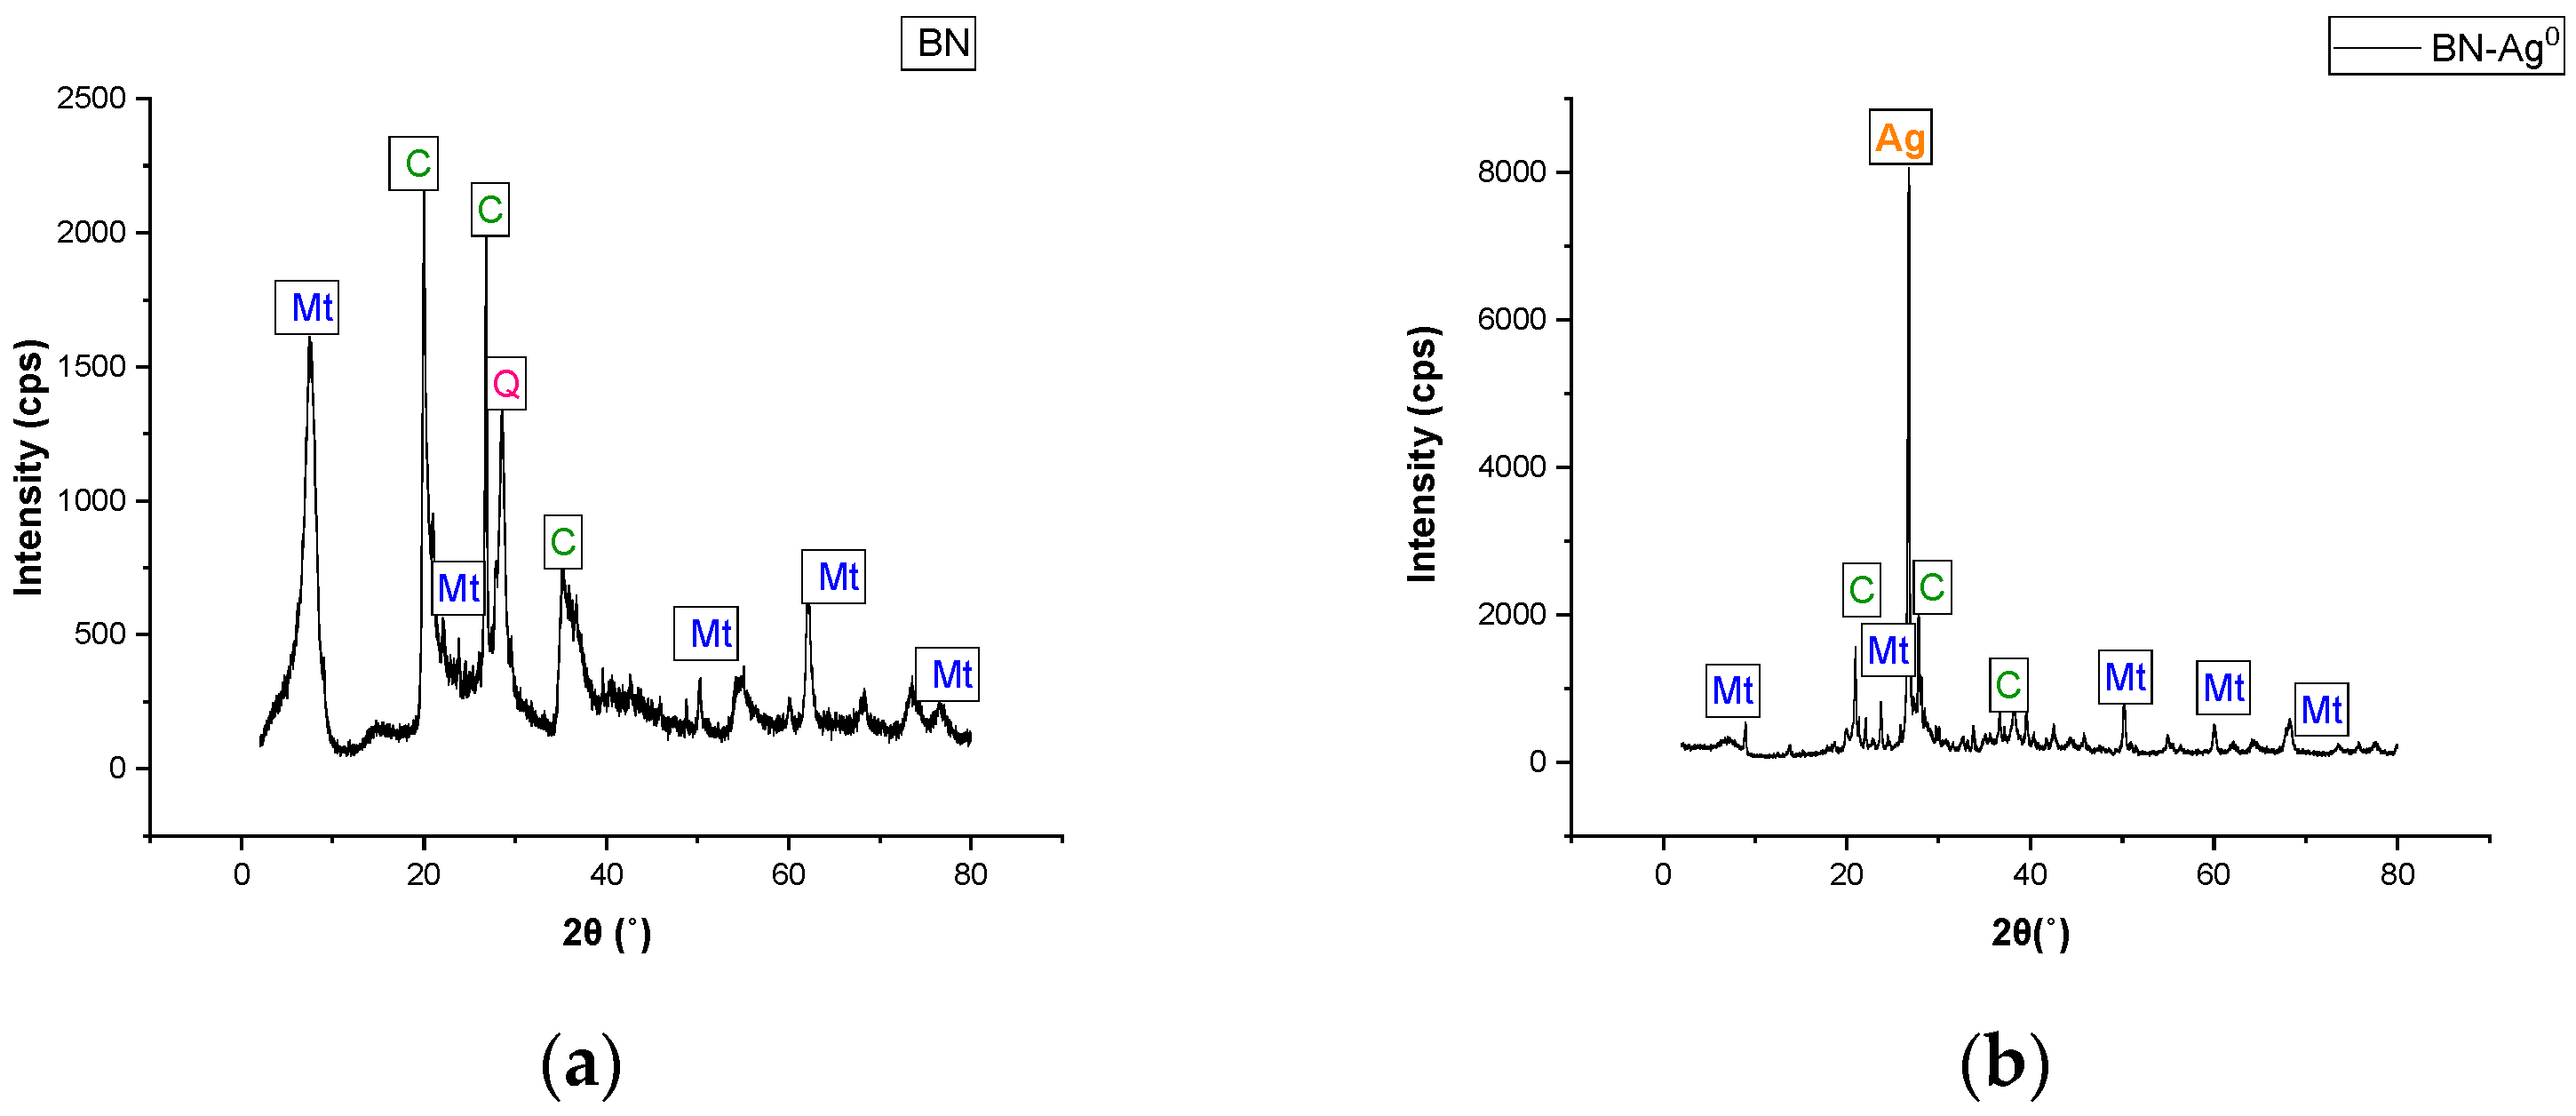
| No.crt. | Phase Name | Formula | Content (%) |
|---|---|---|---|
| 1 | Montmorillonite | Ca0.06Na0.21K0.27Al1.64 | 61 (13) |
| 2 | Talc | Mg3(OH)2Si4O10 | 11 (3) |
| 3 | Silver | Ag | 0.47 (19) |
| 4 | Quartz | SiO2 | 18 (4) |
| 5 | Muscovite | KAl2(AlSi3O10)(OH)2 | 9 (3) |
| Experimental Sample | Sample Code Isolated | Gram Staining | Oxidase Test | Cultural Features on Nutrition Gel |
|---|---|---|---|---|
| Untreated sludge | ISO SS | G- | OXI- | coccobacillus, small colonies, round edges, glossy appearance, fecaloid smell |
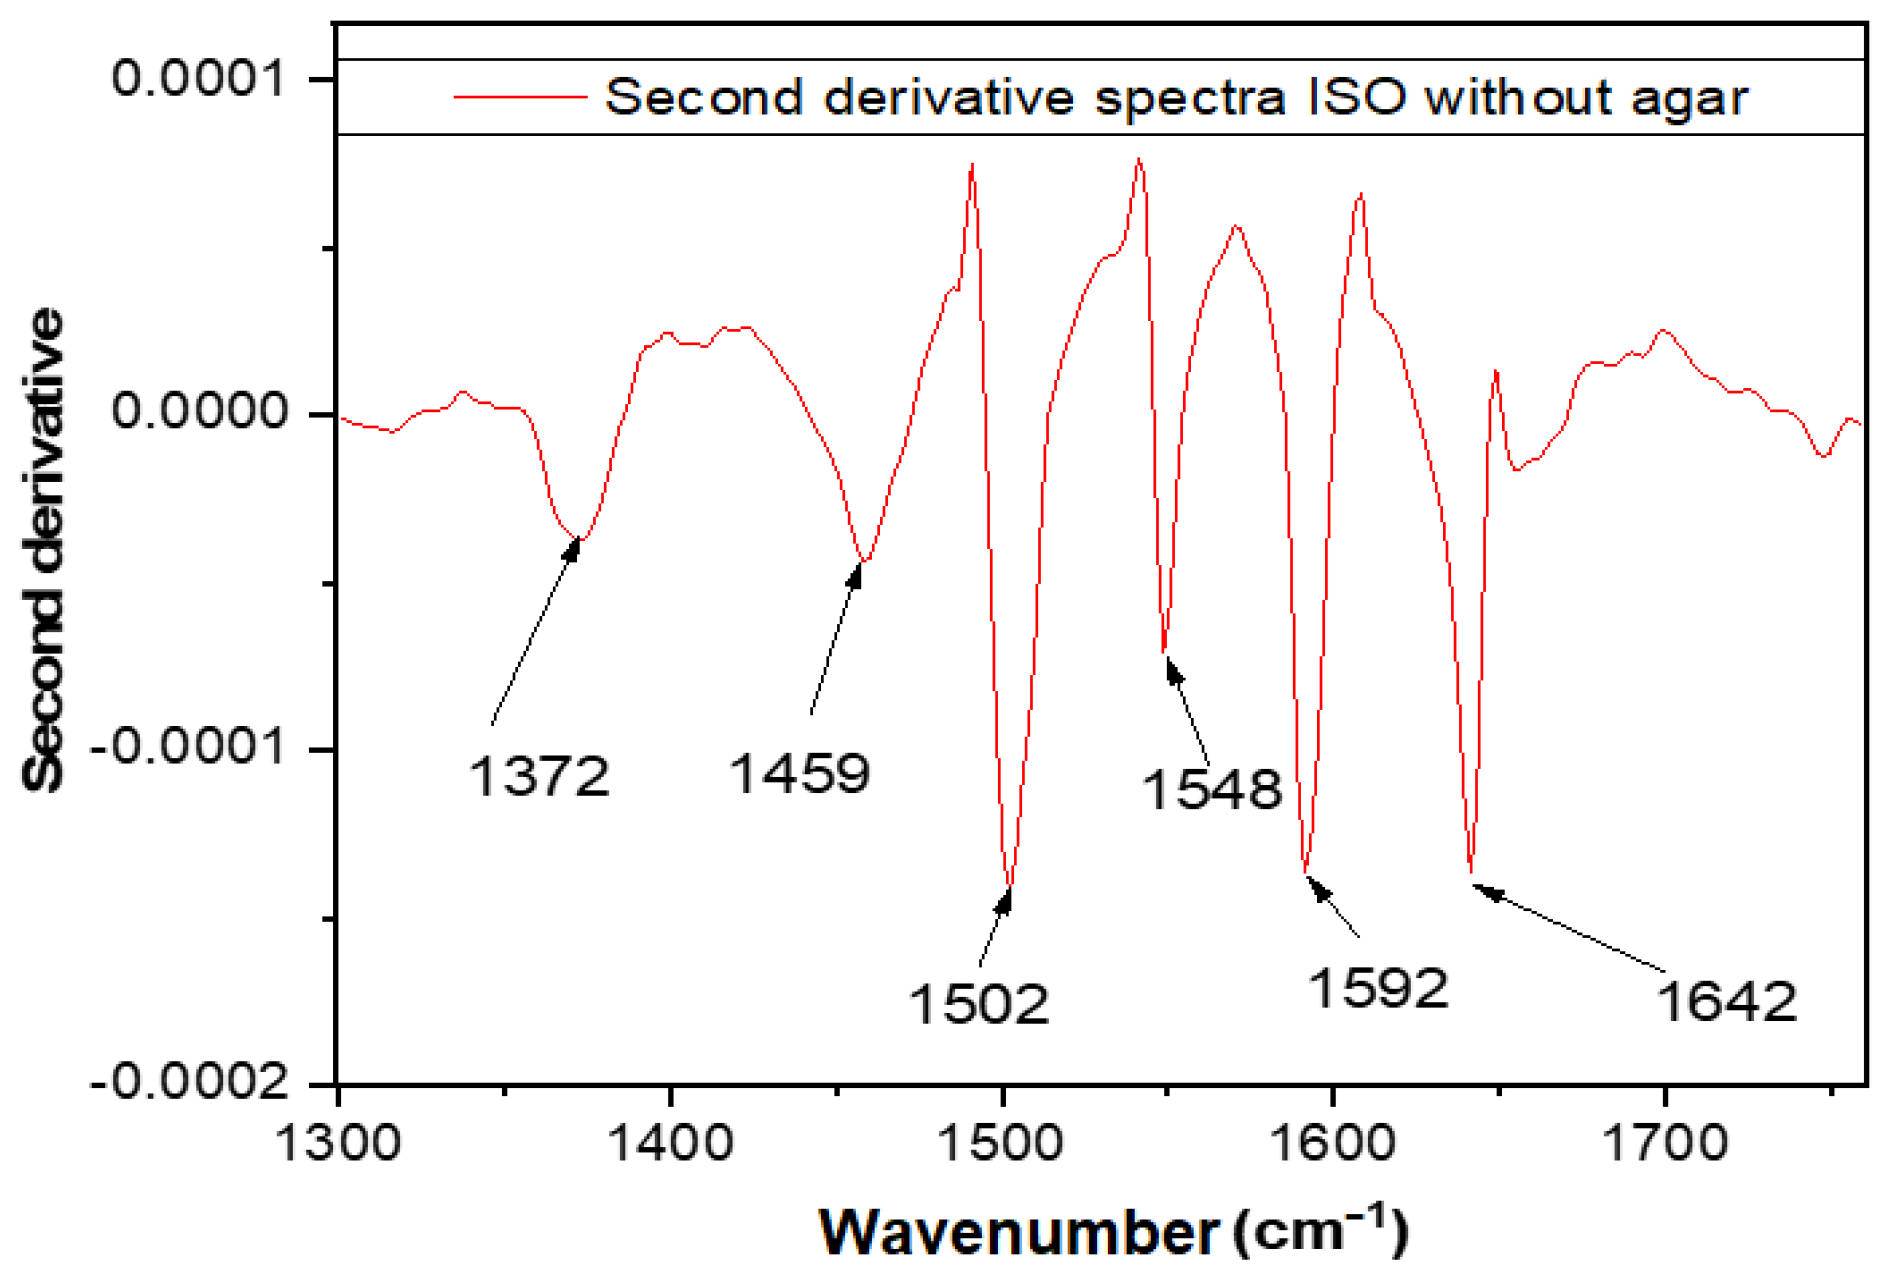
| Wavelength (cm−1). | Assignment | Reference |
|---|---|---|
| 1372 | Deformation of N-H, C-H bonds | [29] |
| 1459 | Asymmetric CH3 bending modes of the methyl groups of proteins | [30] |
| 1502 | Amide II (an N-H bending vibration coupled to C-N stretching) | [29] |
| 1548 | Amide II of proteins | [30] |
| 1592 | C=N, NH2 adenine | [29] |
| 1642 | Amide I band of protein | [29,31] |
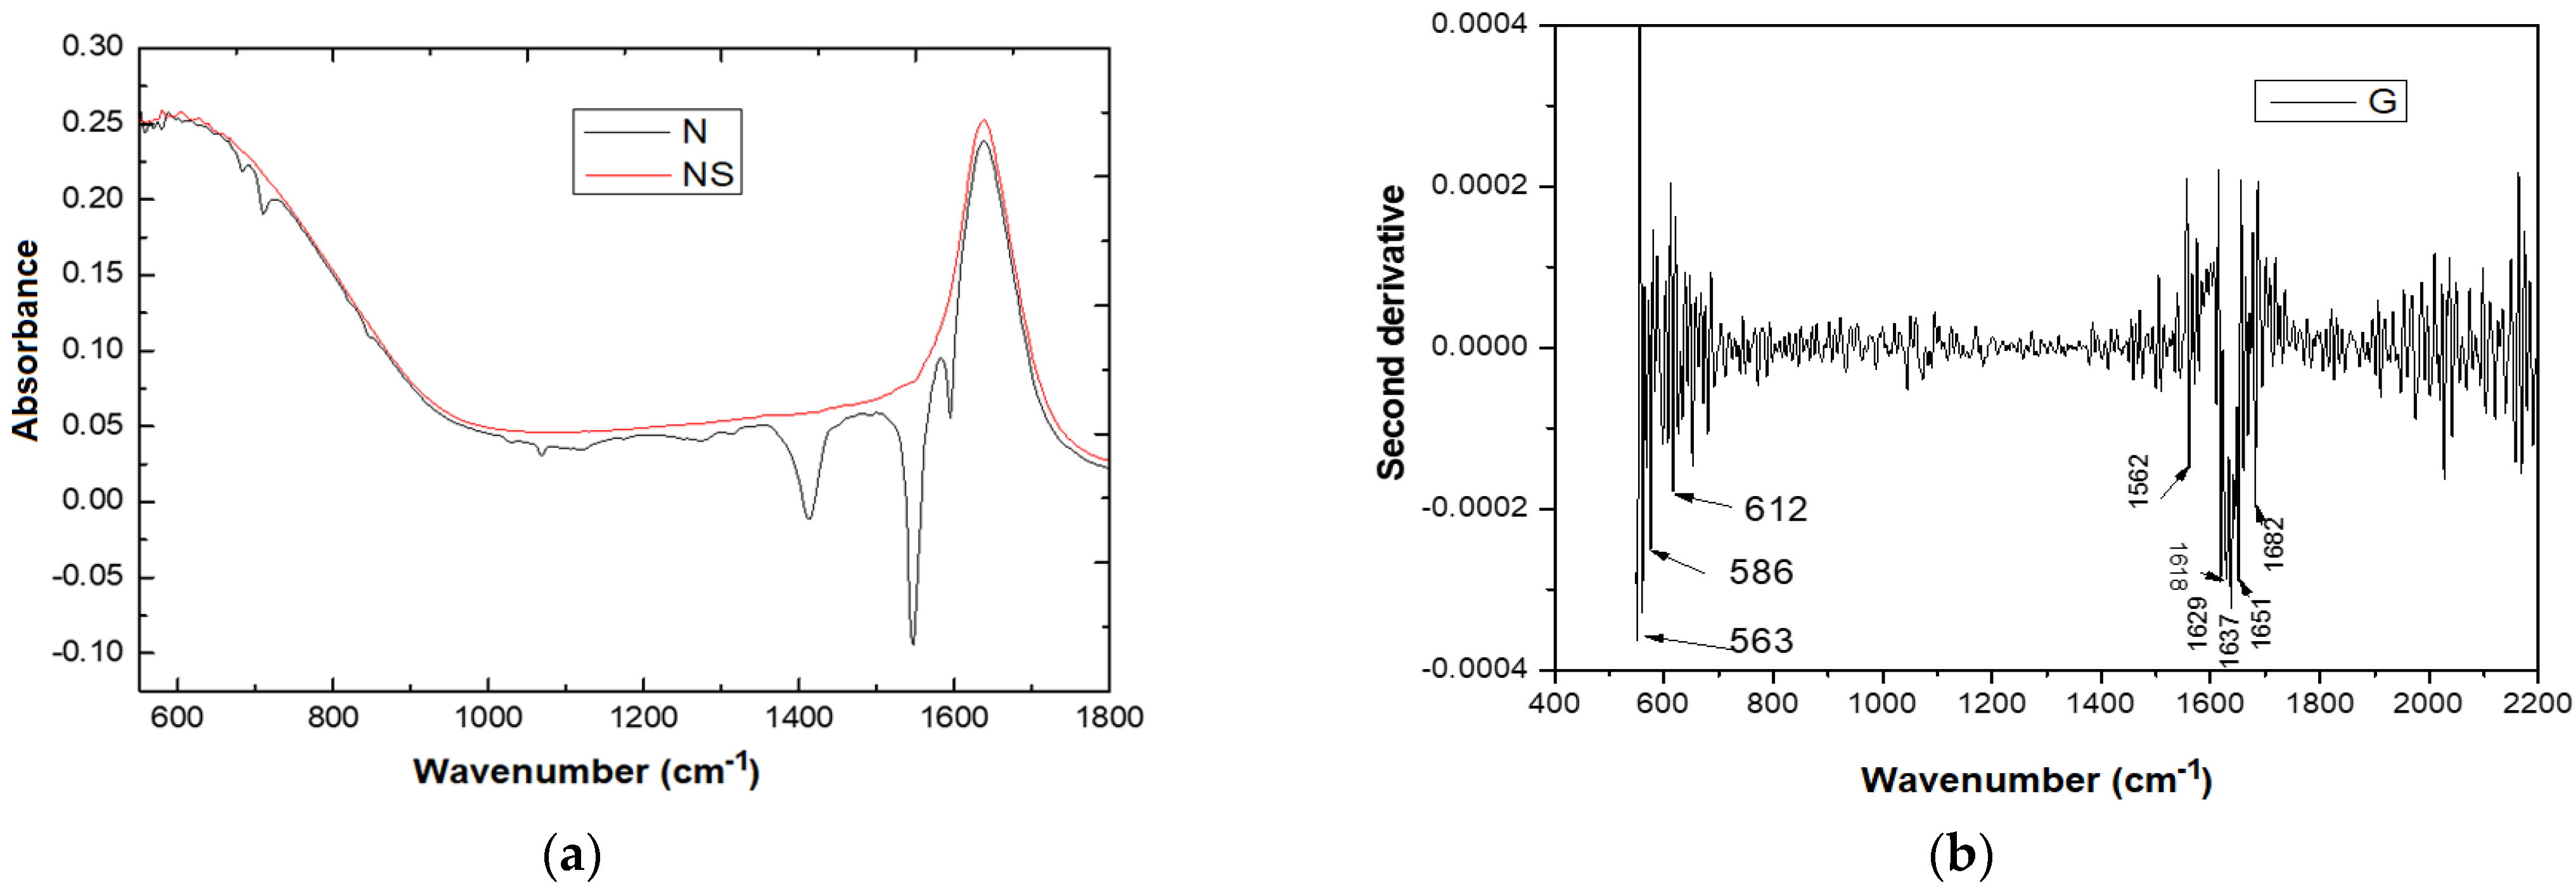
| The Main Absorption Bands FTIR (cm−1) for Different Samples | Assignment | Reference | ||
|---|---|---|---|---|
| G | G | NS | ||
| 563 | 563 | 563 | CH deformation vibrations outside the plane | [35] |
| 572 | 572 | |||
| 612 | ||||
| 640 | ||||
| 670 | ||||
| 702 | ||||
| 1538 | Amide II and secondary amines | [29] | ||
| 1562 | 1562 | 1562 | ||
| 1589 | C=C aromatic skeleton | |||
| 1599 | ||||
| 1681 | 1619 | C-C stretching of the phenyl groups | ||
| 1629 | Amide I, carboxylates, alkenes | [35] | ||
| 1637 | 1635 | |||
| 1661 | 1652 | |||
| 1682 | 1686 | |||
| Sample | BN-Ag0 Amount (mg) | Inhibition Zone (mm) |
|---|---|---|
| ISO SS | 10 | 3 |
| 20 | 3.5 | |
| 30 | 4 | |
| E. coli | 10 | 2.3 |
| 20 | 3.6 | |
| 30 | 4 |
Publisher’s Note: MDPI stays neutral with regard to jurisdictional claims in published maps and institutional affiliations. |
© 2022 by the authors. Licensee MDPI, Basel, Switzerland. This article is an open access article distributed under the terms and conditions of the Creative Commons Attribution (CC BY) license (https://creativecommons.org/licenses/by/4.0/).
Share and Cite
Diana-Carmen, M.; Dumitra, R.; Ana-Maria, G.; Ana-Maria, R.; Andrei, C.V.; Valentin, Z.; Ileana-Denisa, N. Silver Nanoparticles Incorporated on Natural Clay as an Inhibitor against the New ISO SS Bacteria Isolated from Sewage Sludge, Involved in Malachite Green Dye Oxidation. Molecules 2022, 27, 5791. https://doi.org/10.3390/molecules27185791
Diana-Carmen M, Dumitra R, Ana-Maria G, Ana-Maria R, Andrei CV, Valentin Z, Ileana-Denisa N. Silver Nanoparticles Incorporated on Natural Clay as an Inhibitor against the New ISO SS Bacteria Isolated from Sewage Sludge, Involved in Malachite Green Dye Oxidation. Molecules. 2022; 27(18):5791. https://doi.org/10.3390/molecules27185791
Chicago/Turabian StyleDiana-Carmen, Mirila, Raducanu Dumitra, Georgescu Ana-Maria, Rosu Ana-Maria, Ciubotariu Vlad Andrei, Zichil Valentin, and Nistor Ileana-Denisa. 2022. "Silver Nanoparticles Incorporated on Natural Clay as an Inhibitor against the New ISO SS Bacteria Isolated from Sewage Sludge, Involved in Malachite Green Dye Oxidation" Molecules 27, no. 18: 5791. https://doi.org/10.3390/molecules27185791
APA StyleDiana-Carmen, M., Dumitra, R., Ana-Maria, G., Ana-Maria, R., Andrei, C. V., Valentin, Z., & Ileana-Denisa, N. (2022). Silver Nanoparticles Incorporated on Natural Clay as an Inhibitor against the New ISO SS Bacteria Isolated from Sewage Sludge, Involved in Malachite Green Dye Oxidation. Molecules, 27(18), 5791. https://doi.org/10.3390/molecules27185791