

An Experimental and Theoretical Study on Essential Oil of Aethionema sancakense: Characterization, Molecular Properties and RDG Analysis


Abstract
:1. Introduction
2. Materials and Methods
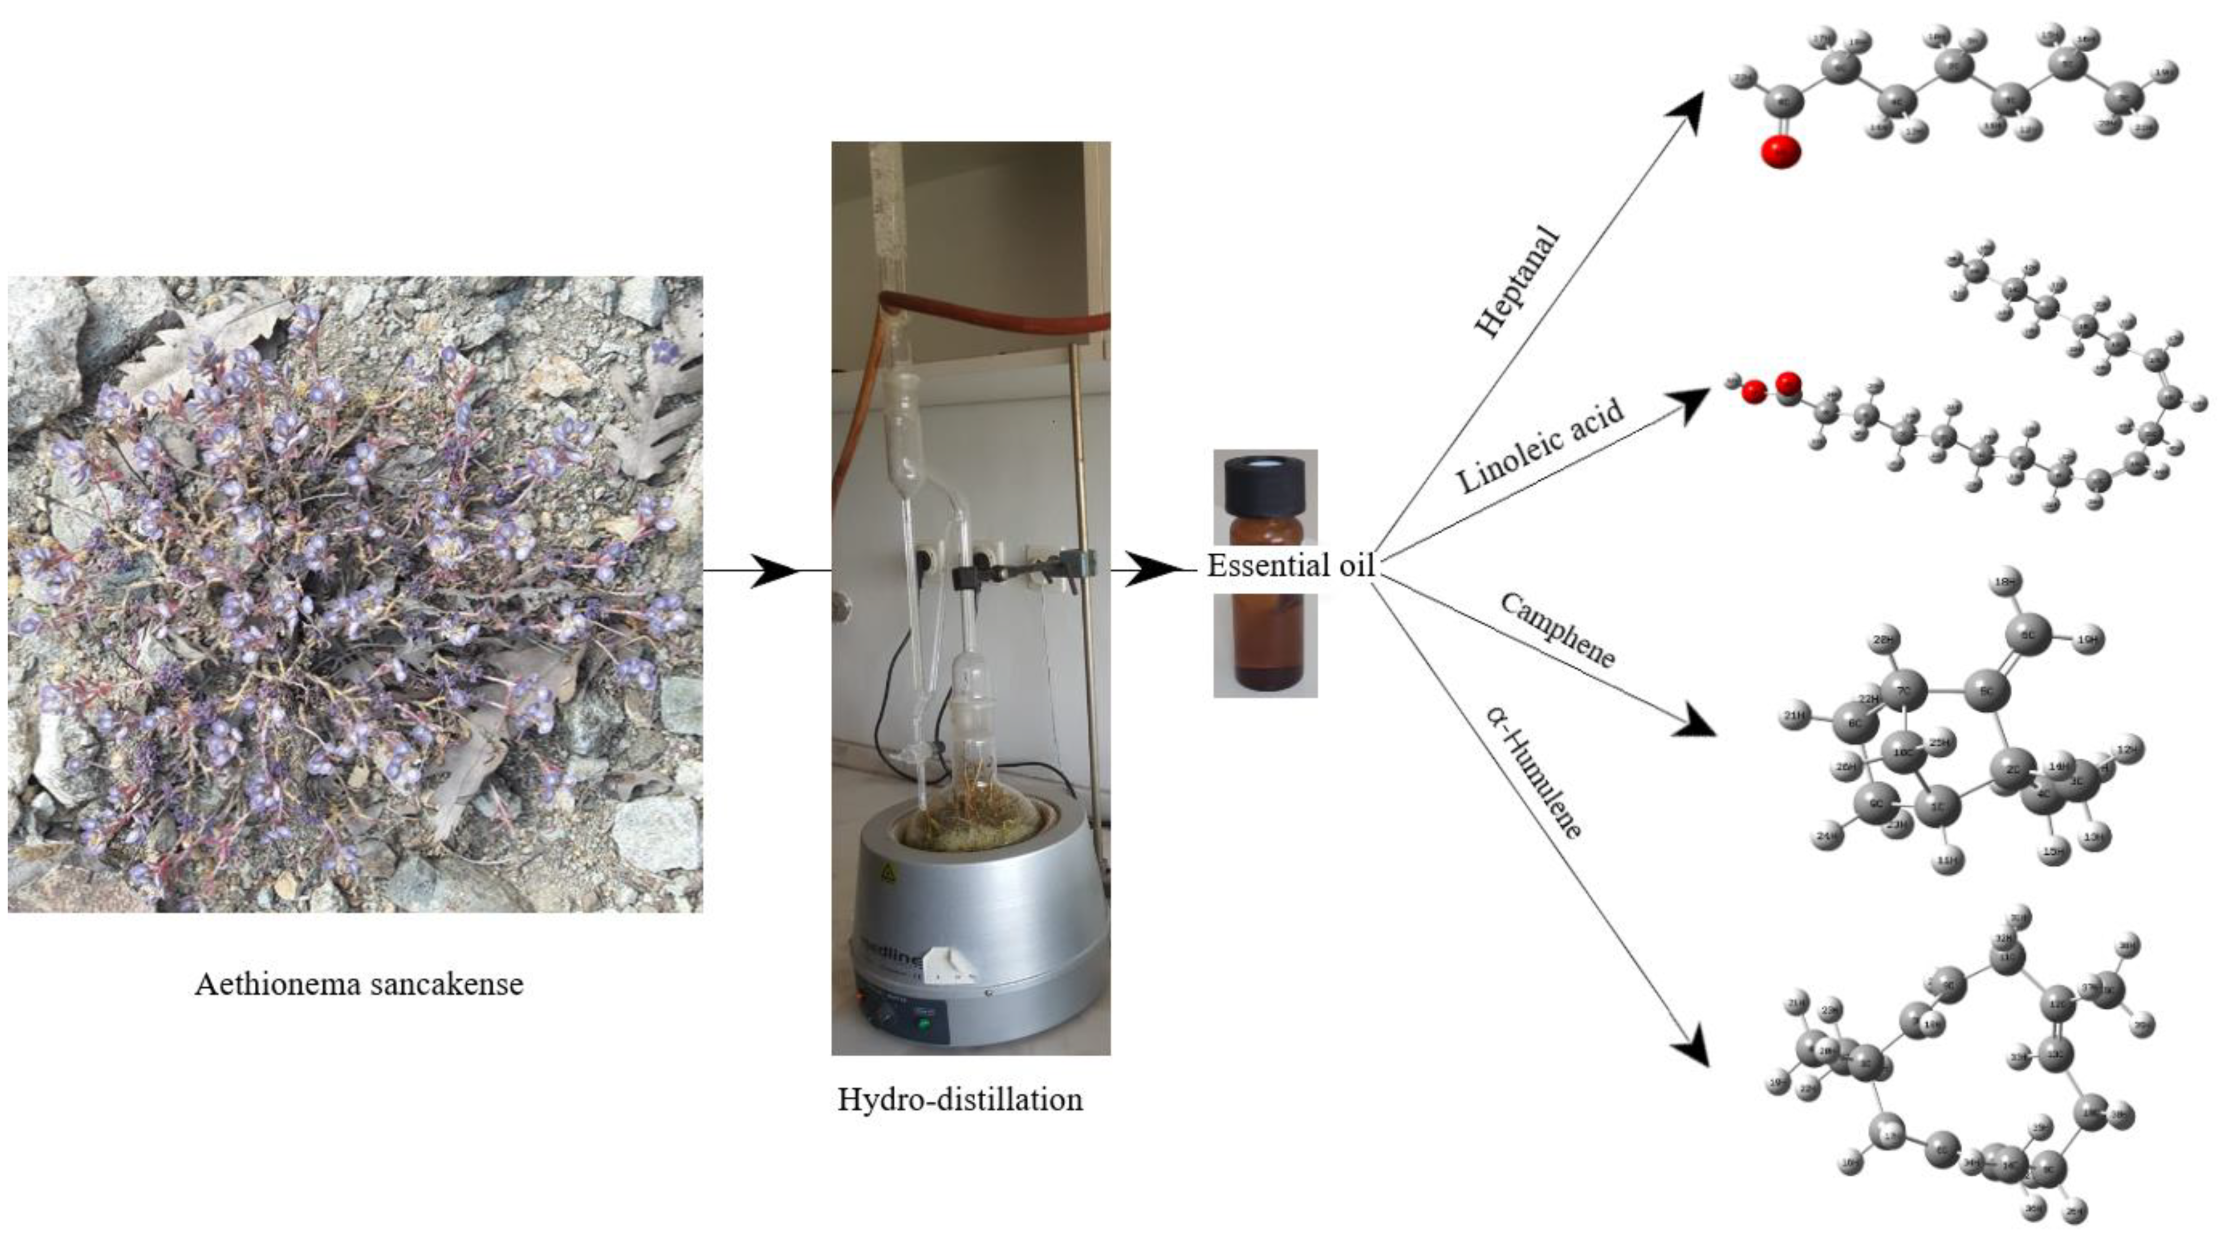
2.1. Collection of the Plant Material
2.2. Isolation of the Essential Oil
2.3. Gas Chromatography-Mass Spectrometry (GC-MS) and FID Analysis
3. Result and Discussion
3.1. Analysis of Essential Oil
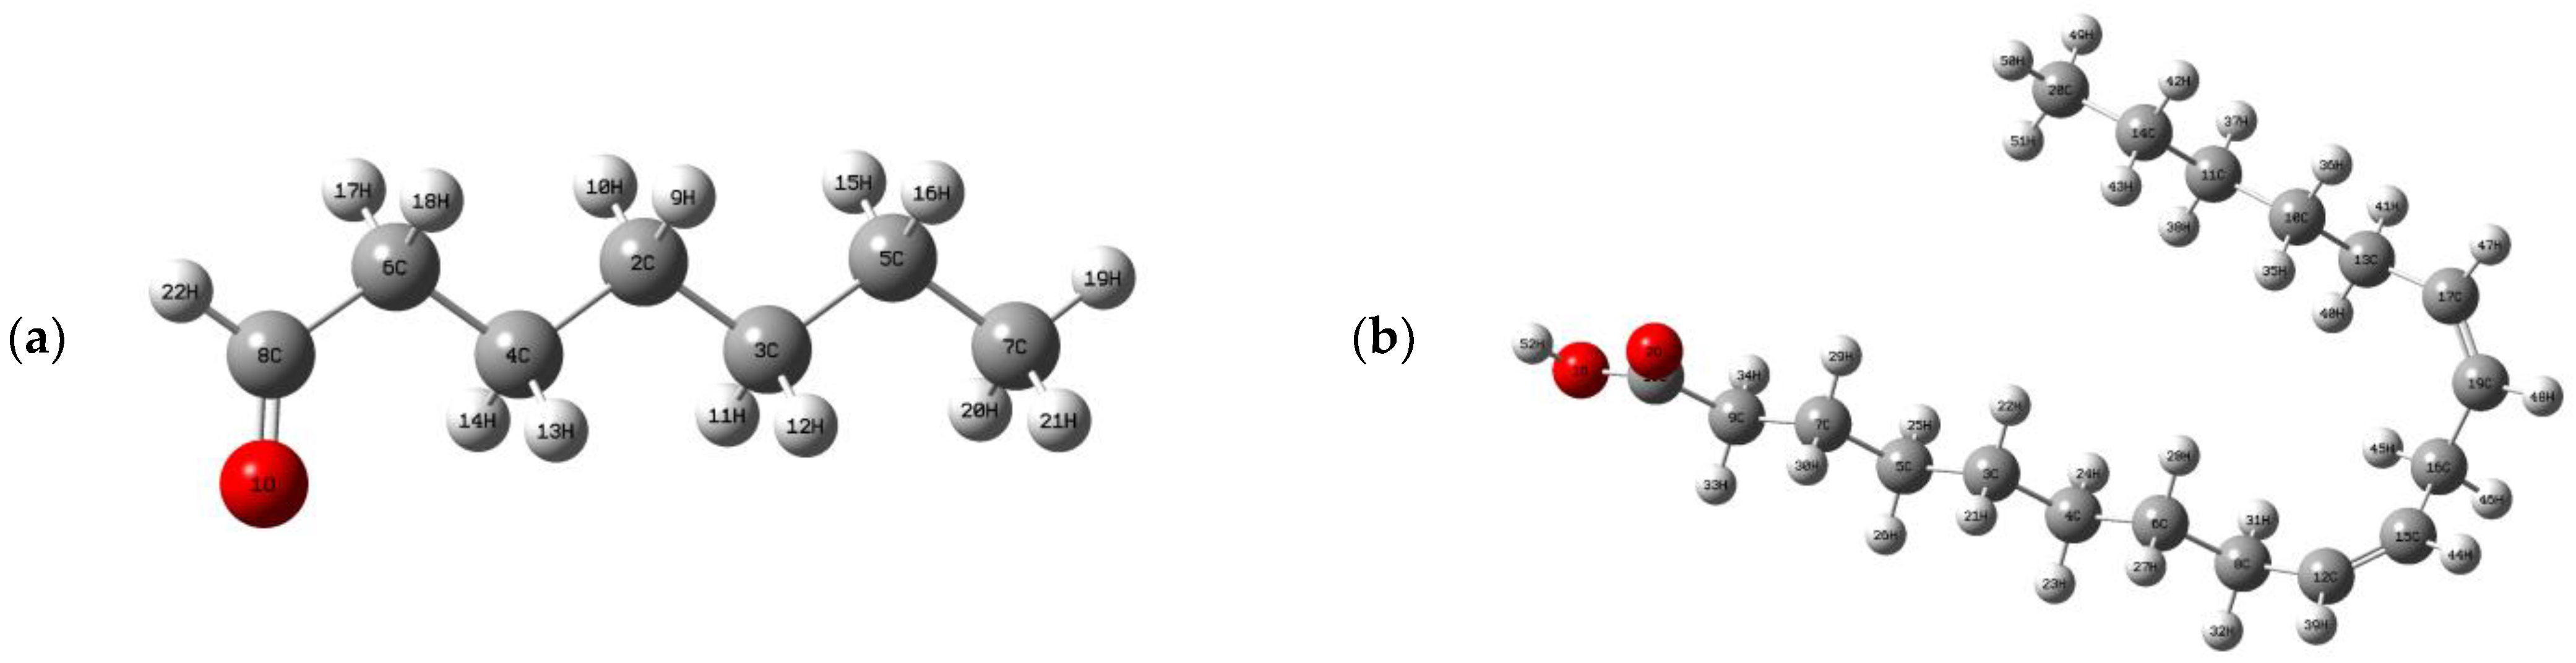
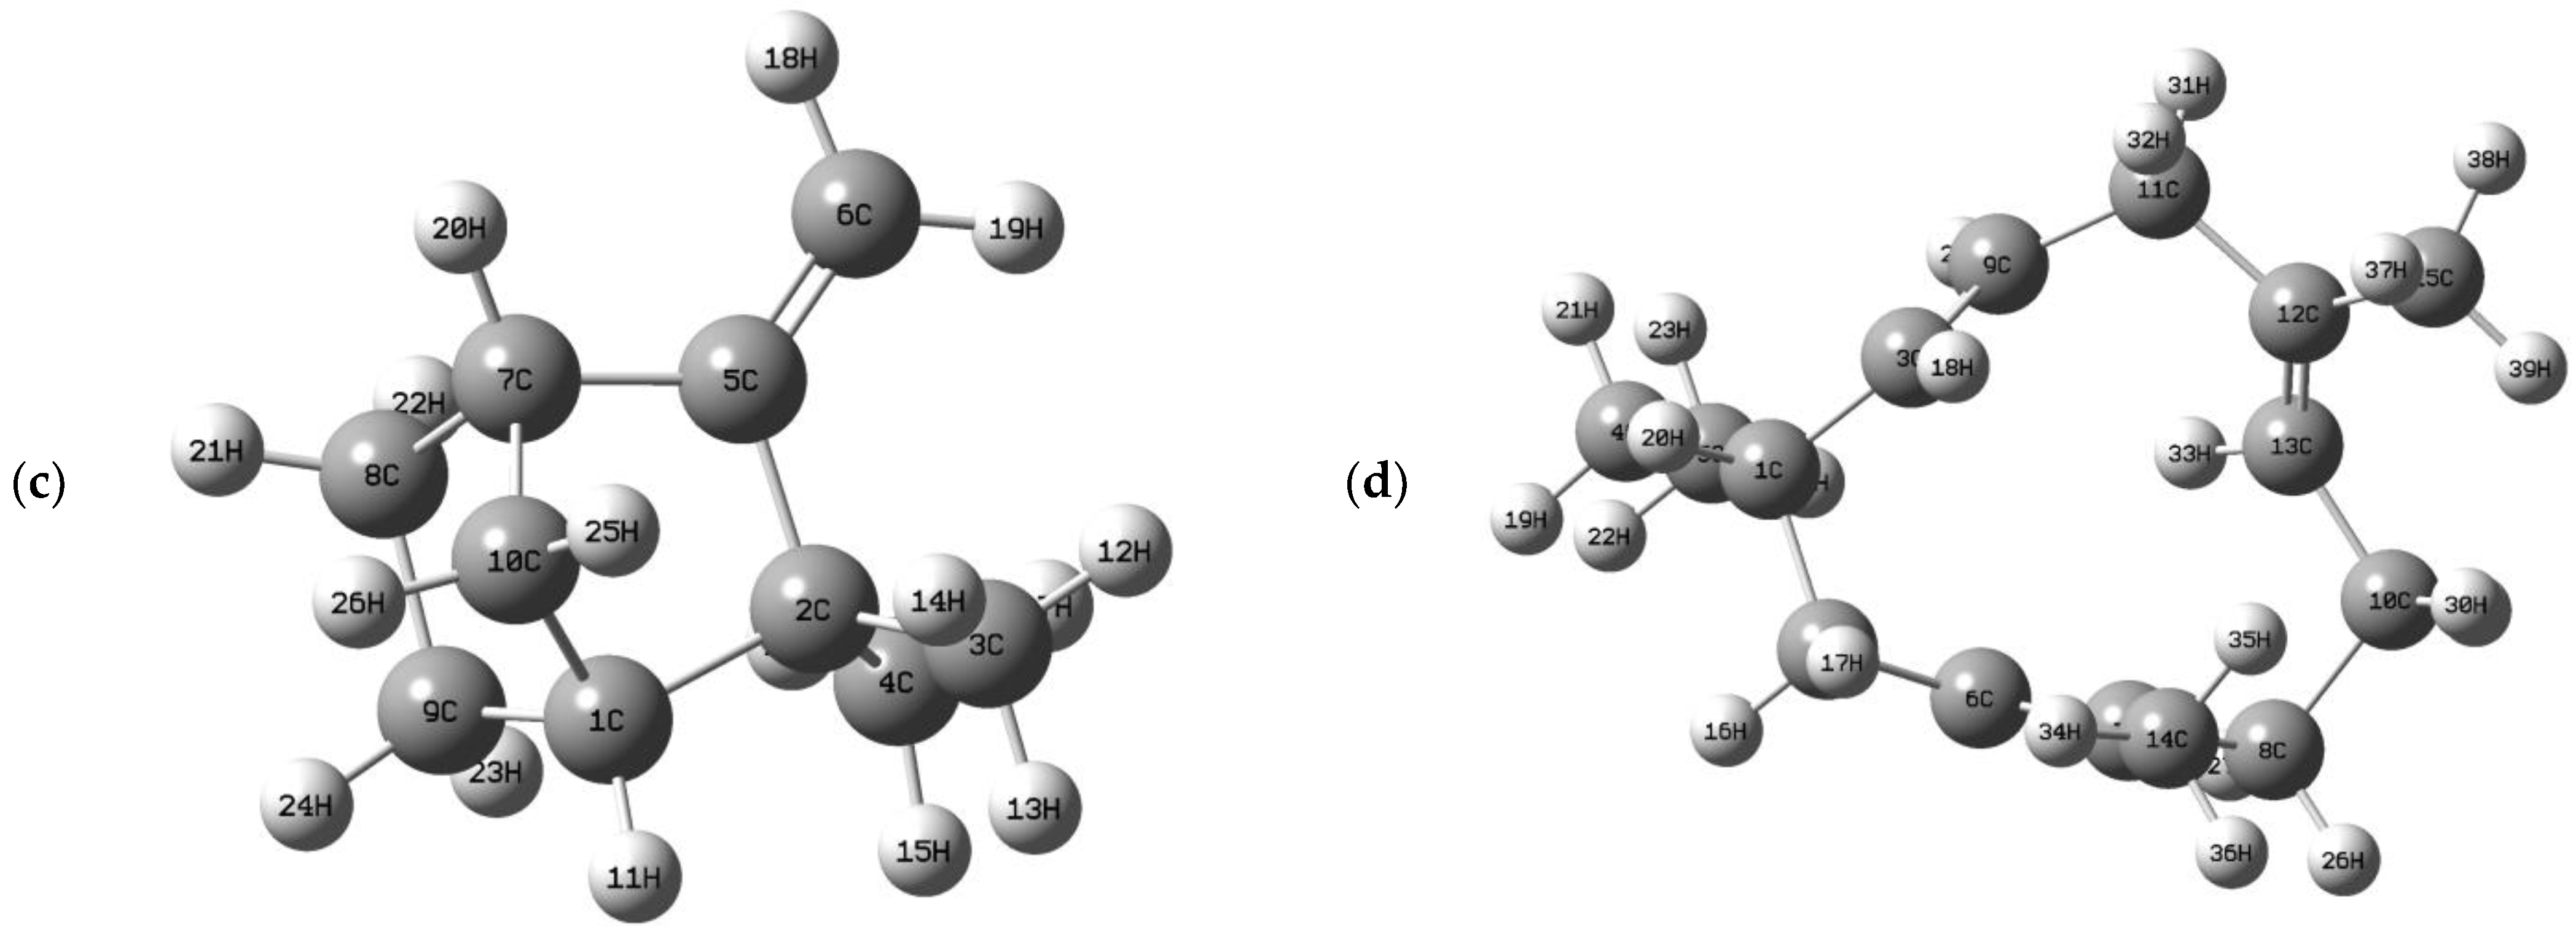
3.2. Computational Details
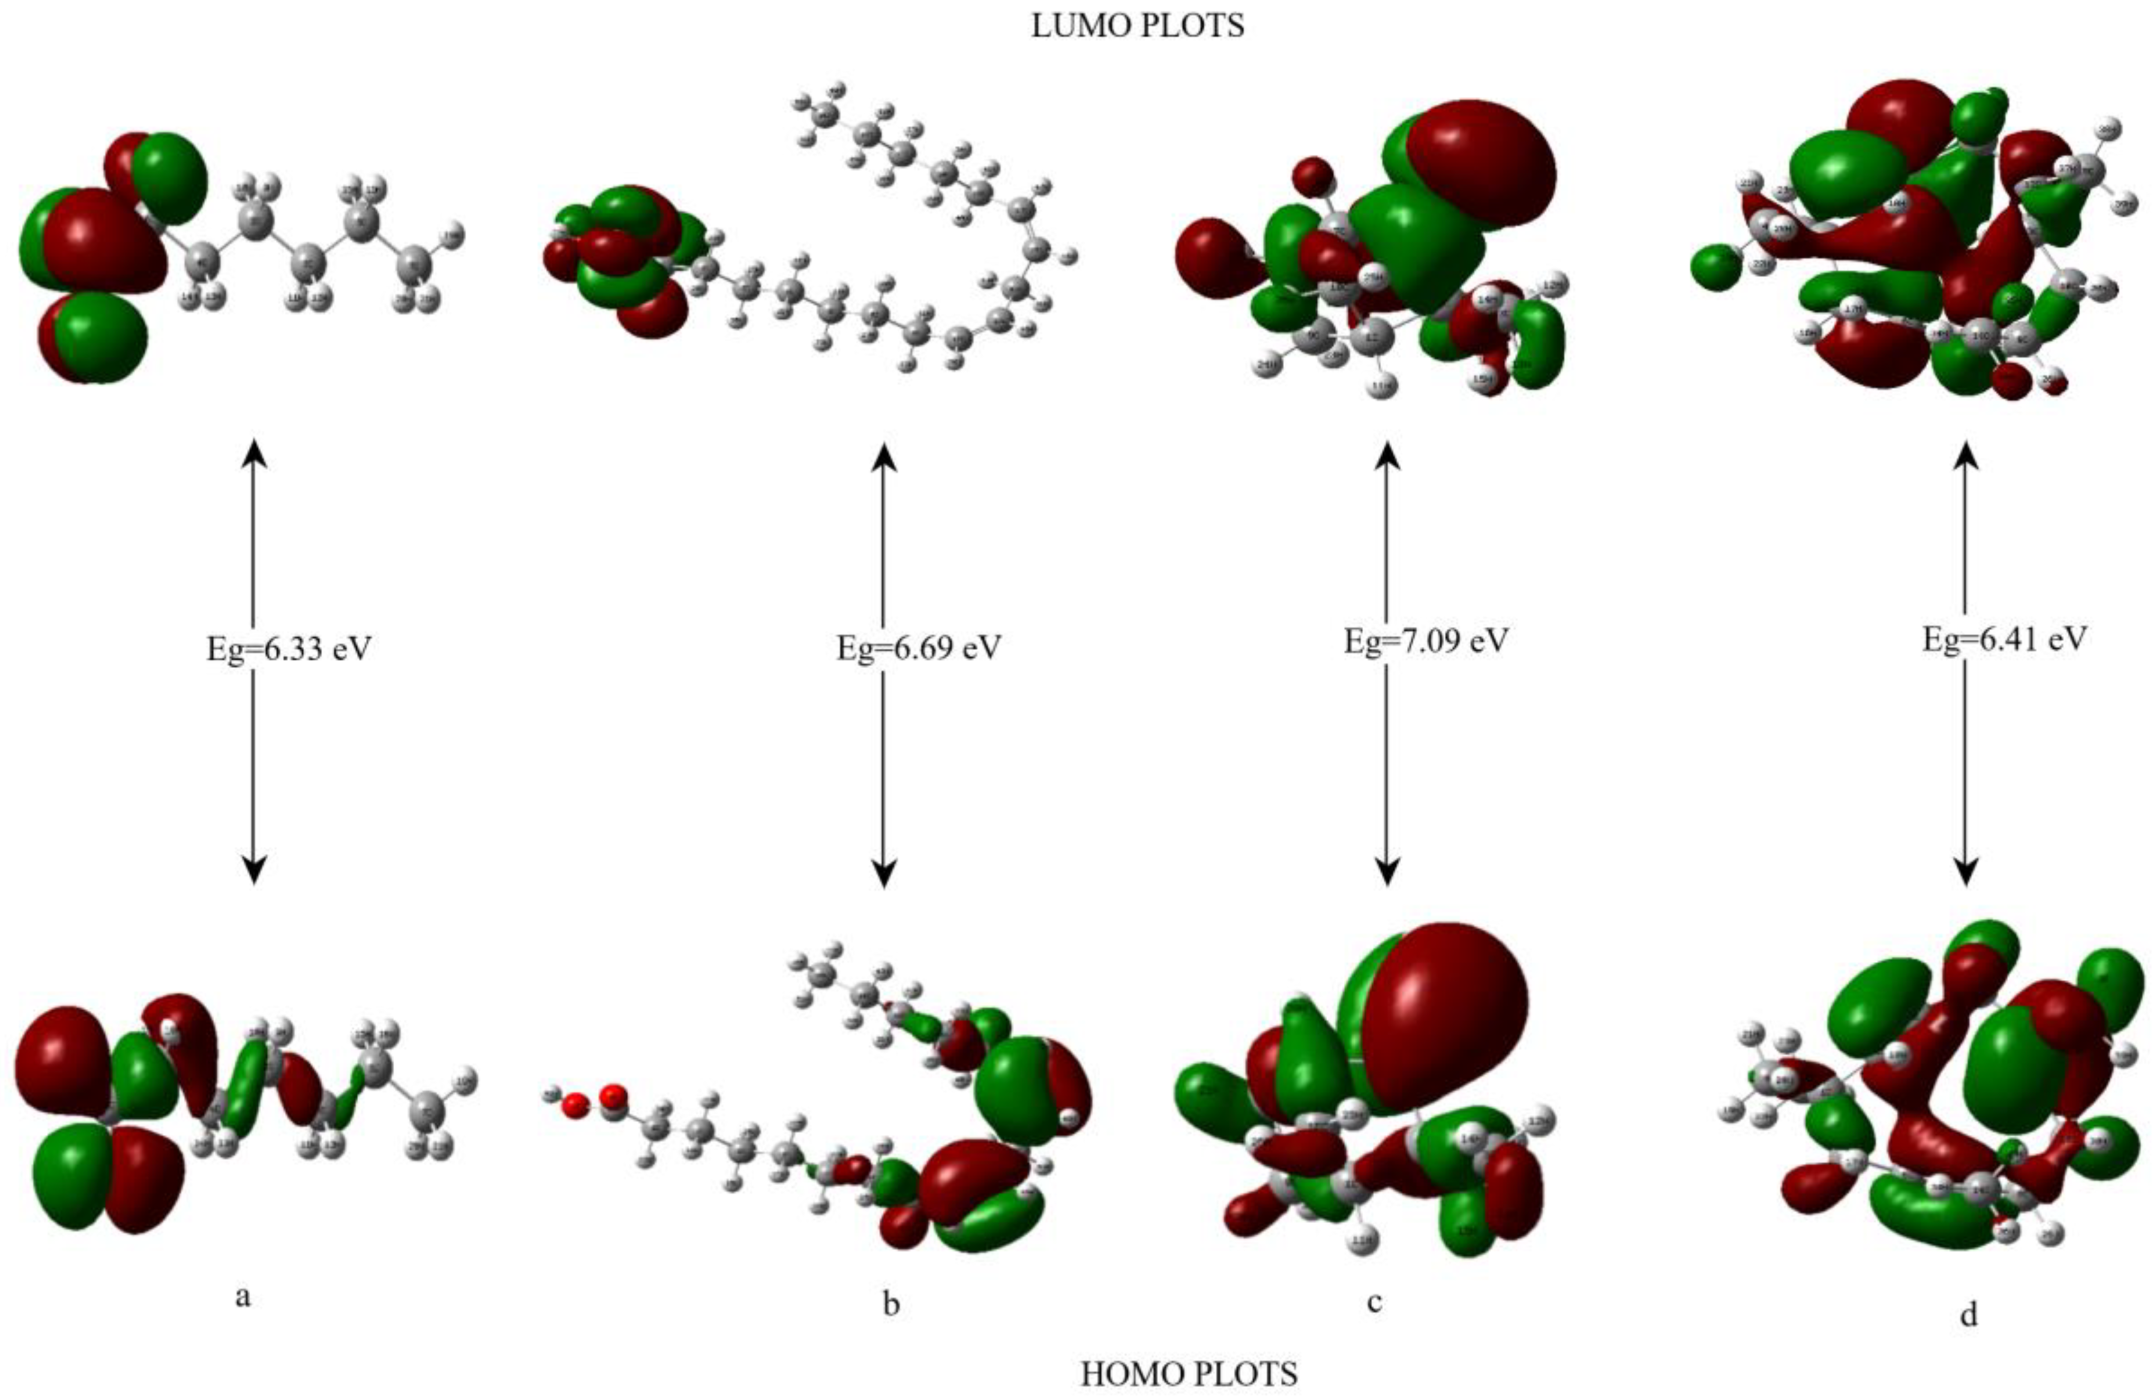
3.3. HOMO-LUMO Analysis
3.4. MEP Analysis
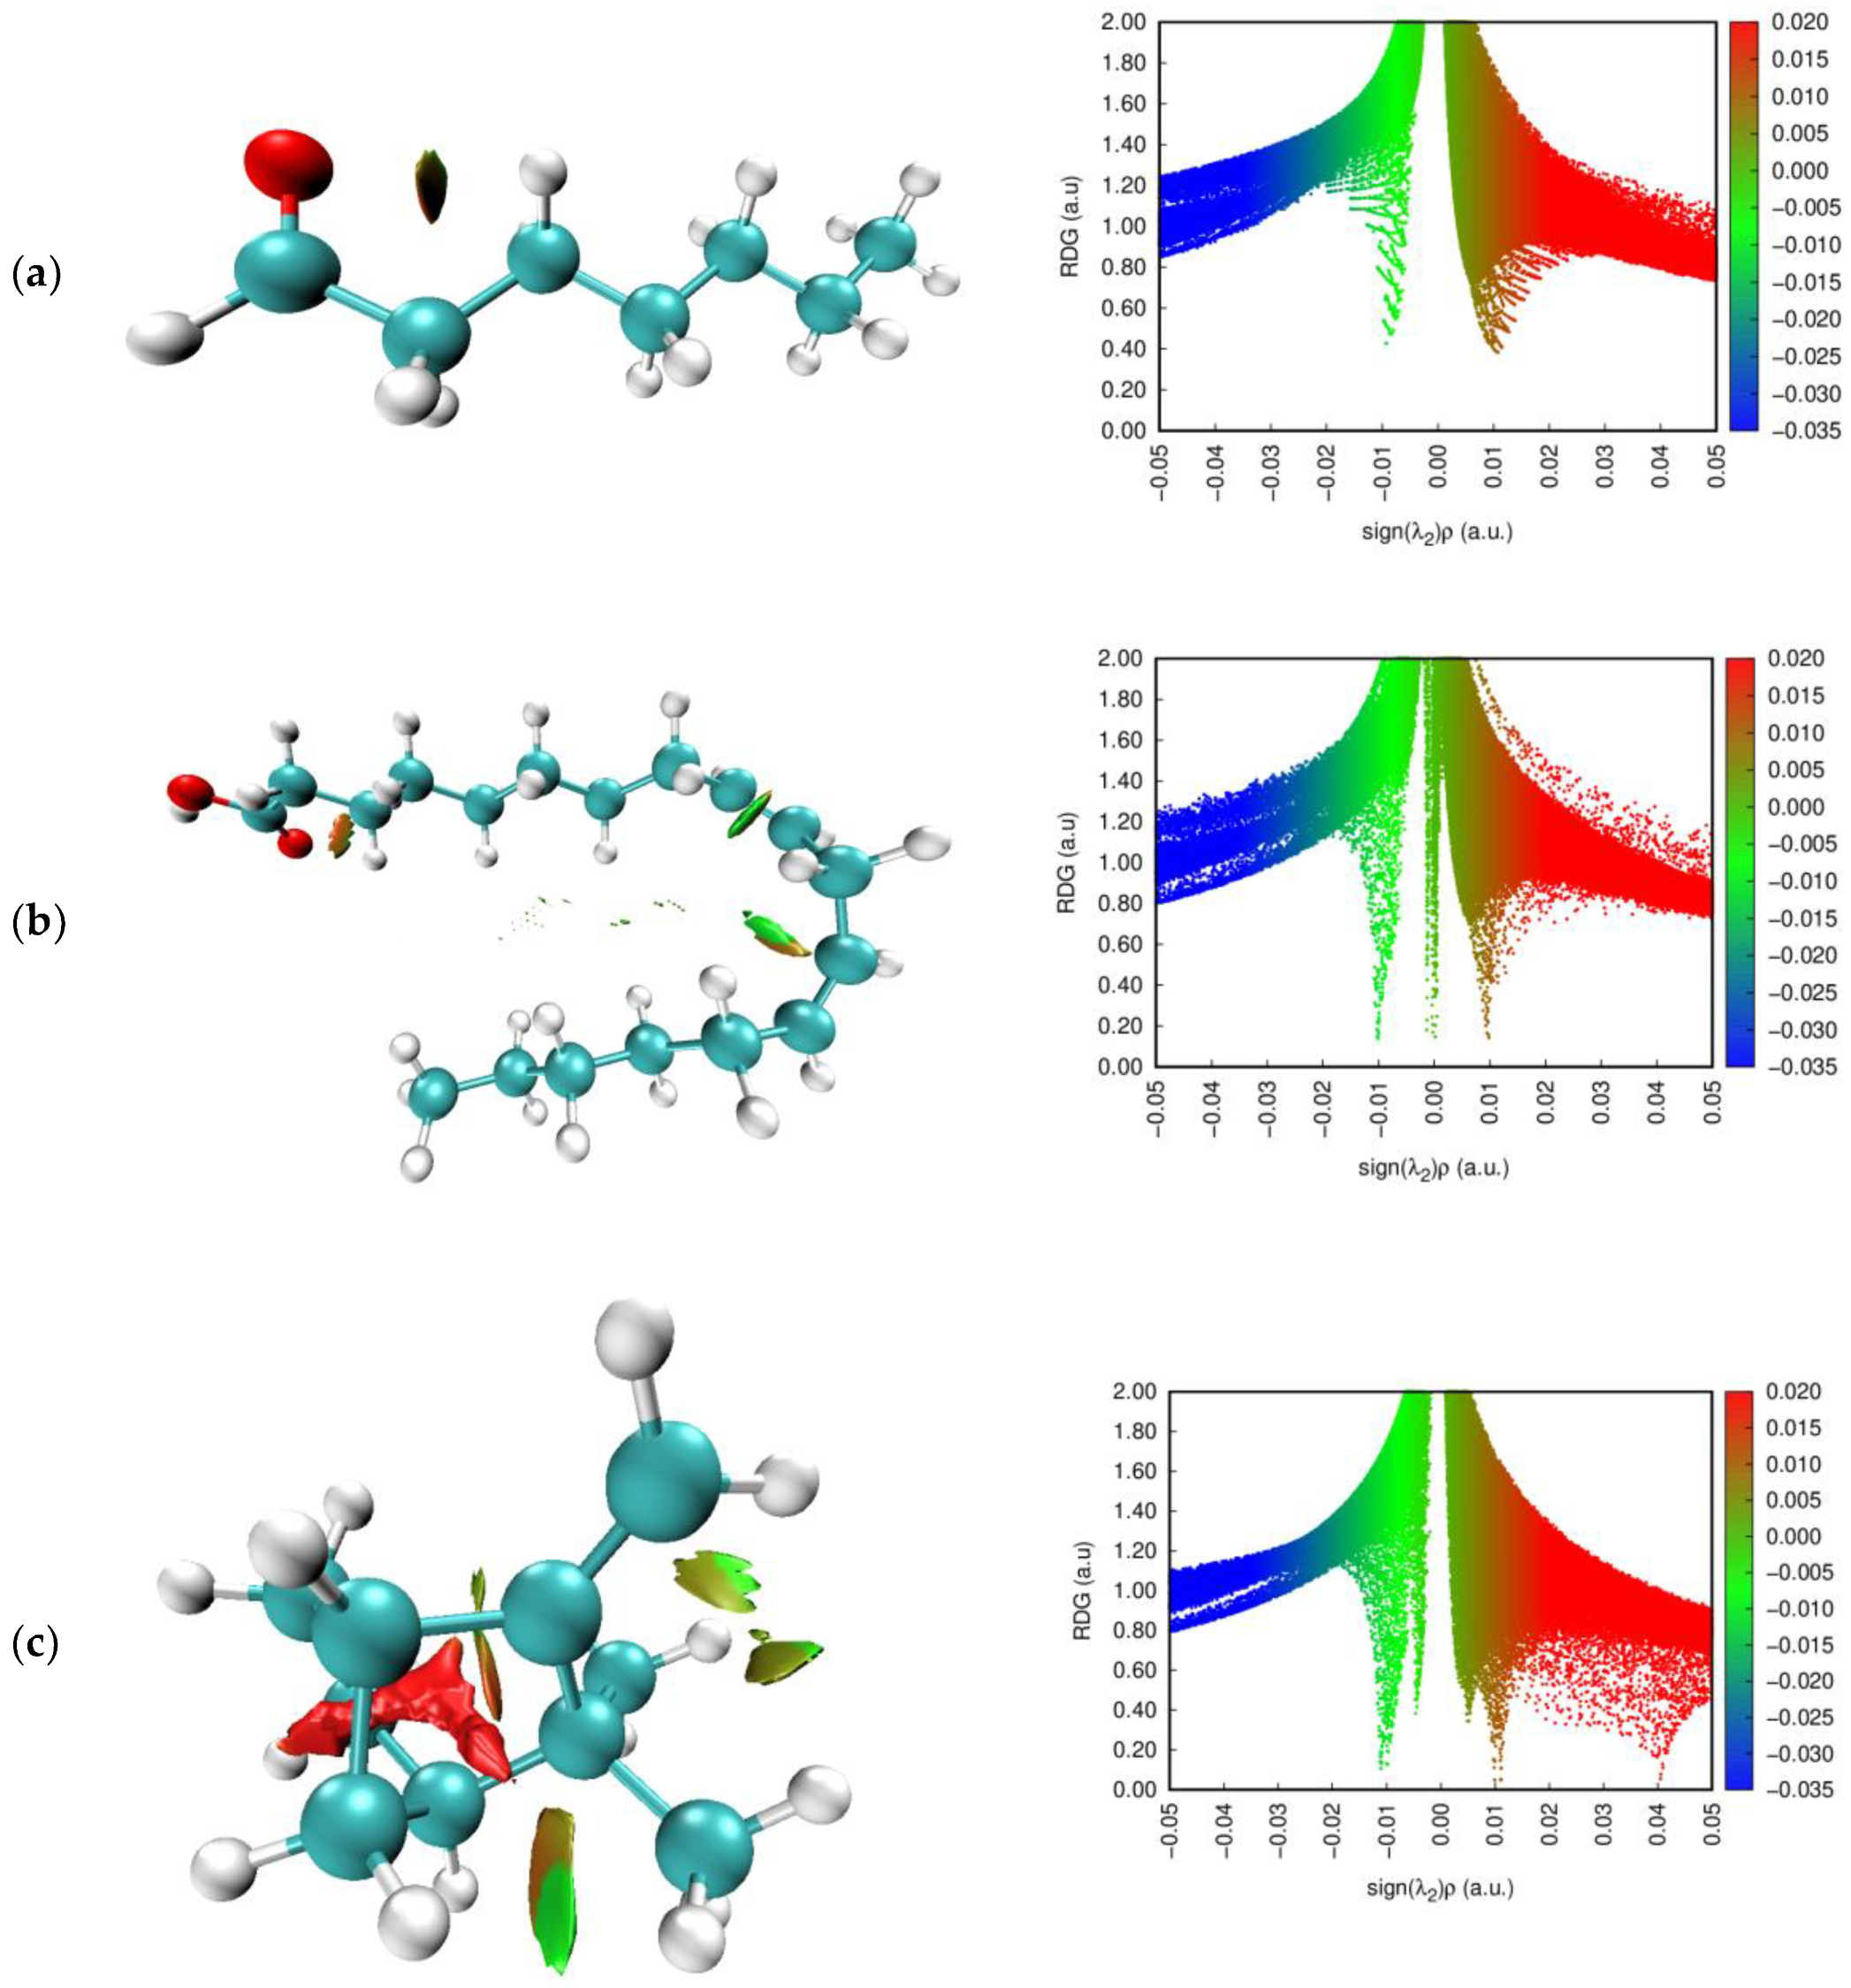
3.5. RDG Analysis of Some Major Constituents of Essential Oil Contents
- (1)
- the sign (λ2) ρ > 0 : a repulsive interaction (non-bonded)
- (2)
- the sign (λ2) ρ < 0 : an attractive interaction (bonded)
- (3)
- the sign (λ2) ρ ≈ 0 : a Van der Waals weak interaction
3.6. Fukui Functions of Some Major Constituents of Essential Oil Contents
4. Conclusions
Author Contributions
Funding
Institutional Review Board Statement
Informed Consent Statement
Data Availability Statement
Acknowledgments
Conflicts of Interest
References
- Ertuğrul, K.; Hamzaoğlu, E.; Demirelma, H.; Uysal, T.; Bozkurt, M.; Şiïriïn, E.; Yılmaz, B.Y.; Al-Shehbaz, I. Turkish Journal of Botany Aethionema aytachii (Brassicaceae): A new species from central Anatolia, Turkey. Doga Turk. J. Bot. 2021, 45, 563–572. [Google Scholar] [CrossRef]
- Karabacak, O.; Öztürk, M.; Duran, A. Aethionema anatolica (Brassicaceae), a New Species from South Anatolia, Turkey. Ann. Bot. Fenn. 2013, 50, 183–186. [Google Scholar] [CrossRef]
- Yıldırımlı, Ş.; Kılıç, Ö. A new Aethionema (Brassicaceae), A. sancakense p.p. and a new description of A. adiyamanense from Turkey. OT Sist. Bot. Derg. 2019, 26, 49–58. [Google Scholar]
- Goffman, F.D.; Thies, W.; Velasco, L. Chemotaxonomic value of tocopherols in Brassicaceae. Phytochemistry 1999, 50, 793–798. [Google Scholar] [CrossRef]
- Zolotnitskaya, S. New alkaloid-bearing plants of the Armenian flora. Izvest. Akad. Nauk Armyan. SSR Biol. Sel’ Khoz. Nauki 1954, 5, 27–39. [Google Scholar]
- Brock, A.; Herzfeld, T.; Paschke, R.; Koch, M.; Dräger, B. Brassicaceae contain nortropane alkaloids. Phytochemistry 2006, 67, 2050–2057. [Google Scholar] [CrossRef]
- Wang, D.; Wang, X.; Fayvush, G.; Tamanyan, K.; Khutsishvili, M.; Atha, D.; Borris, R.P. Phytochemical investigations of Aethionema armenum Boiss. (Brassicaceae). Biochem. Syst. Ecol. 2018, 81, 37–41. [Google Scholar] [CrossRef]
- Baser, K.H.C.; Demirci, B.; Tabanca, N.; Özek, T.; Gören, N. Composition of the essential oils ofTanacetum armenum(DC.) Schultz Bip.,T. balsamitaL.,T. chiliophyllum(Fisch. & Mey.) Schultz Bip. var.chiliophyllumandT. haradjani(Rech. fil.) Grierson and the enantiomeric distribution of camphor and carvone†. Flavour Fragr. J. 2001, 16, 195–200. [Google Scholar] [CrossRef]
- Mohammadin, S.; Nguyen, T.-P.; Van Weij, M.S.; Reichelt, M.; Schranz, M.E. Flowering Locus C (FLC) Is a Potential Major Regulator of Glucosinolate Content across Developmental Stages of Aethionema arabicum (Brassicaceae). Front. Plant Sci. 2017, 8, 876. [Google Scholar] [CrossRef]
- Fahey, J.W.; Zalcmann, A.T.; Talalay, P. The chemical diversity and distribution of glucosinolates and isothiocyanates among plants. Phytochemistry 2001, 56, 5–51. [Google Scholar] [CrossRef]
- Bennett, R.N.; Mellon, F.A.; Kroon, P.A. Screening Crucifer Seeds as Sources of Specific Intact Glucosinolates Using Ion-Pair High-Performance Liquid Chromatography Negative Ion Electrospray Mass Spectrometry. J. Agric. Food Chem. 2004, 52, 428–438. [Google Scholar] [CrossRef] [PubMed]
- Parvaiz, M.; Bhatti, K.H.; Nawaz, K.; Hussain, Z.; Mohsin, R.; Khan, W.; Hussain, A. Ethno-Botanical Studies of Medicinal Plants of Dinga, District Gujrat, Punjab, Pakistan. World Appl. Sci J. 2013, 26, 826–833. [Google Scholar]
- Duran, A.; Uslu, N.; Doğan, B.; Özcan, M.M.; Çelik, M. Antioxidant Activity and Phenolic Contents of 30 Selected Medicinal Plants. J. Agroaliment. Processes Technol. 2015, 21, 136–141. [Google Scholar]
- Aliyazicioglu, R.; Eyupoğlu, O.E.; Ozgen, U.; Karaoglu, S.A. Composition of Volatile Components and Biological Activities of Aethionema diastrophis. Chem. Nat. Compd. 2017, 23, 151–380. [Google Scholar] [CrossRef]
- Denniston, K.J.; Topping, J.; Dwyer, T.M. General Organic and Biochemistry, 5th ed.; Towson University: Towson, MD, USA, 2007. [Google Scholar]
- Kefa Onchoke, K.; Christopher Hadad, M.; Prabir Dutta, K.J. Structure and Vibrational Spectra of Mononitrated Benzo[a]pyrenes. Phys. Chem. A 2006, 110, 76–84. [Google Scholar] [CrossRef] [PubMed]
- Klauk, H.; Gundlach, D.J.; Bonses, M.; Kuo, C.C.; Jackson, T. A reduced complexity process for organic thin film transistors. Appl. Phys. Lett. 2000, 76, 1692. [Google Scholar] [CrossRef]
- Kelley, T.W.; Muyres, D.V.; Baude, P.F.; Smith, T.P.; Jones, T.D. Organic and Polymeric Materials and Devices; Blom, P.W.M., Greenham, N.C., Dimitrakopoulos, C.D., Frisbie, C.D., Eds.; Materials Research Society: Warrendale, PA, USA, 2003; Volume 771, p. 169. [Google Scholar]
- Doğan, H.; Bahar, M.R.; Çalışkan, E.; Tekin, S.; Uslu, H.; Akman, F.; Görgülü, A.O. Synthesis and spectroscopic characterizations of hexakis [(1-(4′-oxyphenyl)-3-(substituted-phenyl) prop-2-en-1-one)] cyclotriphosphazenes: Their in vitro cytotoxic activity, theoretical analysis and molecular docking studies. J. Biomol. Struct. Dyn. 2020, 40, 3258–3272. [Google Scholar] [CrossRef]
- Akman, F.; Demirelli, K. Dielectric and spectroscopic properties of copolymers based on methacrylate carrying coumarin side group. Ferroelectrics 2016, 505, 74–89. [Google Scholar] [CrossRef]
- Kazachenko, A.S.; Akman, F.; Abdelmoulahi, H.; Issaoui, N.; Malyar, Y.N.; Al-Dossary, O.; Wojcik, M.J. Intermolecular hydrogen bonds interactions in water clusters of ammonium sulfamate: FTIR, X-ray diffraction, AIM, DFT, RDG, ELF, NBO analysis. J. Mol. Liq. 2021, 342, 117475. [Google Scholar] [CrossRef]
- Kazachenko, A.; Akman, F.; Medimagh, M.; Issaoui, N.; Vasilieva, N.; Malyar, Y.N.; Sudakova, I.G.; Karacharov, A.; Miroshnikova, A.; Al-Dossary, O.M. Sulfation of Diethylaminoethyl-Cellulose: QTAIM Topological Analysis and Experimental and DFT Studies of the Properties. ACS Omega 2021, 6, 22603–22615. [Google Scholar] [CrossRef]
- Al-Otaibi, J.S.; Al-Wabli, R.I. Vibrational spectroscopic investigation (FT-IR and FT-Raman) using ab initio (HF) and DFT (B3LYP) calculations of 3-ethoxymethyl-1,4-dihydroquinolin-4-one. Spectrochim. Acta Part A Mol. Biomol. Spectrosc. 2015, 137, 7–15. [Google Scholar] [CrossRef]
- Lu, L.; Hu, H.; Hou, H.; Wang, B. An improved B3LYP method in the calculation of organic thermochemistry and reactivity. Comput. Theor. Chem. 2013, 1015, 64–71. [Google Scholar] [CrossRef]
- Leal, A.L.A.B.; Bezerra, C.F.; e Silva, A.K.F.; da Silva, L.E.; Bezerra, L.L.; Almeida-Neto, F.W.; Marinho, E.M.; Fernandes, C.F.C.; da Rocha, M.N.; Marinho, M.M.; et al. Seasonal variation of the composition of essential oils from Piper cernuum Vell and Piper rivinoides Kunth, ADMET study, DFT calculations, molecular docking and dynamics studies of major components as potent inhibitors of the heterodimer methyltransferase complex NSP16-NSP10 SARS COV-2 protein. J. Biomol. Struct. Dyn. 2022, 1–19. [Google Scholar] [CrossRef]
- Saraiva, A.; Saraiva, G.; Albuquerque, R.; Nogueira, C.; Teixeira, A.; Lima, L.; Cruz, B.; de Sousa, F. Chemical analysis and vibrational spectroscopy study of essential oils from Lippia sidoides and of its major constituent. Vib. Spectrosc. 2020, 110, 103111. [Google Scholar] [CrossRef]
- Hara, A.; Radin, N.S. Lipid extraction of tissues with a low-toxicity solvent. Anal. Biochem. 1978, 90, 420–426. [Google Scholar] [CrossRef]
- Christie, W.W. Gas Chromatographyand Lipids: A Practical Guide; The Hannah Research Institute: Ayr, Scotland; The Oily Press: Bridgwater, England, 1990; p. 307. [Google Scholar]
- Scrimgeour, C.M. Fatty acids of the seed oils of alpineCruciferae and other alpine species. Lipids 1976, 11, 877. [Google Scholar] [CrossRef]
- Knights, B.A.; Brooks, C.J.W. Isomers of 24-ethylidenecholesterol: Gas chromatographic and mass spectrometric characterization. Phytochemistry 1969, 8, 463. [Google Scholar] [CrossRef]
- Frisch, M.J.; Trucks, G.W.; Schlegel, H.B.; Scuseria, G.E.; Robb, M.A.; Cheeseman, J.R.; Scalmani, G.; Barone, V.; Petersson, G.A.; Nakatsuji, H.; et al. Gaussian 09, Revision B.01; Gaussian, Inc.: Wallingford, CT, USA, 2010. [Google Scholar]
- Dennington, R.; Keith, T.; Millam, J. Gauss View, Version 5; Semichem Inc.: Shawnee Mission, KS, USA, 2010. [Google Scholar]
- Becke, A.D. Density-functional exchange-energy approximation with correct asymptotic behavior. Phys. Rev. A 1988, 38, 3098–3100. [Google Scholar] [CrossRef]
- Lee, C.; Yang, W.; Parr, R.G. Development of the Colle-Salvetti correlation-energy formula into a functional of the electron density. Phys. Rev. B 1988, 37, 785–789. [Google Scholar] [CrossRef]
- Fleming, I. Frontier Orbital and Organic Chemical Reactions; John Wiley and Sons: New York, NY, USA, 1976. [Google Scholar]
- Singh, H. A DFT approach for theoretical and experimental study of structure, electronic, Hirshfeld surface and spectroscopic properties of 12-(4-bromophenyl)-2-(prop-2-ynyloxy)-9,10-dihydro-8H-benzo[a]xanthen-11(12H)-on single crystal. Chem. Phys. 2019, 524, 1–13. [Google Scholar] [CrossRef]
- Koopmans, T. On the assignment of wave functions and eigenvalues to the individual electrons of an atom. Physica 1934, 1, 104–113. [Google Scholar] [CrossRef]
- Parr, R.G.; Donnelly, R.A.; Levy, M.; Palke, W.E. Electronegativity: The density functional viewpoint. J. Chem. Phys. 1978, 68, 3801–3807. [Google Scholar] [CrossRef]
- Parr, R.G.; Szentpaly, L.V.; Liu, S. Electrophilicity index. J. Am. Chem. Soc. 1999, 121, 1922–1924. [Google Scholar] [CrossRef]
- Domingo, L.R.; Chamorro, E.; Perez, P. Understanding the Reactivity of Captodative Ethylenes in Polar Cycloaddition Reactions. A Theoretical Study. J. Org. Chem. 2008, 73, 4615–4624. [Google Scholar] [CrossRef]
- Mondal, S.; Mandal, S.M.; Mondal, T.K.; Sinha, C. Structural characterization of new Schiff bases of sulfamethoxazole and sulfathiazole, their antibacterial activity and docking computation with DHPS protein structure. Spectrochim. Acta Part A Mol. Biomol. Spectrosc. 2015, 150, 268–279. [Google Scholar] [CrossRef]
- Scrocco, E. Tomasi, Electronic Molecular Structure, Reactivity and Intermolecular Forces: An Euristic Interpretation by Means of Electrostatic Molecular Potentials. J. Adv. Quantum. Chem. 1978, 103, 115. [Google Scholar]
- Lu, T.; Chen, F. Multiwfn: A multifunctional wavefunction analyzer. J. Comput. Chem. 2012, 33, 580–592. [Google Scholar] [CrossRef]
- Humphrey, W.; Dalke, A.; Schulten, K. VMD: Visual molecular dynamics. J. Mol. Graph. 1996, 14, 33–38. [Google Scholar] [CrossRef]
- Johnson, E.R.; Keinan, S.; Mori-Sánchez, P.; Contreras-García, J.; Cohen, A.J.; Yang, W. Revealing noncovalent interactions. J. Am. Chem. Soc. 2010, 132, 6498–6506. [Google Scholar] [CrossRef]
- Jia, Z.; Pang, H.; Li, H.; Wang, X. A density functional theory study on complexation processes and intermolecular interactions of triptycene-derived oxacalixarenes. Theor. Chim. Acta 2019, 138, 113. [Google Scholar] [CrossRef]
- Kolandaivel, P.; Praveen, G.; Selvarengan, P. Study of atomic and condensed atomic indices for reactive sites of molecules. J. Chem. Sci. 2005, 117, 591–598. [Google Scholar] [CrossRef]
- Vennila, M.; Rathikha, R.; Muthu, S.; Jeelani, A.; Irfan, A. Structural, spectral inspection, electronic properties in different solvents, Fukui functions, 6-acetyl-2H-1, 4-benzoxazin-3 (4H)-one–Multiple sclerosis and auto immune disorders therapeutics. J. Mol. Liq. 2022, 359, 119248. [Google Scholar] [CrossRef]
- Kazachenko, A.S.; Akman, F.; Sagaama, A.; Issaoui, N.; Malyar, Y.N.; Vasilieva, N.Y.; Borovkova, V.S. Theoretical and experimental study of guar gum sulfation. J. Mol. Model. 2021, 27, 1–15. [Google Scholar] [CrossRef] [PubMed]
- Lutoshkin, M.A.; Kazachenko, A.S. Assessment of various density functionals and solvation models to describe acid-base, spectral and complexing properties of thiobarbituric and barbituric acids in aqueous solution. J. Comput. Methods Sci. Eng. 2017, 17, 851–863. [Google Scholar] [CrossRef]
- Slyusarenko, N.V.; Vasilyeva, N.Y.; Kazachenko, A.S.; Gerasimova, M.A.; Romanchenko, A.S.; Slyusareva, E.A. Synthesis and Properties of Interpolymer Complexes Based on Chitosan and Sulfated Arabinogalactan. Polym. Sci. Ser. B 2020, 62, 272–278. [Google Scholar] [CrossRef]
- Kazachenko, A.S.; Tomilin, F.N.; Pozdnyakova, A.A.; Vasilyeva, N.Y.; Malyar, Y.N.; Kuznetsova, S.A.; Avramov, P.V. Theoretical DFT interpretation of infrared spectra of biologically active arabinogalactan sulphated derivatives. Chem. Pap. 2020, 74, 4103–4113. [Google Scholar] [CrossRef]


| No. | RII | Name of Compounds | Area |
|---|---|---|---|
| 1 | 901 | 3-Hexanone | 0.1 |
| 2 | 904 | 2-Heptanone | 0.8 |
| 3 | 914 | Heptanal | 9.7 |
| 4 | 952 | Camphene | 13.9 |
| 5 | 959 | Benzaldehyde | 0.7 |
| 6 | 1003 | α-Phellandrene | 1.3 |
| 7 | 1024 | Geraniol | 3.4 |
| 8 | 1042 | Benzene acetaldehyde | 3.5 |
| 9 | 1090 | p-Cymene | 4.7 |
| 10 | 1358 | β-Cubebene | 1.8 |
| 11 | 1385 | β-Bourbonene | 1.4 |
| 12 | 1392 | Caryophyllene | 2.1 |
| 13 | 1450 | α-Humulene | 19.8 |
| 14 | 1485 | β-Selinene | 4.3 |
| 15 | 1495 | Viridiflorene | 1.2 |
| 16 | 1496 | Caryophyllene oxide | 3.0 |
| 17 | 1594 | Benzyl benzoate | 0.5 |
| 18 | 1598 | Estragole | 0.3 |
| 19 | 1629 | 2-Pentadecanone | 1.7 |
| 20 | 1643 | n- Hexadecanoic acid | 2.7 |
| 21 | 1900 | Linoleic acid | 23.1 |
| Total | 100.0 | ||
| Monoterpenes | 38.1 | ||
| Sesquiterpenes | 33.6 | ||
| Others | 28.3 | ||
| Studied Sample | Palmitic Acid C 16:0 | Pentadecanoic Acid C 15:0 | Stearic Acid C 18:00 | Oleic Acid C 18:1 | Linoleic Acid C 18:2 | Linolenic Acid C 18:3 | Eikosadienoic Acid C 20:2 | TOTAL |
|---|---|---|---|---|---|---|---|---|
| Aethionema sancakense | 14.70 | 0.18 | 2.76 | 1.51 | 55.38 | 9.26 | 1.93 | 75.72 |
| Parameters | Values (eV) | |||||||
|---|---|---|---|---|---|---|---|---|
| a | a * | b | b * | c | c * | d | d * | |
| EHOMO | −6.8448 | −6.9441 | −6.3634 | −6.4494 | −6.3569 | −6.4502 | −5.8143 | −5.8627 |
| ELUMO | −0.5116 | −0.5423 | 0.3271 | 0.2522 | 0.7423 | 0.6574 | 0.6055 | 0.5619 |
| Egap | 6.3332 | 6.4018 | 6.6905 | 6.7016 | 7.0992 | 7.1076 | 6.4197 | 6.4246 |
| IP | 6.8448 | 6.9441 | 6.3634 | 6.4494 | 6.3569 | 6.4502 | 5.8143 | 5.8627 |
| EA | 0.5116 | 0.5423 | −0.3271 | −0.2522 | −0.7423 | −0.6574 | −0.6055 | −0.5619 |
| χ | 3.6782 | 3.7432 | 3.0182 | 3.0986 | 2.8073 | 2.8964 | 2.6044 | 2.6504 |
| μ | −3.6782 | −3.7432 | −3.0182 | −3.0986 | −2.8073 | −2.8964 | −2.6044 | −2.6504 |
| ζ | 0.3158 | 0.3124 | 0.2989 | 0.2984 | 0.2817 | 0.2814 | 0.3115 | 0.3113 |
| η | 3.1666 | 3.2009 | 3.3452 | 3.3508 | 3.5496 | 3.5538 | 3.2099 | 3.2123 |
| ω | 2.1362 | 2.1887 | 1.3615 | 1.4327 | 1.1101 | 1.1803 | 1.0566 | 1.0934 |
| ∆Nmax | 1.1616 | 1.1694 | 0.9022 | 0.9247 | 0.7909 | 0.8150 | 0.8114 | 0.8251 |
| N | 0.4681 | 0.4569 | 0.7345 | 0.6980 | 0.9008 | 0.8473 | 0.9465 | 0.9146 |
| (a) | (b) | ||||||||
|---|---|---|---|---|---|---|---|---|---|
| Atoms | Δf(r) | Atoms | Δf(r) | ||||||
| 1(O) | 0.2518 | 0.2627 | 0.2573 | 0.0109 | 1(O) | 0.0327 | 0.0534 | 0.0431 | 0.0207 |
| 2(C) | 0.0301 | 0.0103 | 0.0202 | −0.0199 | 2(O) | 0.0726 | 0.0955 | 0.0841 | 0.0229 |
| 3(C) | 0.0338 | 0.0064 | 0.0201 | −0.0274 | 3(C) | 0.0057 | 0.0039 | 0.0048 | −0.0018 |
| 4(C) | 0.0221 | 0.0073 | 0.0147 | −0.0148 | 4(C) | 0.007 | 0.0056 | 0.0063 | −0.0014 |
| 5(C) | 0.0284 | 0.0051 | 0.0167 | −0.0233 | 5(C) | 0.0056 | 0.005 | 0.0053 | −6.00 × 10⁻⁴ |
| 6(C) | 0.0571 | 0.0475 | 0.0523 | −0.0096 | 6(C) | 0.0119 | 0.007 | 0.0094 | −0.0049 |
| 7(C) | 0.0329 | 0.0069 | 0.0199 | −0.026 | 7(C) | 0.0032 | 0.0034 | 0.0033 | 3.00 × 10⁻⁴ |
| 8(C) | 0.1137 | 0.2981 | 0.2059 | 0.1845 | 8(C) | 0.0151 | 0.011 | 0.0131 | −0.0041 |
| 9(H) | 0.0206 | 0.0133 | 0.0169 | −0.0074 | 9(C) | 0.0115 | 0.0198 | 0.0156 | 0.0083 |
| 10(H) | 0.0206 | 0.0133 | 0.0169 | −0.0074 | 10(C) | 0.011 | 0.0065 | 0.0087 | −0.0045 |
| 11(H) | 0.0185 | 0.0075 | 0.013 | −0.011 | 11(C) | 0.006 | 0.0046 | 0.0053 | −0.0014 |
| 12(H) | 0.0185 | 0.0075 | 0.013 | −0.011 | 12(C) | 0.0936 | 0.0664 | 0.08 | −0.0271 |
| 13(H) | 0.0183 | 0.0134 | 0.0159 | −0.0049 | 13(C) | 0.0146 | 0.0109 | 0.0127 | −0.0037 |
| 14(H) | 0.0183 | 0.0134 | 0.0158 | −0.0049 | 14(C) | 0.0047 | 0.0025 | 0.0036 | −0.0022 |
| 15(H) | 0.0176 | 0.0059 | 0.0118 | −0.0118 | 15(C) | 0.0812 | 0.0544 | 0.0678 | −0.0268 |
| 16(H) | 0.0176 | 0.0059 | 0.0118 | −0.0118 | 16(C) | 0.016 | 0.018 | 0.017 | 0.002 |
| 17(H) | 0.0445 | 0.069 | 0.0567 | 0.0246 | 17(C) | 0.0936 | 0.0713 | 0.0824 | −0.0222 |
| 18(H) | 0.0445 | 0.069 | 0.0567 | 0.0246 | 18(C) | 0.024 | 0.1014 | 0.0627 | 0.0774 |
| 19(H) | 0.0401 | 0.0126 | 0.0263 | −0.0275 | 19(C) | 0.0819 | 0.0561 | 0.069 | −0.0259 |
| 20(H) | 0.0175 | 0.0058 | 0.0116 | −0.0117 | 20(C) | 0.0061 | 0.0032 | 0.0047 | −0.003 |
| 21(H) | 0.0175 | 0.0058 | 0.0116 | −0.0117 | 21(H) | 0.0065 | 0.0057 | 0.0061 | −7.00 × 10⁻⁴ |
| 22(H) | 0.116 | 0.1135 | 0.1148 | −0.0025 | 22(H) | 0.0027 | 0.0032 | 0.0029 | 5.00 × 10⁻⁴ |
| 23(H) | 0.0094 | 0.0079 | 0.0087 | −0.0015 | |||||
| 24(H) | 0.005 | 0.0045 | 0.0048 | −5.00 × 10⁻⁴ | |||||
| 25(H) | 0.0044 | 0.0055 | 0.005 | 0.0011 | |||||
| 26(H) | 0.0068 | 0.0072 | 0.007 | 5.00 × 10⁻⁴ | |||||
| 27(H) | 0.0116 | 0.0089 | 0.0103 | −0.0027 | |||||
| 28(H) | 0.0041 | 0.004 | 0.0041 | −1.00 × 10⁻⁴ | |||||
| 29(H) | 0.0029 | 0.0055 | 0.0042 | 0.0026 | |||||
| 30(H) | 0.0049 | 0.0068 | 0.0058 | 0.0019 | |||||
| 31(H) | 0.0103 | 0.0076 | 0.009 | −0.0027 | |||||
| 32(H) | 0.0286 | 0.0211 | 0.0248 | −0.0075 | |||||
| 33(H) | 0.0117 | 0.0303 | 0.021 | 0.0185 | |||||
| 34(H) | 0.0105 | 0.0291 | 0.0198 | 0.0186 | |||||
| 35(H) | 0.0032 | 0.0022 | 0.0027 | −0.001 | |||||
| 36(H) | 0.012 | 0.0097 | 0.0109 | −0.0023 | |||||
| 37(H) | 0.0094 | 0.0082 | 0.0088 | −0.0011 | |||||
| 38(H) | 0.0028 | 0.0012 | 0.002 | −0.0016 | |||||
| 39(H) | 0.0359 | 0.0292 | 0.0326 | −0.0067 | |||||
| 40(H) | 0.0087 | 0.0063 | 0.0075 | −0.0024 | |||||
| 41(H) | 0.0294 | 0.0225 | 0.026 | −0.0069 | |||||
| 42(H) | 0.0071 | 0.0062 | 0.0067 | −9.00 × 10⁻⁴ | |||||
| 43(H) | 0.0013 | −4.00 × 10⁻⁴ | 5.00 × 10⁻⁴ | −0.0017 | |||||
| 44(H) | 0.0311 | 0.0263 | 0.0287 | −0.0048 | |||||
| 45(H) | 0.0135 | 0.0112 | 0.0124 | −0.0024 | |||||
| 46(H) | 0.0258 | 0.0348 | 0.0303 | 0.0089 | |||||
| 47(H) | 0.0362 | 0.031 | 0.0336 | −0.0052 | |||||
| 48(H) | 0.032 | 0.0267 | 0.0293 | −0.0054 | |||||
| 49(H) | 0.0073 | 0.0063 | 0.0068 | −0.001 | |||||
| 50(H) | 0.0096 | 0.0058 | 0.0077 | −0.0038 | |||||
| 51(H) | 0.0018 | −0.0014 | 2.00 × 10⁻⁴ | −0.0032 | |||||
| 52(H) | 0.0154 | 0.0268 | 0.0211 | 0.0114 | |||||
| (c) | (d) | ||||||||
|---|---|---|---|---|---|---|---|---|---|
| Atoms | Δf(r) | Atoms | Δf(r) | ||||||
| 1(C) | 0.0148 | 0.0089 | 0.0119 | −0.0059 | 1(C) | 0.0104 | 0.0101 | 0.0103 | −2.00 × 10⁻⁴ |
| 2(C) | 0.0139 | 0.0139 | 0.0139 | 1.00 × 10⁻⁴ | 2(C) | 0.0189 | 0.0181 | 0.0185 | −7.00 × 10⁻⁴ |
| 3(C) | 0.0294 | 0.0232 | 0.0263 | −0.0062 | 3(C) | 0.0401 | 0.0738 | 0.057 | 0.0337 |
| 4(C) | 0.0196 | 0.0175 | 0.0186 | −0.0021 | 4(C) | 0.0143 | 0.0164 | 0.0153 | 0.0021 |
| 5(C) | 0.1282 | 0.1429 | 0.1356 | 0.0147 | 5(C) | 0.0063 | 0.0094 | 0.0078 | 0.0031 |
| 6(C) | 0.216 | 0.1987 | 0.2074 | −0.0173 | 6(C) | 0.0603 | 0.062 | 0.0611 | 0.0018 |
| 7(C) | 0.0251 | 0.0211 | 0.0231 | −0.004 | 7(C) | 0.0542 | 0.057 | 0.0556 | 0.0028 |
| 8(C) | 0.0334 | 0.0286 | 0.031 | −0.0048 | 8(C) | 0.0131 | 0.015 | 0.0141 | 0.002 |
| 9(C) | 0.0169 | 0.0132 | 0.0151 | −0.0037 | 9(C) | 0.0395 | 0.0752 | 0.0574 | 0.0357 |
| 10(C) | 0.0248 | 0.0188 | 0.0218 | −0.0061 | 10(C) | 0.0168 | 0.0164 | 0.0166 | −4.00 × 10⁻⁴ |
| 11(H) | 0.0274 | 0.0285 | 0.0279 | 0.0011 | 11(C) | 0.0171 | 0.0203 | 0.0187 | 0.0031 |
| 12(H) | 0.0172 | 0.0152 | 0.0162 | −0.002 | 12(C) | 0.0857 | 0.0352 | 0.0604 | −0.0505 |
| 13(H) | 0.0368 | 0.0381 | 0.0375 | 0.0014 | 13(C) | 0.089 | 0.0294 | 0.0592 | −0.0596 |
| 14(H) | 0.0187 | 0.0167 | 0.0177 | −0.0021 | 14(C) | 0.0133 | 0.0168 | 0.015 | 0.0034 |
| 15(H) | 0.0348 | 0.0349 | 0.0348 | 2.00 × 10⁻⁴ | 15(C) | 0.022 | 0.0154 | 0.0187 | −0.0067 |
| 16(H) | 0.0152 | 0.0143 | 0.0147 | −9.00 × 10⁻⁴ | 16(H) | 0.0347 | 0.027 | 0.0308 | −0.0077 |
| 17(H) | 0.0162 | 0.0145 | 0.0153 | −0.0017 | 17(H) | 0.0139 | 0.0144 | 0.0141 | 4.00 × 10⁻⁴ |
| 18(H) | 0.0644 | 0.0731 | 0.0687 | 0.0087 | 18(H) | 0.0141 | 0.0288 | 0.0215 | 0.0147 |
| 19(H) | 0.0617 | 0.0709 | 0.0663 | 0.0092 | 19(H) | 0.0179 | 0.0292 | 0.0236 | 0.0113 |
| 20(H) | 0.0273 | 0.0329 | 0.0301 | 0.0056 | 20(H) | 0.0108 | 0.0141 | 0.0125 | 0.0033 |
| 21(H) | 0.041 | 0.0574 | 0.0492 | 0.0164 | 21(H) | 0.0171 | 0.018 | 0.0175 | 8.00 × 10⁻⁴ |
| 22(H) | 0.0184 | 0.0175 | 0.018 | −9.00 × 10⁻⁴ | 22(H) | 0.0169 | 0.0227 | 0.0198 | 0.0058 |
| 23(H) | 0.0183 | 0.0168 | 0.0175 | −0.0015 | 23(H) | 0.0147 | 0.015 | 0.0148 | 3.00 × 10⁻⁴ |
| 24(H) | 0.0305 | 0.0305 | 0.0305 | 0 | 24(H) | 0.0026 | 0.0092 | 0.0059 | 0.0066 |
| 25(H) | 0.018 | 0.0173 | 0.0177 | −7.00 × 10⁻⁴ | 25(H) | 0.0225 | 0.0269 | 0.0247 | 0.0044 |
| 26(H) | 0.0322 | 0.0346 | 0.0334 | 0.0024 | 26(H) | 0.0263 | 0.0338 | 0.03 | 0.0075 |
| 27(H) | 0.0158 | 0.0164 | 0.0161 | 7.00 × 10⁻⁴ | |||||
| 28(H) | 0.0209 | 0.0331 | 0.027 | 0.0122 | |||||
| 29(H) | 0.0331 | 0.0355 | 0.0343 | 0.0024 | |||||
| 30(H) | 0.017 | 0.0143 | 0.0156 | −0.0027 | |||||
| 31(H) | 0.0326 | 0.031 | 0.0318 | −0.0017 | |||||
| 32(H) | 0.0273 | 0.0213 | 0.0243 | −0.006 | |||||
| 33(H) | 0.0229 | 0.015 | 0.019 | −0.0079 | |||||
| 34(H) | 0.0147 | 0.014 | 0.0143 | −7.00 × 10⁻⁴ | |||||
| 35(H) | 0.0131 | 0.0183 | 0.0157 | 0.0052 | |||||
| 36(H) | 0.0273 | 0.0327 | 0.03 | 0.0054 | |||||
| 37(H) | 0.0312 | 0.0157 | 0.0235 | −0.0155 | |||||
| 38(H) | 0.0332 | 0.0274 | 0.0303 | −0.0059 | |||||
| 39(H) | 0.0185 | 0.0156 | 0.0171 | −0.0028 | |||||
Publisher’s Note: MDPI stays neutral with regard to jurisdictional claims in published maps and institutional affiliations. |
© 2022 by the authors. Licensee MDPI, Basel, Switzerland. This article is an open access article distributed under the terms and conditions of the Creative Commons Attribution (CC BY) license (https://creativecommons.org/licenses/by/4.0/).
Share and Cite
Demirpolat, A.; Akman, F.; Kazachenko, A.S. An Experimental and Theoretical Study on Essential Oil of Aethionema sancakense: Characterization, Molecular Properties and RDG Analysis. Molecules 2022, 27, 6129. https://doi.org/10.3390/molecules27186129
Demirpolat A, Akman F, Kazachenko AS. An Experimental and Theoretical Study on Essential Oil of Aethionema sancakense: Characterization, Molecular Properties and RDG Analysis. Molecules. 2022; 27(18):6129. https://doi.org/10.3390/molecules27186129
Chicago/Turabian StyleDemirpolat, Azize, Feride Akman, and Aleksandr S. Kazachenko. 2022. "An Experimental and Theoretical Study on Essential Oil of Aethionema sancakense: Characterization, Molecular Properties and RDG Analysis" Molecules 27, no. 18: 6129. https://doi.org/10.3390/molecules27186129
APA StyleDemirpolat, A., Akman, F., & Kazachenko, A. S. (2022). An Experimental and Theoretical Study on Essential Oil of Aethionema sancakense: Characterization, Molecular Properties and RDG Analysis. Molecules, 27(18), 6129. https://doi.org/10.3390/molecules27186129