Abstract
Aspergillus oryzae (A. oryzae) is an important starter in the fermentation of koji and moromi. However, the effect of different A. oryzae strains on the quality of moromi has rarely been studied. For this reason, this study analyzed the physicochemical properties, enzyme activity, sensory quality, and metabolite profiles of moromi samples fermented using two strains (A. oryzae KCCM12012P (moromi-1) and KCCM12804P (moromi-2)), which were newly isolated from fermented soy foods, and compared them to those of a commercialized A. oryzae strain (control). Amino-type nitrogen contents of moromi-1 and moromi-2 samples were higher than that of control moromi, and their amylase and protease activities were also higher. Moreover, metabolite profiles of moromi were significantly altered according to strains. In particular, the levels of many amino acids, peptides, nucleotides, and acidic compounds were altered, which resulted in changes in the sensory quality of moromi. Although volatile compounds were not investigated, the results suggested that the quality of moromi was significantly different for newly isolated strains, especially A. oryzae KCCM12804P, and they were superior to the commercial strain in terms of taste-related substances. Therefore, these strains could be used as good starters to produce moromi and soy sauce with good sensory quality.
1. Introduction
Fermented foods, which have become an important part of the diet globally, are produced by means of various controlled microorganisms. During fermentation, large molecules, including proteins, carbohydrates, and lipids in the fermenting materials, are generally broken down into smaller molecules by enzymes released from microorganisms, while secondary plant metabolites can be converted to other compounds [1,2]. The fermentation process gives fermented foods a unique flavor, enhances nutritional value, and improves functional properties [3,4]. Moreover, fermented food intervention studies and large cohort studies have found that the consumption of fermented foods is positively associated with a reduction in the risk of obesity-related diseases, cardiovascular diseases, diabetes, and overall mortality [5,6]. There are many different types of fermented foods according to fermentation methods and materials, such as dairy products, meat, fish, and plants, such as vegetables, fruits, and beans [7,8].
Among fermented foods, soy sauce, with its strong umami taste, is one of the most important liquid condiments, and it has been traditionally made from fermented soybean paste, grains, and brine using mold, such as Aspergillus oryzae (A. oryzae) and Aspergillus sojae [9], although some commercial soy sauces are made by fermentation or by chemical hydrolysis [10]. The process of making soy sauce varies from one country to another, but in general, it undergoes the following three stages: koji, moromi fermentation, and aging [11].
Koji is produced by mold inoculation, such as A. oryzae and Aspergillus sojae, on roasted soybean and wheat [11]. Koji is continuously soaked in brine and fermented for several months to 4 years, and this process is called moromi fermentation [11]. The fermented moromi is aged for months to years to produce a unique taste and soy sauce flavor [12]. In these processes, koji and moromi fermentation are important steps because the physicochemical and flavor properties of moromi fermented by mold are closely correlated with the quality of soy sauce [11]. Moromi fermentation is generally affected by many factors, including fermentation conditions, raw materials, and fermentation period, but mold is the most significant one [10,11]. Furthermore, among various molds, A. oryzae plays an important role in the production of koji and moromi fermentation [11,13].
A. oryzae, a safe filamentous fungus recognized by the Food and Drug Administration and the World Health Organization [14], is widely used as a starter for koji production [14] because it secretes enzymes needed to hydrolyze soy polysaccharides and proteins without the production of aflatoxins [15,16]. Various A. oryzae strains have been isolated and selected for soy fermentation, and their general characteristics and effect on the quality of fermented products have been widely investigated [17,18]. Previous studies examined the effect of different A. oryzae strains on the quality of fermented foods, such as rice wine [19], soy sauce [20], and soybean koji [21]. However, the effect of A. oryzae strains on the production of sensory-related metabolites and taste quality of moromi has rarely been studied.
Therefore, in this study, two new A. oryzae strains were isolated from fermented soybean paste, and the quality of moromi fermented by each strain was compared with that of a commercial strain (A. oryzae KACC47838) [22]. The general characteristics, sensory properties, enzymatic activities, and metabolite profiles of moromi fermented by different A. oryzae strains were analyzed, and their correlation was investigated. Moreover, the metabolomic pathway of moromi with different A. oryzae strains was proposed.
2. Results and Discussion
2.1. Isolation and Identification of A. oryzae
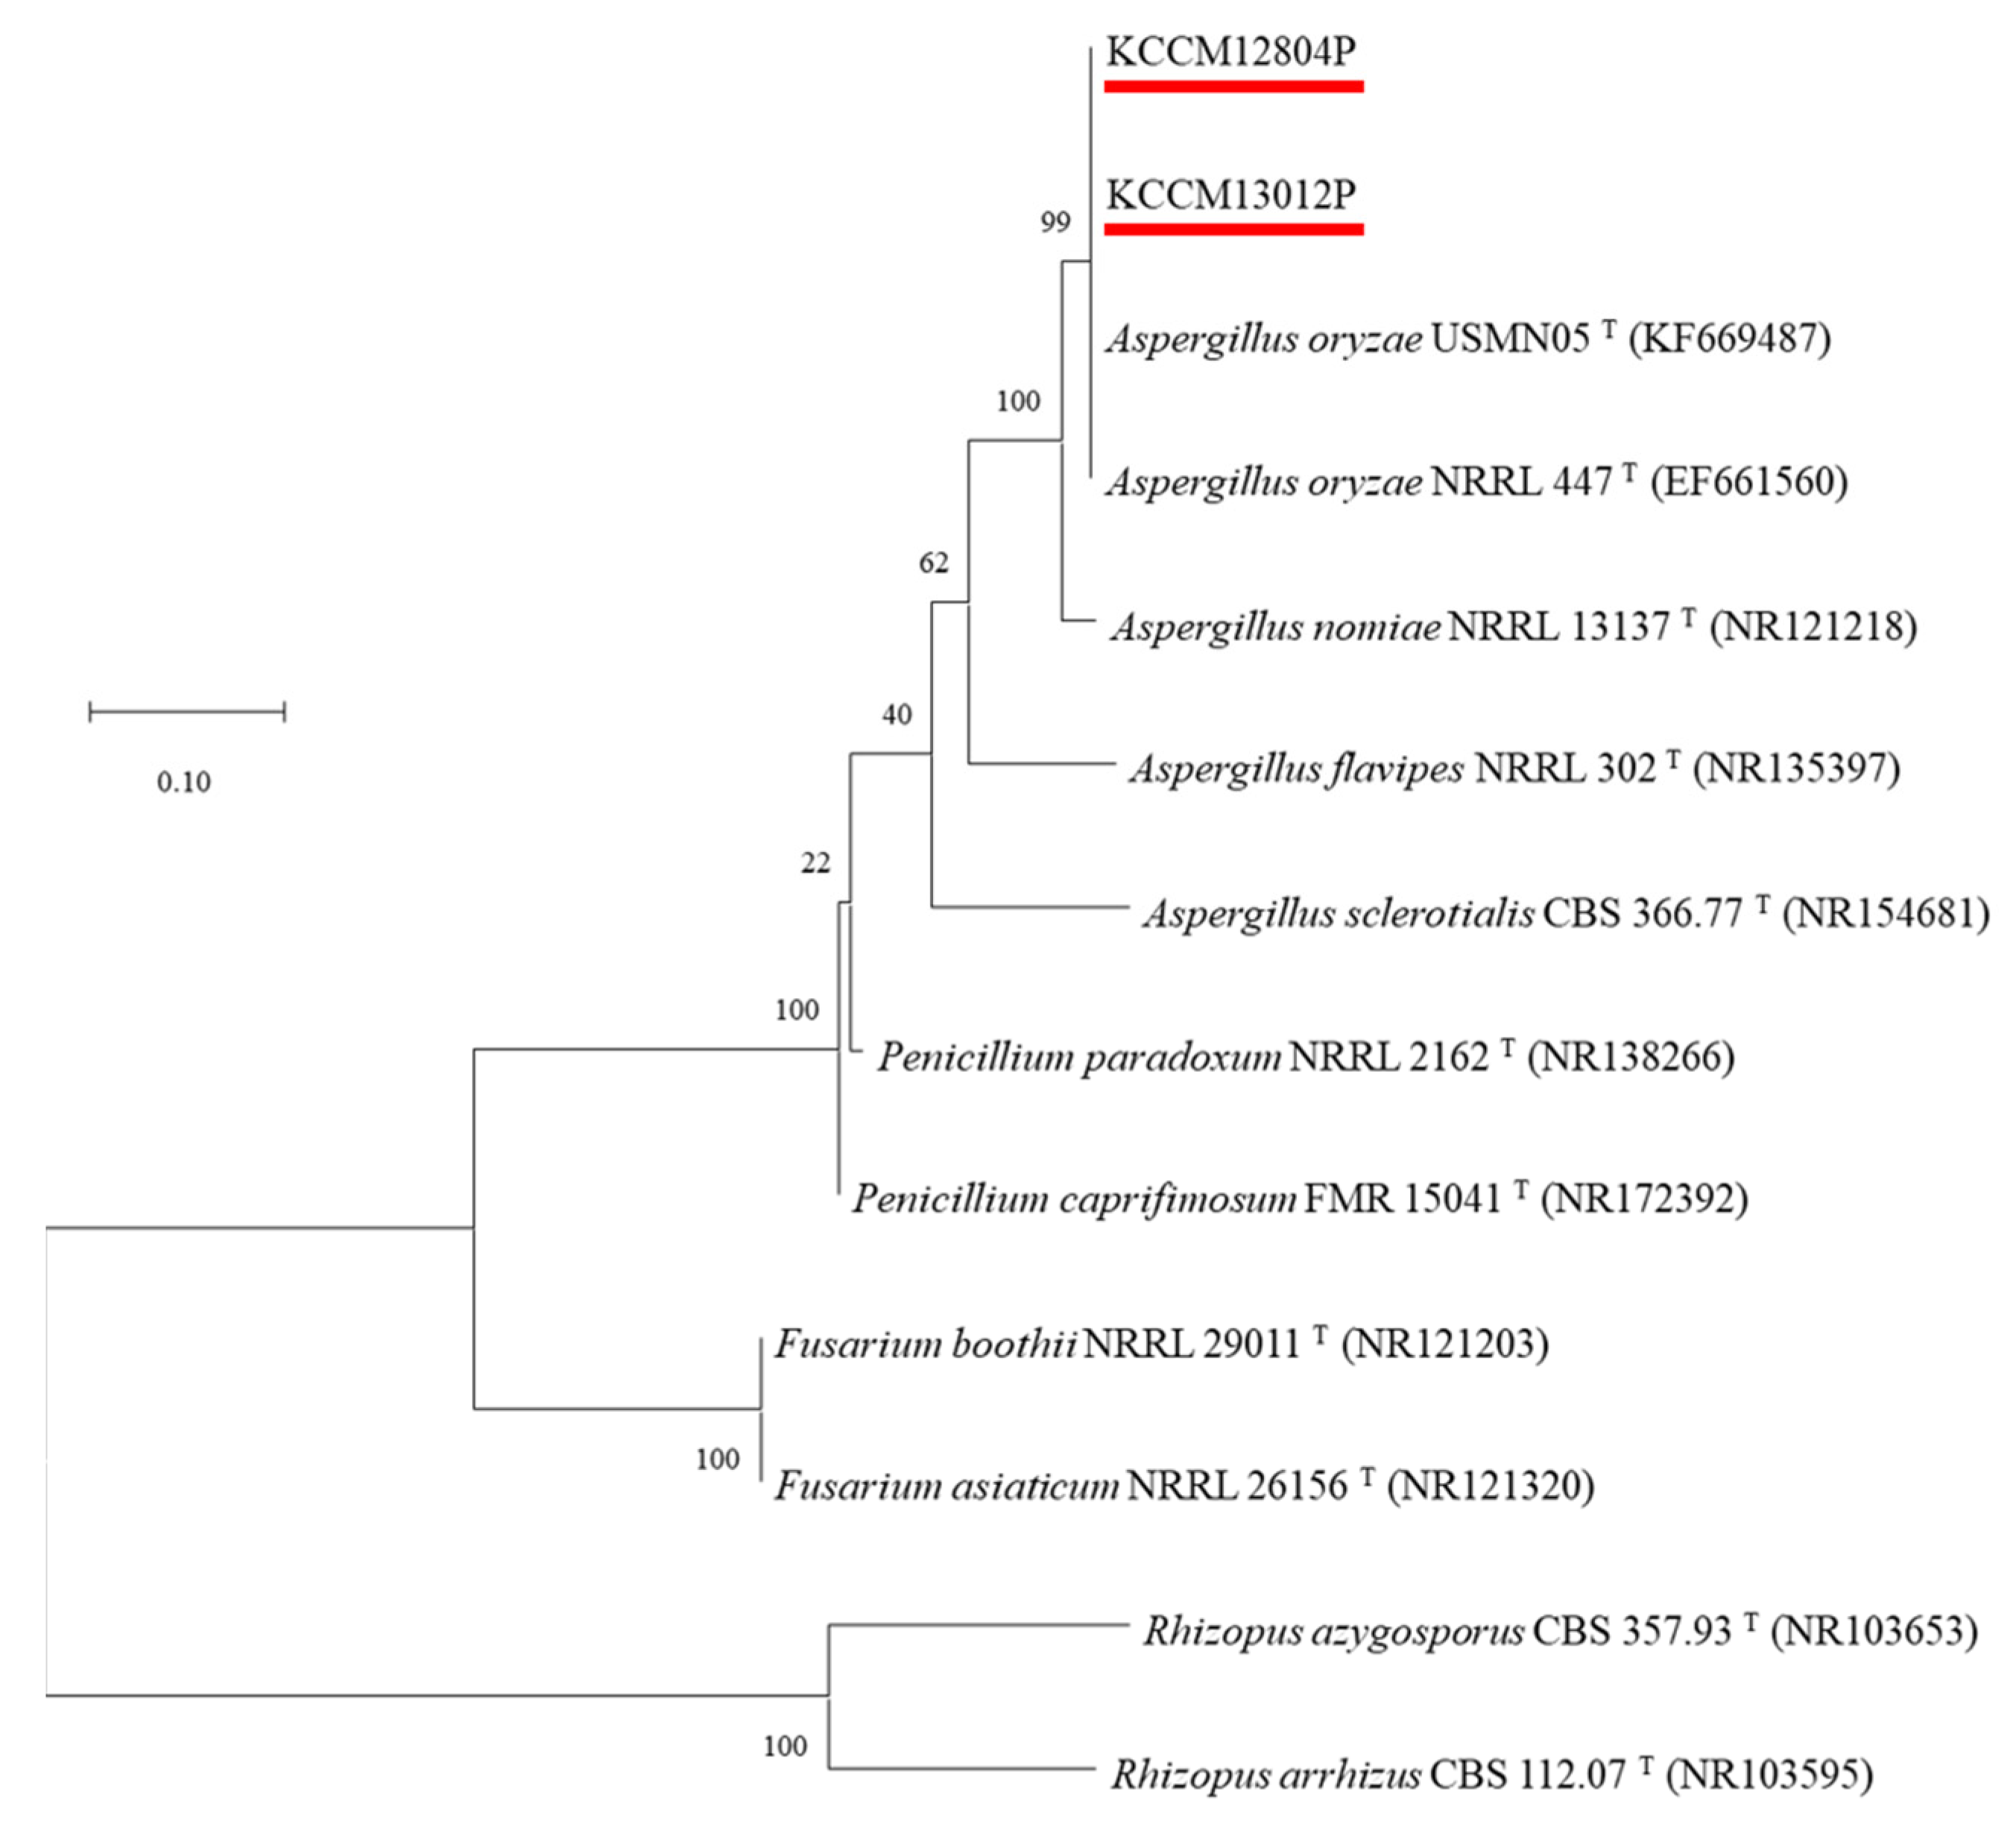
Two mold strains isolated from traditional soybean paste were identified by ITS gene sequencing (Figure S1). Gene sequencing of two isolated molds showed 99% similarity with that of A. oryzae strains, including USMN05T (KF669487), NRRL447T (EF661560), and NRRL13137T (NR121218). In addition, two isolated molds belonged to A. oryzae by the phylogenetic tree constructed with the ITS gene sequencing, and they were named A. oryzae KCCM13012P and A. oryzae KCCM12804P (Figure 1). Aspergillus species are mostly founded in fermented soybean products, including soy sauce [23] and soybean paste [24], and they are recommended as an ideal mold for the fermentation industry because of their various secretory hydrolytic enzymes and non-pathogenic properties [16].

Figure 1.
Phylogenetic tree based on internal transcribed spacer sequence (ITS-1) of KCCM13012P and KCCM12804P, and other Aspergillus type strains. GenBank accession numbers are given in parentheses and the branching pattern was generated by the maximum likelihood method. Bar means 0.10 substitutions per nucleotide position, and bootstrap values are expressed as percentages of 1000 replicates.
2.2. Physiochemical Properties and Enzymatic Activities
The physiochemical properties of moromi fermented with different A. oryzae strains are presented in Table 1. The pH of the moromi samples fermented with A. oryzae KCCM13012P (moromi-1) or KCCM12804P (morimi-2) was 6.44 and 6.17, respectively, and their total acidities were 2.39% and 2.41%, respectively. These values are not much different from those of the control moromi (pH 6.41 and 2.08%). However, the amino-type nitrogen in moromi-1 (2061.93 mg%) and moromi-2 (2221.47 mg%) was higher than that of control moromi (1175.11 mg%), whereas the salinity and moisture content of samples did not indicate a significant difference. The color of moromi was significantly different according to A. oryzae strains. Compared with L*, a*, and b* values (82.07, 2.16, and 13.48, respectively) of the control moromi, moromi-1 was brighter in color, and its color values were 89.00 (L*), 0.29 (a*), and 11.75 (b*), whereas moromi-2 with 68.38 of L*, 6.89 of a*, and 19.19 of b* was darker in color. In addition, the browning index of moromi-2 (39.81) was 2.0 and 2.8 times higher than that of control moromi (19.50) and moromi-1 (14.07), respectively. In general, the browning during soybean fermentation, including moromi, is related to non-enzymatic browning, the Maillard reaction, which occurs from the reaction between hydrolyzed amino acids and sugars from raw material by microbial enzymes [25]. In particular, the degree of browning in fermented food depends on the abundance of amino acids and sugars hydrolyzed by enzymes [26], and previous studies have reported that the degree of browning depends on the strain used in fermentation, including soy sauce [27] and soybean paste [28].

Table 1.
Physiochemical characteristics and enzymatic activities of the moromi fermented with different Aspergillus oryzae strains.
Hydrolytic enzymes from microorganisms play an important role in soybean fermentation because they are involved in the production of reducing sugars, amino acids, and their derivatives [29]. Especially, A. oryzae is well-known for producing high levels of hydrolytic enzymes, including amylase and protease [30]. α-Amylase and protease activities of moromi fermented with different A. oryzae strains are presented in Table 1. The α-amylase activities of moromi-1 (1046.78 unit/g) and moromi-2 (960.36 unit/g) were slightly higher than that of control moromi (952.57 unit/g), while the protease activity of moromi-2 (1237.15 unit/g) was higher than that of control moromi (1192.53 unit/g) and moromi-1 (1022.75 unit/g). Similarly, it was reported that the enzyme activities, including α-amylase, peptidase, and protease, differed depending on A. oryzae strains in rice koji [19] and soybean koji [21]. The hydrolytic enzyme activity of moromi is closely related to the specificity of A. oryzae strains, depending on the gene expression patterns of enzymes [13].
2.3. Sensory Evaluation
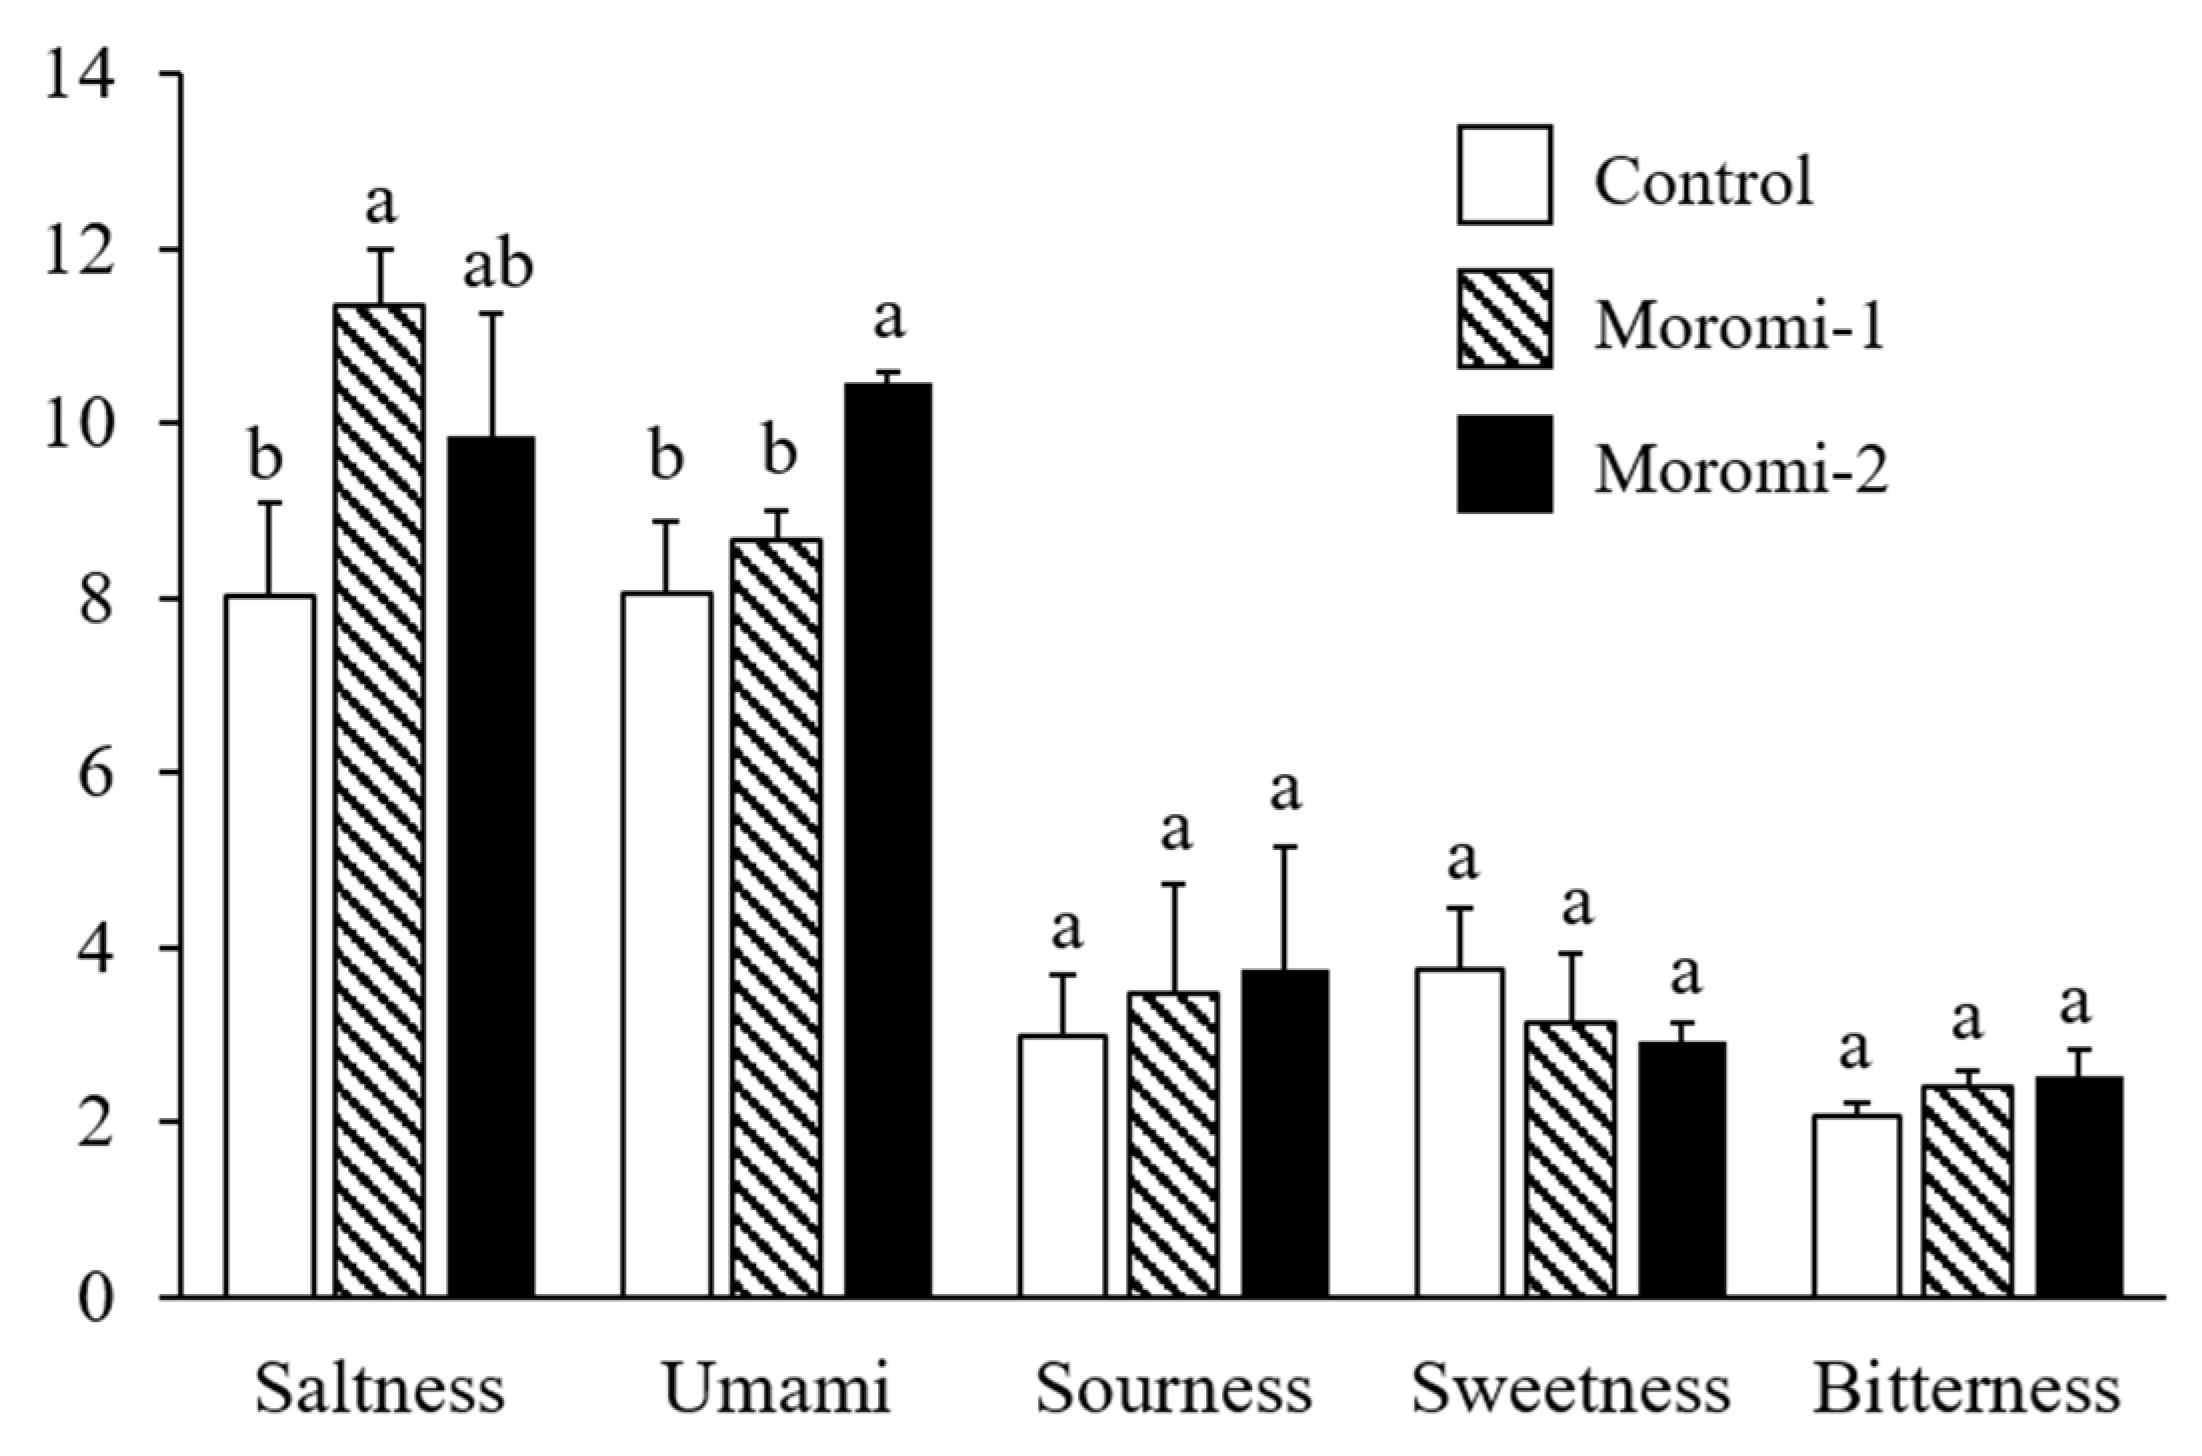
The tastes of moromi samples fermented with different A. oryzae strains were evaluated (Figure 2). Three A. oryzae strains did not contribute to the differences in sourness, sweetness, and bitterness of moromi samples. However, moromi-1 and moromi-2 samples showed a saltier taste than a commercial moromi. In addition, the umami taste of moromi-2 was stronger than that of the other moromi samples. Saltiness and umami are mostly determined tastes in fermented soy products, including soy sauce [31,32] and soybean paste [33], and these tastes are related to metabolite profiles formed by microbial metabolism [31,32]. Many previous studies confirmed that the small metabolites, including sugars, acidic compounds, amino acids, and peptides produced during fermentation, contributed to the sensory qualities of fermented foods, such as soy sauce [34] and soybean paste [35]. To examine the correlation between moromi metabolites and sensory quality, the metabolite profiles of moromi samples fermented with different A. oryzae strains were analyzed.

Figure 2.
Quantitative descriptive sensory analysis of moromi samples prepared with different A. oryzae strains. Control, moromi-1, and moromi-2 are moromi samples fermented by commercial strain, A. oryzae KCCM13012P, and A. oryzae KCCM12804P, respectively. The intensity of each sensory quality was rated on a 15 cm line scale, labeled “very weak” and “very strong”, with 0.5 cm anchors on the left and right sides. For each taste, the different letters (a and b) in each bar indicate significant difference according to Duncan’s multiple test (p < 0.05).
2.4. Metabolomic Analysis
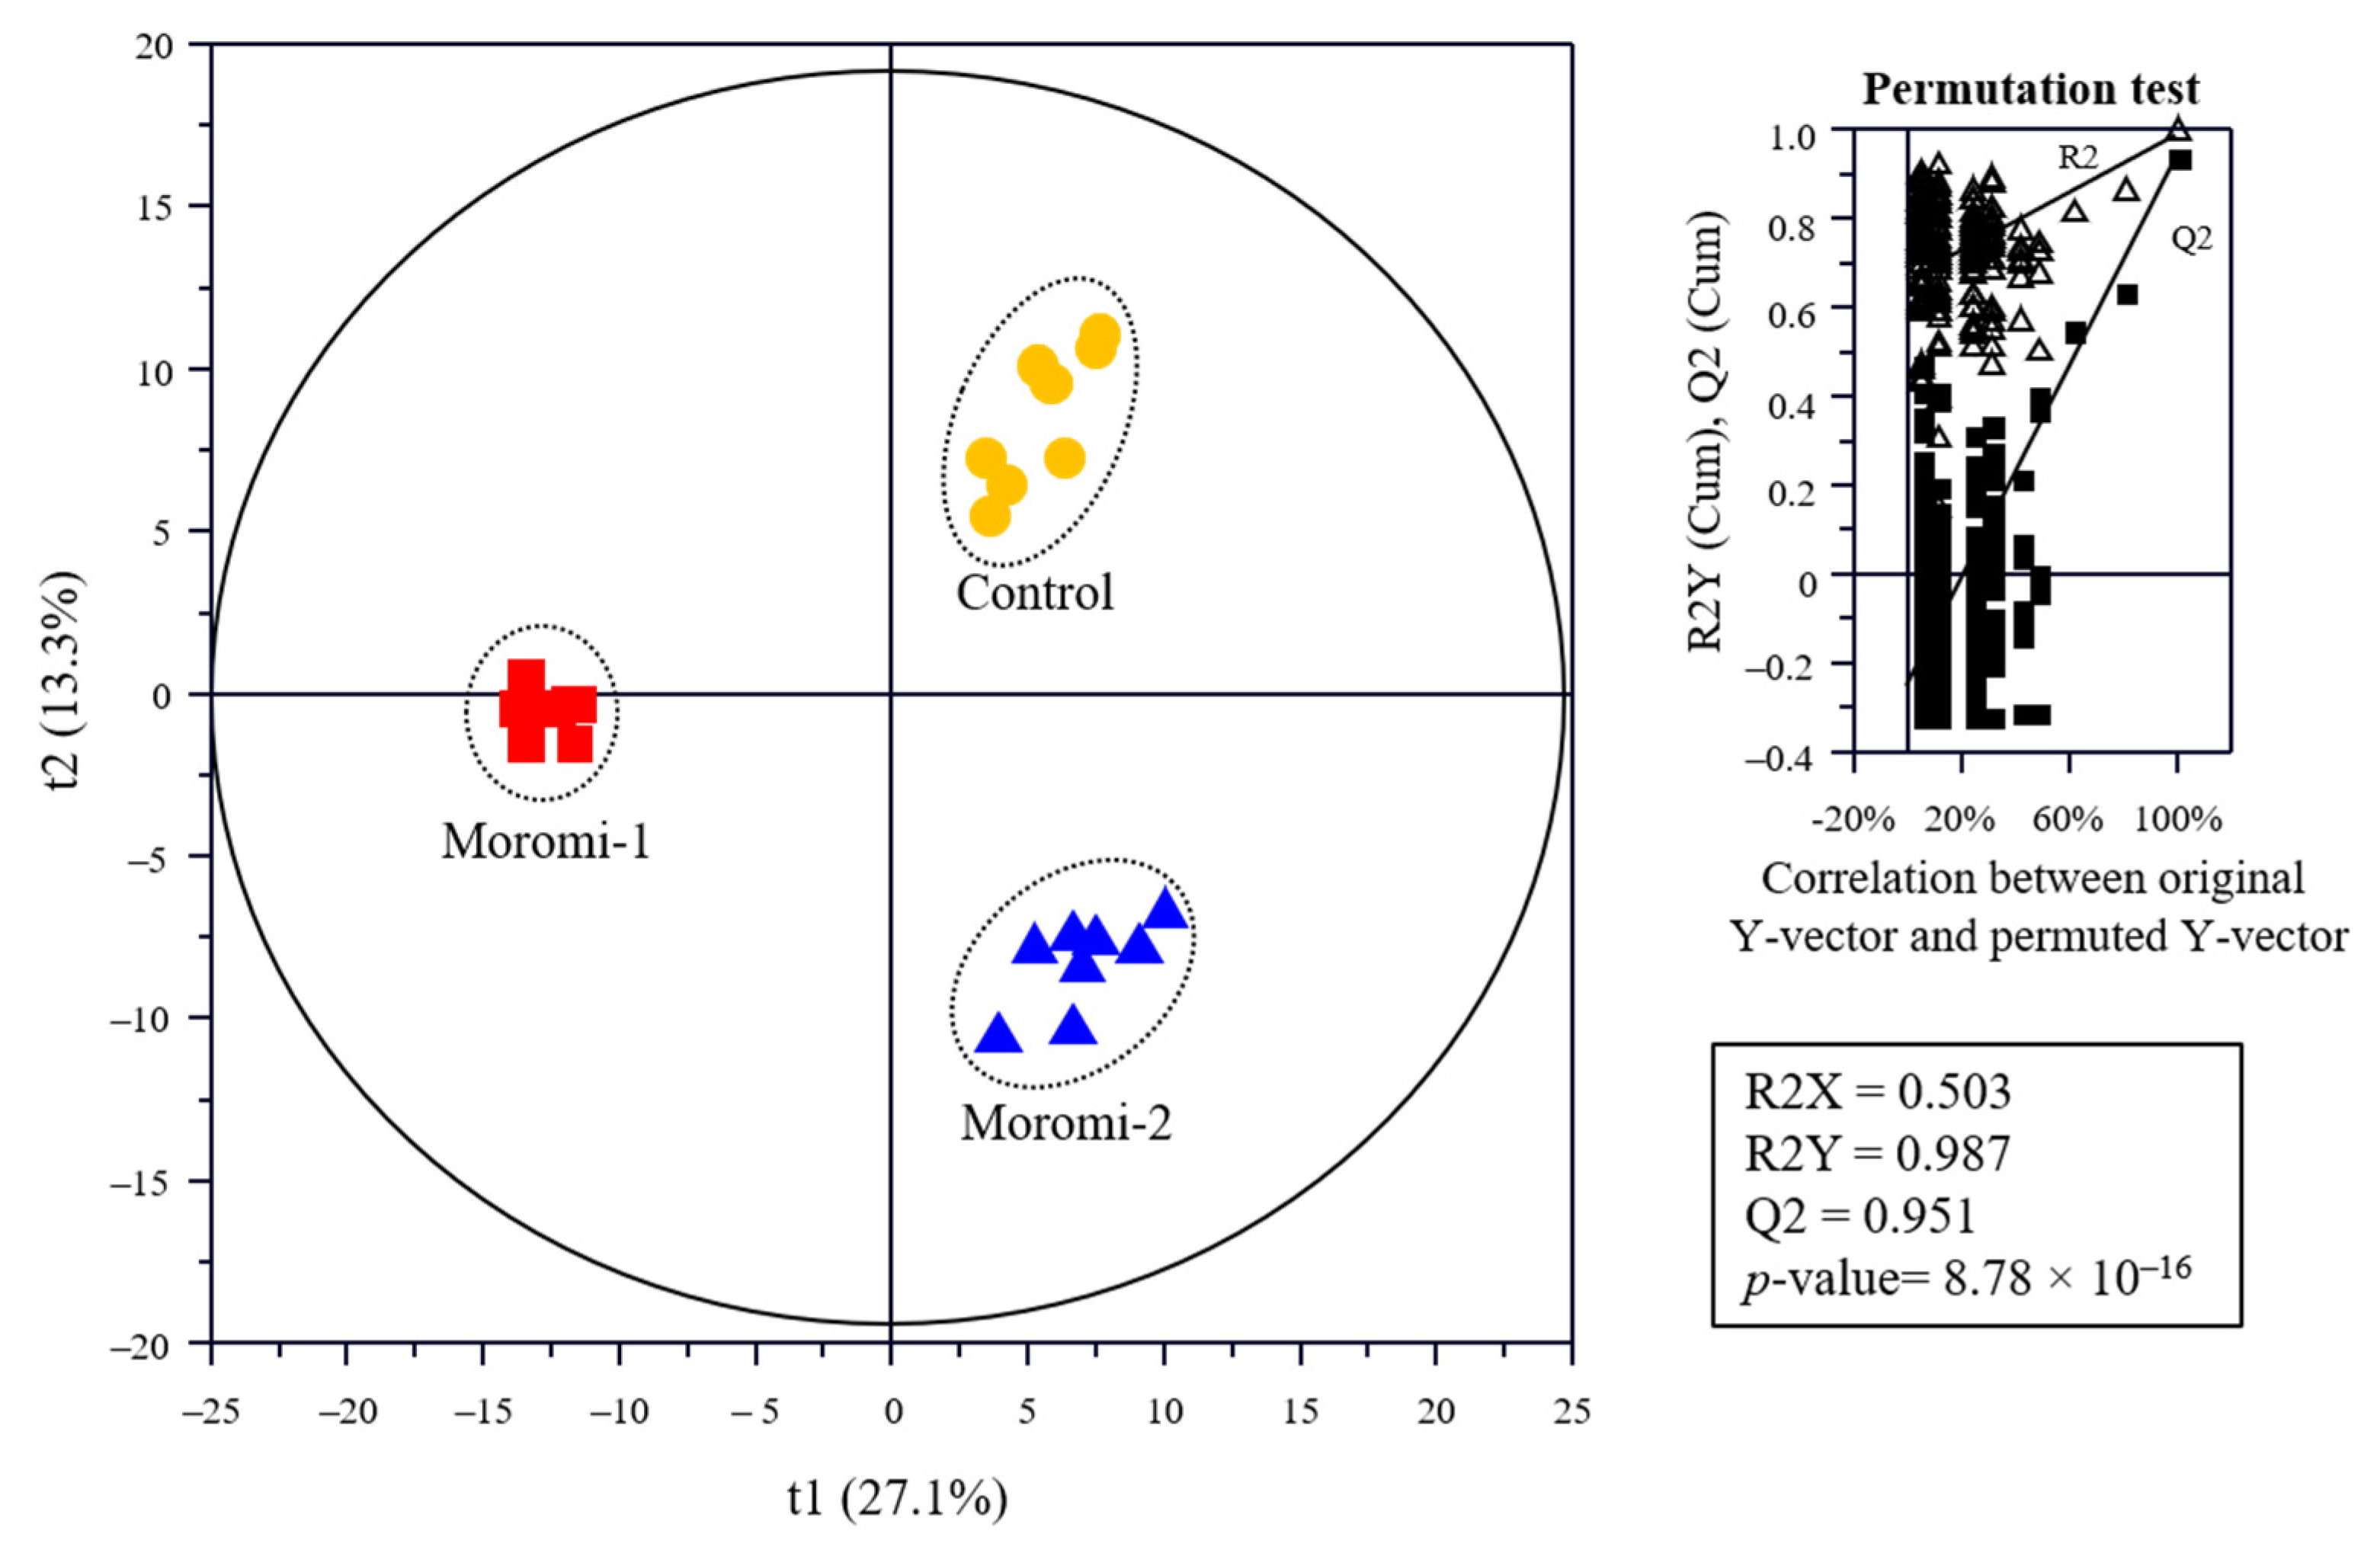
The metabolite profiles in moromi samples fermented with different A. oryzae strains were analyzed using an amino acid analyzer, high performance liquid chromatography (HPLC), gas chromatography (GC)-mass spectrometry (MS), and ultra-high-performance liquid chromatography-quadrupole-time-of-flight (UPLC-Q-TOF) MS, and based on metabolite profiles, the discrimination of moromi samples was visualized using the Partial least-squares discriminant analysis (PLS-DA) score plot (Figure 3). The goodness of fit (R2X = 0.503; R2Y = 0.987), predictability (Q2 = 0.951), p-value (8.78 × 10⁻⁷), and the cross-validation (y intercepts of R2 < 0.5 and Q2 < −0.2) determined by the permutation test (n = 200) indicated that the PLS-DA model was statistically acceptable (Figure 3). In the PLS-DA score plot, three moromi samples were clearly separated from each other by t(1) and t(2). The VIP and p-values of individual metabolites were analyzed to find metabolites that contributed to the difference between moromi samples (Table 2 and Tables S1–S3). Sixty-six metabolites, including 30 amino acids, 16 peptides, 6 nucleotides, 5 sugars, 4 acidic compounds, 2 lipids, 1 isoflavones, and ammonia were identified, and their VIP and p-values were VIP ≥ 0.83 and p-value < 0.05, respectively. Similar metabolite profiles were observed in previous studies on the fermentation of soybean by A. oryzae KACC 46102 [18] and A. oryzae KCTC6983 [36]. In addition, the normalized chromatogram intensities between moromi samples fermented with different A. oryzae strains were compared (Figure 4), and their fold changes were calculated against the commercial strain (Table 2).
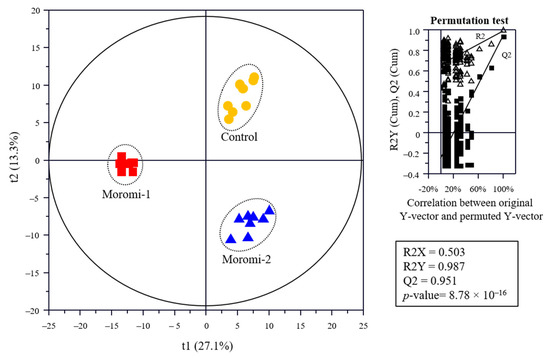
Figure 3.
Partial least-squares discriminant analysis (PLS-DA) score plot of metabolites of the moromi fermented with different A. oryzae strains and its quality parameters. Control, moromi-1, and moromi-2 are moromi samples fermented by commercial strain, A. oryzae KCCM13012P, and A. oryzae KCCM12804P, respectively. Metabolites were analyzed using GC-MS, UPLC-Q-TOF MS, amino acid analyzer, and HPLC. The qualification of the PLS-DA model was evaluated using R2X, R2Y, Q2, and p-value and validated using cross validation with a permutation test (n = 200).
Table 2.
Identification of major metabolites contributing to the separation of samples on the PLS-DA score plots and their fold change.
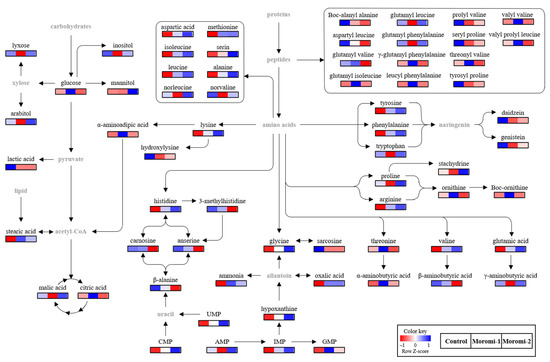
Figure 4.
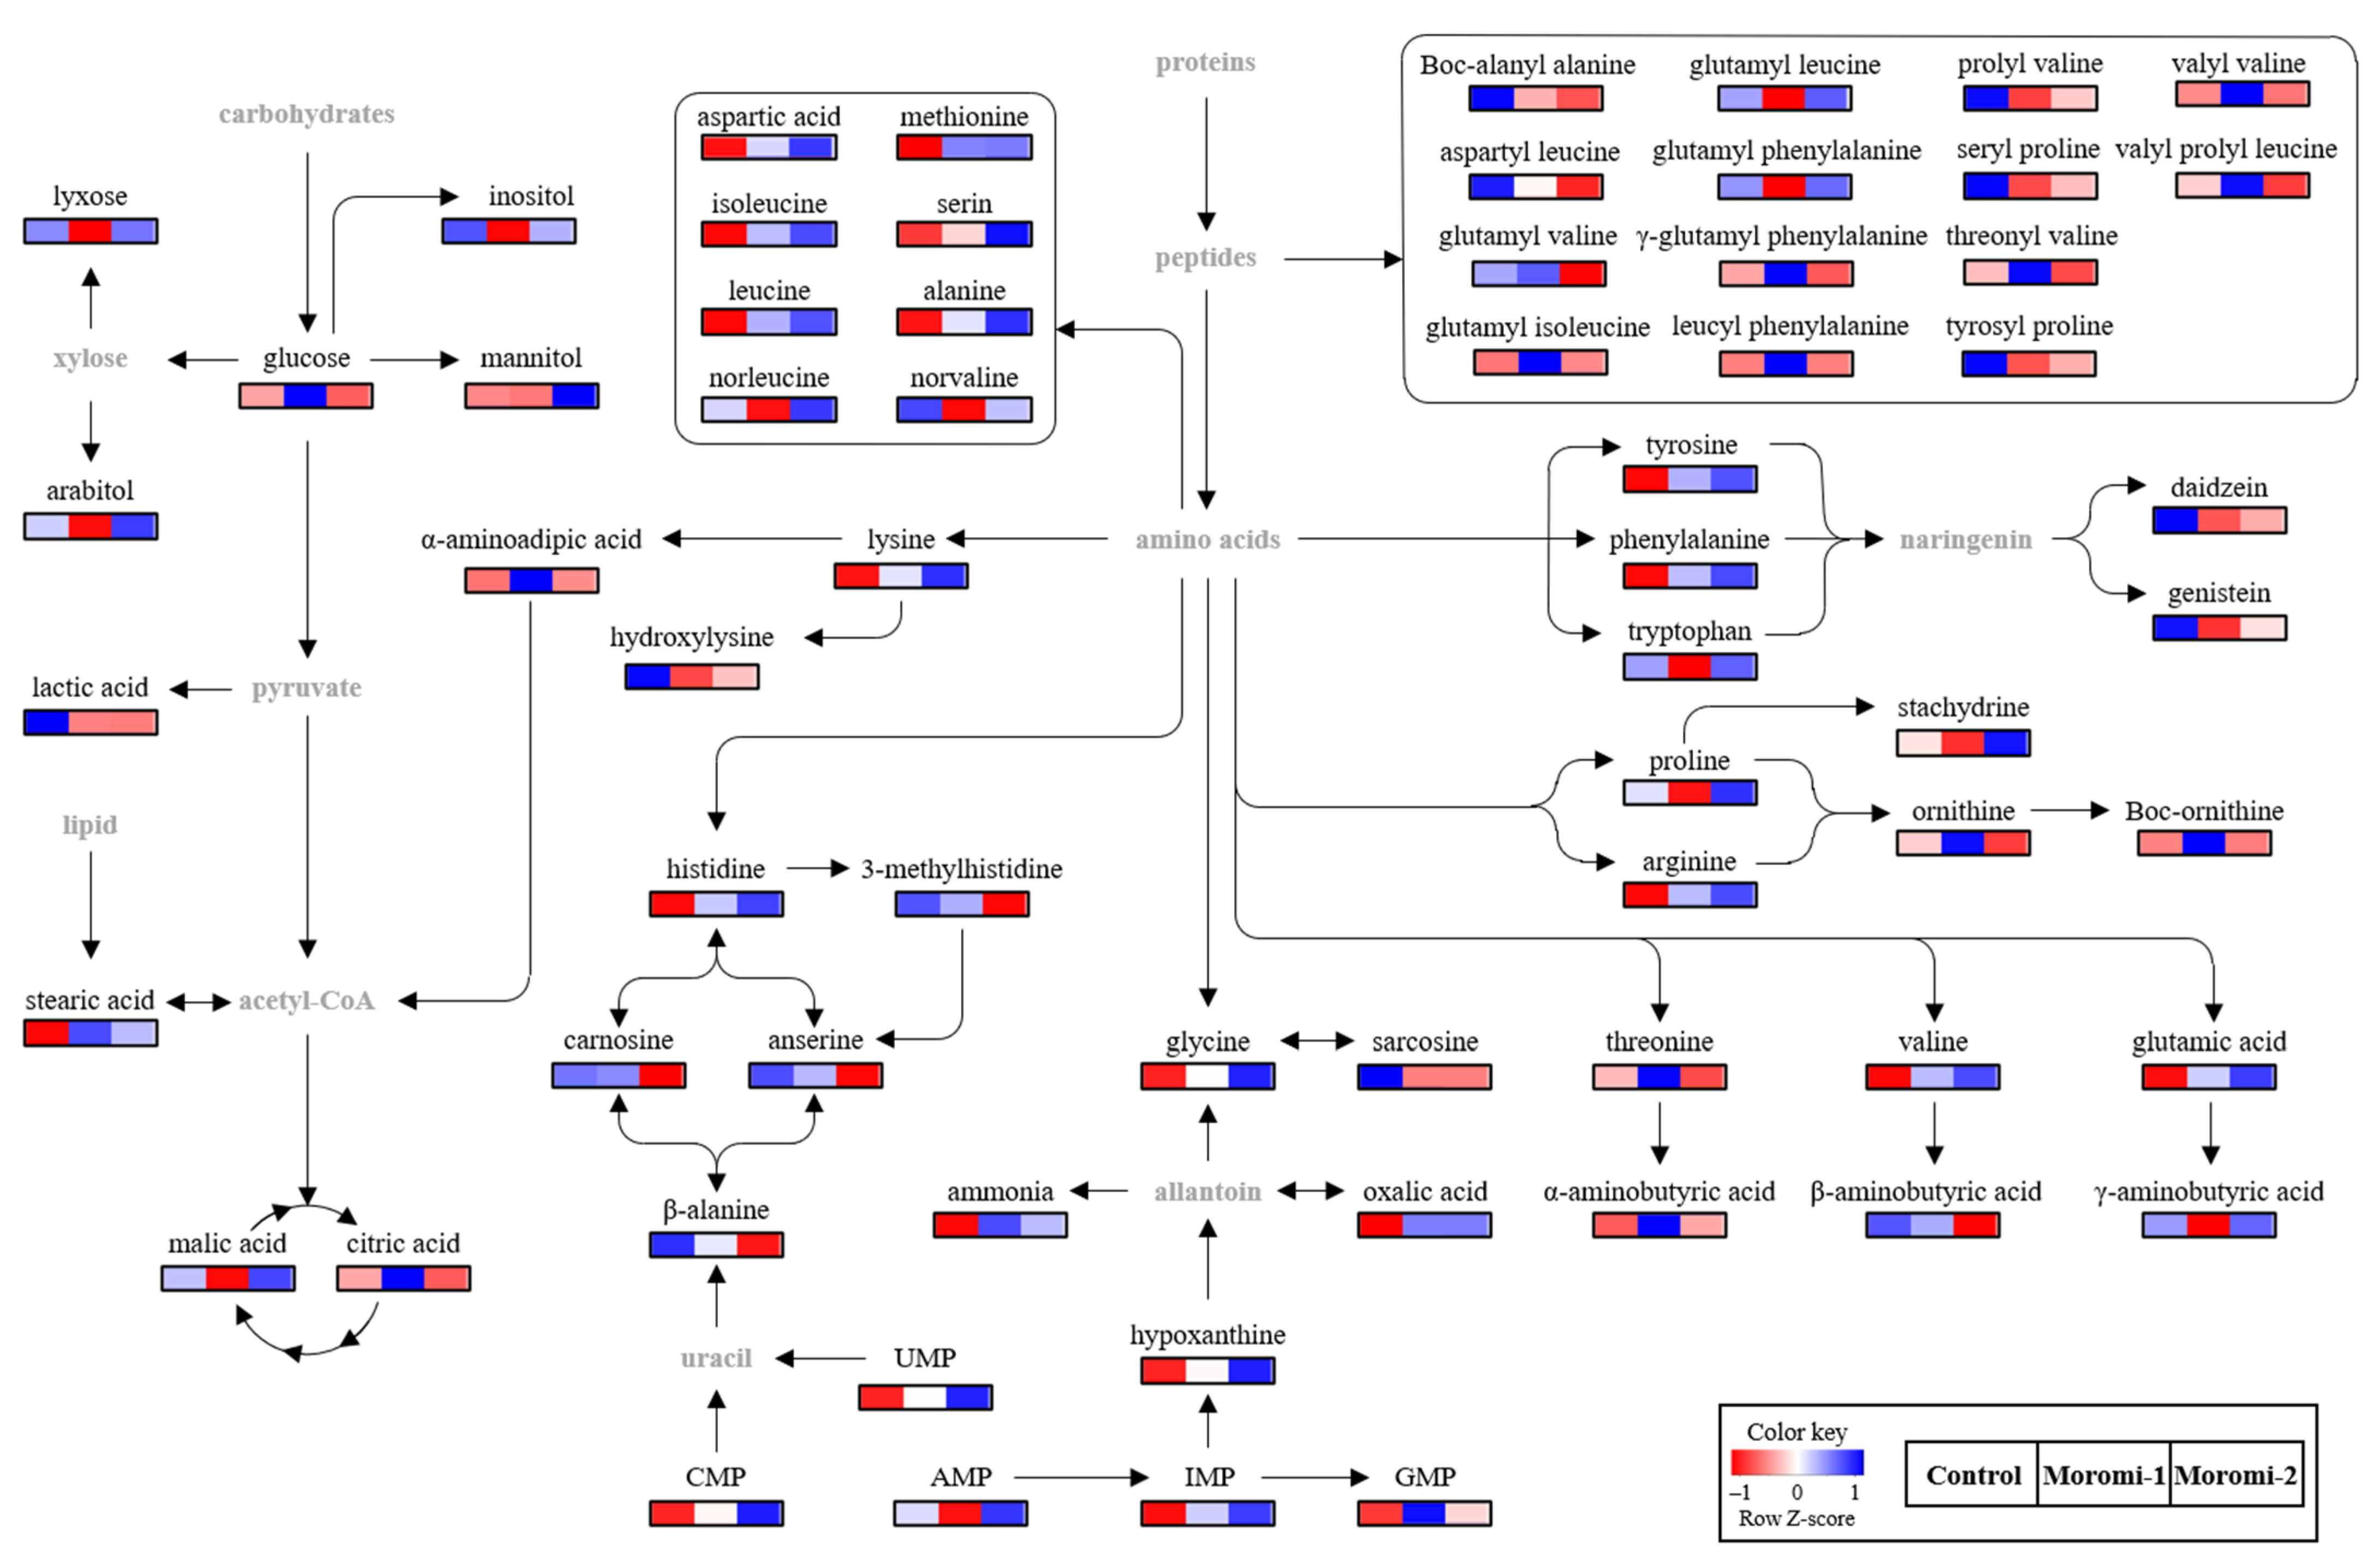
Proposed pathway related to A. oryzae fermentation. Control, moromi-1, and moromi-2 are moromi samples fermented by commercial strain, A. oryzae KCCM13012P, and A. oryzae KCCM12804P, respectively. The heat maps showed the relative abundance of identified metabolites. Blue and red indicate the increase and decrease in metabolite levels, respectively. CMP, cytidine monophosphate; UMP, uridine monophosphate; GMP, guanosine monophosphate; IMP, inosine monophosphate; AMP, adenosine monophosphate.
2.5. Amino Acids and Peptides
In identified metabolites, amino acids and peptides were the major metabolites in moromi, and their profiles were significantly different according to the A. oryzae strains. The newly isolated strains increased the production of most major amino acids, including aspartic acid, glycine, serine, isoleucine, glutamic acid, alanine, valine, lysine, and arginine, compared with the control, and in particular, their contents in moromi-2 were two times more than those of control moromi, while the contents of glycine, isoleucine, and threonine of moromi-1 were more than two times higher than those of control moromi. In particular, the level of Boc-ornithine in moromi-1 was about 63 times higher than those of control moromi. However, some minor amino acids, including sarcosine, β-methylhistidine, hydroxylysine, β-alanine, and β-aminobutyric acid, were decreased in moromi-1 and moromi-2. The changes in these amino acids play a crucial role in the taste of fermented soybean foods [34,35]. Especially, aspartic acid and glutamic acid mainly contribute to the umami taste [32], and moromi-2, which showed the highest umami intensity, had the highest content of aspartic acid and glutamic acid (Table S1). In addition, umami amino acids and some amino acids, including glycine, lysine, arginine, histidine, and ornithine, can act as salt taste enhancers [37].
Like amino acids, the levels of moromi peptides were significantly changed according to A. oryzae strains. Compared with the control moromi, the levels of carnosine, glutamyl valine, aspartyl leucine, Boc-alanyl alanine, valyl valine, γ-glutamyl phenylalanine, threonyl valine, valyl prolyl leucine, and leucyl phenylalanine were lower by two times in moromi-2, whereas the level of glutamyl isoleucine was higher by about two times. Unlike moromi-2, the levels of seryl proline, Boc-alanyl alanine, prolyl valine, tyrosyl proline, glutamyl leucine, and glutamyl phenylalanine decreased in moromi-1, whereas other identified peptides, except for glutamyl valine, were significantly increased. In particular, the levels of glutamyl isoleucine and valyl valine in moromi-1 were about 30 and 15 times higher than those of control moromi. These peptides provide the taste background and enhance other tastes [31]. Some small peptides, such as glutamic-acid-containing peptides, also exhibit an umami taste [31], and peptides containing bitter amino acids, such as valine, leucine, and phenylalanine, exhibit bitterness [31,38]. In this study, moromi-2 showed the most intense umami taste, but there was no difference in bitterness between moromi samples (Figure 2). As for soy sauce, the direct contribution of peptides to its taste is negligible due to the relatively low content [31]. In addition, some amino acids (arginine, aspartic acid, and glutamic acid) and salt can act as bitterness suppressors [39,40].
2.6. Nucleotides
In addition to amino acids, nucleotides, known as enhancers of umami taste [32], were also significantly altered depending on the A. oryzae strains (Table 2). Among nucleotides, AMP was the major nucleotide, and its concentrations in control and moromi-2 were 2.8 and 3.9 times higher than those of moromi-1. The concentrations of other nucleotides in the moromi samples fermented with newly isolated strains were higher than those of control moromi. In particular, the CMP contents in moromi-1 and moromi-2 samples were 3.62 and 6.54 times, respectively, higher than those of control moromi, and their GMP, which were well-known umami enhancers along with IMP [32], were 6.61 and 3.02 times higher, respectively. UMP, which was not detected in control moromi, was newly produced in moromi fermented with newly isolated strains. The high content of these nucleotides in moromi-2, which had higher umami than monosodium glutamate [41], might positively contribute to an increase in the umami taste in moromi-2.
2.7. Other Metabolites and Metabolomic Pathway
The profiles of minor metabolites, including sugars, acidic compounds, lipids, and secondary metabolites, were also significantly changed according to A. oryzae strains (Table 2). Among them, sugar alcohols, including mannitol and arabitol, increased in moromi-2 but decreased in moromi-1, except for glucose. In addition, lactic acid, which contributes to sourness or sour aroma in soy sauce [42], was about three times lower in moromi-1 and moromi-2 samples than that of control moromi. Moreover, the levels of daidzein and genistein, which are major bioactive compounds associated with the health benefits of soy products [43], were also decreased in moromi-1 and moromi-2 samples.
Based on the identified metabolites, the metabolomic pathway associated with moromi fermentation by different A. oryzae strains was proposed (Figure 4). The amino acid and peptide metabolisms were mainly changed during moromi fermentation, while the energy, nucleotide, and isoflavone metabolisms were also observed. Similar metabolisms were also reported in previous metabolomics studies on the fermentation of soy sauce with A. oryzae 3.042 and 100-8 [44], and soybean residue with A. oryzae KCTC6983 [36].
2.8. Correlation Analysis
The relationship between metabolite profiles, general characteristics, and sensory quality was visualized using a PLS-DA biplot with acceptable parameters, including the goodness of fit (R2X = 0.716; R2Y = 0.782), predictability (Q2 = 0.757), p-values (2.22 × 10⁻⁹), and permutation test (n = 200) (Figure 5A). Metabolite profiles, general characteristics, and sensory characteristics were significantly separated by t(1) and t(2) according to A. oryzae strains. Moreover, Pearson’s correlation coefficient between metabolite profiles and sensory characteristics was calculated and visualized using heatmaps (Figure 5B and Table S4). In particular, umami taste had strong positive correlations (r > 0.83) with nucleotides, including hypoxanthine, CMP, UMP, and IMP, and with some amino acids, including serine, glycine, alanine, lysine, aspartic acid, glutamic acid, histidine, isoleucine, valine, phenylalanine, arginine, and leucine (r > 0.76). In contrast, some amino acid derivatives, such as 3-methylhistidine, β-aminoisobutyric acid, and β-alanine, and some peptides, such as carnosine, glutamyl valine, and anserine, showed negative correlations with umami taste (r < −0.85). In saltiness, methionine, tyrosine, α-aminobutyric acid, α-aminoadipic acid, GMP, oxalic acid, and ammonia showed positive correlations (r > 0.74), whereas tryptophan, hydroxylysine, sacrosine, prolyl valine, tyrosyl proline, seryl proline, Boc-alanyl alanine, isoflavones, and melinamide showed negative correlations (r < −0.70). The strong correlations between amino acids or peptides and taste (umami and salty) were also observed in various fermented foods, including fermented soybean [45], soybean paste [35], and moromi extract [46]. These results indicate that moromi qualities were strongly associated with the change in metabolite profiles produced by A. oryzae strains.
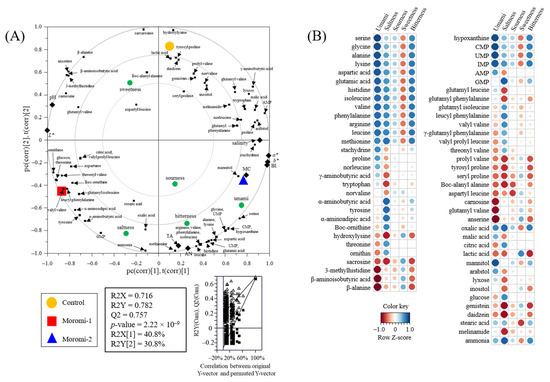
Figure 5.
Partial least-squares discriminant analysis (PLS-DA) biplot (A) and Pearson correlation between sensory quality and metabolites (B). Control, moromi-1, and moromi-2 are moromi samples fermented by commercial strain, A. oryzae KCCM13012P, and A. oryzae KCCM12804P, respectively. PLS-DA biplot was drawn based on the general quality characteristics, sensory quality, and metabolite profiles. The statistical acceptability was evaluated by quality parameters (R2X, R2Y, Q2, and p-value) and validated by cross validation with a permutation test (n = 200). Correlation heat map colors represent the correlation coefficients, and blue and red colors on a red–blue color scale indicate the positive and negative correlations, respectively. L*, lightness; a*, redness; b*, yellowness; BI, browning index; TA, total acidity; MC, moisture content; AN, amino type nitrogen; CMP, cytidine monophosphate; UMP, uridine monophosphate; GMP, guanosine monophosphate; IMP, inosine monophosphate; AMP, adenosine monophosphate.
3. Materials and Methods
3.1. Isolation and Identification of A. oryzae
Commercialized strain (A. oryzae KACC47838) was purchased from Chungmoo fermentation (Ulsan, Korea), and traditional soybean paste for isolation of strains was purchased from the local market (Sunchang, Korea). To isolate A. oryzae strains, 10 g of soybean paste was homogenized using 90 mL of pasteurized saline (0.85%, w/v). Following centrifugation at 4000 rpm for 10 min, the diluted supernatant was plated into potato dextrose agar (PDA, Difco, Detroit, MI, USA), malt extract agar (MEA, Difco), and yeast peptone dextrose agar (YPD, Difco), respectively. Following incubation for seven days at 30 °C, the spore was obtained, and the spore solution diluted using pasteurized salinity water (0.85%, w/v) was plated into a PDA agar. After incubation at 30 °C for seven days, two spores were isolated and stored at 4 °C until used.
The identification of isolated mold from traditional fermented foods was performed using the sequencing of the internal transcribed spacer (ITS) region. PCR amplification was conducted using the ITS1 (5′-TCCGTAGGTGAACCTGCGG-3′) and ITS4 (5′-TCCTCCGCTTATTGATATGC-3′) primers for the ITS gene, and the gene sequencing data were identified by the National Center for Biotechnology (NCBI) nucleotide BLAST. Homology with other strains was analyzed using registered strains in NCBI (https://blast.ncbi.nlm.nih.gov/Blast.cgi (accessed on 10 June 2021). The phylogenetic tree was established using MEGA-X software (version 10.2.1) based on their nucleotide sequence. The maximum likelihood method was used for evolutionary distance inference, and 1000 bootstrap analysis was performed [47].
3.2. Moromi Fermentation
Soybean soaked at 25 °C for 18 h was steamed at 121 °C for 30 min, and then each isolated strain sub-cultured in yeast mold agar (YM, Difco) and a commercial strain (control), respectively, was inoculated with 107~108 CFU/mL to the soybean. The inoculated soybean was fermented in three stages. Primary fermentation was performed at 30 °C for 48 h. After crushing the primary fermented soybean and adding 1.5 times water, secondary fermentation was performed at 10 °C for 48 h. Tertiary fermentation was carried out at 55 °C for 48 h after the addition of salt to the fermented mixture to a final salinity of 8%. Following three-step fermentation, the fermented samples were aged at room temperature for three weeks. The final products were filtrated using a cotton filter, freeze-dried, and stored at –18 °C [48]
3.3. Physicochemical Properties of Moromi
The moisture content was measured using an infrared moisture meter (JP/FD-720, Kett engineering, Tokyo, Japan). The pH, acidity, and amino acid nitrogen were measured using an automatic titrator T50 (Mettler-Toledo GmbH, Greifensee, Switzerland). The salinity was measured using a digital salinity meter (TM-30D, Takemura Electric works Ltd., Tokyo, Japan), and the color was measured using a color meter (Konica Minolta Sensing, Inc., Osaka, Japan).
3.4. Enzymatic Activities of Moromi
Enzyme activities, including α-amylase and protease of the three different A. oryzae strains were evaluated using samples after primary fermentation. The α-amylase activity of samples was measured following the method described in Gupta et al. (2003) [49] with a minor modification. Sample (100 μL) was mixed with 200 μL of 1% starch solution and incubated at 40 °C for 30 min. After stopping the reaction with the addition of 300 μL of 1 N HCl, 800 μL of Lugol’s solution was added, and the absorbance of starch remaining in the solution was measured at 660 nm. The yield of converted glucose was calculated from degraded starch, and one unit (U) of the α-amylase activity was defined as the amount of enzyme releasing glucose (mg) from starch by 1 g of sample for 1 min. Protease activity of samples was measured by a Folin and Ciocalteu’s reagent method [50] with a minor modification. Sample (200 μL) was mixed with 500 μL of 0.65% casein solution in 50 mM sodium phosphate buffer (pH 7.5) and incubated at 37 °C for 10 min. After stopping the reaction by adding 500 μL of trichloroacetic acid for 30 min at 37 °C, the reaction mixture was centrifuged at 10,000× g for 3 min at 4 °C, and the supernatant (200 μL) mixed with 200 μL of Na2CO3 and 100 μL of 0.5 M Folin and Ciocalteu’s reagent was incubated at 37 °C for 30 min. Following centrifugation at 10,000× g for 3 min, the absorbance of the supernatant was measured at 660 nm. Tyrosine was used as a standard compound, and one U of the protease activity was defined as the amount of enzyme releasing 1 μg of tyrosine from casein by 1 g of sample for 1 min.
3.5. Sensory Evaluation
Sensory analysis was carried out by eight trained panelists aged 21–24 years, and all panelists were trained for at least three months. Before sensory analysis, the panelists discussed a series of taste reference solutions, including sodium chloride (NaCl) (3%) for saltiness, monosodium glutamate (MSG) (0.3%) for umami taste, citric acid (0.2%) for sourness, sucrose (2%) for sweetness, and quinine (0.0025%) for bitterness. The intensity of each sensory quality was scored on a 15-cm-line scale with 0.5 cm anchors on the left and right end sides labeled “very weak” and “very strong” [33].
3.6. Free Amino Acid Analysis
To extract free amino acids, a lyophilized sample (2 g) was homogenized with distilled water under sonication for 20 min. Following centrifugation, 2 mL of the supernatant was mixed with 2 mL of 5% trichloroacetic acid and sequentially filtrated using a 0.2 μm syringe filter. The 20 μL of the filtrated solution was injected into the amino acid analyzer (Hitachi L-8900, Hitachi High-Technologies, Tokyo, Japan). For the separation and detection of amino acids, a Hitachi ion exchange column (4.6 mm × 60 mm, Hitachi High-Technologies) with an ammonia filtering column (4.6 mm × 40 mm, Hitachi High-Technologies) was used to separate amino acids, the mobile phase used as a wide range of pH buffer set (pH-Set, Kanto Chemical Co. Inc., Tokyo, Japan), and UV/Vis (440–570 nm) was used as the detector. The column temperature, flow rate, and ninhydrin flow rate were set at 50 °C, 0.4 mL/min, and 0.35 mL/min, respectively [51].
3.7. Nucleotide Analysis
To extract nucleotides, a lyophilized sample (5 g) was homogenized using 20 mL of aqueous perchloric acid and filtrated using a filter paper (Whatman No. 1). The pH of the extract was adjusted to 5.5 using the addition of 1 M KOH and to the volume of 50 mL using 0.6 M perchloric acid (pH 5.5). Following filtration, the sample was analyzed using HPLC (Agilent 1200 series, Agilent Technologies, Santa Clara, CA, USA) coupled with the CAPCELL PAK C18 column (250 mm × 4.6 mm, 5 μm, Shiseido, Tokyo, Japan). Next, 20 mM sodium phosphate buffer (pH 5.5) was used as a mobile phase with a flow rate of 1 mL/min. The column temperature was set at 30 °C, and nucleotide was detected at 254 nm [52].
3.8. Metabolomic Analysis
3.8.1. GC/MS-Based Metabolite Analysis
The GC/MS-based metabolite analysis was performed with some modifications to a previous method [46]. To extract metabolites, the lyophilized sample was homogenized with 70% methanol containing dicyclohexyl phthalate as an internal standard (IS) using a bullet blender (Next Advance, Troy, NY, USA). The extracts were completely dried using a CentriVap SpeedVac concentrator (Labconco Co., Kansas City, MO, USA). The dried residues were dissolved in 100 µL of pyridine containing methoxyamine hydrochloride and incubated for 90 min at 37 °C. The methoxylated samples were then derivatized by adding 100 μL of N, O-bis(trimethylsilyl)trifluoroacetamide (BSTFA) for 30 min at 70 °C. The derivatized non-volatile metabolites were analyzed using a GC/MS system (Shimadzu Corp., Kyoto, Japan) equipped with a DB-5MS column (30 m × 0.25 mm, 0.25 μm film thickness, Agilent Technologies, Santa Clara, CA, USA) at a split ratio of 1:50. The injector temperature was set at 200 °C, and helium was used as the carrier gas at a flow rate of 0.95 mL/min. The oven temperature program was set as holding at 70 °C for 2 min, increasing from 70 to 320 °C at a rate of 10 °C/min, and holding 320 °C for 5 min. The effluent was detected using a GCMS-TQ 8030 MS (Shimadzu Corp., Kyoto, Japan) system with electron ionization at 70 eV. The ion source and interface temperatures were 230 and 280 °C, respectively. Data were monitored and collected in the full-scan mode in the m/z range from 45 to 550.
3.8.2. UPLC-Q-TOF MS-Based Metabolite Analysis
UPLC-Q-TOF MS-based metabolite analysis was performed with some modifications to the previous method [46]. To extract metabolites, the lyophilized sample was homogenized with 70% methanol containing terfenadine (IS) using a bullet blender. Following centrifugation, the supernatants were analyzed by UPLC-Q-TOF MS (Waters Corp., Milford, MA, USA). The metabolites were separated using an Acquity BEH C18 column (2.1 mm × 100 mm, 1.7 µm; Waters, Milford, MA, USA) equilibrated with mobile phase A (water containing 0.1% formic acid). The metabolites were eluted by a linear gradient from 0% mobile phase B (acetonitrile containing 0.1% formic acid) to 100% B for 9 min. The eluted metabolites were detected using Q-TOF MS with positive electrospray ionization (ESI) mode. The desolvation temperature and flow rate were 400 °C and 800 L/h, respectively, and the source temperature was 120 °C. Sampling cone and capillary voltages were 40 V and 3 kV, respectively. Leucine-enkephalin ([M + H] = 556.2771) was used as the lock mass with an infusion flow rate of 20 µL/min. MS data were obtained with a scan range of 50 to 1500 m/z.
3.8.3. Data Processing
The GC/MS data were aligned with a retention time window of 0.1–0.05 min and normalized with the IS. Metabolites were identified using NIST 11 and Wiley 9 mass spectral libraries, and retention indices (RI). LC/MS data were collected using a peak-width at 5% height of 1s, peak-to-peak baseline noise of 1, noise elimination of 6, and an intensity threshold of 5000. The collected data were aligned with a 0.05 Da mass window and a retention time window of 0.2 min using the MarkerLynx software (version 4.1, Waters, Milford, MA, USA) and were normalized with the IS. Furthermore, metabolites were identified using the UNIFI software (version 1.9.2, Waters, Milford, MA, USA) connected to various online databases and the METLIN database.
3.9. Statistical Analysis
Multivariate statistical analysis was carried out using SIMCA-P+ v.16.0.1 (Umetrics, Umea, Sweden) and all variables were automatically transformed and scaled to unit variance. PLS-DA was used to visualize the differences in sample groups and correlations between the metabolites and general characteristics, including color, pH, total acidity, salinity, moisture contents, amino type nitrogen, enzymatic activities, and sensory evaluation. Statistical differences between the experimental data were statistically analyzed using one-way analysis of variance (ANOVA) with Duncan’s test using SPSS v.24.0 (SPSS Inc., Chicago, IL, USA). Pearson’s correlation coefficients between the sensory qualities and metabolites were calculated and visualized using the R software.
4. Conclusions
This study investigated the effect of newly isolated strains (A. oryzae KCCM12012P and KCCM12804P) on the quality of moromi using metabolomics, sensory evaluation, enzyme activity, and physicochemical properties and compared them with those of a commercial strain (control). Moromi samples prepared with different strains showed significant differences in physicochemical properties, enzyme activity, sensory quality, and metabolite profiles. In particular, the correlation data indicate that the major moromi metabolites, including amino acids, peptides, and nucleotides, contributed to the saltiness and umami taste of moromi samples. Moreover, the metabolomic pathway related to moromi fermentation according to different A. oryzae strains was proposed. Although volatile compounds contributing to moromi flavor quality and the mechanism of metabolite production according to A. oryzae strains were not investigated, the proposed results suggest that the quality of moromi fermented with isolated strains, especially A. oryzae KCCM12804P, was superior to that of a commercial strain. Therefore, these strains could be used as ideal strains to produce moromi and soy sauce with good sensory quality in the fermentation industry.
Supplementary Materials
The following supporting information can be downloaded at: https://www.mdpi.com/article/10.3390/molecules27196182/s1, Figure S1: Result of internal transcribed spacer (ITS) sequencing of isolated A. oryzae strains; Table S1: Quantitative analysis of amino acids and nucleotides; Table S2: Identification of major metabolites contributing to the separation of samples on the PLS-DA score plots by GC/MS analysis; Table S3: Identification of major metabolites contributing to the separation of samples on the PLS-DA score plots by UPLC-Q-TOF MS analysis; Table S4: Pearson correlation coefficient between sensory characteristics and metabolite profiles.
Author Contributions
Conceptualization, D.-S.K. and H.-J.K. (Hyun-Jin Kim); methodology, formal analysis, methodology, investigation, and visualization, S.W.J., J.-H.A., D.-S.K., E.J.Y., H.-J.K. (Hyeon-Jin Kang) and H.-J.K. (Hyun-Jin Kim); writing—original draft, S.W.J. and J.-H.A.; writing—review and editing, H.-J.K. (Hyun-Jin Kim); project administration, S.W.J. and H.-J.K. (Hyun-Jin Kim); supervision, H.-J.K. (Hyun-Jin Kim). All authors have read and agreed to the published version of the manuscript.
Funding
This work was supported by Korea Institute of Planning and Evaluation for Technology in Food, Agriculture, Forestry (IPET) through Innovative Food Product and Natural Food Materials Development Program, funded by the Ministry of Agriculture, Food and Rural Affairs (MAFRA) (grant number: 320014-2).
Institutional Review Board Statement
Not applicable.
Informed Consent Statement
Not applicable.
Data Availability Statement
Data are contained within the article and Supplementary Materials.
Conflicts of Interest
The authors declare no conflict of interest.
Sample Availability
Samples of the strains are available from the Microbial Institute for Fermentation Industry.
References
- Campbell-Platt, G. Fermented foods—A world perspective. Food Res. Int. 1994, 27, 253–257. [Google Scholar] [CrossRef]
- Liu, L.; Chen, X.; Hao, L.; Zhang, G.; Jin, Z.; Li, C.; Yang, Y.; Rao, J.; Chen, B. Traditional fermented soybean products: Processing, flavor formation, nutritional and biological activities. Crit. Rev. Food Sci. Nutr. 2022, 62, 1971–1989. [Google Scholar] [CrossRef]
- Cao, Z.-H.; Green-Johnson, J.M.; Buckley, N.D.; Lin, Q.-Y. Bioactivity of soy-based fermented foods: A review. Biotechnol. Adv. 2019, 37, 223–238. [Google Scholar] [CrossRef]
- Shrestha, A.K.; Dahal, N.R.; Ndungutse, V. Bacillus fermentation of soybean: A review. J. Food Sci. Technol. Nepal 2010, 6, 1–9. [Google Scholar] [CrossRef]
- Gille, D.; Schmid, A.; Walther, B.; Vergères, G. Fermented food and non-communicable chronic diseases: A review. Nutrients 2018, 10, 448. [Google Scholar] [CrossRef] [PubMed]
- Zhao, W.; Liu, Y.; Latta, M.; Ma, W.; Wu, Z.; Chen, P. Probiotics database: A potential source of fermented foods. Int. J. Food Prop. 2019, 22, 198–217. [Google Scholar] [CrossRef]
- Divya, J.B.; Varsha, K.K.; Nampoothiri, K.M.; Ismail, B.; Pandey, A. Probiotic fermented foods for health benefits. Eng. Life Sci. 2012, 12, 377–390. [Google Scholar] [CrossRef]
- Thapa, N.; Tamang, J. Functionality and therapeutic values of fermented foods. In Health Benefits of Fermented Foods and Beverages; CRC Press: Boca Raton, FL, USA, 2016; pp. 111–168. [Google Scholar]
- Lioe, H.N.; Selamat, J.; Yasuda, M. Soy sauce and its umami taste: A link from the past to current situation. J. Food Sci. 2010, 75, R71–R76. [Google Scholar] [CrossRef]
- Sassi, S.; Wan-Mohtar, W.A.A.Q.I.; Jamaludin, N.S.; Ilham, Z. Recent progress and advances in soy sauce production technologies: A review. J. Food Process. Preserv. 2021, 45, e15799. [Google Scholar] [CrossRef]
- Devanthi, P.V.P.; Gkatzionis, K. Soy sauce fermentation: Microorganisms, aroma formation, and process modification. Food Res. Int. 2019, 120, 364–374. [Google Scholar] [CrossRef]
- Zhang, L.; Zhou, R.; Cui, R.; Huang, J.; Wu, C. Characterizing soy sauce moromi manufactured by high-salt dilute-state and low-salt solid-state fermentation using multiphase analyzing methods. J. Food Sci. 2016, 81, C2639–C2646. [Google Scholar] [CrossRef]
- Zhong, Y.; Lu, X.; Xing, L.; Ho, S.W.A.; Kwan, H.S. Genomic and transcriptomic comparison of Aspergillus oryzae strains: A case study in soy sauce koji fermentation. J. Ind. Microbiol. Biotechnol. 2018, 45, 839–853. [Google Scholar] [CrossRef] [PubMed]
- Lv, G.; Xu, Y.; Tu, Y.; Cheng, X.; Zeng, B.; Huang, J.; He, B. Effects of nitrogen and phosphorus limitation on fatty acid contents in Aspergillus oryzae. Front. Microbiol. 2021, 12, 739569. [Google Scholar] [CrossRef] [PubMed]
- Zhao, G.; Liu, C.; Li, S.; Wang, X.; Yao, T. Exploring the flavor formation mechanism under osmotic conditions during soy sauce fermentation in Aspergillus oryzae by proteomic analysis. Food Funct. 2020, 11, 640. [Google Scholar] [CrossRef] [PubMed]
- Machida, M.; Asai, K.; Sano, M.; Tanaka, T.; Kumagai, T.; Terai, G.; Kusumoto, K.-I.; Arima, T.; Akita, O.; Kashiwagi, Y.; et al. Genome sequencing and analysis of Aspergillus oryzae. Nat. Cell Biol. 2005, 438, 1157–1161. [Google Scholar] [CrossRef] [PubMed]
- Kum, S.J.; Yang, S.O.; Lee, S.M.; Chang, P.S.; Choi, Y.H.; Lee, J.J.; Hurh, B.S.; Kim, Y.S. Effects of Aspergillus species inoculation and their enzymatic activities on the formation of volatile components in fermented soybean paste (doenjang). J. Agric. Food Chem. 2015, 63, 1401–1418. [Google Scholar] [CrossRef]
- Park, M.K.; Kim, Y.-S. Comparative metabolic expressions of fermented soybeans according to different microbial starters. Food Chem. 2020, 305, 125461. [Google Scholar] [CrossRef]
- Yang, S.; Choi, S.J.; Kwak, J.; Kim, K.; Seo, M.; Moon, T.W.; Lee, Y.-W. Aspergillus oeyzae strains isolated from traditional Korean nuruk: Fermentation properties and influence on rice wine quality. Food Sci. Biotechnol. 2013, 22, 425–432. [Google Scholar] [CrossRef]
- Xu, D.; Li, C.; Zhao, M.; Feng, Y.; Sun, L.; Wang, Y. Assessment on the improvement of soy sauce fermentation by Aspergillus oryzae HG76. Biocatal. Agric. Biotechnol. 2013, 2, 344–351. [Google Scholar] [CrossRef]
- Tian, Y.; Feng, Y.; Zhao, M.; Su, G. Comparison and application of the extraction method for the determination of enzymatic profiles in matured soybean koji. Food Biosci. 2022, 49, 101875. [Google Scholar] [CrossRef]
- Hong, S.-B.; Hong, S.-Y.; Jo, K.-H.; Kim, Y.-S.; Do, J.-H.; Noh, S.-B.; Yoon, H.-H.; Chung, S.-H. Taxonomic characterization and safety of Nuruk molds used industrially in Korea. Korea J. Mycol. 2015, 43, 149–157. [Google Scholar] [CrossRef]
- Wicklow, D.T.; McAlpin, C.E.; Yeoh, Q.L. Diversity of Aspergillus oryzae genotypes (RFLP) isolated from traditional soy sauce production within Malaysia and Southeast Asia. Mycoscience 2007, 48, 373–380. [Google Scholar] [CrossRef]
- Lee, S.K.; Hwang, J.Y.; Choi, S.H.; Kim, S.M. Purification and characterization of Aspergillus oryzae LK-101 salt-tolerant acid protease isolated from soybean paste. Food Sci. Biotechnol. 2010, 19, 327–334. [Google Scholar] [CrossRef]
- Li, F.; Liu, W.; Yamaki, K.; Liu, Y.; Fang, Y.; Li, Z.; Chem, M.; Wang, C. Angiotensin I-converting enzyme inhibitory effect of Chinese soypaste along fermentation and ripening: Contribution of early soybean protein borne peptides and late Maillard reaction products. Int. J. Food Prop. 2016, 19, 2805–2816. [Google Scholar] [CrossRef]
- Jiang, S.; Shi, Y.; Li, M.; Xiong, L.; Sun, Q. Characterization of Maillard reaction products micro/nano-particles present in fermented soybean sauce and vinegar. Sci. Rep. 2019, 9, 11285. [Google Scholar] [CrossRef]
- Chen, Z.Y.; Feng, Y.Z.; Cui, C.; Zhao, H.F.; Zhao, M.M. Effects of koji-making with mixed strains on physicochemical and sensory properties of Chinese-type soy sauce. J. Sci. Food Agric. 2015, 95, 2145–2154. [Google Scholar] [CrossRef]
- Shukla, S.; Lee, J.S.; Park, H.-K.; Yoo, J.-A.; Hong, S.-Y.; Kim, J.-K.; Kim, M. Effect of novel starter culture on reduction of biogenic amines, quality improvement, and sensory properties of Doenjang, a traditional Korean soybean fermented sauce variety. J. Food Sci. 2015, 80, M1794–M1803. [Google Scholar] [CrossRef]
- Sharma, R.; Garg, P.; Kumar, P.; Bhatia, S.K.; Kulshrestha, S. Microbial fermentation and its role in quality improvement of fermented foods. Fermentation 2020, 6, 106. [Google Scholar] [CrossRef]
- Tanaka, M.; Gomi, K. Induction and repression of hydrolase genes in Aspergillus oryzae. Front. Microbiol. 2021, 12, 677603. [Google Scholar] [CrossRef]
- Zhao, C.J.; Schieber, A.; Gänzle, M.G. Formation of taste-active amino acids, amino acid derivatives and peptides in food fermentations—A review. Food Res. Int. 2016, 89, 39–47. [Google Scholar] [CrossRef]
- Diez-Simon, C.; Eichelsheim, C.; Mumm, R.; Hall, R.D. Chemical and sensory characteristics of soy sauce: A review. J. Agric. Food. Chem. 2020, 68, 11612–11630. [Google Scholar] [CrossRef] [PubMed]
- Kim, M.J.; Kwak, H.S.; Jung, H.Y.; Kim, S.S. Microbial communities related to sensory attributes in Korean fermented soy bean paste (doenjang). Food Res. Int. 2016, 89, 724–732. [Google Scholar] [CrossRef] [PubMed]
- Syifaa, A.S.; Jinap, S.; Sanny, M.; Khatib, A. Chemical profiling of different types of soy sauce and the relationship with its sensory attributes. J. Food Qual. 2016, 39, 714–725. [Google Scholar] [CrossRef]
- Kim, S.S.; Kwak, H.S.; Kim, M.J. The effect of various salinity levels on metabolomic profiles, antioxidant capacities and sensory attributes of doenjang, a fermented soybean paste. Food Chem. 2020, 328, 127176. [Google Scholar] [CrossRef]
- Hyeon, H.; Min, C.W.; Moon, K.; Cha, J.; Gupta, R.; Park, S.U.; Kim, S.T.; Kim, J.K. Metabolic profiling-based evaluation of the fermentative behavior of Aspergillus oryzae and Bacillus subtilis for soybean residues treated at different temperatures. Foods 2020, 9, 117. [Google Scholar] [CrossRef]
- Rysová, J.; Šmídová, Z. Effect of salt content reduction on food processing technology. Foods 2021, 10, 2237. [Google Scholar] [CrossRef] [PubMed]
- Wang, Y.; Nie, S.; Li, C.; Xiang, H.; Zhao, Y.; Chen, S.; Li, L.; Wu, Y. Application of untargeted metabolomics to reveal the taste-related metabolite profiles during mandarin fish (Siniperca chuatsi) fermentation. Foods 2022, 11, 944. [Google Scholar] [CrossRef]
- Ogawa, T.; Hoshina, K.; Haginaka, J.; Honda, C.; Tanimoto, T.; Uchida, T. Screening of bitterness-suppressing agents for quinine: The use of molecularly imprinted polymers. J. Pharm. Sci. 2004, 94, 353–362. [Google Scholar] [CrossRef]
- Okuno, T.; Morimoto, S.; Nishikawa, H.; Haraguchi, T.; Kojima, H.; Tsujino, H.; Arisawa, M.; Yamashita, T.; Nishikawa, J.; Yoshida, M.; et al. Bitterness-suppressing effect of umami dipeptides and their constituent amino acids on diphenhydramine: Evaluation by gustatory sensation and taste sensor testing. Chem. Pharm. Bull. 2020, 68, 234–243. [Google Scholar] [CrossRef]
- Wang, W.; Ning, M.; Fan, Y.; Liu, X.; Chen, G.; Liu, Y. Comparison of physicochemical and umami characterization of aqueous and ethanolic Takifugu obscurus muscle extracts. Food Chem. Toxicol. 2021, 154, 112317. [Google Scholar] [CrossRef]
- Imamura, M. Descriptive terminology for the sensory evaluation of soy sauce. J. Sensory Stud. 2016, 31, 393–407. [Google Scholar] [CrossRef]
- Chen, L.-R.; Ko, N.-Y.; Chen, K.-H. Isoflavone supplements for menopausal women: A systematic review. Nutrients 2019, 11, 2649. [Google Scholar] [CrossRef]
- Zhao, G.; Yao, Y.; Wang, C.; Tian, F.; Liu, X.; Hou, L.; Yang, Z.; Zhao, J.; Zhang, H.; Cao, X. Transcriptome and proteome expression analysis of the metabolism of amino acids by the fungus Aspergillus oryzae in fermented soy sauce. BioMed Res. Intern. 2015, 2015, 456802. [Google Scholar] [CrossRef]
- Wikandari, R.; Kinanti, D.A.; Permatasari, R.D.; Rahmanigtyas, N.L.; Chairunisa, N.R.; Sardjono; Hellwig, C.; Taherzadeh, M.J. Correlations between the chemical, microbiological characteristics and sensory profile of fungal fermented food. Fermentation 2021, 7, 261. [Google Scholar] [CrossRef]
- Lee, S.; Kim, D.-S.; Son, Y.; Le, H.-G.; Jo, S.W.; Lee, J.; Song, Y.; Kim, H.-J. Effects of salt treatment time on the metabolites, microbial composition, and quality characteristics of the soy sauce moromi extract. Foods 2022, 11, 63. [Google Scholar] [CrossRef]
- Nargesi, S.; Abasrabar, M.; Valadan, R.; Mayahi, S.; Youn, J.-H.; Hedayati, M.T.; Seyedmousavi, S. Differentiation of Aspergillus flavus from Aspergillus oryzae targeting the cyp51A gene. Pathogens 2021, 10, 1279. [Google Scholar] [CrossRef] [PubMed]
- Park, T.H.; Choi, M.J.; Jin, J.H.; Lee, J.M.; Lee, C.K. Manufacturing Method for Fermented Soy Sauce with Short Aging Period. KR. Patent 0084783, 7 July 2014. [Google Scholar]
- Gupta, R.; Gigras, P.; Mohapatra, H.; Goswami, V.K.; Chauhan, B. Microbial α-amylases: A biotechnological perspective. Process Biochem. 2003, 38, 1599–1616. [Google Scholar] [CrossRef]
- Folin, O.; Ciocalteu, V. On tyrosine and tryptophane determination in proteins. J. Biol. Chem. 1927, 27, 627–650. [Google Scholar] [CrossRef]
- Jeong, S.Y.; Jeong, D.Y.; Kim, D.S.; Park, S. Chungkookjang with high contents of poly-gamma-glutamic acid improves insulin sensitizing activity in adipocytes and neuronal Cells. Nutrients 2018, 10, 1588. [Google Scholar] [CrossRef]
- Jung, S.; Bae, Y.S.; Kim, H.J.; Jayasena, D.D.; Lee, D.D.; Park, H.B.; Heo, K.N.; Jo, C. Carnosine, anserine, creatine, and inosine 5′-monophosphate contents in breast and thigh meats from 5 lines of Korean native chicken. Poult. Sci. 2013, 92, 3275–3282. [Google Scholar] [CrossRef]


Publisher’s Note: MDPI stays neutral with regard to jurisdictional claims in published maps and institutional affiliations. |
© 2022 by the authors. Licensee MDPI, Basel, Switzerland. This article is an open access article distributed under the terms and conditions of the Creative Commons Attribution (CC BY) license (https://creativecommons.org/licenses/by/4.0/).