3.1. Proximate Composition Differences among Raw and Smoked Fish Samples
The average contents of water, ash, crude fat, and protein of fish before and after the smoking process are presented in
Table 1. The proximate composition of fish species differs from species to species.
The nutritional value of the fish products is driven not only by type of fish, but also by the type of processing method. In addition to the processing time and temperature effects on the nutritional value of processed fish, food matrices during processing, such as salt, oil or any type of additives, also cause variation in the proximate composition of the end products [
33]. Due to smoking process includes brining, drying and smoking applications, the differences in protein and lipid levels of raw and smoked fish species are generally high [
34]. The variations in proximal compositions of fish species after smoking process are shown in
Table 1. In the present study, there was a significant increase detected in the protein level among fresh and smoked fish, regardless of the kind or species. On the contrary, the total lipid and moisture levels decreased throughout the smoking process in all fish species, which can be explained by fish physically losing fat and moisture during the smoking process [
34,
35].
Table 1 shows the moisture, ash, lipid, and protein contents for each fresh and smoked fish species. Statically significant differences were found in moisture, lipid, and protein contents between species. It is well known that the proximate composition of fish muscle is driven by several factors, such as inherent genetic properties, seasonal differences, and environmental conditions. The highest and the lowest crude protein rates were determined in raw trout (22.9%) and Atlantic bonito (14.3%), respectively. The lipid content of fish species determined in an order from highest to lowest is as follows: horse mackerel (25.4%) > Atlantic bonito (17.8%) > Atlantic bluefin tuna > (10.7%) trout (4.5%) > sea bass (4.20%). The protein and lipid contents were determined as 19.8% and 4.2% in sea bass, respectively. These results coincide with the findings of previous research which reported that the protein and lipid contents were 19.36% and 5.14%, respectively, in sea bass (Yazgan et al. [
36]). Proximate composition (crude protein, lipid, moisture, and ash) of mackerel was determined to 15. 7%, 25.4%, 53.4% and 1.5%, respectively, which is consistent with the findings reported by Malesa-Ciećwierz et al. [
37] who stated that the composition was as follows: moisture (54.7%, total lipid (26.8%, crude protein 16.8% and ash 1.7%.
Since tuna is an umbrella species, a proximate composite of sub-tuna species differs from each other. In this study, the proximate composition of Atlantic bluefin tuna (T. thynnus) was determined as moisture (63.9%), total lipid (10.7%), crude protein (21.9%), and ash (2.1%) which is in accordance with previous research that indicated that the proximate composition of farmed and wild Atlantic bluefin tuna consisted of the following: lipid rate (11.04–12.85%), protein rate (20.96–21.09%) and moisture rate (61.03–63.28%) [
26]. The proximal values of Atlantic bonito were determined as: protein (14.3%), fat (17.8%), moisture (68.2%), and ash (1.8%) (
Table 1), which were in agreement with results reported by Koral et al. [
38] who indicated the protein, lipid and moisture levels as 14.55, 12.87 and 67.71%, respectively. As one of the most commonly used freshwater fish species, a wide range of research conducted on the proximate composition of trout varies depending on feeding, season, and gender. The protein and total lipid rates of rainbow trout were found as 22.9% and 4.5%, respectively, in this study which agrees with the findings of Karimian et al. [
39] who reported the crude protein as 18.59% and total lipid level as 3.58% for rainbow trout.
3.2. pH, Processing Yield and Water Holding Capacity
pH value is accepted as another parameter which impacts the other physiochemical, microbiological and sensory quality attributes of the processed fish. In this study, pH value significantly (
p < 0.05) decreased after the smoking process regardless of the type of fish species (
Table 2). While the pH value decreased from 5.8 to 5.3 in rainbow trout following the smoking process, the pH found in fresh mackerel was 6.4, and this value reduced to 6.1. The same decline in pH value was observed in Atlantic bonito, from 5.8 to 5.4 in fresh and smoked form, respectively. The highest pH value detected in Atlantic bluefin tuna was 6.8 among the fresh fish species, and this value decreased to 6.3 in the smoked form. A slight pH decline was observed in sea bass before and after the smoking process (from 6.2 to 6.0, respectively). A similar decline in pH was reported from 6.33 to 6.04 for sea bass by Fuestes et al. [
40]. The pH decline driven by the smoking process was also reported by Çoban et al. [
41]. They stated that the pH was 6.48 for raw trout and this value reduced to 5.75 following the smoking process.
WHC is regarded as one of the important parameters for the texture and general appearance of processed fish products. In this research, the WHC increased after the smoking process, regardless of fish species (
p < 0.05). The lowest and highest WHC in raw fish fillets were found in bluefin tuna and Atlantic bonito, at 81.45% and 89.54%, respectively. A relatively bigger increase in WHC was observed between fresh and smoked sea bass from 83.4 to 93.4%, respectively, among the tested groups, which is in the accordance with the previous findings by Fuentes et al. [
40] who stated that the WHC rose from 77% to 88% in fresh and smoked sea bass. The increased WHC can result in the synergistic effect of the salting and drying steps in the smoking process. Messina et al. [
25] also reported that the WHC of meagre (
Argyrosomus regius) fillets increased significantly following the smoking process.
Processing yield is one of the main concerns in profitability and economic achievement for sustainable seafood processing. The processing yield of smoked fish depends on both raw material characteristics, such as size and proximate composition and processing length and the optimization of the filleting steps and brine concentration [
42]. The yield of smoking processes was found as 71.4% for rainbow trout, 90.2% for horse mackerel, 88.5% for Atlantic bonito, 72.1% for sea bass, and 84.6% for Atlantic bluefin tuna. These results were in agreement with previous research indicating that the processing yield in horse mackerel was between 77.7% and 81%, and 72.8 and 75.9% in Atlantic mackerel [
43]. Similarly, Lerfall, and Hoel [
44] reported that the processing yield differed from 88.4% and 98.4% in the smoked salmon range. In this study, among the five species smoked and analyzed within the same protocol, the higher processing yields were detected in the species, which have relatively higher levels of lipid. The correlation between the total fat content of fish species and processing yield was also highlighted by Cardinal et al. [
42] who stated that fish species with less than 10% lipid content are more sensitive to processing conditions, and the processing yield is relatively lower than that of fatty fish.
3.3. The Concentrations of Polycyclic Aromatic Hydrocarbons (PAHS) in Raw and Smoked Fish
PAH content in raw and smoked fish species is summarized in
Table 3. The presence of sixteen tested PAHs were detected at varying concentrations in the smoked fish samples. Most of the PAH contents were detected in raw fish species only in trace amounts. The content of PAH was increased following the smoking process in all fish species. In this study, the presence and formation of PAHs showed significant differences among the tested fish species. Both smoked and raw fish were dominated by benzo(a)anthracene (BaA), which is known as a carcinogenic and genotoxic PAH. The highest mean contents of BaA of all the raw samples were noted in horse mackerel at 1.19 μg/kg and in sea bass at 1.08 μg/kg, respectively. The mean content of BaA in the smoked fish were detected as follows: Atlantic bonito > horse mackerel > bluefin tuna > herring > rainbow trout = sea bass at 6.08 μg/kg, 2.56 μg/kg, 1.26 μg/kg, 1.19 μg/kg and 1.13 μg/kg, respectively. Benz(a)anthracene was higher in all raw fish samples than in the smoked samples, which means that the smoking process may have increased them. A relatively higher level of BaA was detected in the horse mackerel and bluefin tuna, which have higher fat contents. The formation of benzo[a]anthracene, impacted by the fat ratio of food items, was also highlighted by Kaplan İnce and İnce., [
45]. Due to BaA having a high molecular weight, migration of this PAH to fish can occur easily and it is categorized in genotoxic PAHs; the controlling of BaA is important in fish products.
While the highest level of BaP was determined in the smoked horse mackerel, the BaP level was found to be at a trace level in smoked rainbow trout, smoked Atlantic bonito, and bluefin tuna. As in the fresh form, BaP was not detected in the smoked form of sea bass which is in accordance with Duedahl-Olesen et al. [
46] who reported that BaP was not found in smoked fish samples. The major health concerns in the smoked food products are that the PAH4 content (the sum of B[a]P, benzo[a]anthracene-B[a]A, chrysene-Chr, benzo[b]fluoranthene) have been mutagenic and carcinogenic due to these PAHs [
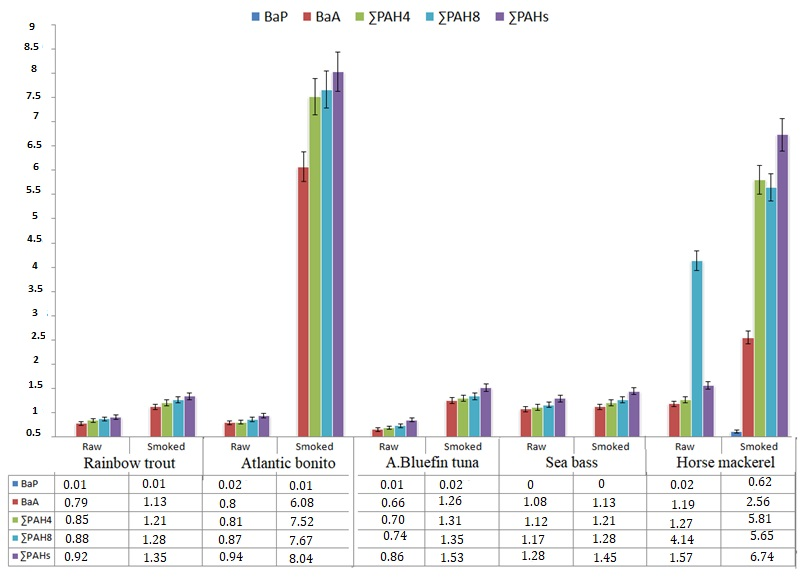
47]. In this study, relatively higher ∑PAH4 contents were determined in smoked Atlantic bonito and smoked horse mackerel as 7.52 and 5.81µg/kg, respectively (
Figure 1). The ∑PAH4 level was detected as 1.21 µg/kg in both smoked rainbow trout and smoked sea bass, and 1.31 µg/kg in smoked Atlantic bluefin tuna. The levels of BaP and PAH4 did not exceed the maximum acceptable limit of 2 μg/kg and 12 μg/kg, respectively approved by both the European Commission (European Union with EC Regulation (EU) No 835/2011) and Turkish Food codex (TFC., 2011) in any of the smoked groups.
As seen in the
Figure 1, the total genotoxic ∑PAH8s (the sum of benz[a]anthracene, chrysene, benzo[b]fluoranthene, benzo[k]fluoranthene, benzo[a]pyrene, indeno [1,2,3-cd]pyrene, dibenz[a,h]anthracene, and benzo [ghi]perylene) levels were found to differ significantly among the smoked fish groups. As EFSA indicated, BaP alone is not a good marker for the determination of the carcinogenic PAHs occurrence in the food products [
47]; detection of PAH8 level is important for public health. Of the five smoked fish groups, except smoked horse mackerel, benz[a]anthracene was found to be the predominant PAHs which was followed by chrysene. The remaining genotoxic PAH8 was found in trace amounts in the relevant smoked fish samples. The dominance of PAHs was detected as benz[a]anthracene (2.56 µg/kg), benzo(b)fluoranthene (1.57 µg/kg) and followed by chrysene (1.06 µg/kg) in the smoked horse mackerel.
In order to avoiding any deviations from the process, the smoking process and all the applied analyzes were performed under the same conditions and following the same steps. Therefore, the relative variation in the PAH4 and PAH8 formation can be attributed to the fact that the difference of the proximal composition of the tested fish species, in particular total fat content. Since raw and smoked horse mackerel have the highest fat level in all tested sample groups, the composition of PAH4 and PAH8 can correlated to the relevant fat level. The higher lipid content in horse mackerel has facilitated the PAHs formation and bioaccumulation at higher levels. This correlation can be related to the lyophilic character of PAHs which is accepted as the main reason for the accumulation mechanism in lipids [
48]. The relation between PAH composition of smoked fish was also proven by several researchers. Adeyeye and Ashaolu [
49] highlighted that the PAH compounds formed by fat pyrosis in the smoked fish and the higher lipid content of fish resulted in higher PAH composition.
The ∑PAHs levels increased in all type of fish species after the smoking process, which means the smoking process led to PAHs formation, but at different levels. Nearly all (other than benzo[k]fluoranthene and phenanthrene) 16 PAHs were detected in only horse mackerel among the raw fish species (
Figure 1). These variations in the composition of PAHs can be the result of the difference in the origin of the tested fish sample. In this study, except the horse mackerel, which originated from Iceland, all of the fish samples originated from Turkey. It is accepted that the distribution of PAHs in various water bodies is impacted by the seasonal and location differences and results in the bioaccumulation of PAHs different levels [
50]. The higher ∑PAHs levels were determined as 8.04 and 6.74 µg/kg in smoked Atlantic bonito and smoked horse mackerel, respectively (
Figure 1). While the ∑PAHs found at the highest level in smoked Atlantic bonito, the composition of PAHS, (16 of the tested PAHs) was found to be significantly different in the smoked horse mackerel when compared with the other smoked fish species. The present study revealed a strong correlation between the fat content of fish species and PAHs formation after smoking process. The PAH levels in all raw and smoked fish samples were below the maximum limit of 30 mg/kg as settled by the Turkish food codex.
3.4. Elemental Profile of Raw and Smoked Fish Samples
The heavy metal profile determined as the concentrations of sixteen elements (Al, Cr, Mn, Co, Ni, Cu, Zn, As, Se, Fe, Cd, Sn, Mg, Hg, Pb and Ca) before and after the smoking process in the different species are presented in
Table 4. As shown in
Table 4 and
Figure 2A, there were significant differences in the amount of potentially toxic metals (Cd, Cr, Pb, Hg and As). When compared to the accumulation of toxic elements in the raw form of different species, there were significant differences detected. The quantity relationship between toxic elements in rainbow trout muscle was determined to be Cr >As > Pb > Hg > Cd. The toxic element levels from the highest to lowest level in order was determined to be Cr > Pb > As >Hg > Cd in horse mackerel and sea bass. This order was found to be Cr > As > Pb >Hg > Cd in Atlantic bonito, and Cr > Pb > Hg > Cd > As in bluefin tuna. These differences in the toxic metals among unprocessed fish species may be due to the origin of the species, environmental conditions, feeding and therefore the proximate composition. These results clearly indicate that each fish has a different capacity for bioaccumulation of toxic metals. Toxic element variations in different species were also the subjected of several studies; by Töre et al. [
51], Djedjibegovic et al. [
52] who reported that the toxic metals levels vary in the different fish species from Turkey and Bosnia and Herzegovina, respectively. There are many external and internal factors which affect the accumulation of toxic metals in fish muscle, from pH to salinity [
53]. Several processing methods which comprise heating, salting or drying make fish muscle more vulnerable to the bioaccumulation of these metals on fish products. There were significant variations of raw and smoked fish samples also observed (
Table 4 and
Figure 2A). Except horse mackerel, the level of Hg was decreased in the remaining species after the smoking process, and the highest Hg level determined in smoked horse mackerel which has the lowest moisture content among smoked samples. These findings clearly revealed that the relationship between Hg and moisture level of fish is in accordance with a previous study, highlighted by the reduction in Hg concentrations driven by thermal processes and moisture content [
54].
Except sea bass, the Pb levels were decreased in all remaining fish samples after the smoking process. The higher differences were observed as the relevant level decreased from 1.20 mg/kg to 0.32 mg/kg in Atlantic bonito and 0.95 mg/kg to 0.16 mg/kg in bluefin tuna, which means the smoking process reduced the excessive Pb level to an acceptable limit in these two species. In contrast, the Pb level was increased from 0.19 mg/kg to 3.20 mg/kg in sea bass. The concentrations of Pb, Cd, Hg, Cr, and Ar in commercial smoked catfish samples studied were very far below the maximum permissible limits approved by World Health Organization for grilled and smoked meat and fish, which are Pb (0.3 mg/kg); Cd (0.2 mg/kg), Hg (0.2 mg/kg), and Cr (0.3 mg/kg), and therefore the products will not constitute health risks to consumers. In three (rainbow trout, blue fin tuna and horse mackerel) of the five tested species, the health risks were found below the maximum permissible limits approved by EU (EC 2001 and the Turkish Food Codex (2011). The remaining species; in particular sea bass, Pb value levels were above the limit value of 0.03 mg/kg. Similarly, Şireli et al. [
55] reported that the Pb value of smoked fish samples differed from 0.01 to 0.8 mg/kg. Anigboro et al. [
56] also detected the Pb level range between 13 and 59 mg/kg in different species of smoked fish.
Except for bluefin tuna and seabass, the concentration of arsenic decreased following the smoking process; the following levels were found in rainbow trout (0.02 mg/kg), Atlantic bonito (1.18 mg/kg), bluefin tuna (2.16 mg/kg), sea bass (0.20 mg/kg) and horse mackerel (0.18 mg/kg). These findings are supported by previous research conducted by Töre et al. [
51], whose results show significant differences in As levels across various species. The Cd level of rainbow trout, Atlantic bonito, and bluefin tuna were decreased after the smoking process which was also reported by Abbas et al. [
57] who reported the Cd level decreased following the smoking approach in both grass carp fish and mullet fish. Except for smoked rainbow tuna, all the raw and smoked fish muscle were found to contain Cd above the maximum limit (0.05 mg/kg settled by EU, (EC 2001 and the Turkish Food Codex (2011))). The highest to lowest level of Cd in the smoked samples can be presented as sea bass > horse mackerel > Atlantic bonito > bluefin tuna > rainbow trout. The Cd level variation depending on species was also reported by Iko Afé et al. [
14] who concluded that the Cd level in fish species differed from 0.002 to 19.5 mg/kg. The Cr levels in both raw and smoked fish were found above the acceptable limits by the EU commission and Turkish Food Codex. The EU has thus set the limits of Cd in the muscle meat of mackerel at 0.10 mg/kg, and other fish at 0.05 mg/kg; for Pb and Hg they are 0.30 and 0.50 mg/kg, respectively (European Commission, 2015). While the highest Cr level was found in horse mackerel among the raw materials, the highest concentration (2.07 mg/kg) was found in smoked sea bass at 3.88 mg/kg. The differences were also found in other research that reported the Cr level varies in different fish, namely mangar, trout barb, common carp, Tigris scraper and Euphrates barbell [
58]. There is no permissible maximum limit for As and Cr level in the seafood in both the Turkish Food Codex 2011 and European commission EC (2001). In the proximal composition parameters, positive correlations were found between lipid content and PAH4 level (R
2 = (r = 0.875,
p < 0.05). No correlations were found between protein and PAH4 contents of tested fish sample (R
2 = 0.07,
p < 0.05)
Concentrations (mg/kg) of Zn and Fe were found to be relatively higher in both fresh and smoked samples, regardless of fish species (they ranged from 8.76 ± 0.01 to 20.20 ± 0.04 and 5.20 ± 0.02 to 18.10 ± 0.05, respectively). Bioaccumulation of these two trace elements on fish muscle at higher levels was also reported in several other studies [
20]. When comparing the fresh form of all the tested fish species, while the relatively higher zinc levels were determined in rainbow tuna (20.20 mg/kg) and Atlantic bonito (17.47 mg/kg), higher iron levels were found in bluefin tuna (18.10 mg/kg) and Atlantic bonito (15.65 mg/kg). The lowest concentration of these two trace elements were determined in fresh sea bass at 8.76 mg/kg and 7.73 mg/kg for Zn and Fe, respectively. The significant dominance of iron and zinc in the different fish species was also reported by [
59]. The significant differences in the trace elements (Mn, Co, Cu, Al, Ni, Se) driven by fish species and smoking process were also given in
Table 4.
While cobalt concentrations were found at the trace level in both fresh and smoked fish, samples ranged between 0.02 and 0.07 mg/kg; other trace metal levels were found at the higher limits given by fish species. When compared to trace element levels in the raw form of the tested species, while the levels of trace elements can be represented as Cu > Mn > Sn > Al >Se > Ni > Co in the rainbow trout muscle, the order determined as Mn > Cu > Al > Sn >Se > Ni > Co was changed in Atlantic bonito. In the bluefin tuna and sea bass, the trace element levels were determined as follows: Mn > Al > Cu > Sn Ni > Se > Co. The trace element from highest to lowest levels were found as Mn > Cu >Al > Sn> Se > Ni > Co in raw horse mackerel. It is thought that all these mentioned variations are caused by environmental factors and feeding and sampling area differences, which was also confirmed by Bibak et al. [
60] who found the variations of trace metal levels in the two species from the same gulf. In this study, the highest Cu level was found in the rainbow trout, which has also the highest protein content, and the highest level of Mn level was detected in horse mackerel which has the lowest total lipid content among the fish species. The variations in the trace metal levels among tested species might be due to the proximal differences of fish species. This result agrees with Canli and Atli, [
61] who reported that it is clear that the organic compounds such as lipid and protein impact on the bioaccumulation of trace elements. Statically significant differences were also determined in the trace element levels in the tested fish samples after the smoking process. (
Table 4,
Figure 2B). While except Mn, all the other trace elements level decreased after the smoking process in rainbow trout; in bluefin tuna, all the trace element levels were reduced except Cu. The relatively bigger difference between fresh and smoked forms of the tested species were observed in horse mackerel. In the present work, the Al level increased from 1.71 mg/kg to 2.05 mg/kg; Mn level increased from 2.74 mg/kg to 5.02 mg/kg, Sn concentrations increased from 0.37 mg/kg to 2.07 mg/kg in horse mackerel. These results are in agreement with Abbas et al. [
57] who reported that the trace element level of fish muscle differed following the smoking process. While the trace elements are essential for the metabolism, since the higher concentrations of these elements can cause toxicity, it is necessary in fish products, especially in the complex processing methods applied, such as smoking and canning.
The levels of macroelements (Mg and Ca) in the different fish muscle before and after the smoking process were determined in
Table 4,
Figure 2C. In terms of Mg, the highest (0.89 mg/kg) and lowest (0.45 mg/kg) levels were determined in horse mackerel and sea bass, respectively. The slight differences in the Mg concentrations were detected among smoked fish species samples. Another macro-element, the Ca levels of raw fish species differed between 1.56 and 2.13 mg/kg, which are in accordance with previous research that reported the Ca levels varied from 1.6 to 6.2 mg/kg in different species [
62]. Similarly to the other elemental variation, a significant increase and decrease was observed after the smoking process. While the Ca level decreased from 2.12 to 195 in Atlantic bonito, this level decreased from 2.13 mg/kg to 1.86 mg/kg in sea bass. The Ca level increased from 1.56 mg/kg to 2.04 mg/kg in rainbow trout, from 1.75 mg/kg to 1.80 mg/kg in bluefin tuna, and from 1.89 mg/kg to 1.99 mg/kg in horse mackerel. These results are in agreement with Olukayode Amos, and Paulina, [
63] who concluded that the Ca level was in the range between 2.26 and 3.13 mg/kg in Clarias gariepinus, and Synodontis budgetti, respectively. The variations of macro-elements in processed fish are mainly reasoned by brining steps [
64].
3.5. Health Risk Assessment
Table 5 summarizes the health risk assessment of PAHs in the analyzed raw and smoke fish samples for a person (an adult, 70 kg) within their dietary daily intake DDI and the carcinogenic potencies of individual PAHs.
The DDI values (mg/day) differed depending on estimated from individual PAH concentrations in both raw and smoked form of fish species. DDI values between the tested fish species were found to be statistically significant (
p < 0.05). DDI values of Benzo(a)anthracene (mg/day) were found to be extremely higher than other PAHs, as a result of the detected high level of this component on the fish muscle. As compared to smoked fish; DDI was determined in rainbow trout to range between 0 to 0.69, from 0.17 to 1.38 for Atlantic bonito. This value ranged between 0 and 1.04 for bluefin tuna, 0 to 0.69 for sea bass and 0.69 to 2.07 in horse mackerel. These results are in agreement with Tongo et al., who reported that the DDI for each PAHs differed in different smoked fish samples from C. gariepinus to T. zilli. The most dangerous parameter of PAHs, the benzo(a)pyrene level, did not exceed the maximum acceptable concentrations of 2.0 µg kg
−1 as permitted by The Turkish Codex Regulation (2008) [
65] in any raw or smoked sample. The carcinogenic potencies of individual PAHs (BaPteq) were also assessed by multiplying the PAH concentration in the mussel sample by the individual TEF. TEFs have been used as a useful tool for the regulation of PAH components, for instance, PAHs, which share a common mechanism of action. The carcinogenic potencies (B(A)Pteq) of the PAH compound were also determined and the values ranged from 0.000 to 0.608. Benzo(a)pyrene, known as one of the most carcinogenic PAHs, was determined to be between 0.001 and 0.062 in all tested samples. The level of benzo(a)anthracene was found relatively higher than other tested carcinogenic potencies of PAHs in the tested samples (0.066–0.608). The B(A)Pteq results obtained in this study clearly showed that carcinogenic potencies of PAHs differed depending on smoking and tested sample properties that are in agreement with previous research. The observed B(A)Pteq values were relatively lower than in previous research; Moslen et al. [
66] reported the B(A)Pteq values ranged between 0.012 to 900.0 for mussel, and Erhunmwunse and Ekaye [
67] determined that level differed from 3.91 to 8.47 in the smoked fish sample.
The estimated daily intakes of trace elements from the consumption of any of raw and smoked fish samples investigated are displayed in
Table 6. The lowest and highest EDI values were found in smoked rainbow trout and smoked sea bass, respectively, with 0.01 and 0.18 µg/day for Cd. The tolerable daily intake of Cd is 0.35 μg/kg/day (EFSA 2011) [
68]. All of the tested raw and smoked samples were below the recommended permissible limits. The EDI values ranged between 0.35 and 0.96 μg/kg/day in the smoked fish samples and the tolerable daily intake of Cr is declared as 3.3μg/kg day (WHO 2003) [
69]. None of the tested samples did not exceed the tolerable daily intake limit. The lowest and highest EDI values were determined in smoked rainbow trout and bluefin tuna for As with 0.02 µg/day and 0.53 µg/day. The permissible values were set as 0.3 µg/kg/day for As [
70]. Only one smoked fish sample (smoked bluefin tuna) has a daily intake value exceeding the tolerable daily intake. The daily intake for Pb differed from 0.04 to 0.79 µg/kg/day in the smoked fish samples. Only one smoked fish sample (smoked sea bass) exceeded the tolerable daily intake value (0.3 µg/kg/day). The EDI values of Hg ranged between 0.01 and 0.09 µg/kg/day and all the tested samples were below the permissible values, as 0.57 µg/kg/day. These results clearly showed that the EDI of trace element differ depending on fish species which is in agreement with Çulha et al. [
71] who highlighted that the daily intake rate at the different rate in various fish species. In the risk evaluation with regard to THQ value for Cr, Pb, As, Cd and Hg in the smoked fish muscles were shown at
Table 6. All the tested parameters found lower than 1, which indicates there is no concern for human health even in the EDI value exceeded groups [
71]. Regarding the trace metals, the THQ of As was found to be much higher than any other element, however, its values were far below 1.


