Article

Photoinduced Processes in Rhenium(I) Terpyridine Complexes Bearing Remote Amine Groups: New Insights from Transient Absorption Spectroscopy

1
Institute of Chemistry, University of Silesia, Szkolna 9, 40-006 Katowice, Poland
2
Department of Chemical Organic Technology and Petrochemistry, Silesian University of Technology, Krzywoustego 4, 44-100 Gliwice, Poland
*
Authors to whom correspondence should be addressed.
Molecules 2022, 27(21), 7147; https://doi.org/10.3390/molecules27217147
Submission received: 8 September 2022 / Revised: 18 October 2022 / Accepted: 19 October 2022 / Published: 22 October 2022
(This article belongs to the Section Organic Chemistry)

Abstract

:
Photophysical properties of two Re(I) complexes [ReCl(CO)3(R-C6H4-terpy-κ2N)] with remote amine groups, N-methyl-piperazinyl (1) and (2-cyanoethyl)methylamine (2), were investigated. The complexes show strong absorption in the visible region corresponding to metal-to-ligand charge transfer (1MLCT) and intraligand-charge-transfer (1ILCT) transitions. The energy levels of 3MLCT and 3ILCT excited-states, and thus photoluminescence properties of 1 and 2, were found to be strongly affected by the solvent polarity. Compared to the parent chromophore [ReCl(CO)3(C6H5-terpy-κ2N)] (3), both designed complexes show significantly prolonged (by 1–2 orders of magnitude) phosphorescence lifetimes in acetonitrile and dimethylformamide, contrary to their lifetimes in less polar chloroform and tetrahydrofuran, which are comparable to those for 3. The femtosecond transient absorption (fsTA) measurements confirmed the interconversion between the 3MLCT and 3ILCT excited-states in polar solvents. In contrast, the emissive state of 1 and 2 in less polar environments is of predominant 3MLCT nature.

Graphical Abstract

1. Introduction

The first report on the photoluminescence of Re(I) carbonyl complexes fac-[ReX(CO)3(NN)] with 1,10-phenanthroline and its derivatives in solution at room temperature, ascribed to the 3MLCT [d(Re)–πphen] excited-state origin, was published in 1974 [1]. Since this groundbreaking work of Wrighton and Morse, neutral and monocationic complexes of type fac-[ReX(CO)3(NN)]n (NN = diamine, X = halides, pseudohalides, pyridine, imidazole, and related N-heterocycles, n = 0 or 1+) have become a topic of intense research due to their intriguing photoluminescent properties [2,3,4,5,6,7,8,9,10,11,12,13,14,15,16,17,18,19] and potential applications for photocatalytic carbon dioxide reduction [20,21,22,23], organic light-emitting diodes [24,25,26,27,28,29], solar energy conversion [30,31,32,33], and medicinal applications [34,35,36,37,38,39,40,41,42,43,44]. Taking advantage of the relatively simple synthetic procedures of fac-[ReX(CO)3(NN)]n and wide range of possible structural modification of α-diimine ligands, it has been possible to perform systematic studies of these systems. Consequently, Re(I) carbonyls have highly contributed to an understanding of photophysical and light-induced electron-transfer and electronic energy-transfer processes in transition metal complexes. It has been shown that introduction of suitable substituents into α-diimine core and alteration of the ancillary ligands (X) not only fine-tunes the energy and intensity of the emission from the triplet 3MLCT excited state, but also can make changes in the ordering and energetic spacing between the excited states. In the latter case, photophysical properties of resultant complexes fac-[ReX(CO)3(NN)]n are determined by excited states other than MLCT, namely LLCT (ligand-to-ligand-charge-transfer), IL (intraligand), and ILCT (intraligand-charge-transfer), or their superposition [2,3,5,6,45,46,47].
In recent years, particular attention has been paid to the development of Re(I) with a small energy gap between two close-lying energy triplet excited states 3MLCT and 3IL, allowing formation of the excited-state equilibrium between these levels. A typical feature of such systems is an extraordinarily long-emission lifetime, which greatly exceeds the value observed for the parent 3MLCT chromophore [1,48,49,50,51,52,53]. One of the methods for introducing the triplet states into equilibrium is to append organic chromophore with the appropriate triplet energetics to interact with the charge-transfer state [54]. The best example is Re(I) carbonyl complex bearing N-(1,10-phenanthroline)-4-(1-piperidinyl)naphthalene-1,8-dicarboximide, for which the photoluminescence lifetime was increased approximately 3000-fold at room temperature relative to that of the parent complex [ReCl(CO)3(phen)]. Its excited-state lifetime (τ = 651 μs) is one of the longest, observed for excited-state lifetime for Re(I)-based CT chromophores at room temperature [50].
Prolonged lifetimes were also confirmed for some Re(I) carbonyls with emitting state of 3ILCT nature, for example [ReX(CO)3(phen-TPA)] (X = Cl, Br) and [ReCl(CO)3(Me2N-C6H4-terpy-κ2N)] [53,55]. This approach opens possibilities to modulate the properties of these systems, especially that the introduction of donor-π-acceptor type (D-A, D-π-A) ligands into a heavy metal coordination sphere is an effective way for lowering the energy gap of compounds to realize deep red or NIR light emission and offer additional advantages in optoelectronic properties due to efficient hole-transporting abilities of the bipolar systems [13,56,57]. Regarding the convenience of structural modifications of the 2,2′:6′,2″-terpyridine framework [58,59,60,61,62,63,64,65], [ReCl(CO)3(R-C6H4-terpy-κ2N)] complexes of bidentate-coordinated 4′-(4-substituted-phenyl)-terpyridine-like ligands with strong electron-donating groups were found to be suitable systems for studies of photoinduced ILCT processes, and they were regarded as promising photoluminescence materials [55,66].
This study is focused on the examination of the effect of the aliphatic cyclic amine (N-methyl-piperazinyl) and aliphatic amine with an additional electron-withdrawing C≡N unit (-N(CH3)(CH2CH2CN)) attached to the central pyridine ring of the terpy core via phenylene linkage on ground- and excited-state properties of resulting Re(I) complexes.
The impact of the remote amine groups on photophysical properties of [ReCl(CO)3(N-methyl-piperazinyl-C6H4-terpy-κ2N)] (1) and [ReCl(CO)3((CH3)(CH2CH2CN)N-C6H4-terpy-κ2N)] (2) were examined with the use of absorption and emission spectroscopies, transient absorption. It was also stimulated by the density functional theory (DFT) and time-dependent DFT methods. To obtain a deeper understanding of structure-property relationships, the ground- and excited-state properties of 1 and 2 were evaluated in relation to the previously reported [ReCl(CO)3(C6H5-terpy-κ2N)] (3) and [ReCl(CO)3(Me2N-C6H4-terpy-κ2N)] (4) (Scheme 1). While the parent chromophore (3) is a typical 3MLCT emitter [67], time-resolved infrared (TR-IR) spectroscopy studies of Re(I) complex with N,N-dimethylamine remote group (4) confirmed the ILCT nature of its lowest triplet state [55].
Here, we show that the interplay between 3MLCT and 3IL/3ILCT excited states in complexes 1 and 2 is also strongly affected by solvent polarity. In polar solvents, the incorporation of N-methyl-piperazinyl and (2-cyanoethyl)methylamine leads to a significant enhancement of the excited-state lifetime relative to complex 3 due to the interconversion of 3MLCT into 3ILCT at early time delays. In solvents with a low polarity, a crucial role in determining photophysical properties of 1 and 2 plays 3MLCT excited state.

2. Results

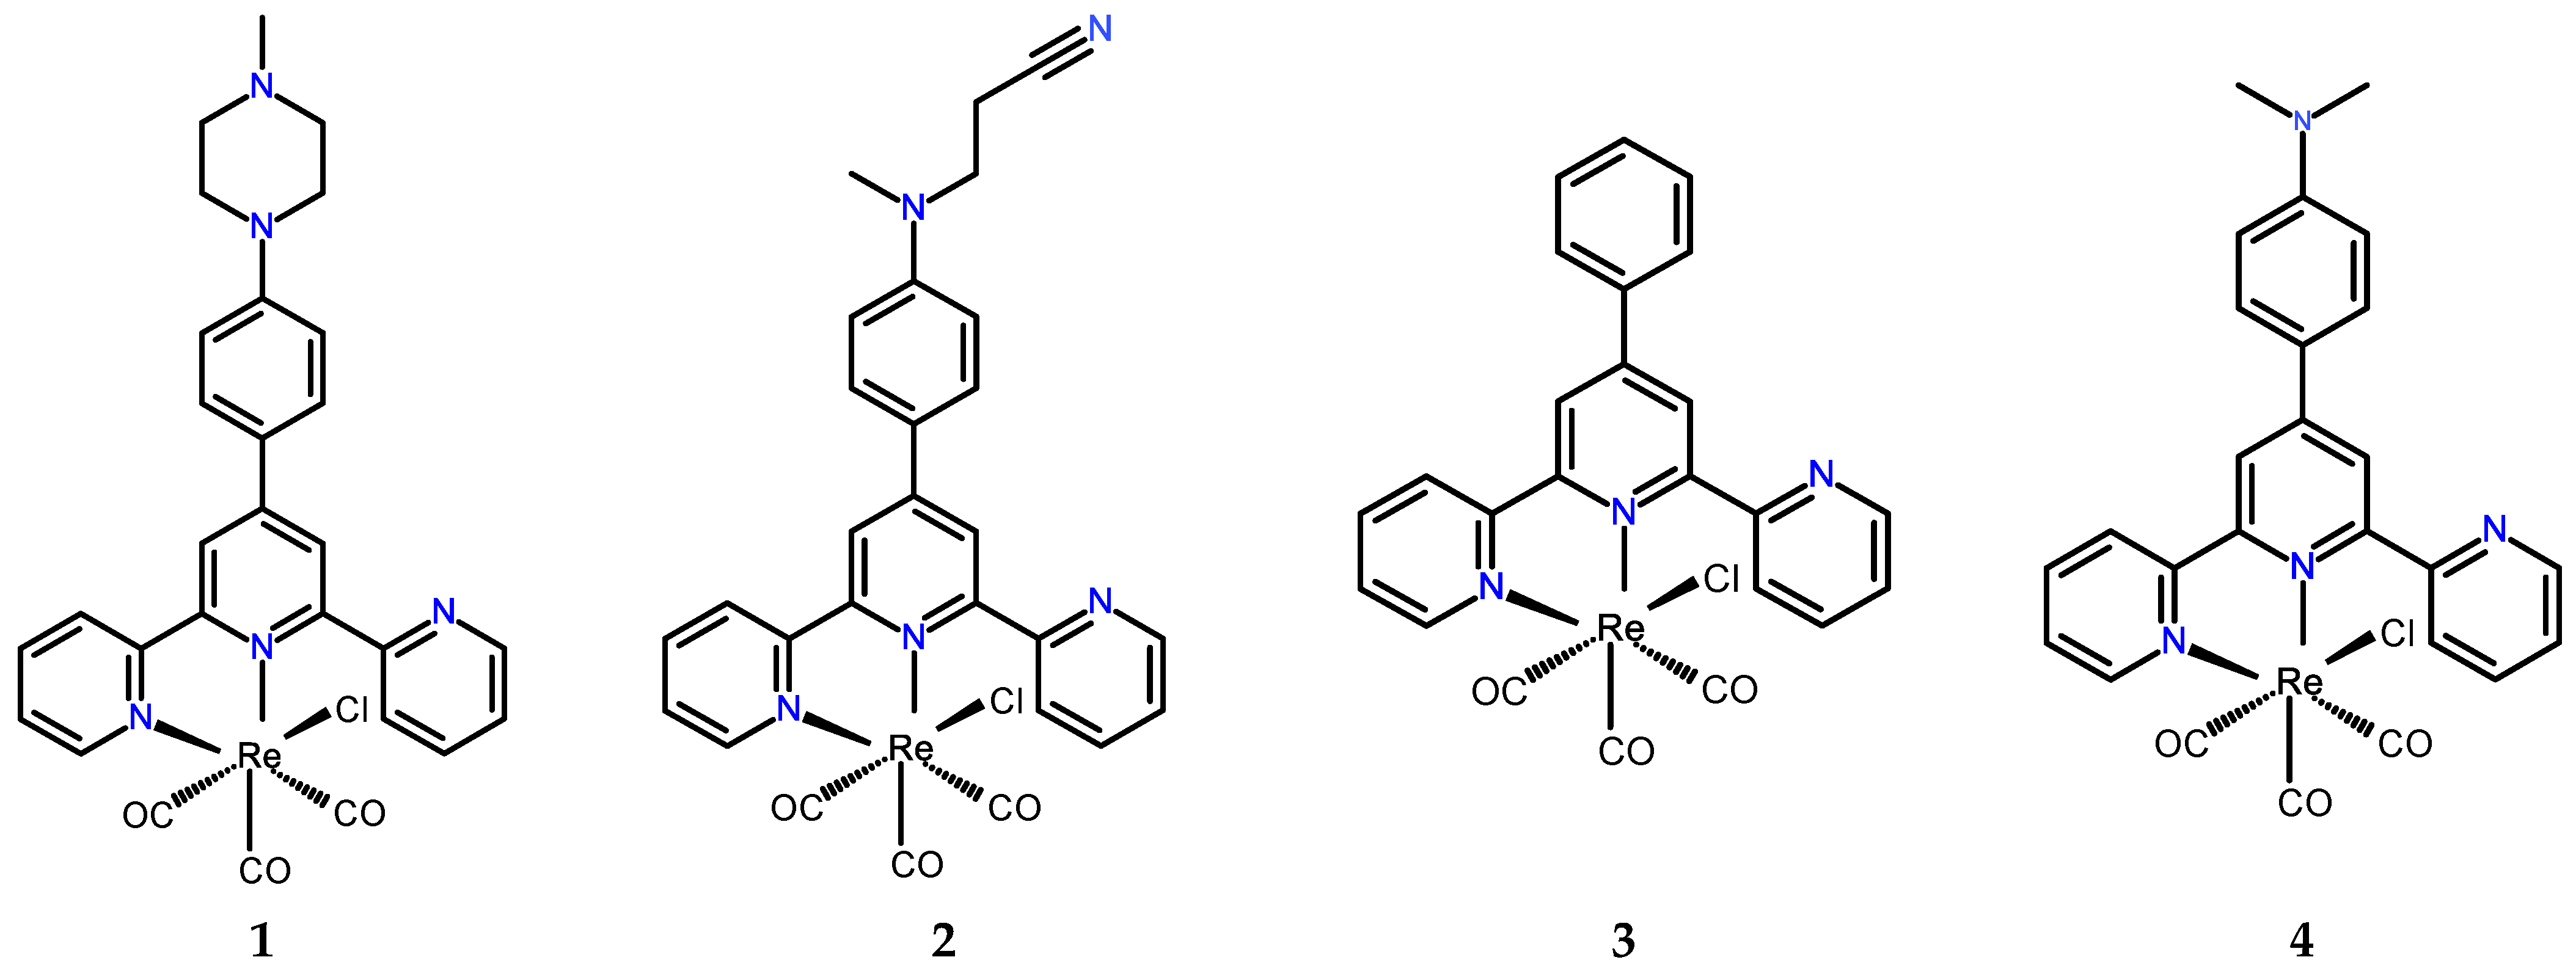
2.1. Synthesis and Molecular Structures

The complexes 1 and 2 (Scheme 1) were prepared by reacting the respective 4′-(4-substituted-phenyl)-terpyridine ligand with the rhenium(I) complex [Re(CO)5Cl] in refluxing acetonitrile under argon atmosphere. The molecular structures of 1 and 2 were established with the aid of 1H and 13C NMR, and HRMS spectra, elemental analysis, and single-crystal X-ray analysis for 1.
The complex 1 crystallizes in the P21/c space group of the monoclinic system (Table S1). The asymmetric unit of 1 consists of two crystallographically independent molecules (Figure 1), showing negligible variations in bond lengths, bond angles, and conformations.
In each molecule, the Re(I) ion is co-ordinated with two pyridyl nitrogen atoms of N-methyl-piperazinyl-C6H4-terpy ligand, three facially arranged carbon atoms of three carbonyl groups and one chloro ligand, giving a distorted octahedral geometry. The uncoordinated pyridine ring is rotated by 49.83° and 62.43° from the plane of the central pyridine ring for Re(1) and Re(2), respectively. All the bond lengths and angles around the Re atom are comparable to those of the reported structurally related compounds [27,28,52,66,68,69,70,71,72,73]. Additional structural data are given in ESI, Tables S3–S5, and Figure S1.
The facial arrangement of carbonyl ligands in 1 and 2 is also corroborated by solid-state IR spectroscopy (Figures S2 and S3). Both complexes display the characteristic pattern of CO-stretching frequencies for fac-geometry, represented by an intense band at higher wavenumbers (2018 cm−1 for 1 and 2017 cm−1 for 2) and two overlapping lower-energy bands (1922–1879 cm−1).
In agreement with the κ2N coordination of 4′-(4-substituted-phenyl)-terpyridine ligand, the 1H NMR spectra of 1 and 2 complexes display two sets of signals for protons of the peripheral pyridine rings. Detailed assignment of signals to respective atoms was based on the recorded 1H-1H COSY, 1H-13C HMQC, and 1H-13C HMBC NMR spectra (Figures S4–S17).

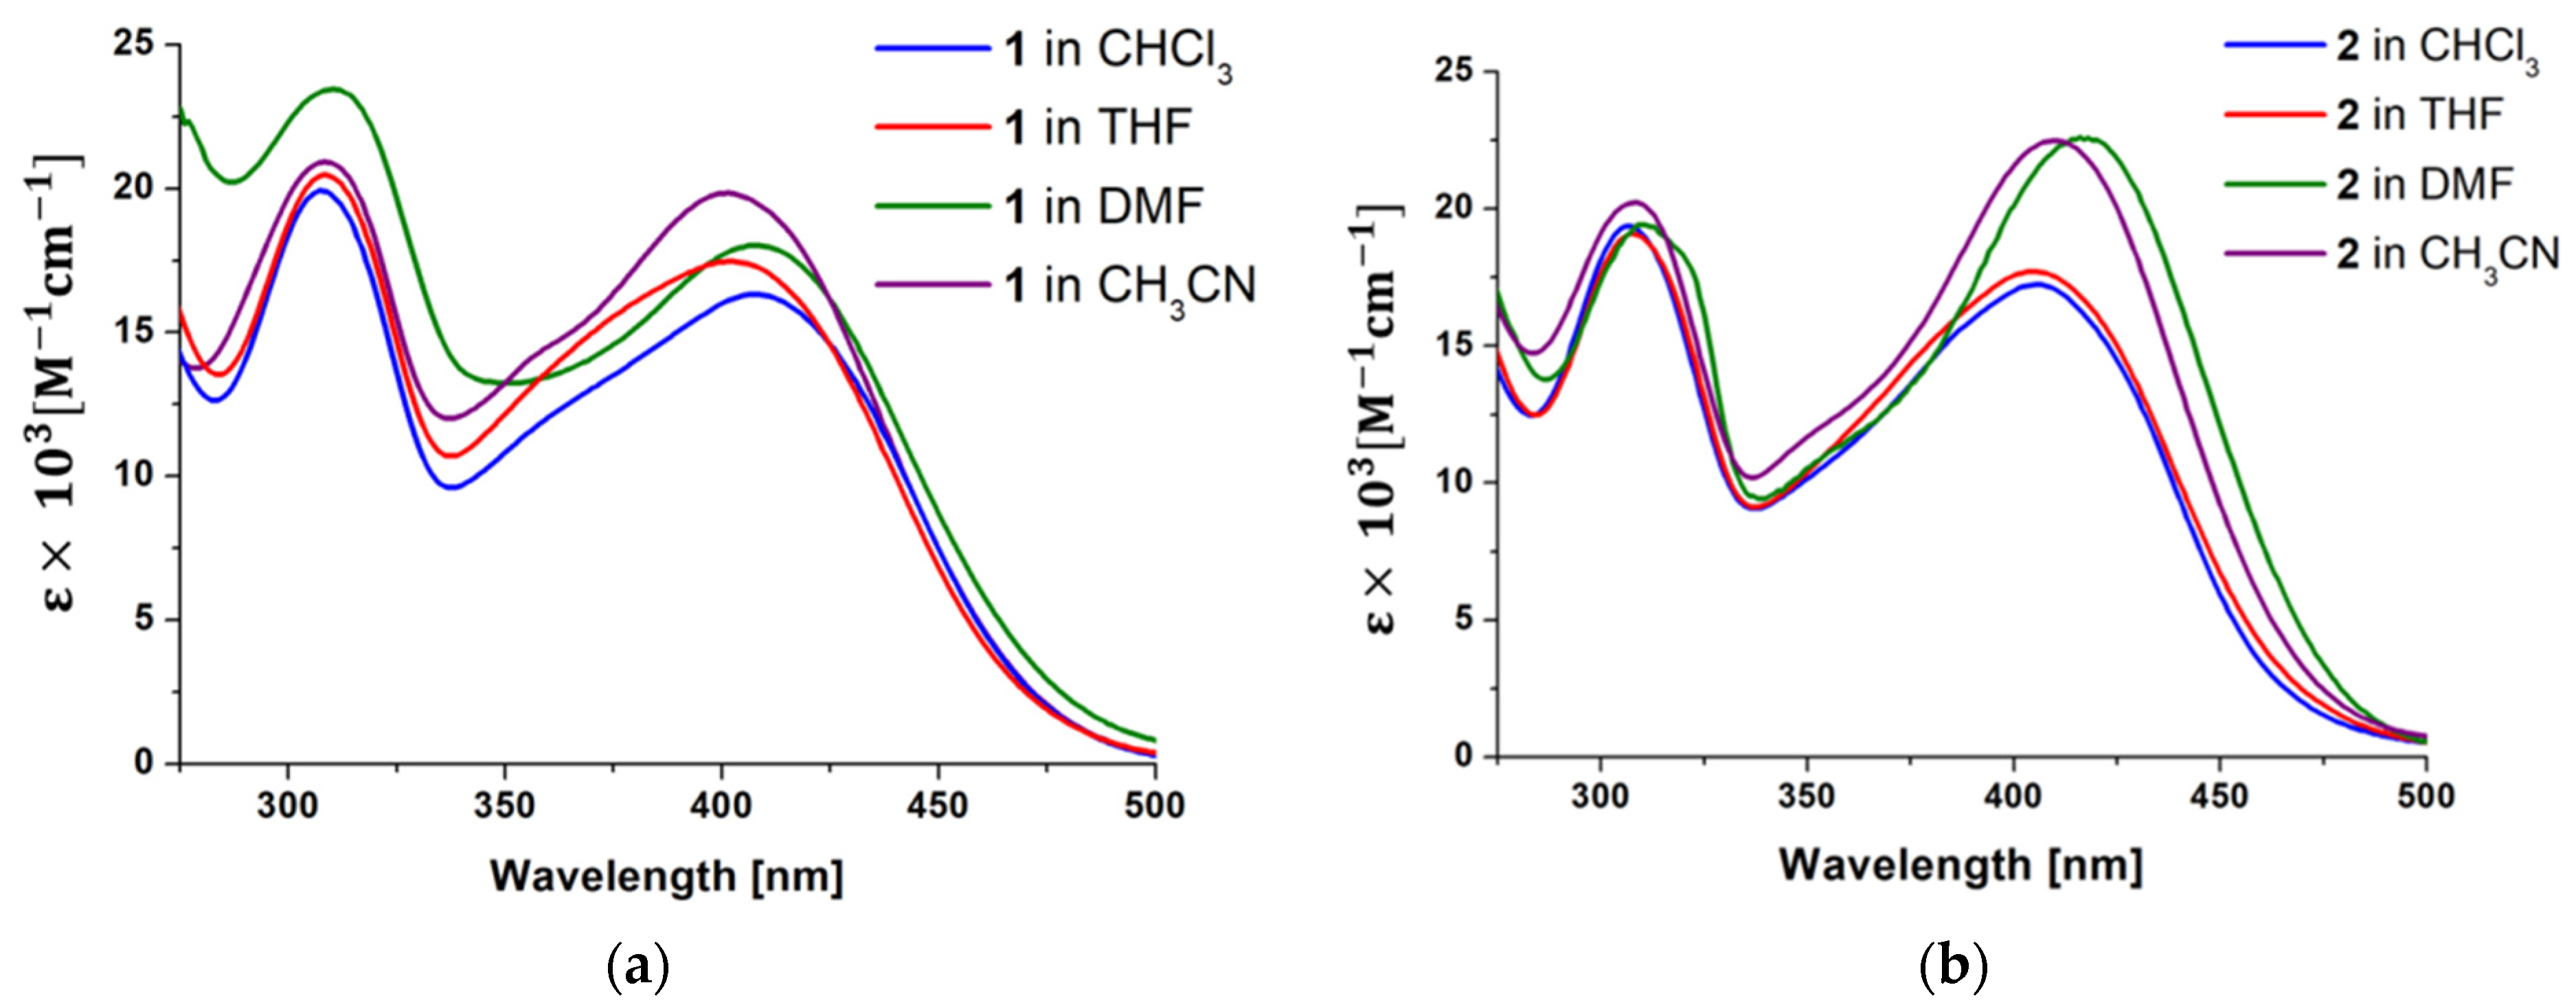
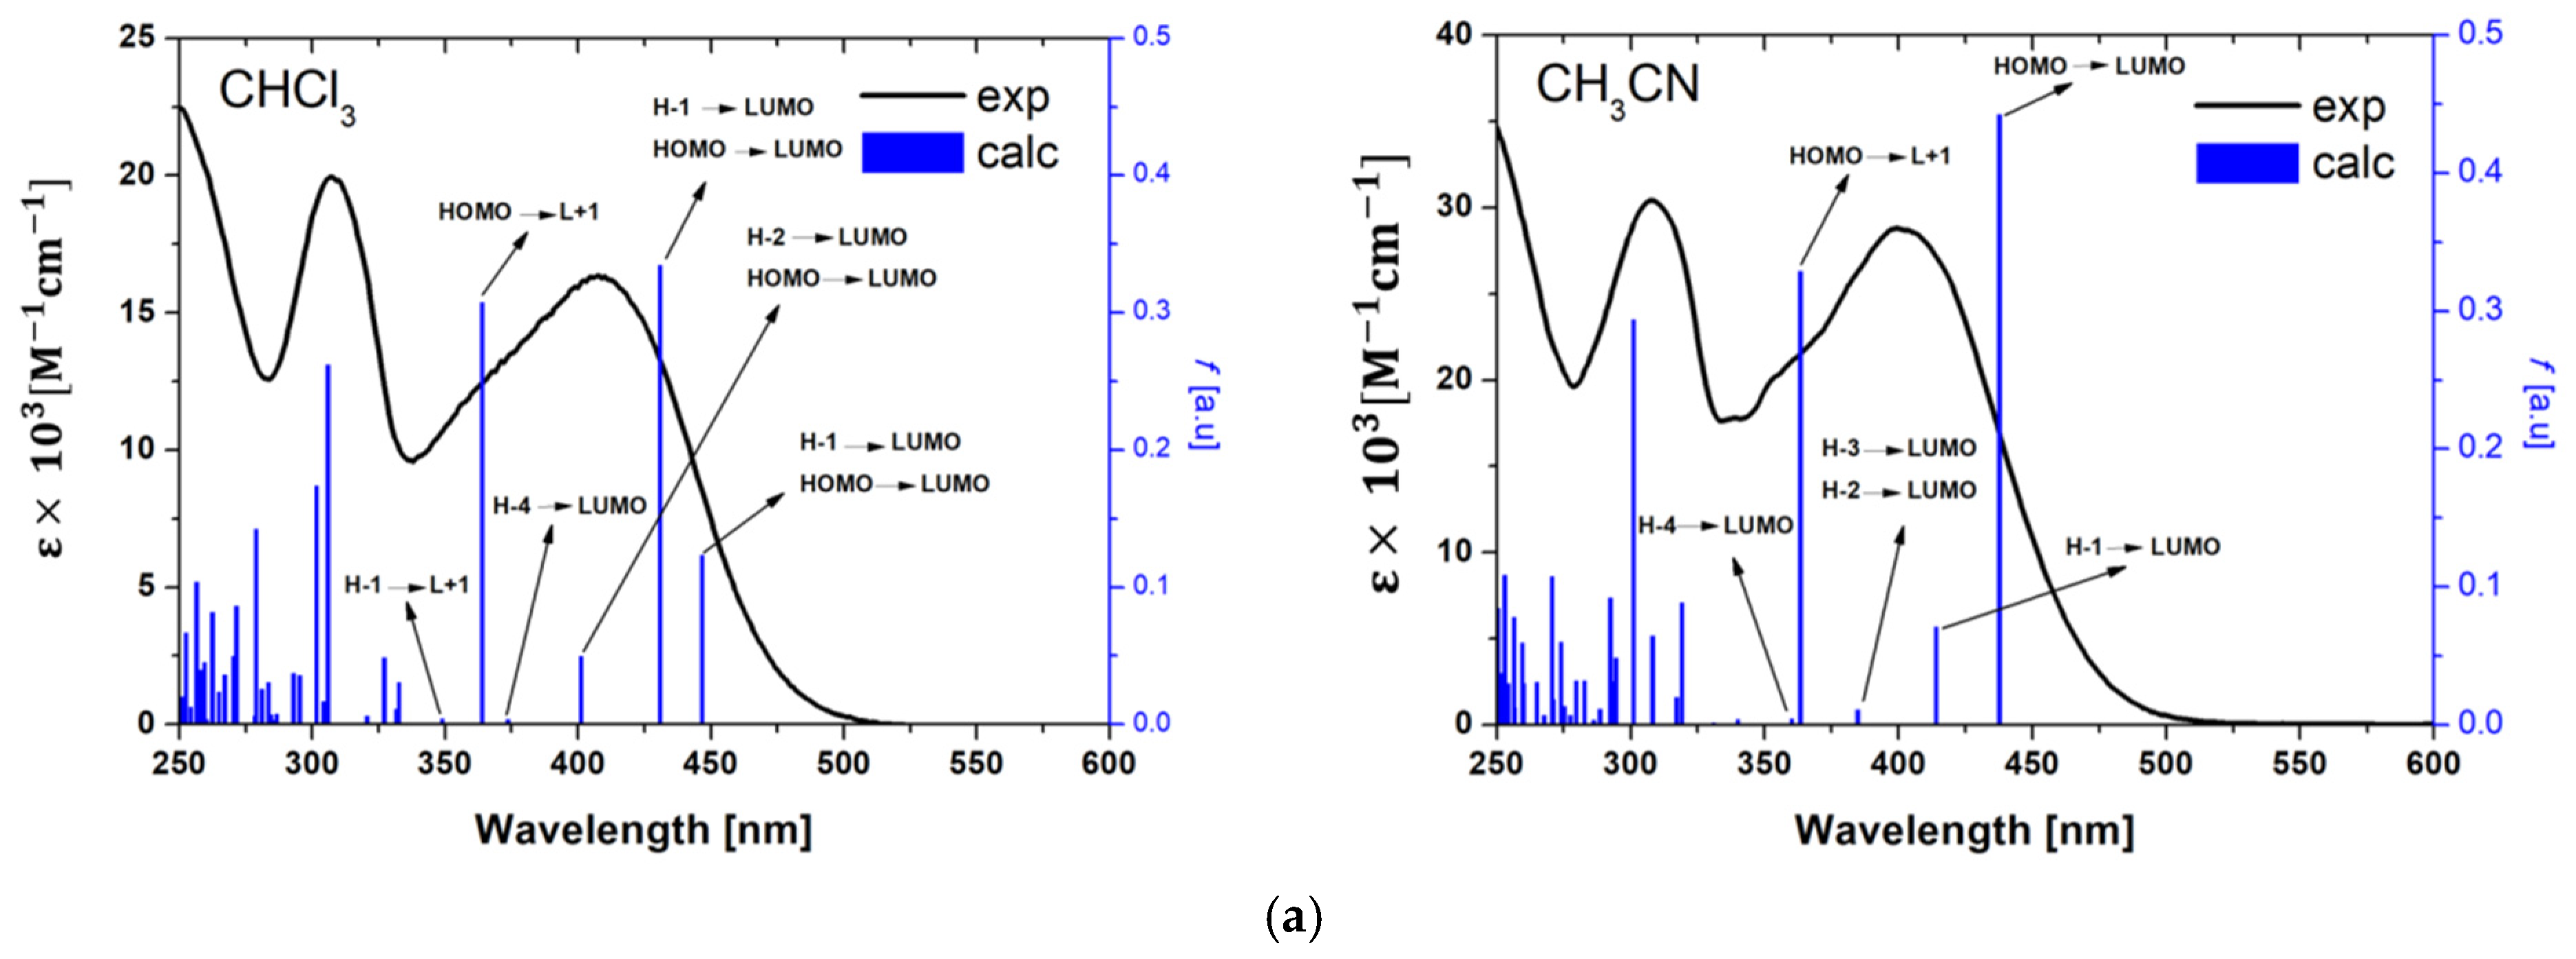
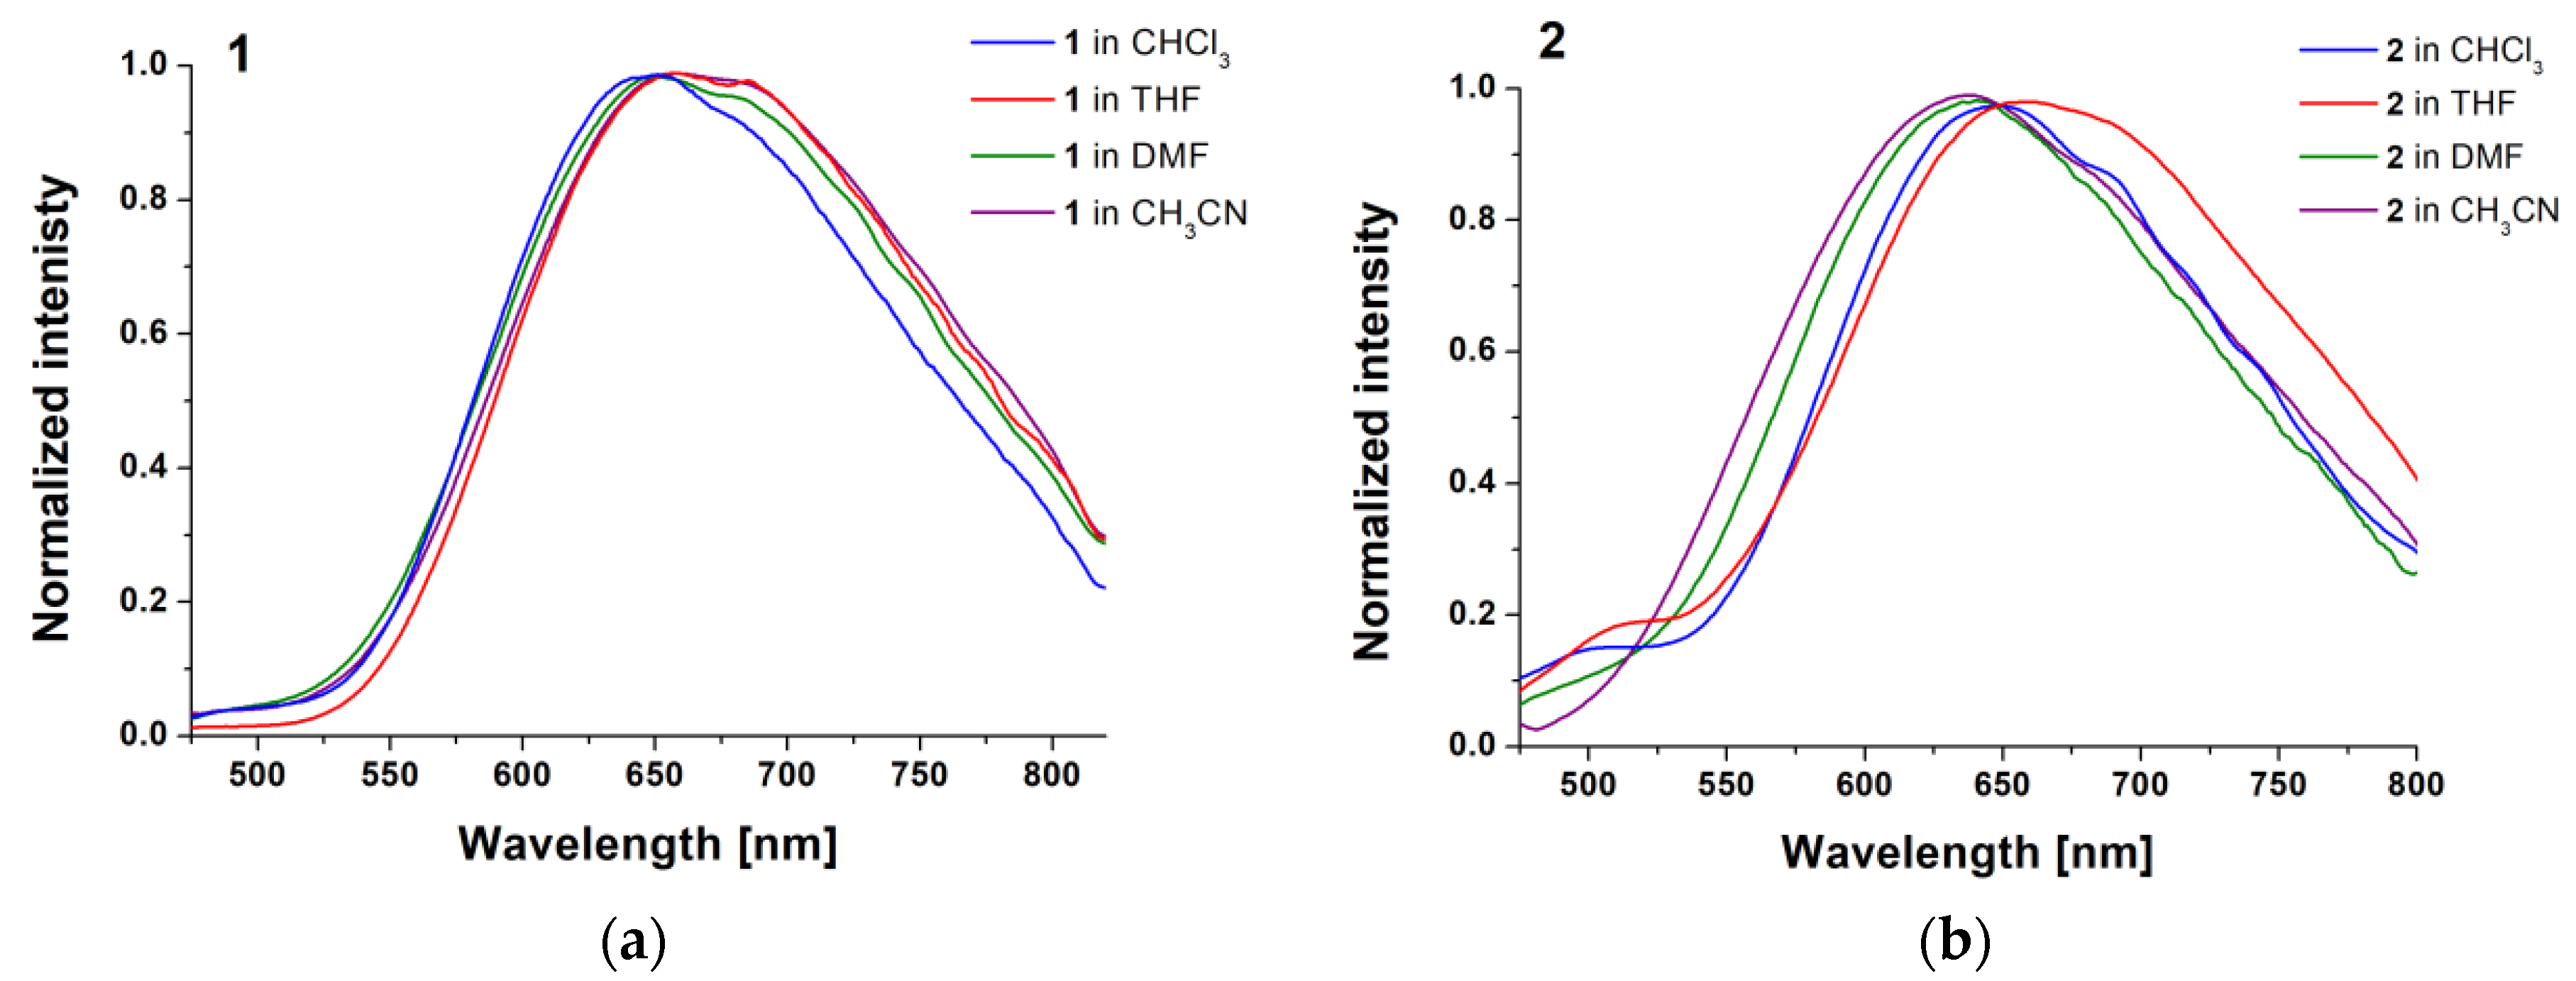
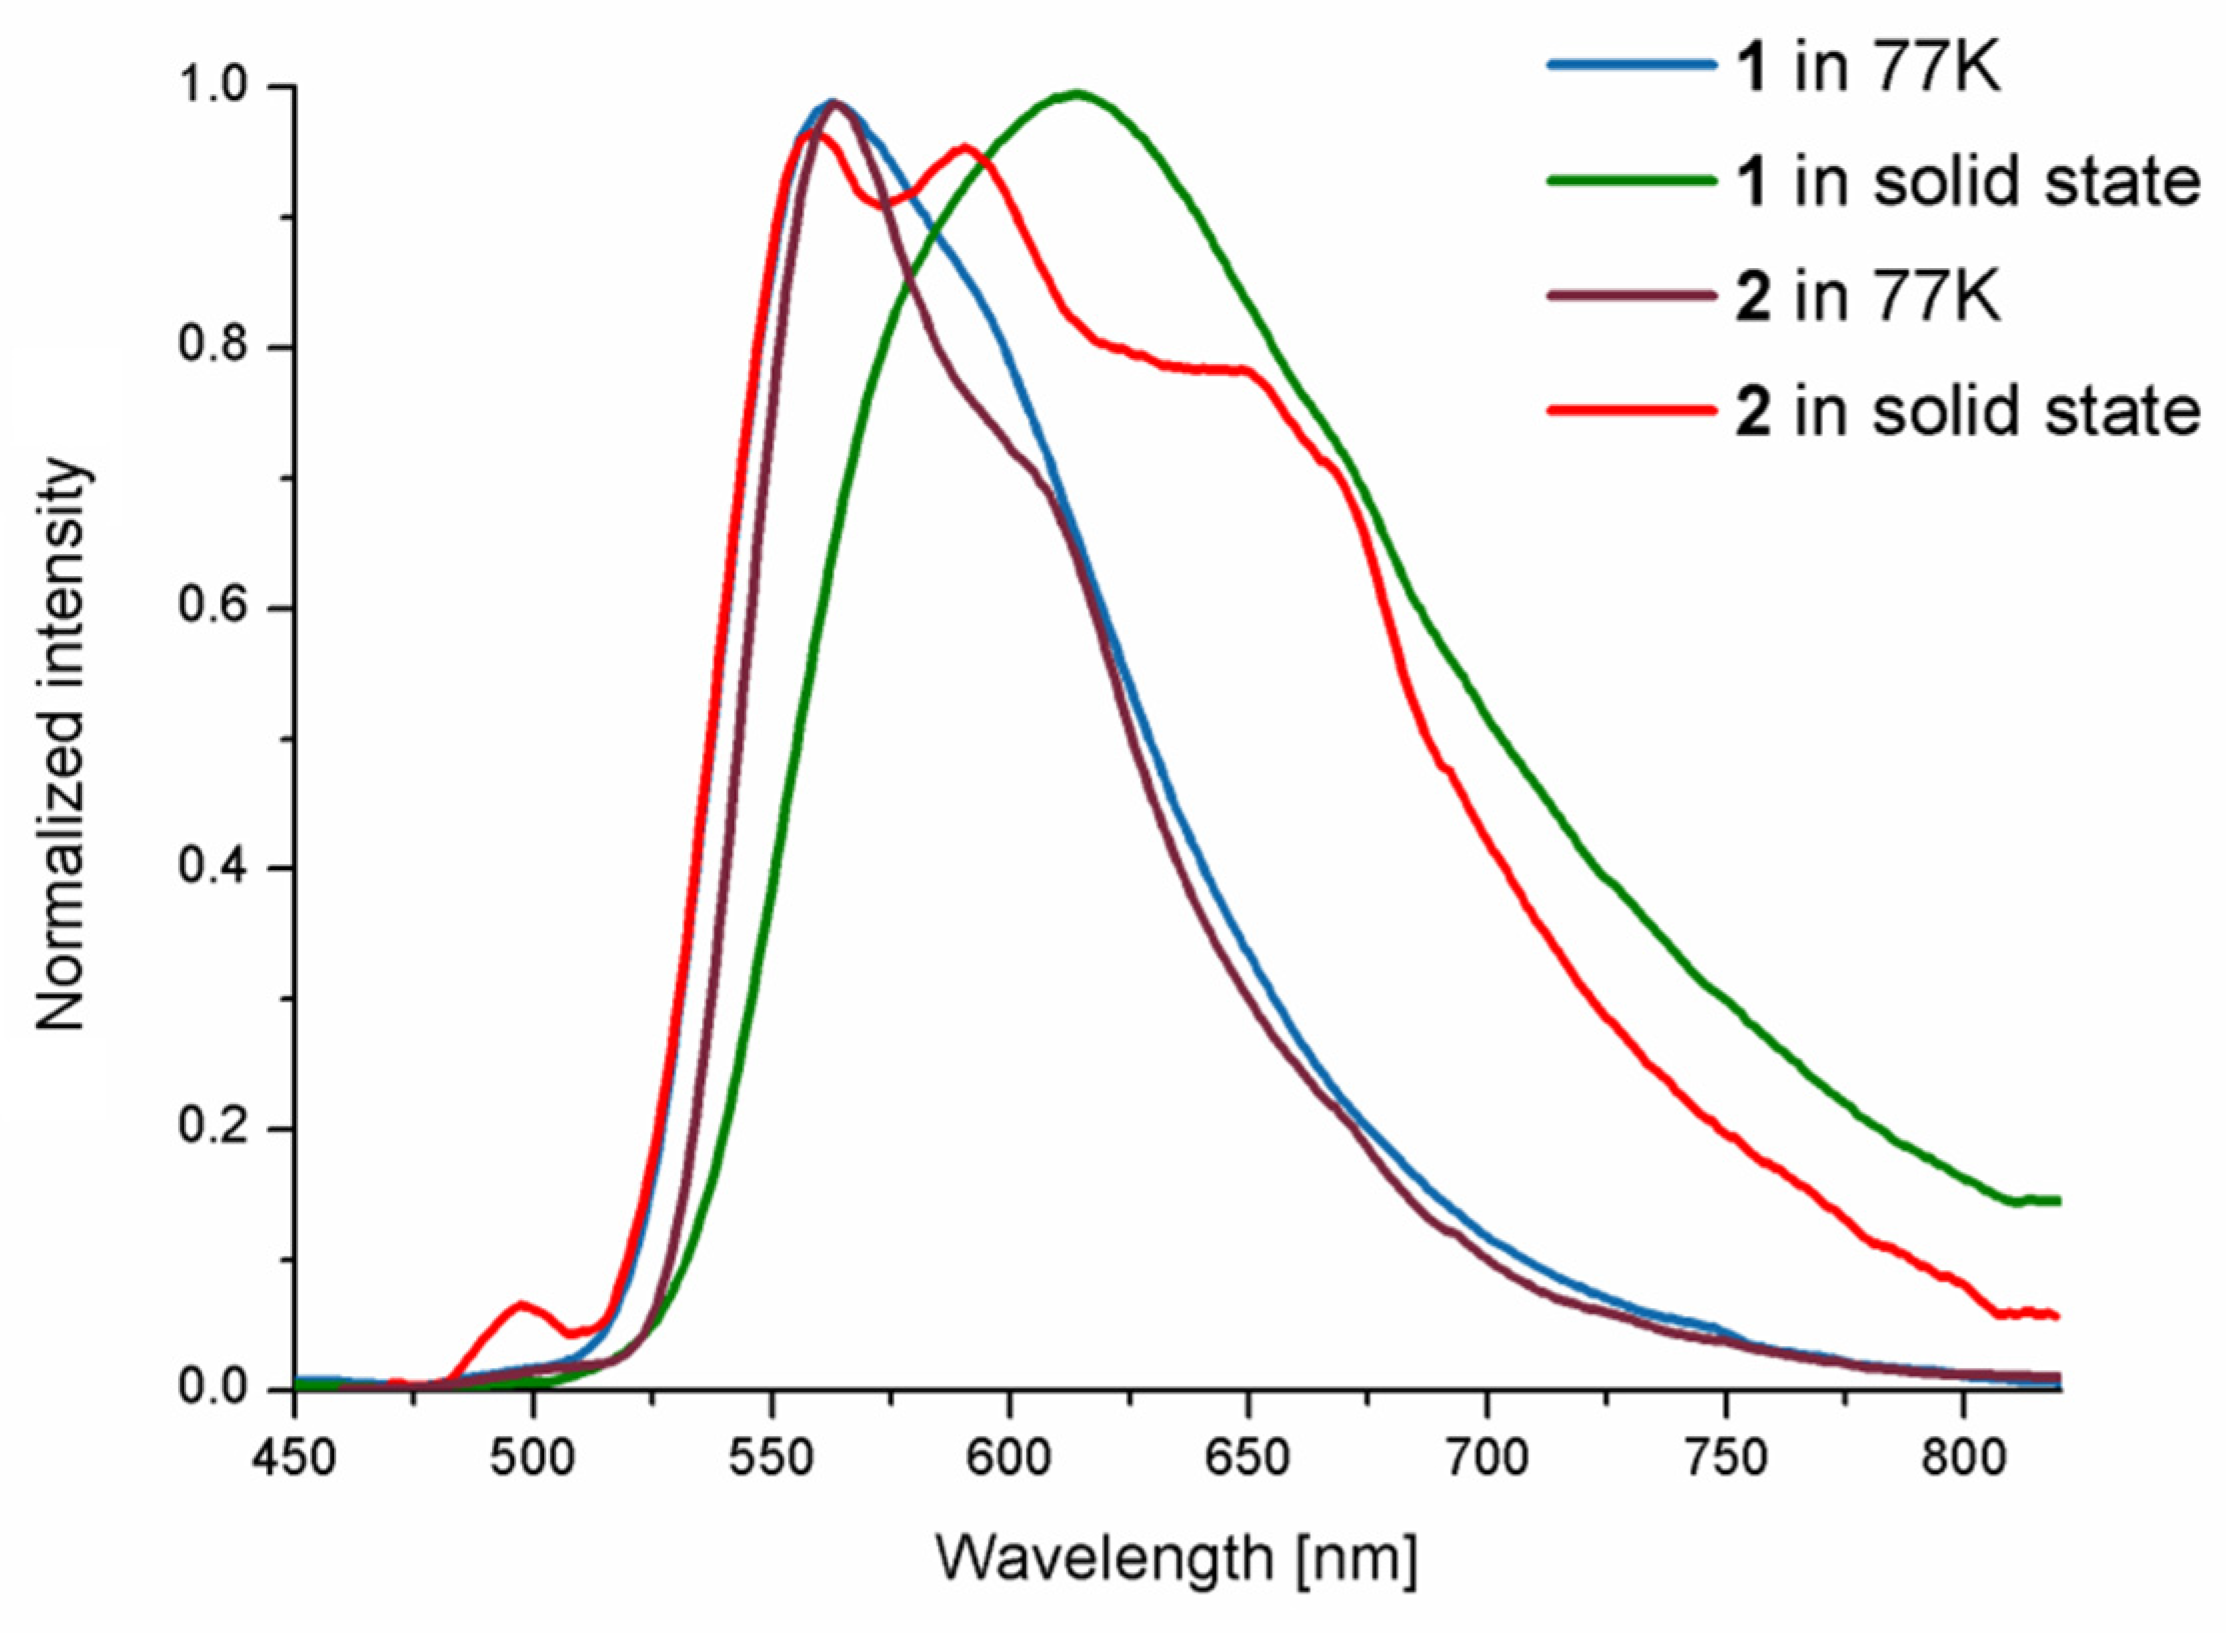
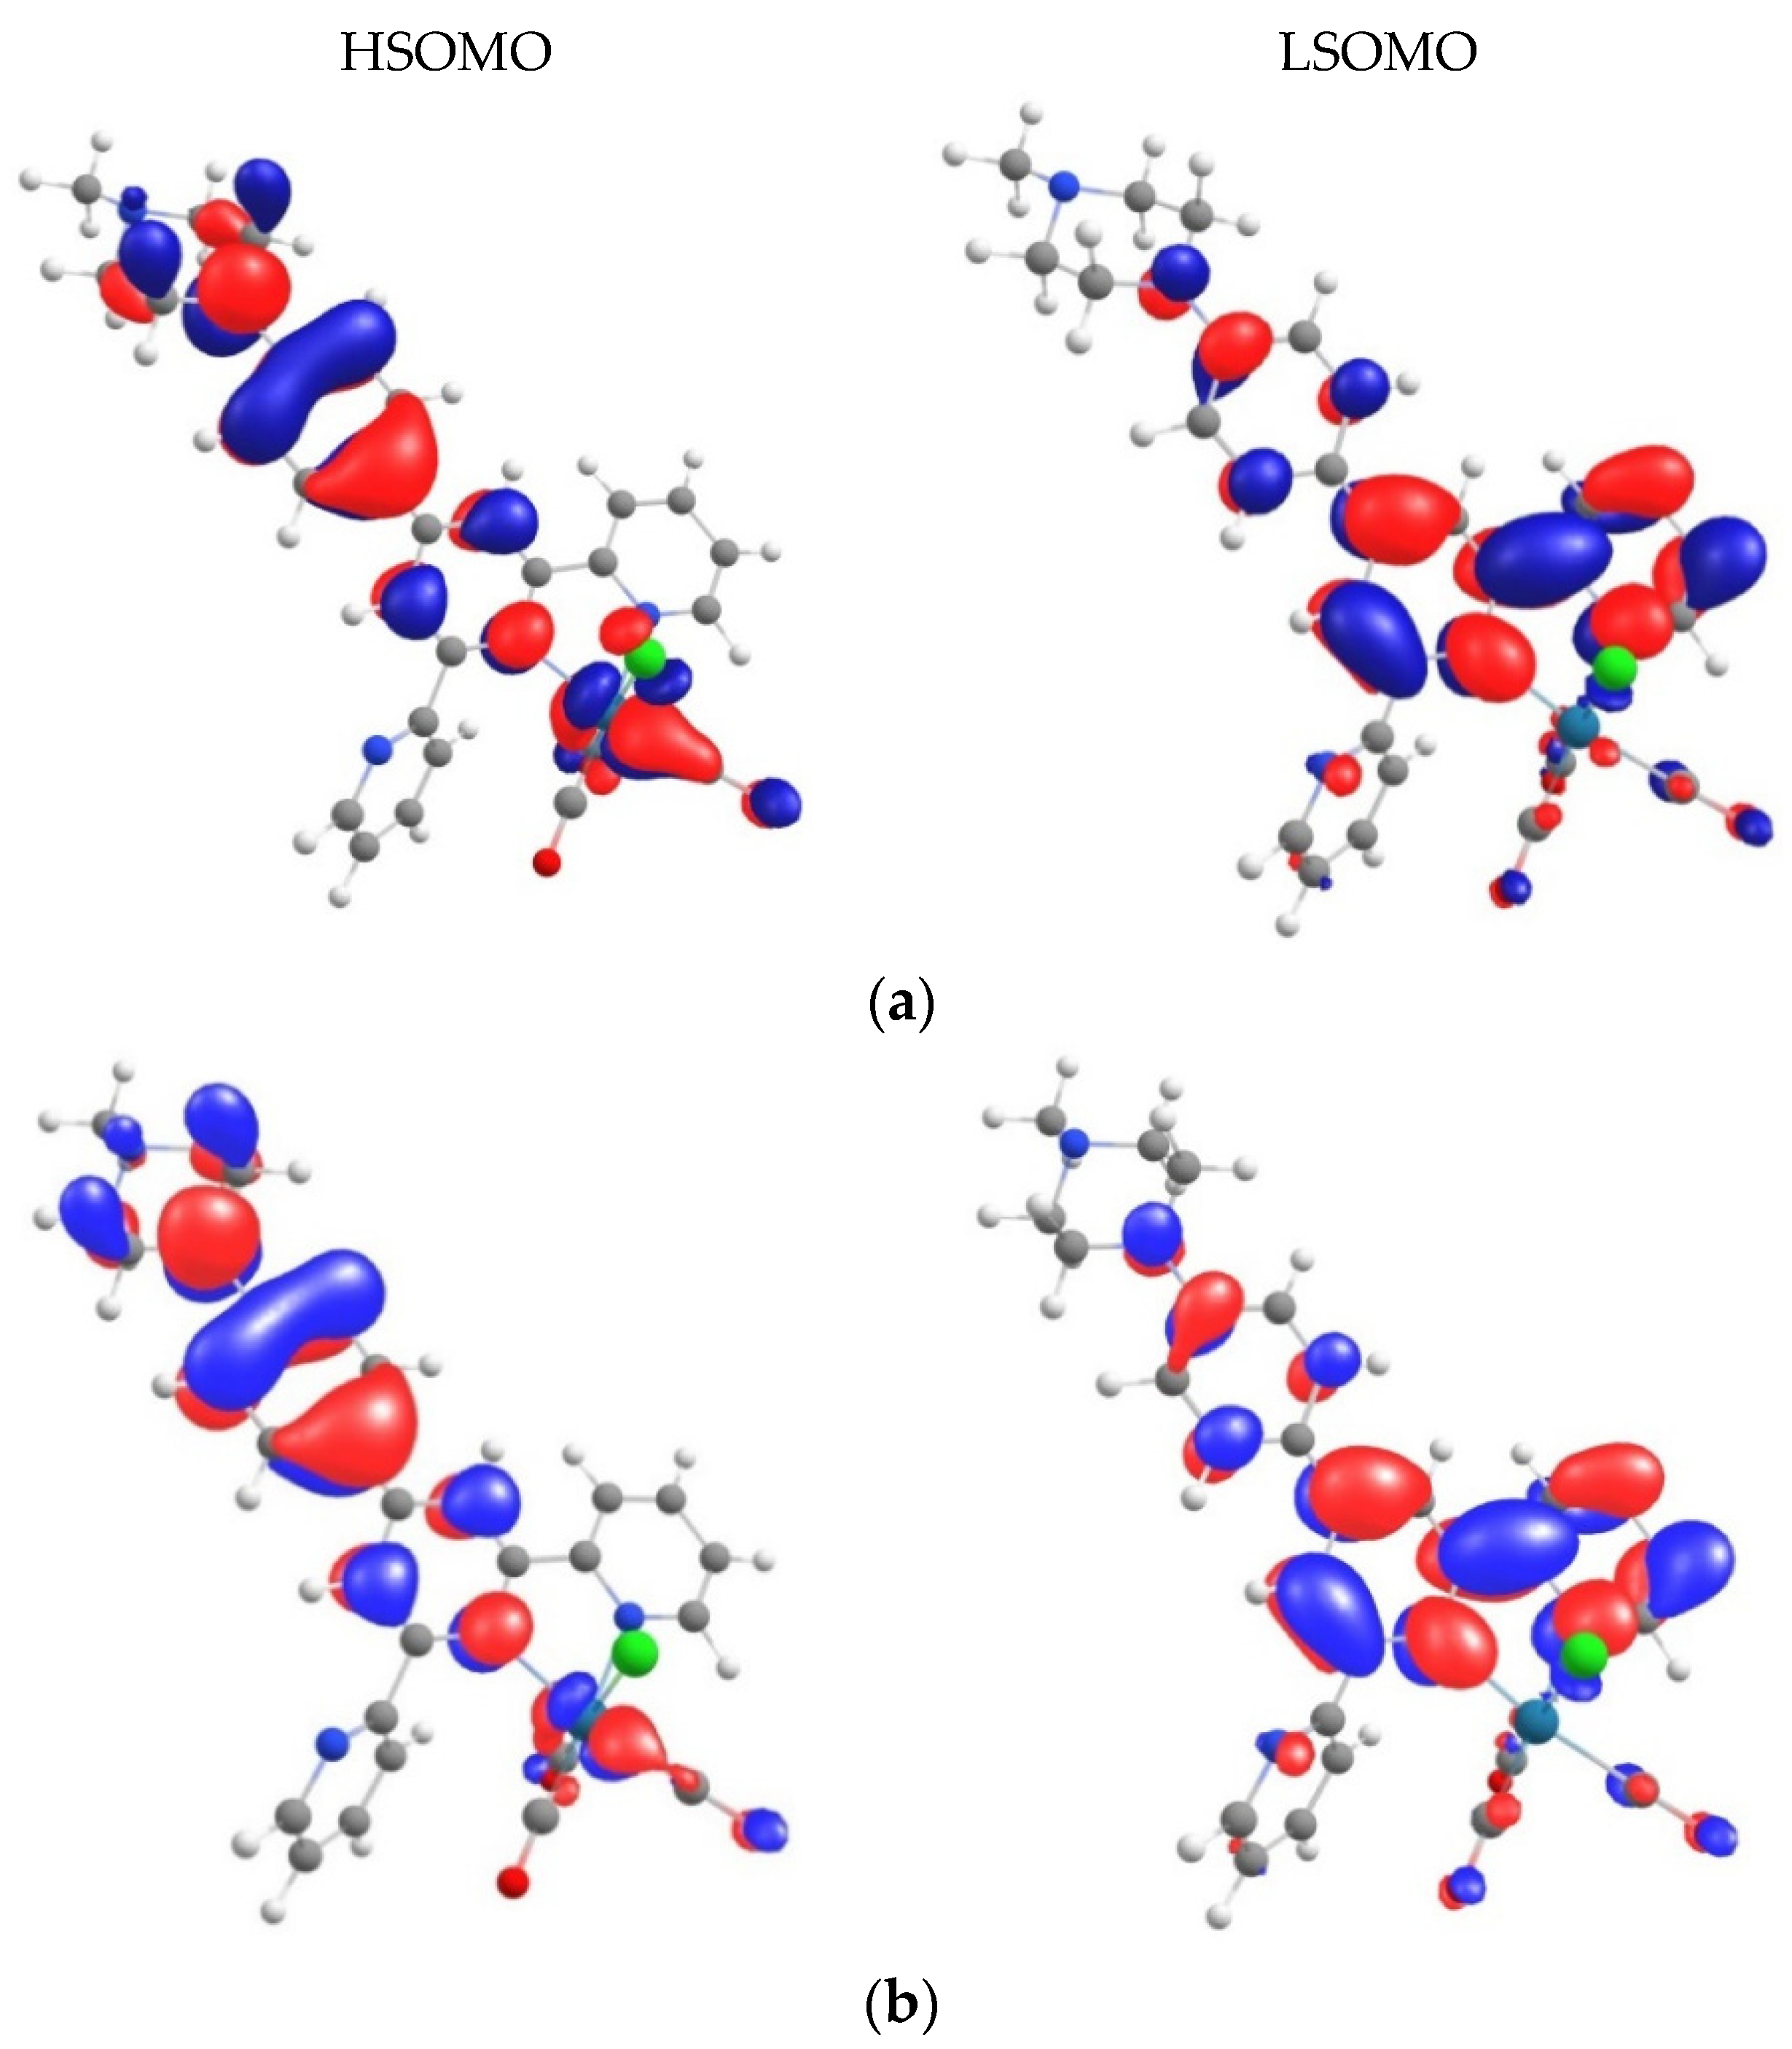
2.2. Photophysical Behavior—Experimental and Theoretical Insights

Absorption spectra of Re(I) complexes were studied in chloroform, tetrahydrofuran, acetonitrile, and dimethylformamide (Table 1 and Figure S22). UV-Vis spectra of 1 and 2 are shown in Figure 2, and their relevant spectral data are summarized in Table 1.
Both complexes have similar absorption profiles, showing an intraligand 1IL absorption band in the high-energy range 280–340 nm along with a broad and asymmetric band in the visible region, not observed in the absorption spectra of the free ligands (Figure S22) and assigned to superposition of transitions 1MLCT and 1ILCT with the reference to previous studies [17,53,55,66,67,72,74].
The contribution of 1ILCT excitations in the visible absorption of 1 and 2 is rationalized by a significant increase in the absorption intensity and bathochromic shift of the lowest energy band compared to 1MLCT of reference sample(3). In acetonitrile, the absorption maximum wavelength of 1 and 2 is shifted to longer wavelengths by 27 and 35 nm, respectively (Table S6). The molar extinction coefficients of 1 and 2 are at least six times higher than that for 3, reaching up to 22,500 M1·cm1 (for 2 in CH3CN). Moreover, 1 and 2 do not show a negative solvatochromism, evidenced for reference 3 and typically observed for [ReX(CO)3(NN)] with the longest wavelength absorption band of MLCT character [5,75]. Except for 1 in CH3CN, the visible absorption maxima of examined Re(I) complexes occur at longer wavelengths compared to those in chloroform solutions. It is also worth emphasizing that 1 and 2 show a less pronounced red-shift of the lowest-energy absorption relative to 3 in less polar chloroform, and the lowest-energy absorption of 1 is less affected by variations in solvent polarity than that of 2. Relative to [ReCl(CO)3(Me2N-C6H4-terpy-κ2N)] (4), the longest-wavelength absorptions of 1 and 2 are blue-shifted by 9–25 nm (Figures S23 and S24 and Table S6).
The nature of the electronic transitions underlying the absorption features of 1 and 2 was also investigated theoretically, with the use of the density functional theory (DFT) and time-dependent DFT (TDDFT). The calculations confirmed that the charge-transfer transitions of ILCT and MLCT character contributed to the low-energy absorption of both complexes (Figure 3 and Table S7). The excitations with the largest oscillator strengths HOMO→LUMO and HOMO→LUMO+1 are ascribed to the electron transfer from the electron-rich amine group to the electron-accepting terpy unit (1ILCT), admixing with those of πterpy→π*terpy nature (1IL). The HOMO of 1 and 2 is localized on the amine group, phenyl linker, and central pyridine of the ligand, while LUMO and LUMO+1 show the largest contribution of the terpy framework with admixture of the phenyl linker (Figures S26 and S27). MLCT transitions, H-1→LUMO, H-2→LUMO, H-3→LUMO, and H-2→LUMO, are characterized by noticeably weaker oscillator strengths in agreement with poor overlapping of MOs involved in these electronic excitations—{Re(CO)3Cl} and π*terpy. Close inspection also reveals some differences between the simulations performed with the PCM model at polarities corresponding to CH3CN and CHCl3. For both complexes, the PCM model in less polar chloroform indicates stronger overlapping of ILCT and MLCT excitations and a slightly larger contribution of 1MLCT transitions in comparison to the PCM model in acetonitrile (Figure 3 and Figures S25–S27 and Tables S7–S9).
Room-temperature emission of 1 and 2 was studied in solvents of different polarities and solid-state (as a powder) upon excitation at the lowest energy absorption band. In addition, photoluminescence properties of 1 and 2 were investigated in an ethanol–methanol rigid-glass matrix at 77 K. Relevant photophysical parameters are summarized in Table 2 and Figure 4, Figure 5 and Figures S28–S33.
In solutions, both Re(I) complexes showed a broad and structureless emission band with maximum in the range of 640–665 nm. In general, the phosphorescence of 2 occurred at slightly shorter wavelengths in comparison to 1, while the triplet emission of the latter one fell in the range comparable to the model chromophore (3). Relative to the reference compound with N,N-dimethylamine group (4), the emission of the designed complexes in polar solvent appeared at higher energies, while in CHCl3, the opposite trend was observed (Figure S29).
By analogy to the complex with N,N-dimethylamine group (4), the emission lifetimes of 1 and 2 were strongly affected by solvent polarity, increasing noticeably upon changing the solvent from CHCl3 or THF to more polar CH3CN and DMF (Figure 6 and Table 2). Most remarkably, the incorporation of N-methyl-piperazinyl and (2-cyanoethyl)methylamine led to a significant enhancement of excited-state lifetimes of 1 and 2 relative to the parent chromophore (3) in solvents of high polarity. In DMF solution, the complex 2 showed 80-fold enhancement of the excited-state lifetime in comparison to 3 (Figure S30–32, Table S10).
With reference to previous results [55,66,72], it can be postulated that title complexes possess two closely lying excited states 3MLCT and 3ILCT/3IL, and the second one becomes dominant in polar environments.
The coexistence of 3MLCT and 3ILCT/3IL was further supported by photoluminescence studies of 1 and 2 in rigid environments (Figure 5). Upon cooling, the emission of 1 and 2 shifted toward higher energy and showed significantly elongated excited-state lifetimes relative to room temperature, which is consistent with the rigidochromic effect and implies the contribution of 3MLCT [1,2,5,18,76,77]. On the other hand, typical of the contribution of the ligand-centered emission, the frozen-state emission of 1 and 2 appeared in a noticeably lower energy region and showed weak vibronic structure and noticeably prolonged luminescence lifetime in relation to the emission of the model 3MLCT chromophore 3 at 77 K (Figures S31 and 32, Table S10). The average frozen-emission lifetimes of complexes 1 and 2 were two orders of magnitude longer than that for 3 at 77 K, consistent with a larger contribution from the ligand-centered state [2,5,18,76,78,79,80]. The mixed 3MLCT/3IL character of the excited state at low temperature for 1 and 2 is also supported by the comparison of their emission at 77 K with the phosphorescence spectra of the free ligands. As shown in Figure S33, the frozen-state emission of 1 and 2 overlapped the phosphorescence of the free ligand to some extent. In general, however, the emission of 1 and 2 at 77 K appeared at lower energy relative to phosphorescence measured for appropriate free ligand.
To obtain better insight into the nature of the triplet excited state of rhenium(I) complexes bearing N-methyl-piperazinyl and (2-cyanoethyl)methylamine, TDDFT calculations based on the optimized triplet excited-state geometries of complexes were performed. The calculations performed with the use of the PCM model in acetonitrile and chloroform provide satisfactory agreement with experimental triplet emission energies (Table S11). The isodensity surface plots of LSOMO and HSOMO and isosurfaces demonstrating the differences between α and β spin densities clearly indicate that the emitting states of 1 and 2 have predominant amine→terpy charge-transfer (ILCT) character (Figure 7 and Figure S34). However, TDDFT results also support some degree of MLCT character in the transition associated with populating the triplet state, and the contribution of 3MLCT increases noticeably in less polar chloroform.

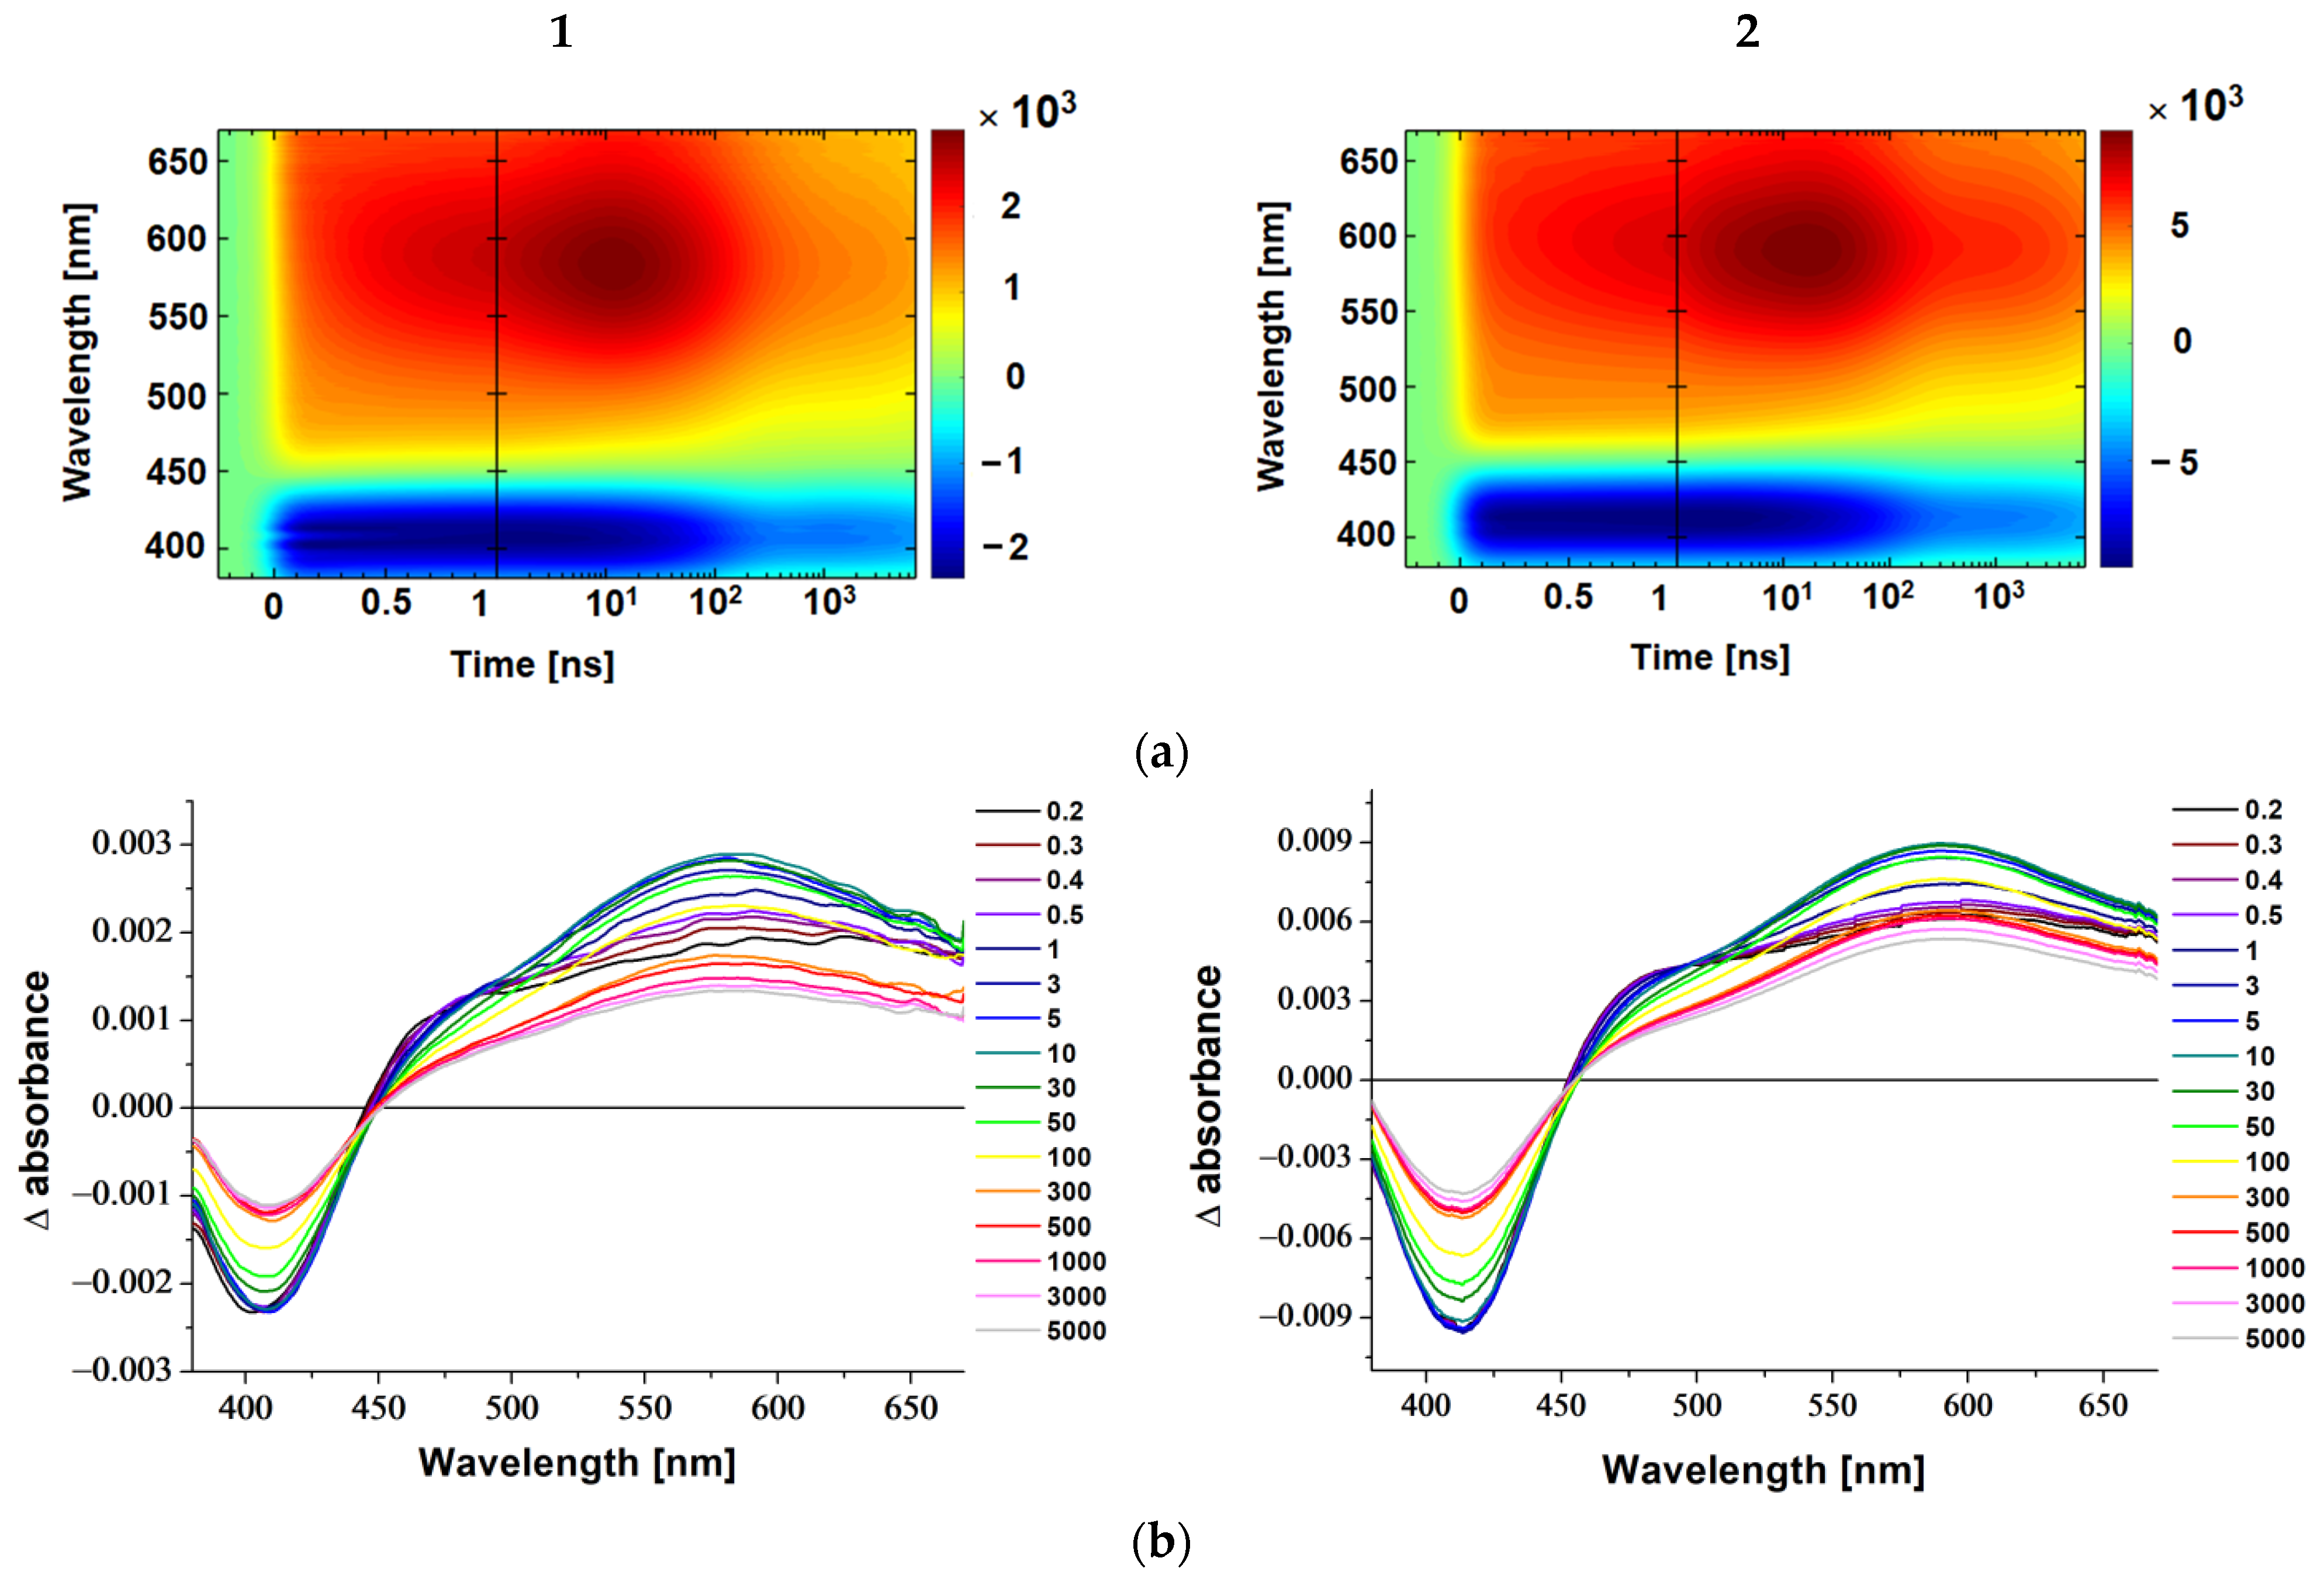
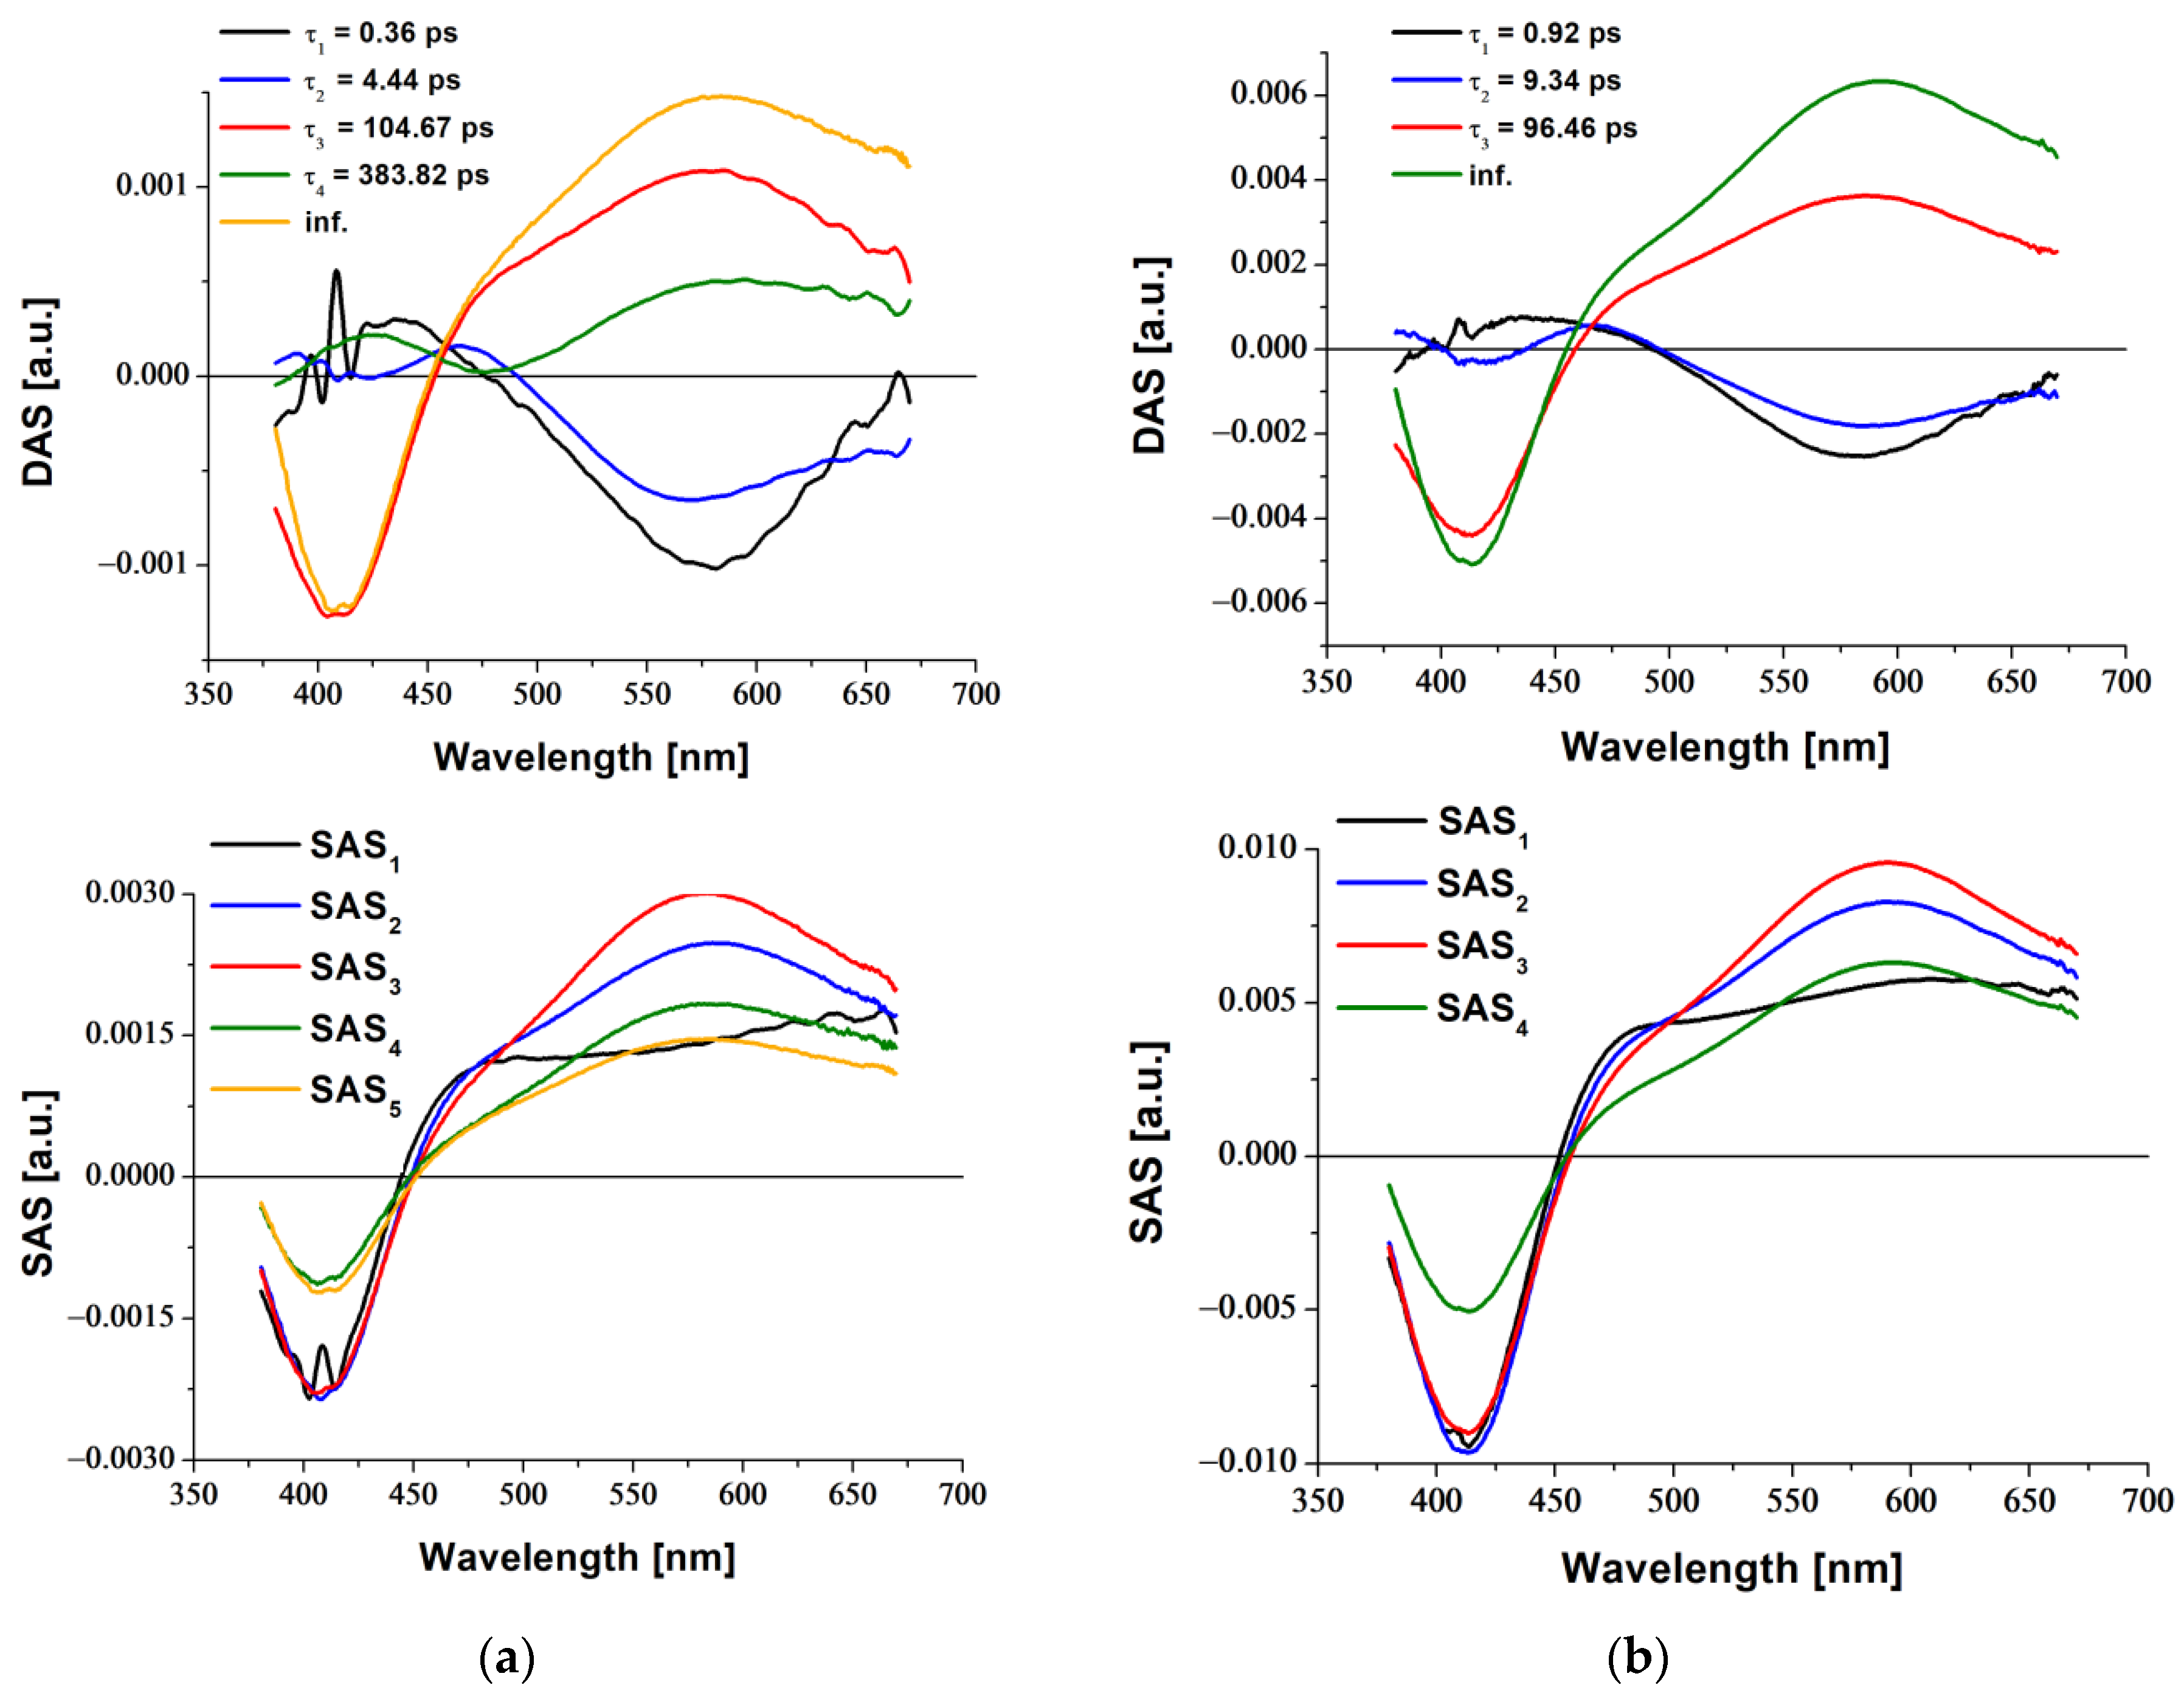
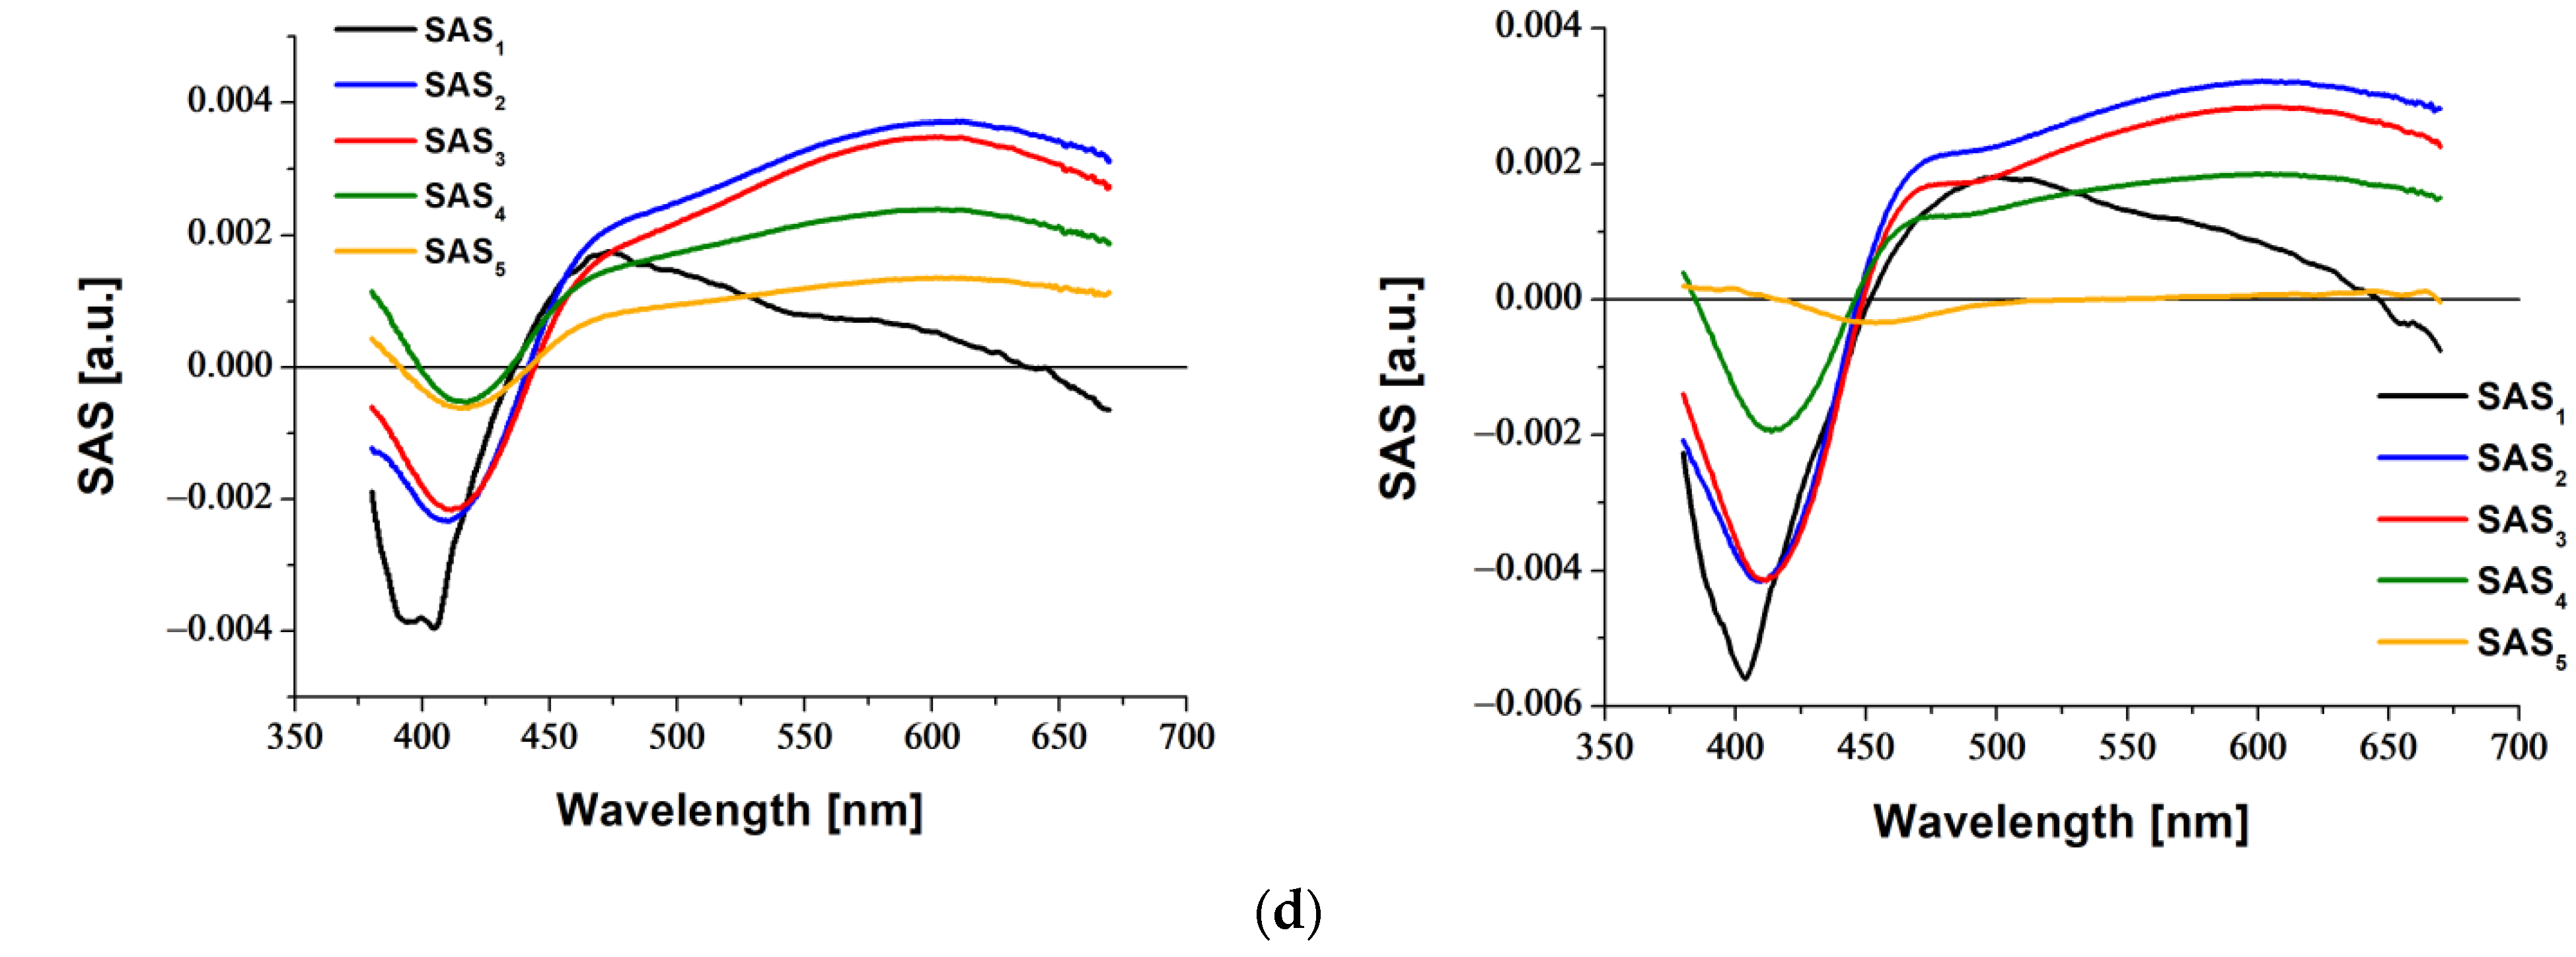
2.3. Transient Absorption Spectroscopy

To further understand the triplet excited-state characteristics of 1 and 2, the femtosecond transient absorption (fsTA) spectra at delay times up to 7 ns were recorded and analysed with the use of Surface Xplorer (Ultrafast Systems) and OptimusTM software (version 3.02) [81,82]. The studies were performed for 1 and 2 in CHCl3 and CH3CN upon excitation 355 nm, leading to population of both 1IL/1ILCT and 1MLCT states. The experimental conditions were optimized on the basis of the fluence dependence tests (Figure S35).
Laser pulse excitation of 1 and 2 in CH3CN led to the instant formation of a ground-state bleaching (GSB) ranging from 380 to 450 nm and an excited-state absorption (ESA) between 450 and 650 nm with a clear maximum at 584 nm for 1 and 589 for 2. Both negative and positive signals remained visible up to the end of the delay stage. The GSB reflected the shape of the ground-state absorption bands of 1 and 2 well (Figure 8 and Figure S36). Within 0.2–10 ps, the ESA band of both complexes increased and sharpened in the range 450–520 nm. At longer time delays (above 30 ps), TA spectra of 1 and 2 showed strong resemblance to those of the reference compound (4) with N,N-dimethylamine group (Figure S37), for which 3ILCT character of the lowest triplet state was confirmed by time-resolved IR spectroscopy [55]. In contrast, the parent complex 3 displayed only positive signals across the entire wavelength range (Figure S38). Therefore, we can safely postulate that the lowest triplet excited state of 1 and 2 is of predominant ILCT nature, and the well-defined isosbestic point at 489 nm for 1 and 498 nm for 2 represents interconversion between the 3MLCT and 3ILCT excited states.
The global fit analysis of the fsTA data of 1 and 2 in CH3CN allows us to assume that the long-lived state 3IL/3ILCT is populated via two paths represented by decay-associated spectra which are negative in the region corresponding to the relaxed lowest triplet state 3IL/3ILCT, that are DAS1 and DAS2 with time constants t1 = 0.36 ps and t1 = 4.44 ps for 1 and t1 = 0.92 ps and t1 = 9.34 ps for 2, respectively (Figure 9). Most likely, the formation of 3ILCT is associated with processes 1MLCT → 3MLCT → 3ILCT/3IL and 1ILCT/1IL → 1MLCT → 3MLCT→ 3ILCT/3IL. The interconversion 3MLCT → 3ILCT is represented by DAS3. The species associated spectrum SAS1 and SAS2 intersect with SAS3 (Figure 9). The formed hot 3ILCT excited state undergoes the vibrational relaxation, which comprises reorganization within the chromophores [ReCl(CO)3(N-methyl-piperazinyl-C6H4-terpy-κ2N)] (1) and [ReCl(CO)3((CH3)(CH2CH2CN)N-C6H4-terpy-κ2N)] (2) and between solute and solution molecules. The fully relaxed excited state recovers to the ground state, which is represented by DAS5 for 1 and DAS4 for 2, with the infinite lifetimes. An additional component in the decay associated spectra of 1 compared to 2 may indicate the presence of two conformational forms of 3ILCT excited states, differing in relative orientation of aliphatic cyclic amine (N-methyl-piperazinyl) towards terpy moiety. Additionally, complexes 1 and 2 differ in excited-state dynamics, supporting a crucial role of the remote amine group in controlling photophysical behavior of [ReCl(CO)3(R-C6H4-terpy-κ2N)]. Formation of 3ILCT was much slower in the case of complex 2. In turn, the population of 3ILCT was the fastest in the reference complex 4.
The fsTA 2D maps, TA spectra at selected time delays, decay associated spectra (DASi), and species associated spectra (SASi) of 1 and 2 compounds in CHCl3 are shown in Figure 10.
In chloroform, excitation of 1 and 2 at 355 nm results in an instant appearance of a ground-state bleaching (GSB) along with excited-state absorption (ESA). However, close inspection of spectral features indicates that the excited-state dynamics occur differently in less polar CHCl3. For both 1 and 2, there is no isosbestic point representing interconversion between the 3MLCT and 3ILCT excited states, the transient absorption spectra in the range 450–650 nm remain broad with two distinguishable peaks at around 472 and 601 nm for 1 and 475 and 602 nm for 2, and the spectral shapes of the corresponding DASi do not resemble those obtained in CH3CN. Furthermore, the global fit analysis of the fsTA data of 1 and 2 in CHCl3 confirms the presence of two long-lived components, with lifetimes ~2.1 ns and infinite for 1, and ~8.3 ns and infinite for 2. The emissive state of 1 and 2 in less polar environments seems to be dominated by the 3MLCT excited-state.
Remarkably, TA spectra, decay associated spectra (DASi), and species associated spectra (SASi) of the reference complex with N,N-dimethylamine group (4) in CHCl3 (Figure S37) have some similar features to those of 1 and 2 in CH3CN, indicating some energy transfer between the organic and inorganic components even in less polar chloroform. Therefore, the stronger electron-donating group is incorporated into terpy-based ligands of [ReCl(CO)3(R-C6H4-terpy-κ2N)], the more probable switching of 3MLCT into 3ILCT there is.

3. Materials and Methods

3.1. Materials and General Information

Re(CO)5Cl, starting materials and solvents (of reagent grade) for ligands synthesis, as well as solvents for spectroscopic studies (of HPLC grade) were commercially available and were used without further purification. The ligands N-methyl-piperazinyl-terpy and (2-cyanoethyl)methylamine-terpy were prepared according to literature methodology based on the condensation between 2-acetylpyridine and suitable benzaldehyde, 4-(4-methylpiperazin-1-yl)benzaldehyde for L1 and 4-[(2-cyanoethyl)methylamino]benzaldehyde for L2, in the presence of KOH and NH3 [64]. FT-IR, NMR, and HRMS spectra of free ligands L1 and L2 are provided in Supporting Information (ESI).
Elemental analysis was recorded on a Vario EL Cube apparatus. FT-IR spectra were collected on Nicolet iS5 FTIR spectrophotometer (4000–400 cm−1) in the form of KBr pellets. 1H and 1H-1H COSY NMR spectra were recorded on a Bruker Avance (400 MHz) spectrometer, while 13C, 1H-13C HMQC, and 1H-13C HMBC spectra were collected on a Bruker Avance (500 MHz) spectrometer. Chemical shifts were referenced with respect to solvent residual signal.

3.2. Preparation of [ReCl(CO)3(N-Methyl-piperazinyl-C6H4-terpy-κ2N)] (1) and [ReCl(CO)3((CH3)(CH2CH2CN)N-C6H4-Terpy-κ2N)] (2)

Rhenium(I) carbonyl complexes were prepared using Re(CO)5Cl (0.10 g, 0.27 mmol) and corresponding L1 and L2 ligand (0.27 mmol) in the substitution reaction of two carbonyl groups of [Re(CO)5Cl] by N-donor atoms of terpy-based ligands [27,66,67,68,72,73,83]. Argon-saturated acetonitrile solution of pentacarbonyl chlororhenium and corresponding ligand was refluxed for 8 h. The resulting solution was left for slow evaporation at room temperature. The formed precipitate was filtered off and washed with diethyl ether, dried in the air, and then purified by repeated recrystallization from acetonitrile. The product purity was confirmed by thin-layer chromatography analyses (SiO2, 5–10% MeOH in CH2Cl2).
1: Yield: 85%. IR (KBr, cm−1): 2017 (vs.), 1922 (vs.) and 1879 (vs.) ν(C≡O); 1599 (m), 1527 (m) ν (C=N) and ν (C=C). 1H NMR (400 MHz, DMSO-d6) δ 9.10 (d, J = 8.3 Hz, 1H), 9.05 (d, J = 5.4 Hz, 1H), 8.99 (s, 1H), 8.79 (d, J = 4.3 Hz, 1H), 8.38 (t, J = 7.9 Hz, 1H), 8.13 (d, J = 8.9 Hz, 2H), 8.08 (s, 1H), 8.04 (t, J = 8.1 Hz, 1H), 7.88 (d, J = 7.7 Hz, 1H), 7.77 (t, J = 6.6 Hz, 1H), 7.62 (dd, J = 7.7, 5.0 Hz, 1H), 7.11 (d, J = 8.6 Hz, 2H), 3.38–3.34 (m, 4H), 2.49–2.45 (m, 4H), 2.25 (s, 3H) ppm. 13C NMR (125 MHz, DMSO-d6) δ 197.89, 194.55, 191.17, 161.12, 158.09, 156.78, 156.52, 152.63, 152.55, 150.12, 149.18, 139.85, 136.86, 128.87, 127.27, 125.29, 125.10, 124.81, 123.12, 122.39, 118.83, 114.57, 54.15, 46.49, 45.40 ppm.
Anal. calc. found: C 47.31; H 3.56; N 9.80; molecular formula [ReCl(CO)3(C26H25N5)]·H2O requires C 47.63; H 3.72; N 9.58%. HRMS (ESI) (m/z): [M + H]+ calcd for [C29H25N5O3Re]+ 678.1515. Found 678.1518.
2: Yield: 75%. IR (KBr, cm−1): 2017 (vs.), 1915 (vs.) and 1880 (vs.) ν (C≡O); 1599(s) and 1532 (m) ν(C=N) and ν (C=C). 1H NMR (400 MHz, DMSO-d6) δ = 9.10 (d, J = 8.3 Hz, 1H), 9.04 (d, J = 5.5 Hz, 1H), 8.97 (s, 1H), 8.78 (d, J = 4.9 Hz, 1H), 8.37 (t, J = 7.9 Hz, 1H), 8.13 (d, J = 8.6 Hz, 2H), 8.07 (s, 1H), 8.04 (t, J = 7.5 Hz, 1H), 7.87 (d, J = 7.8 Hz, 1H), 7.76 (t, J = 6.6 Hz, 1H), 7.61 (dd, J = 7.6, 5.0 Hz, 1H), 6.95 (d, J = 8.6 Hz, 2H), 3.82 (t, J = 6.8 Hz, 2H), 3.08 (s, 3H), 2.79 (t, J = 6.6 Hz, 2H) ppm. 13C NMR (125 MHz, DMSO-d6) δ = 197.90, 194.56, 191.18, 161.05, 158.15, 156.69, 156.57, 152.61, 150.37, 150.27, 149.15, 139.83, 136.83, 129.05, 127.22, 125.24, 125.08, 124.76, 122.09, 121.46, 119.50, 118.59, 112.30, 47.23, 37.92, 15.08 ppm. Anal. calc. found: C 47.41; H 3.48; N 10.27; molecular formula [ReCl(CO)3(C28H21N5)]·0.5H2O requires C 47.62; H 3.14; N 9.92%. HRMS (ESI) (m/z): [M + H]+ calcd for [C28H21N5O3Re]+ 662.1202. Found 662.1204.

3.3. X-ray Crystallography

Single crystals of 1 were obtained from acetonitrile by slow evaporation of the solvent at room temperature. The X-ray diffraction was collected using Oxford Diffraction four-circle diffractometer Gemini A Ultra with Atlas CCD detector using graphite monochromated MoKα radiation (λ = 0.71073 Å) at room temperature. Data were processed with the aid of CrysAlisPro software [84], Olex2 software [85], SHELXS, and SHELXL-2014 package [86]. All the non-hydrogen atoms were refined anisotropically, and hydrogen atoms were placed in calculated positions and refined with riding constraints: d(C–H) = 0.93 Å, Uiso(H) = 1.2 Ueq(C) (for aromatic) and d(C–H) = 0.96 Å, Uiso(H) = 1.5 Ueq(C) (for methyl). Details of the crystallographic data collection, structural determination, and refinement for 1 are given in Table S1, whereas selected bond lengths and angles are listed in Table S2, ESI.
Crystallographic data for 1 were deposited with the Cambridge Crystallographic Data Center, CCDC 2205501. Copies of this information may be obtained free of charge from the Director, CCDC, 12 Union Road, Cambridge CB2 1EZ, UK (Fax: +44 1223 336033; e-mail: [email protected] or www.ccdc.cam.ac.uk (accessed on 6 September 2022)).

3.4. Absorption and Emission Spectra

The UV-Vis spectra were measured on ThermoScientific Evolution 220 (Waltham, MA, USA) (solution) and Jasco V570. Steady-state emission spectra of solid state (as powder) and solution samples were recorded on the FLS-980 fluorescence spectrophotometer, equipped with a 450 W Xe lamp and high-gain photomultiplier PMT + 500 nm (Hamamatsu, R928P) detector. The emission spectra at 77 K were registered in an ethanol:methanol (4:1 v/v) matrix frozen with liquid nitrogen. To determine the PL lifetimes, correlated single photon counting (TCSPC) and multi-channel scaling (MCS) methods were used. The TCSPC measurements were carried out at optically diluted solutions using the diodes (EPLED 375 nm, EPLED 405 nm) with picosecond pulse period as excitation light sources and PMT (Hamamatsu, R928P, Japan) as a detector. The IRF was measured using ludox solution. For samples with long-lived phosphorescence, PL lifetime measurements were performed with a multi-channel scaling (MCS) method in which excitation wavelength was obtained using 60 W microsecond Xe flash lamp. The quantum yields of luminescence were calculated by absolute method using the integrating sphere with solvent (for argon-saturated solution samples) or Spectralon® reflectance standard (for powdered samples) as blanks.

3.5. Femtosecond Transient Absorption

The femtosecond TA spectra were measured using a pump-probe transient absorption spectroscopy system (Ultrafast Systems, Helios, Sarasota, FL, USA) described in our previous works [64,87]. All experiments were carried out for the solution samples (2.5 × 10⁻⁴ M, in CHCl3 and CH3CN), stirred during the experiments to avoid photoproduct interference. The absorbance range was about 0.50 in the excitation wavelengths. The samples were pumped with 355 nm (for 1 and 2). Obtained TA data were analyzed using the Surface Xplorer (Ultrafast Systems) and Optimus software [82]. Corrections for the probe chirp and solvent signal contributions were performed routinely prior to the analysis. The used software allowed us to perform singular value deconvolution of the 3D surface into principal components (spectra and kinetics), global analysis and decay associated spectra, DAS, of the detected transients.

3.6. Theoretical Calculations

The theoretical calculations were performed using the GAUSSIAN-09 program package [88] at the DFT level with the PBE1PBE [89,90] hybrid exchange-correlation functional and the def2-TZVPD basis set for rhenium and def2-TZVP basis set for other elements [91] with polarizable continuum model (PCM) and acetonitrile as solvent [92,93]. Following the optimization of the geometry, vibrational frequencies were calculated to verify the minimum on the potential energy surface. Absorption properties were calculated by a TD-DFT method on the basis of the optimized ground state geometries. Emission properties were calculated by means of the TD-DFT method (after optimization of the first triplet excited-state).

4. Conclusions

We found that remote electron-rich amine groups N-methyl-piperazinyl (1) and (2-cyanoethyl)methylamine (2) effectively change optical properties of Re(I) complexes [ReCl(CO)3(R-C6H4-terpy-κ2N)]. As a result of the contribution of intraligand charge-transfer (ILCT) transitions, both new complexes show a red shift and significant increase in absorption intensity of the lowest energy band compared to 1MLCT of the parent compound [ReCl(CO)3(C6H5-terpy-κ2N)] (3). The photoluminescence properties of 1 and 2 strongly vary depending on the solvent polarity. In polar solvents, phosphorescence lifetimes of both complexes are significantly prolonged in relation to the model chromophore. On the basis of femtosecond transient absorption (fsTA) studies, we found that the 3MLCT excite state of 1 and 2 in polar environments undergoes a conversion into 3ILCT one. In contrast, the photoluminescence properties of 1 and 2 in less polar environments seem to be determined by 3MLCT excited-state. By comparing spectral features of designed complexes with the reference complex [ReCl(CO)3(R-C6H4-terpy-κ2N)] bearing N,N-dimethylamine group (4), it can be concluded that the stronger electron-donating group in 4 facilitates the population of the 3ILCT excited-state in both polar and less polar solvents. These findings can help us design new luminescent materials and understand the factors that control the excited-state nature in transition metal complexes.

Supplementary Materials

The following supporting information can be downloaded at: https://www.mdpi.com/article/10.3390/molecules27217147/s1, Table S1: Crystal data and structure refinement for 1; Table S2: Bond lengths and angles for 1; Table S3: Short intramolecular contacts detected in the structure of 1; Table S4: Short π⋯π interactions for 1; Table S5: C—O⋯Cg(J) (π-ring) interactions of 1. Figure S1: View of supramolecular packing of 1 arising from weak π⋯π type and C–O⋯π interactions and C–H⋯Cl short contacts; Figure S2: FT-IR spectrum of 1 along with FT-IR spectrum of the free ligand; Figure S3: FT-IR spectrum of 2 along with FT-IR spectrum of the free ligand; Figure S4: 1H NMR spectrum of L1; Figure S5: 13C NMR spectrum of L1; Figure S6: 1H NMR spectrum of L2.; Figure S7: 13C NMR spectrum of L2.; Figure S8: 1H NMR spectrum of 1.; Figure S9: 13C NMR spectrum of 1; Figure S10: 1H-1H COSY NMR spectrum of 1; Figure S11: 1H-13C HMQC NMR spectrum of 1; Figure S12: 1H-13C HMBC NMR spectrum of 1; Figure S13: 1H NMR spectrum of 2; Figure S14: 13C NMR spectrum of 2; Figure S15: 1H-1H COSY NMR spectrum of 2; Figure S16: 1H-13C HMQC NMR spectrum of 2; Figure S17: 1H-13C HMBC NMR spectrum of 2; Figure S18: HMRS spectrum of L1; Figure S19: HMRS spectrum of L2; Figure S20: HMRS spectrum of 1; Figure S21: HMRS spectrum of 2; Figure S22: UV-Vis spectra of 1 and 2 recorded once every two hours over 12 h at room temperature; Figure S23: UV−Vis spectra of 1 and 2 in comparison to those for free ligands; Figure S24: UV−Vis spectra of 1 and 2 in comparison to those for 3 and 4; Table S6: The absorption maxima and molar extinction coefficient for 1 and 2 with spectral data for 3 and 4; Table S7: The energies and characters of spin-allowed electronic transitions assigned to the lowest wavelength absorption bands of 1 and 2; Figure S25: Experimental absorption spectra of 2 alongside with vertical lines presenting singlet-singlet transitions with corresponding oscillator strengths; Figure S26: Percentage composition of molecular orbitals for 1 and 2 (in CHCl3); Figure S27: Percentage composition of molecular orbitals for 1 and 2 (in CH3CN); Table S8: Selected molecular orbitals of 1; Table S9: Selected molecular orbitals of 2; Figure S28: Normalized emission spectra of 1 and 2 in comparison to those for free ligands; Figure S29: Normalized luminescence spectra of 1–4; Table S10: Relevant photophysical parameters of 1 and 2 in comparison to those for 3 and 4; Figure S30: TCSPC decay curves for 3 and 4 in different solvents; Figure S31: Decay curves of 1 in deaerated CHCl3, THF, DMF, CH3CN at room temperature, in ethanol-methanol rigid-glass matrix (77 K) and solid state; Figure S32: Decay curves of 2 in deaerated CHCl3, THF, DMF, CH3CN at room temperature, in ethanol-methanol rigid-glass matrix (77 K) and solid state; Figure S33: Normalized emission spectra of the free ligands and their Re(I) complexes in ethanol-methanol rigid-glass matrix (77 K); Table S11: Calculated phosphorescence emission energies of 1 and 2, compared to the experimental values recorded in acetonitrile solution; Figure S34: Representative isodensity surface plots of the LSOMO and HSOMO for 2; Figure S35: The results of fluence dependence tests of 1 and 2; Figure S36: TA spectra at selected time delays and time traces at several wavelength for 1 and 2 in chloroform and acetonitrile; Figure S37: The fsTA 2D maps (a) and TA spectra at selected time delays; (b and f) decay associated spectra (DASi); (c) species associated spectra (SASi); (d) time traces at several wavelength; (e) for 4 in chloroform and acetonitrile; Figure S38: The fsTA 2D maps (a) and TA spectra at selected time delays (b and f)) decay associated spectra (DASi) (c), species associated spectra (SASi) (d) and time traces at several wavelength (e) for 3 in chloroform and acetonitrile.

Author Contributions

J.P.-G. carried out the structural, spectroscopy studies, TA measurements and DFT calculations, prepared the draft; A.S.-K. obtained ligands and complexes; M.P. performed and described the NMR spectroscopy spectra; K.E. performed and described the mass spectroscopy spectra; B.M. conceived the project, designed and discussed experiments, wrote and revised the manuscript. All authors have read and agreed to the published version of the manuscript.

Funding

The research was co-financed by National Science Centre of Poland grants no. DEC- 2017/25/B/ST5/01611 (BM) and funds granted under the Research Excellence Initiative of the University of Silesia in Katowice.

Institutional Review Board Statement

Not applicable.

Informed Consent Statement

Not applicable.

Data Availability Statement

Not applicable.

Acknowledgments

Calculations have been carried out in Wroclaw Centre for Networking and Supercomputing (http://www.wcss.pl accessed on 8 August 2022), grant No. 18.

Conflicts of Interest

The authors declare no conflict of interest.

Sample Availability

Samples of the compounds 1 and 2 are available from the authors.

References

  1. Wrighton, M.; Morse, D.L. Nature of the Lowest Excited State in Tricarbonylchloro-1,10-Phenanthrolinerhenium(I) and Related Complexes. J. Am. Chem. Soc. 1974, 96, 998–1003. [Google Scholar] [CrossRef]
  2. Stufkens, D.J.; Vlček, A. Ligand-Dependent Excited State Behaviour of Re(I) and Ru(II) Carbonyl–Diimine Complexes. Coord. Chem. Rev. 1998, 177, 127–179. [Google Scholar] [CrossRef]
  3. Striplin, D.R.; Crosby, G.A. Photophysical Investigations of Rhenium(I)Cl(CO)3(Phenanthroline) Complexes. Coord. Chem. Rev. 2001, 211, 163–175. [Google Scholar] [CrossRef]
  4. Coleman, A.; Brennan, C.; Vos, J.G.; Pryce, M.T. Photophysical Properties and Applications of Re(I) and Re(I)–Ru(II) Carbonyl Polypyridyl Complexes. Coord. Chem. Rev. 2008, 252, 2585–2595. [Google Scholar] [CrossRef]
  5. Kumar, A.; Sun, S.-S.; Lees, A.J. Photophysics and Photochemistry of Organometallic Rhenium Diimine Complexes. In Photophysics of Organometallics; Lees, A.J., Ed.; Topics in Organometallic Chemistry; Springer: Berlin/Heidelberg, Germany, 2010; pp. 37–71. ISBN 978-3-642-04729-9. [Google Scholar]
  6. Vlček, A. Ultrafast Excited-State Processes in Re(I) Carbonyl-Diimine Complexes: From Excitation to Photochemistry. In Photophysics of Organometallics; Lees, A.J., Ed.; Topics in Organometallic Chemistry; Springer: Berlin/Heidelberg, Germany, 2010; pp. 115–158. ISBN 978-3-642-04729-9. [Google Scholar]
  7. Takeda, H.; Koike, K.; Morimoto, T.; Inumaru, H.; Ishitani, O. Photochemistry and Photocatalysis of Rhenium(I) Diimine Complexes. In Advances in Inorganic Chemistry; van Eldik, R., Stochel, G., Eds.; Inorganic Photochemistry; Academic Press: Cambridge, MA, USA, 2011; Volume 63, pp. 137–186. [Google Scholar]
  8. Baková, R.; Chergui, M.; Daniel, C.; Vlček, A.; Záliš, S. Relativistic Effects in Spectroscopy and Photophysics of Heavy-Metal Complexes Illustrated by Spin–Orbit Calculations of [Re(Imidazole)(CO)3(Phen)]+. Coord. Chem. Rev. 2011, 255, 975–989. [Google Scholar] [CrossRef]
  9. Ko, C.-C.; Cheung, A.W.-Y.; Lo, L.T.-L.; Siu, J.W.-K.; Ng, C.-O.; Yiu, S.-M. Syntheses and Photophysical Studies of New Classes of Luminescent Isocyano Rhenium(I) Diimine Complexes. Coord. Chem. Rev. 2012, 256, 1546–1555. [Google Scholar] [CrossRef]
  10. Bertrand, H.C.; Clède, S.; Guillot, R.; Lambert, F.; Policar, C. Luminescence Modulations of Rhenium Tricarbonyl Complexes Induced by Structural Variations. Inorg. Chem. 2014, 53, 6204–6223. [Google Scholar] [CrossRef]
  11. Woźna, A.; Kapturkiewicz, A. The Luminescence Properties of the Heteroleptic [Re(CO)3(N∩N)Cl] and [Re(CO)3(N∩N)(CH3CN)]+ Complexes in View of the Combined Marcus–Jortner and Mulliken–Hush Formalism. Phys. Chem. Chem. Phys. 2015, 17, 30468–30480. [Google Scholar] [CrossRef] [PubMed]
  12. Lo, K.K.-W. Luminescent Rhenium(I) and Iridium(III) Polypyridine Complexes as Biological Probes, Imaging Reagents, and Photocytotoxic Agents. Acc. Chem. Res. 2015, 48, 2985–2995. [Google Scholar] [CrossRef]
  13. Li, X.; Zhao, G.-W.; Hu, Y.-X.; Zhao, J.-H.; Dong, Y.; Zhou, L.; Lv, Y.-L.; Chi, H.-J.; Su, Z. Rational Design and Characterization of Novel Phosphorescent Rhenium(I) Complexes for Extremely High-Efficiency Organic Light-Emitting Diodes. J. Mater. Chem. C 2017, 5, 7629–7636. [Google Scholar] [CrossRef]
  14. Hostachy, S.; Policar, C.; Delsuc, N. Re(I) Carbonyl Complexes: Multimodal Platforms for Inorganic Chemical Biology. Coord. Chem. Rev. 2017, 351, 172–188. [Google Scholar] [CrossRef] [Green Version]
  15. Yip, A.M.-H.; Lo, K.K.-W. Luminescent Rhenium(I), Ruthenium(II), and Iridium(III) Polypyridine Complexes Containing a Poly(Ethylene Glycol) Pendant or Bioorthogonal Reaction Group as Biological Probes and Photocytotoxic Agents. Coord. Chem. Rev. 2018, 361, 138–163. [Google Scholar] [CrossRef]
  16. Barnsley, J.E.; Shillito, G.E.; Larsen, C.B.; van der Salm, H.; Horvath, R.; Sun, X.Z.; Wu, X.; George, M.W.; Lucas, N.T.; Gordon, K.C. Generation of Microsecond Charge-Separated Excited States in Rhenium(I) Diimine Complexes: Driving Force Is the Dominant Factor in Controlling Lifetime. Inorg. Chem. 2019, 58, 9785–9795. [Google Scholar] [CrossRef] [PubMed]
  17. Maroń, A.M.; Szlapa-Kula, A.; Matussek, M.; Kruszynski, R.; Siwy, M.; Janeczek, H.; Grzelak, J.; Maćkowski, S.; Schab-Balcerzak, E.; Machura, B. Photoluminescence Enhancement of Re(I) Carbonyl Complexes Bearing D–A and D–π–A Ligands. Dalton Trans. 2020, 49, 4441–4453. [Google Scholar] [CrossRef]
  18. Shillito, G.E.; Preston, D.; Traber, P.; Steinmetzer, J.; McAdam, C.J.; Crowley, J.D.; Wagner, P.; Kupfer, S.; Gordon, K.C. Excited-State Switching Frustrates the Tuning of Properties in Triphenylamine-Donor-Ligand Rhenium(I) and Platinum(II) Complexes. Inorg. Chem. 2020, 59, 6736–6746. [Google Scholar] [CrossRef]
  19. Nishiyama, Y.; Xu, S.; Hanatani, Y.; Tsuda, S.; Umeda, R. Rhenium Complex-Catalyzed Deoxygenation and Silylation of Alcohols with Hydrosilane. Tetrahedron Lett. 2022, 99, 153839. [Google Scholar] [CrossRef]
  20. Valdés, E.; Cepeda-Plaza, M.; Günther, G.; Vega, A.; Palacios, R.; Gómez, M.L.; Pizarro, N. An Amine Linker Group Modulates Luminescent Properties in a Rhenium(I) Tricarbonyl Complex. How Can It Be Applied for Ratiometric Oxygen Sensing? Dye. Pigment. 2020, 172, 107787. [Google Scholar] [CrossRef]
  21. Portenkirchner, E.; Oppelt, K.; Egbe, D.A.M.; Knör, G.; Sariçiftçi, N.S. Electro- and Photo-Chemistry of Rhenium and Rhodium Complexes for Carbon Dioxide and Proton Reduction: A Mini Review. Nanomater. Energy 2013, 2, 134–147. [Google Scholar] [CrossRef] [Green Version]
  22. Nichols, A.W.; Machan, C.W. Secondary-Sphere Effects in Molecular Electrocatalytic CO2 Reduction. Front. Chem. 2019, 7, 397. [Google Scholar] [CrossRef] [Green Version]
  23. Talukdar, K.; Sinha Roy, S.; Amatya, E.; Sleeper, E.A.; Le Magueres, P.; Jurss, J.W. Enhanced Electrochemical CO2 Reduction by a Series of Molecular Rhenium Catalysts Decorated with Second-Sphere Hydrogen-Bond Donors. Inorg. Chem. 2020, 59, 6087–6099. [Google Scholar] [CrossRef]
  24. Li, F.; Zhang, M.; Feng, J.; Cheng, G.; Wu, Z.; Ma, Y.; Liu, S.; Sheng, J.; Lee, S.T. Red Electrophosphorescence Devices Based on Rhenium Complexes. Appl. Phys. Lett. 2003, 83, 365–367. [Google Scholar] [CrossRef]
  25. Lundin, N.J.; Blackman, A.G.; Gordon, K.C.; Officer, D.L. Synthesis and Characterization of a Multicomponent Rhenium(I) Complex for Application as an OLED Dopant. Angew. Chem. Int. Ed. 2006, 45, 2582–2584. [Google Scholar] [CrossRef] [PubMed]
  26. Li, X.; Zhang, D.; Li, W.; Chu, B.; Han, L.; Zhu, J.; Su, Z.; Bi, D.; Wang, D.; Yang, D.; et al. Very High-Efficiency Organic Light-Emitting Diodes Based on Cyclometallated Rhenium (I) Complex. Appl. Phys. Lett. 2008, 92, 083302. [Google Scholar] [CrossRef] [Green Version]
  27. Klemens, T.; Świtlicka-Olszewska, A.; Machura, B.; Grucela, M.; Janeczek, H.; Schab-Balcerzak, E.; Szlapa, A.; Kula, S.; Krompiec, S.; Smolarek, K.; et al. Synthesis, Photophysical Properties and Application in Organic Light Emitting Devices of Rhenium(I) Carbonyls Incorporating Functionalized 2,2′:6′,2′′-Terpyridines. RSC Adv. 2016, 6, 56335–56352. [Google Scholar] [CrossRef]
  28. Klemens, T.; Świtlicka-Olszewska, A.; Machura, B.; Grucela, M.; Schab-Balcerzak, E.; Smolarek, K.; Mackowski, S.; Szlapa, A.; Kula, S.; Krompiec, S.; et al. Rhenium(I) Terpyridine Complexes–Synthesis, Photophysical Properties and Application in Organic Light Emitting Devices. Dalton Trans. 2016, 45, 1746–1762. [Google Scholar] [CrossRef]
  29. Zhao, G.-W.; Zhao, J.-H.; Hu, Y.-X.; Zhang, D.-Y.; Li, X. Recent Advances of Neutral Rhenium(I) Tricarbonyl Complexes for Application in Organic Light-Emitting Diodes. Synth. Met. 2016, 212, 131–141. [Google Scholar] [CrossRef]
  30. Polo, A.S.; Itokazu, M.K.; Murakami Iha, N.Y. Metal Complex Sensitizers in Dye-Sensitized Solar Cells. Coord. Chem. Rev. 2004, 248, 1343–1361. [Google Scholar] [CrossRef]
  31. Si, Z.; Li, J.; Li, B.; Zhao, F.; Liu, S.; Li, W. Synthesis, Structural Characterization, and Electrophosphorescent Properties of Rhenium(I) Complexes Containing Carrier-Transporting Groups. Inorg. Chem. 2007, 46, 6155–6163. [Google Scholar] [CrossRef]
  32. Zhang, T.-T.; Jia, J.; Wu, H.-S. Theoretical Studies of COOH Group Effect on the Performance of Rhenium (I) Tricarbonyl Complexes with Bispyridine Sulfur-Rich Core Ligand as Dyes in DSSC. Chem. Acc. 2012, 131, 1266. [Google Scholar] [CrossRef]
  33. Komreddy, V.; Ensz, K.; Nguyen, H.; Paul Rillema, D. Synthesis and Characterization of Rhenium(I) 4,4′-Dicarboxy-2,2′-Bipyridine Tricarbonyl Complexes for Solar Energy Conversion. Inorg. Chim. Acta 2020, 511, 119815. [Google Scholar] [CrossRef]
  34. Bauer, E.B.; Haase, A.A.; Reich, R.M.; Crans, D.C.; Kühn, F.E. Organometallic and Coordination Rhenium Compounds and Their Potential in Cancer Therapy. Coord. Chem. Rev. 2019, 393, 79–117. [Google Scholar] [CrossRef]
  35. Konkankit, C.C.; Marker, S.C.; Knopf, K.M.; Wilson, J.J. Anticancer Activity of Complexes of the Third Row Transition Metals, Rhenium, Osmium, and Iridium. Dalton Trans. 2018, 47, 9934–9974. [Google Scholar] [CrossRef] [PubMed]
  36. Delasoie, J.; Pavic, A.; Voutier, N.; Vojnovic, S.; Crochet, A.; Nikodinovic-Runic, J.; Zobi, F. Identification of Novel Potent and Non-Toxic Anticancer, Anti-Angiogenic and Antimetastatic Rhenium Complexes against Colorectal Carcinoma. Eur. J. Med. Chem. 2020, 204, 112583. [Google Scholar] [CrossRef]
  37. Wang, F.-X.; Liang, J.-H.; Zhang, H.; Wang, Z.-H.; Wan, Q.; Tan, C.-P.; Ji, L.-N.; Mao, Z.-W. Mitochondria-Accumulating Rhenium(I) Tricarbonyl Complexes Induce Cell Death via Irreversible Oxidative Stress and Glutathione Metabolism Disturbance. ACS Appl. Mater. Interfaces 2019, 11, 13123–13133. [Google Scholar] [CrossRef] [PubMed]
  38. Pan, Z.-Y.; Tan, C.-P.; Rao, L.-S.; Zhang, H.; Zheng, Y.; Hao, L.; Ji, L.-N.; Mao, Z.-W. Recoding the Cancer Epigenome by Intervening in Metabolism and Iron Homeostasis with Mitochondria-Targeted Rhenium(I) Complexes. Angew. Chem. Int. Ed. 2020, 59, 18755–18762. [Google Scholar] [CrossRef]
  39. Konkankit, C.C.; Vaughn, B.A.; Huang, Z.; Boros, E.; Wilson, J.J. Systematically Altering the Lipophilicity of Rhenium(I) Tricarbonyl Anticancer Agents to Tune the Rate at Which They Induce Cell Death. Dalton Trans. 2020, 49, 16062–16066. [Google Scholar] [CrossRef]
  40. He, S.-F.; Pan, N.-L.; Chen, B.-B.; Liao, J.-X.; Huang, M.; Qiu, H.-J.; Jiang, D.-C.; Wang, J.-J.; Chen, J.-X.; Sun, J. Mitochondria-Targeted Re(I) Complexes Bearing Guanidinium as Ligands and Their Anticancer Activity. J. Biol. Inorg. Chem. 2020, 25, 1107–1116. [Google Scholar] [CrossRef]
  41. Marker, S.C.; King, A.P.; Swanda, R.V.; Vaughn, B.; Boros, E.; Qian, S.-B.; Wilson, J.J. Exploring Ovarian Cancer Cell Resistance to Rhenium Anticancer Complexes. Angew. Chem. Int. Ed. 2020, 59, 13391–13400. [Google Scholar] [CrossRef]
  42. Liu, C.; Zhou, L.; Wei, F.; Li, L.; Zhao, S.; Gong, P.; Cai, L.; Wong, K.M.-C. Versatile Strategy To Generate a Rhodamine Triplet State as Mitochondria-Targeting Visible-Light Photosensitizers for Efficient Photodynamic Therapy. ACS Appl. Mater. Interfaces 2019, 11, 8797–8806. [Google Scholar] [CrossRef]
  43. Liew, H.S.; Mai, C.-W.; Zulkefeli, M.; Madheswaran, T.; Kiew, L.V.; Delsuc, N.; Low, M.L. Recent Emergence of Rhenium(I) Tricarbonyl Complexes as Photosensitisers for Cancer Therapy. Molecules 2020, 25, 4176. [Google Scholar] [CrossRef]
  44. Karges, J.; Kalaj, M.; Gembicky, M.; Cohen, S.M. ReI Tricarbonyl Complexes as Coordinate Covalent Inhibitors for the SARS-CoV-2 Main Cysteine Protease. Angew. Chem. Int. Ed. 2021, 60, 10716–10723. [Google Scholar] [CrossRef] [PubMed]
  45. Vlček, A.; Busby, M. Ultrafast Ligand-to-Ligand Electron and Energy Transfer in the Complexes Fac-[ReI(L)(CO)3(Bpy)]N+. Coord. Chem. Rev. 2006, 250, 1755–1762. [Google Scholar] [CrossRef]
  46. Vlček, A.; Záliš, S. Modeling of Charge-Transfer Transitions and Excited States in D6 Transition Metal Complexes by DFT Techniques. Coord. Chem. Rev. 2007, 251, 258–287. [Google Scholar] [CrossRef]
  47. Yue, Y.; Grusenmeyer, T.; Ma, Z.; Zhang, P.; Pham, T.T.; Mague, J.T.; Donahue, J.P.; Schmehl, R.H.; Beratan, D.N.; Rubtsov, I.V. Evaluating the Extent of Intramolecular Charge Transfer in the Excited States of Rhenium(I) Donor–Acceptor Complexes with Time-Resolved Vibrational Spectroscopy. J. Phys. Chem. B 2013, 117, 15903–15916. [Google Scholar] [CrossRef] [PubMed]
  48. Chu, W.-K.; Wei, X.-G.; Yiu, S.-M.; Ko, C.-C.; Lau, K.-C. Strongly Phosphorescent Neutral Rhenium(I) Isocyanoborato Complexes: Synthesis, Characterization, and Photophysical, Electrochemical, and Computational Studies. Chem. Eur. J. 2015, 21, 2603–2612. [Google Scholar] [CrossRef] [PubMed]
  49. Favale, J.M.; Danilov, E.O.; Yarnell, J.E.; Castellano, F.N. Photophysical Processes in Rhenium(I) Diiminetricarbonyl Arylisocyanides Featuring Three Interacting Triplet Excited States. Inorg. Chem. 2019, 58, 8750–8762. [Google Scholar] [CrossRef]
  50. Yarnell, J.E.; Deaton, J.C.; McCusker, C.E.; Castellano, F.N. Bidirectional “Ping-Pong” Energy Transfer and 3000-Fold Lifetime Enhancement in a Re(I) Charge Transfer Complex. Inorg. Chem. 2011, 50, 7820–7830. [Google Scholar] [CrossRef]
  51. Kisel, K.S.; Eskelinen, T.; Zafar, W.; Solomatina, A.I.; Hirva, P.; Grachova, E.V.; Tunik, S.P.; Koshevoy, I.O. Chromophore-Functionalized Phenanthro-Diimine Ligands and Their Re(I) Complexes. Inorg. Chem. 2018, 57, 6349–6361. [Google Scholar] [CrossRef]
  52. Szlapa-Kula, A.; Małecka, M.; Maroń, A.M.; Janeczek, H.; Siwy, M.; Schab-Balcerzak, E.; Szalkowski, M.; Maćkowski, S.; Pedzinski, T.; Erfurt, K.; et al. In-Depth Studies of Ground- and Excited-State Properties of Re(I) Carbonyl Complexes Bearing 2,2′:6′,2″-Terpyridine and 2,6-Bis(Pyrazin-2-Yl)Pyridine Coupled with π-Conjugated Aryl Chromophores. Inorg. Chem. 2021, 60, 18726–18738. [Google Scholar] [CrossRef]
  53. Shillito, G.E.; Hall, T.B.J.; Preston, D.; Traber, P.; Wu, L.; Reynolds, K.E.A.; Horvath, R.; Sun, X.Z.; Lucas, N.T.; Crowley, J.D.; et al. Dramatic Alteration of 3ILCT Lifetimes Using Ancillary Ligands in [Re(L)(CO)3(Phen-TPA)]N+ Complexes: An Integrated Spectroscopic and Theoretical Study. J. Am. Chem. Soc. 2018, 140, 4534–4542. [Google Scholar] [CrossRef]
  54. Yarnell, J.E.; Wells, K.A.; Palmer, J.R.; Breaux, J.M.; Castellano, F.N. Excited-State Triplet Equilibria in a Series of Re(I)-Naphthalimide Bichromophores. J. Phys. Chem. B 2019, 123, 7611–7627. [Google Scholar] [CrossRef] [PubMed]
  55. Fernández-Terán, R.; Sévery, L. Living Long and Prosperous: Productive Intraligand Charge-Transfer States from a Rhenium(I) Terpyridine Photosensitizer with Enhanced Light Absorption. Inorg. Chem. 2021, 60, 1334–1343. [Google Scholar] [CrossRef] [PubMed]
  56. Liu, X.; Xia, H.; Gao, W.; Wu, Q.; Fan, X.; Mu, Y.; Ma, C. New Rhenium(I) Complexes with Substituted Diimine Ligands for Highly Efficient Phosphorescent Devices Fabricated by a Solution Process. J. Mater. Chem. 2012, 22, 3485–3492. [Google Scholar] [CrossRef]
  57. Yu, T.; Tsang, D.P.-K.; Au, V.K.-M.; Lam, W.H.; Chan, M.-Y.; Yam, V.W.-W. Deep Red to Near-Infrared Emitting Rhenium(I) Complexes: Synthesis, Characterization, Electrochemistry, Photophysics, and Electroluminescence Studies. Chem. Eur. J. 2013, 19, 13418–13427. [Google Scholar] [CrossRef]
  58. Cargill Thompson, A.M.W. The Synthesis of 2,2′:6′,2″-Terpyridine Ligands—Versatile Building Blocks for Supramolecular Chemistry. Coord. Chem. Rev. 1997, 160, 1–52. [Google Scholar] [CrossRef]
  59. Hofmeier, H.; Schubert, U.S. Recent Developments in the Supramolecular Chemistry of Terpyridine–Metal Complexes. Chem. Soc. Rev. 2004, 33, 373–399. [Google Scholar] [CrossRef]
  60. Wild, A.; Winter, A.; Schlütter, F.; Schubert, U.S. Advances in the Field of π-Conjugated 2,2′:6′,2″-Terpyridines. Chem. Soc. Rev. 2011, 40, 1459–1511. [Google Scholar] [CrossRef]
  61. Winter, A.; Hager, M.D.; Newkome, G.R.; Schubert, U.S. The Marriage of Terpyridines and Inorganic Nanoparticles: Synthetic Aspects, Characterization Techniques, and Potential Applications. Adv. Mater. 2011, 23, 5728–5748. [Google Scholar] [CrossRef]
  62. Czerwińska, K.; Golec, M.; Skonieczna, M.; Palion-Gazda, J.; Zygadło, D.; Szlapa-Kula, A.; Krompiec, S.; Machura, B.; Szurko, A. Cytotoxic Gold( Iii ) Complexes Incorporating a 2,2′:6′,2′′-Terpyridine Ligand Framework–the Impact of the Substituent in the 4′-Position of a Terpy Ring. Dalton Trans. 2017, 46, 3381–3392. [Google Scholar] [CrossRef]
  63. Toledo, D.; Brovelli, F.; Soto-Delgado, J.; Peña, O.; Pivan, J.-Y.; Moreno, Y. Influence of Structural Changes on Photophysical Properties of Terpyridine Derivates: Experimental Studies and Theoretical Calculations. J. Mol. Struct. 2018, 1153, 282–291. [Google Scholar] [CrossRef]
  64. Palion-Gazda, J.; Machura, B.; Klemens, T.; Szlapa-Kula, A.; Krompiec, S.; Siwy, M.; Janeczek, H.; Schab-Balcerzak, E.; Grzelak, J.; Maćkowski, S. Structure-Dependent and Environment-Responsive Optical Properties of the Trisheterocyclic Systems with Electron Donating Amino Groups. Dye. Pigment. 2019, 166, 283–300. [Google Scholar] [CrossRef]
  65. Malarz, K.; Zych, D.; Kuczak, M.; Musioł, R.; Mrozek-Wilczkiewicz, A. Anticancer Activity of 4′-Phenyl-2,2′:6′,2″-Terpyridines–behind the Metal Complexation. Eur. J. Med. Chem. 2020, 189, 112039. [Google Scholar] [CrossRef] [PubMed]
  66. Klemens, T.; Świtlicka, A.; Szlapa-Kula, A.; Łapok, Ł.; Obłoza, M.; Siwy, M.; Szalkowski, M.; Maćkowski, S.; Libera, M.; Schab-Balcerzak, E.; et al. Tuning Optical Properties of Re(I) Carbonyl Complexes by Modifying Push–Pull Ligands Structure. Organometallics 2019, 38, 4206–4223. [Google Scholar] [CrossRef]
  67. Choroba, K.; Maroń, A.; Świtlicka, A.; Szłapa-Kula, A.; Siwy, M.; Grzelak, J.; Maćkowski, S.; Pedzinski, T.; Schab-Balcerzak, E.; Machura, B. Carbazole Effect on Ground- and Excited-State Properties of Rhenium(I) Carbonyl Complexes with Extended Terpy-like Ligands. Dalton Trans. 2021, 50, 3943–3958. [Google Scholar] [CrossRef] [PubMed]
  68. Klemens, T.; Świtlicka, A.; Machura, B.; Kula, S.; Krompiec, S.; Łaba, K.; Korzec, M.; Siwy, M.; Janeczek, H.; Schab-Balcerzak, E.; et al. A Family of Solution Processable Ligands and Their Re(I) Complexes towards Light Emitting Applications. Dye. Pigment. 2019, 163, 86–101. [Google Scholar] [CrossRef]
  69. Laramée-Milette, B.; Zaccheroni, N.; Palomba, F.; Hanan, G.S. Visible and Near-IR Emissions from K2N- and K3N-Terpyridine Rhenium(I) Assemblies Obtained by an [N×1] Head-to-Tail Bonding Strategy. Chem. Eur. J. 2017, 23, 6370–6379. [Google Scholar] [CrossRef]
  70. Amoroso, A.J.; Banu, A.; Coogan, M.P.; Edwards, P.G.; Hossain, G.; Malik, K.M.A. Functionalisation of Terpyridine Complexes Containing the Re(CO)3+ Moiety. Dalton Trans. 2010, 39, 6993–7003. [Google Scholar] [CrossRef]
  71. Wang, D.; Xu, Q.-L.; Zhang, S.; Li, H.-Y.; Wang, C.-C.; Li, T.-Y.; Jing, Y.-M.; Huang, W.; Zheng, Y.-X.; Accorsi, G. Synthesis and Photoluminescence Properties of Rhenium(I) Complexes Based on 2,2′:6′,2′′-Terpyridine Derivatives with Hole-Transporting Units. Dalton Trans. 2013, 42, 2716–2723. [Google Scholar] [CrossRef]
  72. Klemens, T.; Świtlicka, A.; Szlapa-Kula, A.; Krompiec, S.; Lodowski, P.; Chrobok, A.; Godlewska, M.; Kotowicz, S.; Siwy, M.; Bednarczyk, K.; et al. Experimental and Computational Exploration of Photophysical and Electroluminescent Properties of Modified 2,2′:6′,2″-Terpyridine, 2,6-Di(Thiazol-2-Yl)Pyridine and 2,6-Di(Pyrazin-2-Yl)Pyridine Ligands and Their Re(I) Complexes. Appl. Organomet. Chem. 2018, 32, e4611. [Google Scholar] [CrossRef]
  73. Małecka, M.; Machura, B.; Świtlicka, A.; Kotowicz, S.; Szafraniec-Gorol, G.; Siwy, M.; Szalkowski, M.; Maćkowski, S.; Schab-Balcerzak, E. Towards Better Understanding of Photophysical Properties of Rhenium(I) Tricarbonyl Complexes with Terpy-like Ligands. Spectrochim. Acta Part A Mol. Biomol. Spectrosc. 2020, 231, 118124. [Google Scholar] [CrossRef]
  74. Sutton, J.J.; Preston, D.; Traber, P.; Steinmetzer, J.; Wu, X.; Kayal, S.; Sun, X.-Z.; Crowley, J.D.; George, M.W.; Kupfer, S.; et al. Excited-State Switching in Rhenium(I) Bipyridyl Complexes with Donor–Donor and Donor–Acceptor Substituents. J. Am. Chem. Soc. 2021, 143, 9082–9093. [Google Scholar] [CrossRef] [PubMed]
  75. Lam, S.-T.; Zhu, N.; Yam, V.W.-W. Synthesis and Characterization of Luminescent Rhenium(I) Tricarbonyl Diimine Complexes with a Triarylboron Moiety and the Study of Their Fluoride Ion-Binding Properties. Inorg. Chem. 2009, 48, 9664–9670. [Google Scholar] [CrossRef] [PubMed]
  76. Baba, A.I.; Shaw, J.R.; Simon, J.A.; Thummel, R.P.; Schmehl, R.H. The Photophysical Behavior of D6 Complexes Having Nearly Isoenergetic MLCT and Ligand Localized Excited States. Coord. Chem. Rev. 1998, 171, 43–59. [Google Scholar] [CrossRef]
  77. Liu, B.; Monro, S.; Li, Z.; Jabed, M.A.; Ramirez, D.; Cameron, C.G.; Colón, K.; Roque, J.; Kilina, S.; Tian, J.; et al. New Class of Homoleptic and Heteroleptic Bis(Terpyridine) Iridium(III) Complexes with Strong Photodynamic Therapy Effects. ACS Appl. Bio Mater. 2019, 2, 2964–2977. [Google Scholar] [CrossRef]
  78. Zhang, X.; Hou, Y.; Xiao, X.; Chen, X.; Hu, M.; Geng, X.; Wang, Z.; Zhao, J. Recent Development of the Transition Metal Complexes Showing Strong Absorption of Visible Light and Long-Lived Triplet Excited State: From Molecular Structure Design to Photophysical Properties and Applications. Coord. Chem. Rev. 2020, 417, 213371. [Google Scholar] [CrossRef]
  79. Wells, K.A.; Yarnell, J.E.; Sheykhi, S.; Palmer, J.R.; Yonemoto, D.T.; Joyce, R.; Garakyaraghi, S.; Castellano, F.N. Accessing the Triplet Manifold of Naphthalene Benzimidazole–Phenanthroline in Rhenium(I) Bichromophores. Dalton Trans. 2021, 50, 13086–13095. [Google Scholar] [CrossRef]
  80. Gu, J.; Yan, Y.; Helbig, B.J.; Huang, Z.; Lian, T.; Schmehl, R.H. The Influence of Ligand Localized Excited States on the Photophysics of Second Row and Third Row Transition Metal Terpyridyl Complexes: Recent Examples and a Case Study. Coord. Chem. Rev. 2015, 282, 100–109. [Google Scholar] [CrossRef] [Green Version]
  81. van Wilderen, L.J.; Lincoln, C.N.; van Thor, J.J. Modelling Multi-Pulse Population Dynamics from Ultrafast Spectroscopy. PLoS ONE 2011, 6, e17373. [Google Scholar] [CrossRef] [Green Version]
  82. Slavov, C.; Hartmann, H.; Wachtveitl, J. Implementation and Evaluation of Data Analysis Strategies for Time-Resolved Optical Spectroscopy. Anal. Chem. 2015, 87, 2328–2336. [Google Scholar] [CrossRef]
  83. Choroba, K.; Kotowicz, S.; Maroń, A.; Świtlicka, A.; Szłapa-Kula, A.; Siwy, M.; Grzelak, J.; Sulowska, K.; Maćkowski, S.; Schab-Balcerzak, E.; et al. Ground- and Excited-State Properties of Re(I) Carbonyl Complexes–Effect of Triimine Ligand Core and Appended Heteroaromatic Groups. Dye. Pigment. 2021, 192, 109472. [Google Scholar] [CrossRef]
  84. CrysAlis PRO. 2011.
  85. Dolomanov, O.V.; Bourhis, L.J.; Gildea, R.J.; Howard, J.a.K.; Puschmann, H. OLEX2: A Complete Structure Solution, Refinement and Analysis Program. J. Appl. Cryst. 2009, 42, 339–341. [Google Scholar] [CrossRef]
  86. Sheldrick, G.M. Crystal Structure Refinement with SHELXL. Acta Crystallogr. Sect. C Struct. Chem. 2015, 71, 3–8. [Google Scholar] [CrossRef] [PubMed] [Green Version]
  87. Choroba, K.; Kula, S.; Maroń, A.; Machura, B.; Małecki, J.; Szłapa-Kula, A.; Siwy, M.; Grzelak, J.; Maćkowski, S.; Schab-Balcerzak, E. Aryl Substituted 2,6-Di(Thiazol-2-Yl)Pyridines –Excited-State Characterization and Potential for OLEDs. Dye. Pigment. 2019, 169, 89–104. [Google Scholar] [CrossRef]
  88. Frisch, M.J.; Trucks, G.W.; Schlegel, H.B.; Scuseria, G.E.; Robb, M.A.; Cheeseman, J.R.; Scalmani, G.; Barone, V.; Petersson, G.A.; Nakatsuji, H.; et al. Gaussian 16, Revision C.01; Gaussian, Inc.: Wallingford, CT, USA, 2016. [Google Scholar]
  89. Adamo, C.; Barone, V. Toward Reliable Density Functional Methods without Adjustable Parameters: The PBE0 Model. J. Chem. Phys. 1999, 110, 6158–6170. [Google Scholar] [CrossRef]
  90. Perdew, J.P.; Burke, K.; Ernzerhof, M. Generalized Gradient Approximation Made Simple. Phys. Rev. Lett. 1996, 77, 3865–3868. [Google Scholar] [CrossRef] [Green Version]
  91. Andrae, D.; Häußermann, U.; Dolg, M.; Stoll, H.; Preuß, H. Energy-Adjustedab Initio Pseudopotentials for the Second and Third Row Transition Elements. Theoret. Chim. Acta 1990, 77, 123–141. [Google Scholar] [CrossRef]
  92. Cancès, E.; Mennucci, B.; Tomasi, J. A New Integral Equation Formalism for the Polarizable Continuum Model: Theoretical Background and Applications to Isotropic and Anisotropic Dielectrics. J. Chem. Phys. 1997, 107, 3032–3041. [Google Scholar] [CrossRef]
  93. Cossi, M.; Barone, V.; Mennucci, B.; Tomasi, J. Ab Initio Study of Ionic Solutions by a Polarizable Continuum Dielectric Model. Chem. Phys. Lett. 1998, 286, 253–260. [Google Scholar] [CrossRef]
Scheme 1. Structural formulas of Re(I) complexes.
Molecules 27 07147 sch001
Figure 1. The asymmetric unit of 1 with the atom numbering and thermal ellipsoids set at 50% probability for non-hydrogen atoms. Selected bond lengths (Å) and angles (°) associated with the Re(1) ion: Re(1)–N(1) 2.205(4), Re(1)–N(2) 2.171(4), Re(1)–C(1) 1.893(6), Re(1)–C(2) 1.926(6), Re(1)–C(3) 1.927(6), Re(1)-Cl(1) 2.4889(13), N(1)–Re(1)–N(2) 74.26(14), N(1)–Re(1)–C(1) 168.86(16), N(1)–Re(1)–C(2) 92.7(2), N(1)–Re(1)–C(3) 102.38(19), N(2)–Re(1)–C(1) 96.94(19), N(2)–Re(1)–C(2) 92.7(2), C(3)–Re(1)–N(2) 175.30(19), C(1)–Re(1)–C(2) 89.7(2), C(1)–Re(1)–C(3) 86.0(2), C(2)–Re(1)–C(3) 91.0(2), C(1)–Re(1)–Cl(1) 91.57(18), C(2)–Re(1)–Cl(1) 177.71(18), C(3)–Re(1)–Cl(1) 90.94(17), N(1)–Re(1)–Cl(1) 81.05(10), N(2)–Re(1)–Cl(1) 85.31(10) (see also Table S2).
Molecules 27 07147 g001
Figure 2. UV-Vis spectra of 1 (a) and 2 (b) in solvents of different polarity.
Molecules 27 07147 g002
Figure 3. (a) Experimental (black line) absorption spectra of 1 alongside blue vertical lines presenting singlet–singlet transitions with corresponding oscillator strengths, computed at TD-DFT/PCM/PBE1PBE/def2-TZVPD/def2-TZVP level with the use of the PCM model at polarities corresponding to CH3CN and CHCl3; (b) percentage composition of molecular orbitals for compound 1 computed at the DFT/PBE1PBE/def2-TZVPD/def2–TZVP level with the use of the PCM model at polarities corresponding to CH3CN and CHCl3. For complex 2, see Figures S25–S27 in ESI.
Molecules 27 07147 g003aMolecules 27 07147 g003b
Figure 4. Normalized photoluminescence spectra of 1 (a) and 2 (b) in different environments.
Molecules 27 07147 g004
Figure 5. Normalized photoluminescence spectra of 1 and 2 in ethanol–methanol rigid-glass matrix (77 K) and solid state.
Molecules 27 07147 g005
Figure 6. TCSPC decay curves for compounds 1 (a) and 2 (b) in different solvents.
Molecules 27 07147 g006
Figure 7. Representative isodensity surface plots of the LSOMO and HSOMO for complex 1 (TD-DFT at T1 state geometry, red and blue colors show regions of excess α spin density and excess β spin density values, respectively), simulated with the PCM model in chloroform (a) and acetonitrile (b). For complex 2, see Figure S34 in ESI.
Molecules 27 07147 g007
Figure 8. The fsTA 2D maps (a) and TA spectra at selected time delays (b) for complexes 1 and 2 in acetonitrile.
Molecules 27 07147 g008
Figure 9. Decay associated spectra (DASi) with corresponding time constants (ti) along with species associated spectra (SASi) for complexes 1 (a) and 2 (b) in acetonitrile.
Molecules 27 07147 g009
Figure 10. The fsTA 2D maps (a) and TA spectra at selected time delays (b), decay associated spectra (DASi) (c), and species associated spectra (SASi) (d) for complexes 1 and 2 in chloroform.
Molecules 27 07147 g010aMolecules 27 07147 g010b
Table 1. The absorption maxima and molar extinction coefficient for 1 and 2 in solvents of different polarity.
Compoundλ/nm (104 ε/dm3·mol−1·cm−1)
CHCl3THFCH3CNDMF
1405 (1.63)405 (1.75)402 (1.93)409 (1.66)
2405 (1.72)406 (1.78)405 (2.24)417 (2.26)
Table 2. Relevant photophysical parameters of complexes 1 and 2.
CompoundMediumλex [nm]λem [nm]τavΦ
1CHCl34056458 ns0.009
THF4056656 ns0.010
DMF409650248 ns0.001
CH3CN405665146 ns<0.001
77 K
(EtOH-MeOH)
420560178 μs––
solid475613553 ns0.071
2CHCl34306438 ns0.026
THF4456656 ns0.027
DMF420640579 ns0.003
CH3CN41564079 ns0.003
77 K
(EtOH-MeOH)
410564173 μs
solid450560,589,649828 ns0.003
Publisher’s Note: MDPI stays neutral with regard to jurisdictional claims in published maps and institutional affiliations.

