Abstract
Jinmu-tang (JMT) is a traditional herbal medicine consisting of five herbal medicines: Poria cocos Wolf, Paeonia lactiflora Pallas, Zingiber officinale Roscoe, Atractylodes japonica Koidzumi, and Aconitum carmichaeli Debeaux. In this study, the JMT components were profiled using UHPLC-Q-Orbitrap-MS, and 23 compounds were identified and characterized. In addition, UPLC-TQ-MS/MS analysis was performed in the positive and negative ion modes of an electrospray ionization source for the simultaneous quantification of the identified compounds. The multiple reaction monitoring (MRM) method was established to increase the sensitivity of the quantitative analysis, and the method was verified through linearity, recovery, and precision. All analytes showed good linearity (R2 ≤ 0.9990). Moreover, the recovery and the relative standard deviation of precision were 86.19–114.62% and 0.20–8.00%, respectively. Using the established MRM analysis method, paeoniflorin was found to be the most abundant compound in JMT. In conclusion, these results provide information on the constituents of JMT and can be applied to quality control and evaluation.
1. Introduction
Traditional oriental medicines (TOM) and their preparations have been widely used for a long time in clinical practice for the treatment and prevention of various diseases in many Asian countries such as China, Korea, and Japan [1,2]. Jinmu-tang (JMT) is one of the classic prescriptions documented in the ‘Treatise on Febrile Diseases’, and consists of five single herbal medicinal: Poria cocos Wolf, Paeonia lactiflora Pallas, Zingiber officinale Roscoe, Atractylodes japonica Koidzumi, and Aconitum carmichaeli Debeaux [3]. In TOM, JMT has been used as a treatment for various kidney diseases because of its effectiveness in relieving symptoms caused by the deterioration of kidney functions [4]. Clinically, JMT improves kidney damage or function in glomerulonephritis, membranous nephropathy, and chronic renal failure [5,6,7]. Recent studies have revealed that JMT has various biological properties, such as anti-inflammatory, antioxidant, and anti-hyperlipidemia effects, following the pharmacological characteristics of every single herbal medicine [8,9,10].
TOM preparations consist of a variety of herbal medicines, but most select specific herbal medicines to manage and evaluate their quality. However, this does not accurately reflect the quality of the formulation, and the evaluation of efficacy determined by the pharmacological effects of various chemical components is also limited [1,11,12]. Currently, no studies have been reported on JMT quality control, so it is necessary to provide information on the constituents of JMT and establish an appropriate analysis method. According to previous studies, some components have been identified using high-performance liquid chromatography (HPLC) and gas chromatography-mass spectrometry (GC-MS) for quality evaluation of TOM preparations [13,14]. In particular, HPLC-MS is widely used in the analysis of TOM preparations because of its high sensitivity and resolution, and it is possible to identify multiple compounds in one analysis [15]. It also allows for systematic profiling of components, enabling convenient and rapid quality control [16]. JMT contains various components such as triterpenoids (e.g., pachymic acid) from P. cocos [17], monoterpenoids (e.g., paeoniflorin) from P. lactiflora [18], phenols (e.g., 6-gingerol), flavonoids (e.g., catechin) from Z. officinale [19,20], sesquiterpenoids (e.g., atractyloside A) from A. japonica [21], and alkaloids (e.g., fuziline) from A. carmichaeli [22].
However, there is little information about analytical methods for quality control of JMT. Therefore, in this study, the constituent compounds of JMT were identified using UHPLC-Q-Orbitrap-MS, and 23 components were characterized. In addition, the contents of 23 compounds were analyzed by validating and establishing a multiple reaction monitoring (MRM) method for the simultaneous quantification of the identified compounds.
2. Results and Discussion
2.1. Qualitative Analysis of Compounds in JMT by UHPLC-Q-Orbitrap-MS
UHPLC-Q-Orbitrap-MS was performed for qualitative analysis of JMT, and the constituent chemical compounds were identified and characterized. Both the positive and negative ion modes were used to acquire the MS spectra. The UV and base peak chromatograms of JMT are shown in Figure 1.
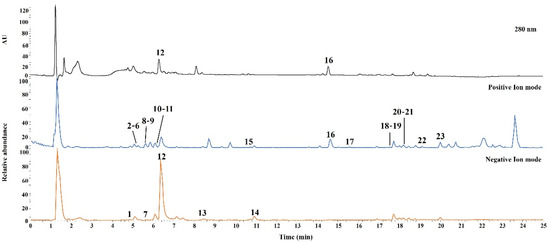
Figure 1.
Representative base peak ion chromatograms of JMT extract by UHPLC-Q-Orbitrap-MS. The ID number of the various types of phytochemicals are listed in Table 1.
In total, 23 compounds were identified and confirmed by comparing the retention times and mass spectra of authentic standard compounds. Detailed results for the characterized compounds, including retention times and MS data, are summarized in Table 1.

Table 1.
Characterization of identified compounds of JMT by UHPLC-Q-Oribitrap-MS.
Of the chemical constituents identified in JMT in this study, six compounds (paeoniflorin, 6-gingerol, atractylenolide I, atractylenolide II, atractylenolide III, and pachymic acid) have been reported in previous studies [6,23].
2.2. Quantitative Analysis of Compounds in JMT by UPLC-TQ-MS/MS
UPLC-TQ-MS/MS was performed to quantify the 23 compounds of JMT, and all analytes were detected simultaneously within 20 min. To increase the sensitivity of the quantitative analysis, multiple reaction monitoring (MRM) was used and evaluated in both positive and negative ion modes. Five compounds (atractyloside A, paeonolide, paeoniflorin, phlorizin, and benzoylpaeoniflorin) were detected in negative ion mode, and the remaining 18 compounds were detected in positive ion mode. Optimized analysis conditions were established by identifying precursor ions for each analyte and selecting the product ions for MRM analysis. The MRM chromatograms obtained by applying the optimized analytical conditions are shown in Figure 2.
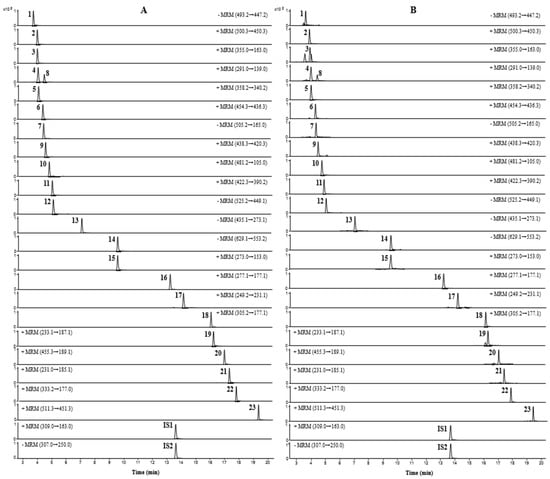
Figure 2.
MRM chromatograms of mixed reference solution (A) and JMT extract (B).
For aconine, m/z 450.3 was formed due to the loss of methanol (32 Da) and water (18 Da) molecules from the precursor ions [24]. For chlorogenic acid, one water molecule was lost from the dissociated caffeic acid moiety of the precursor molecule, and a product ion peak was detected at m/z 163.0 [25]. Catechin and epicatechin formed product ions at m/z 139.0, as a result of Retro-Diels-Alder (RDA) fragmentation (−152 Th) [26,27]. In napellonine, fuziline, and bullatine B, ions in the form of [M + H − H2O] were formed at m/z 340.2, 436.3, and 420.3, owing to the loss of H2O from the precursor ion in the form of [M + H]+ [28,29]. Paeonolide exhibited a characteristic ion at m/z 165.0 due to the loss of the adiglycosyl moiety [30], while phlorizin displayed a fragment at m/z 273.1 due to the loss of 162 Da from the precursor ion by deprotonated phloretin [31]. Albiflorin, a monoterpene glucoside, produced [M + H]+ ions at m/z 481.2 in positive ion mode. In contrast, paeoniflorin, an isomer of albiflorin, showed [M + COOH]− ions at m/z 525.2 in the negative ion mode instead of the positive ion mode. In addition, benzoylpaeoniflorin showed fragmentation similar to paeoniflorin, and formed ions in the form of [M − H − HCOH]−; paeoniflorin and benzoylpaeoniflorin were observed at m/z 449.1 and m/z 553.2, respectively [32,33]. For talatisamine and naringenin, the product ion was formed in the positive ion mode from protonated molecular ions [M + H]+, and ions were generated at m/z 390.2 ([M + H − CH3OH]+) and m/z 153.0 ([M + H − C8H8O]+), respectively [34,35]. Furthermore, 6-gingerol, 8-gingerol, and 10-gingerol lost species at 100, 128, and 156 Da, respectively, due to the loss of the neutral alkyl moiety ([CH3(CH2)nCHO]) in the structure of [M + H − H2O]+. As a result, all three gingerols formed ions in the form of [M + H–H2O–C6H12O]+, [M + H–H2O–C8H16O]+, and [M + H–H2O–C10H20O]+ at m/z 177.1, respectively [36,37,38]. Among the three lactone components, atractylenolide I and II generated [M + H − H2O − CO]+ ions at m/z 185.1 and 187.1, respectively, as a result of the loss of H2O and CO groups from the precursor ions. In the case of atractylenolide III, [M + H − H2O]+ ion was formed at m/z 231.1 due to the loss of H2O molecules [32,39].
2.3. Method Validation of Qualitative Analysis
For the quantitative analysis of 23 compounds of JMT, linearity, recovery, precision, and accuracy were evaluated to verify the analytical method used in this study. The regression equations, correlation coefficients (R2), linear ranges, and LLOQ values for all the compounds are listed in Table 2.
Table 2.
Regression equation, linear range, and lower limit of quantification (LLOQ) of the 23 compounds.
The correlation coefficient, which indicates the linearity of the calibration curve, was greater than 0.9990 for all analytes, indicating good linearity. In addition, the LLOQ was in the range of 0.02–12.50 ng/mL for all compounds, which showed the sensitivity of the assay used in this study. The recovery was analyzed by adding mixed standard solutions of three different concentration levels to a known amount of the sample. The recoveries of the 23 compounds varied between 86.19% and 114.62%, and the relative standard deviations (RSD) values were found to be in the range of 0.38–5.80% (Table 3).
Table 3.
Recovery test for the assay of the 23 compounds in JMT.
Precision and accuracy were validated by analyzing QC samples at three concentration levels. The intraday test was performed in six replicates within the same day, and the interday test was performed for three consecutive days. The intra- and interday precision calculated as RSD was less than 6.50% and 8.00% for all analytes, respectively, and the accuracy was within the range of 91.79–110.74 and 90.22–107.22%, respectively. Detailed data on precision and accuracy are shown in Table 4.
Table 4.
Precision and accuracy for the assay of the 23 compounds in JMT.
As described above, the analytical method used in this study was appropriately established based on the results of all validation parameters, suggesting that the simultaneous analysis of the 23 compounds of JMT can be performed accurately and efficiently.
2.4. Sample Analysis
Simultaneous quantitative analysis of the 23 compounds in JMT was performed by applying the validated UPLC-TQ-MS/MS method. The contents of all investigated compounds are summarized in Table 5 and were calculated by internal standard methods based on the respective calibration curves.
Table 5.
Content of the 23 compounds in different batches JMT.
The UPLC-TQ-MS/MS MRM mode performed in this study was successfully applied to quantify the content of 23 compounds in JMT and all compounds eluted within 20 min. Among these, paeoniflorin, 6-gingerol, and albiflorin were found to be more abundant in JMT than in the other compounds. These three compounds are derived from P. lactiflora and Z. officinale, among the constituent herbal medicines of JMT, and these results are similar to those of previous reports on the ingredients of a single herbal medicine [18,40]. In addition, as in a previous report, the content of paeoniflorin was 25.694–27.876 mg/g in three batches of JMT, showing the highest content among the detection compounds [41].
3. Materials and Methods
3.1. Materials and Reagents
JMT consisted of five herbal medicines (P. cocos, P. lactiflora, Z. officinale, A. japonica, and A. carmichaeli), all of which were purchased from Kwangmyungdang Pharmaceutical (Ulsan, Korea). Each raw herbal medicine (specimens No. TDC-01 to TDC-05) was deposited in the KM Convergence Research Division, Korea Institute of Oriental Medicine. The reference standards for 23 components in JMT were purchased from Targetmol (Wellesley Hills, MA, USA) and ChemFaces (Wuhan, China). Warfarin, an internal standard, was obtained from Sigma-Aldrich (St. Louis, MO, USA), while MS-grade solvents (methanol, acetonitrile, water, and formic acid) were purchased from Thermo Fisher Scientific (Loughborough, UK).
3.2. Preparation of JMT
JMT, composed of five herbal medicines, was mixed in the ratio shown in Table 6, and distilled water (10-fold mass) was added and extracted under reflux at 100 °C for 3 h. The water extract was filtered, concentrated using a rotary evaporator under reduced pressure, and freeze-dried to prepare a powder sample (yield:22.0%).
Table 6.
Composition of Jinmu-tang (JMT).
3.3. Preparation of Standard and Sample Solutions
Stock solutions of the 23 compounds and warfarin (internal standard, IS) were prepared by diluting the reference standards with methanol. The stock solutions were then mixed, and a series of working solutions were obtained by further dilution with methanol. The mixed working solution was diluted to an appropriate concentration range for use in calibration curve construction, and the concentration of IS in each sample was kept consistent at 5.0 ng/mL. Quality control (QC) samples of the three concentration levels (high, medium, and low) used for method validation were prepared using the same method as the calibration samples. A sample solution of 20 mg JMT extract dissolved in methanol was subjected to ultrasonic extraction for 30 min. The extracted solution was then centrifuged at 12,500 rpm for 15 min and used for the analysis.
3.4. Qualitative Analysis
The chemical constituents of JMT were identified using ultra-performance liquid chromatography/quadrupole-Orbitrap mass spectrometry (UHPLC-Q-Orbitrap-MS) as previously reported [42]. A Dionex UltiMate 3000 system with a Thermo Q-Exactive mass spectrometer was used for analysis. Chromatographic analysis was performed using an Acquity BEH C18 column (100 × 2.1 mm, 1.7 μm) and a gradient mixture of 0.1% formic acid in water (A) and acetonitrile (B) was used for the mobile phase. The flow rate was 0.25 mL/min, and the sample injection volume was 3.0 μL. MS analysis was performed in positive and negative ionization switching modes using a Q-Exactive mass spectrometer, and MS spectra were obtained in full MS-ddMS2 mode. The other operating parameters were set as follows: spray voltage, 3.8 kV; capillary temperature, 320 °C; sheath gas pressure, 40 arbitrary units (au); auxiliary gas pressure, 10 au; resolution of MS scans, 70,000; resolution of MS/MS scans, 17,500; scan range, 100–1500 m/z; and normalized collision energy, 25 eV. The resulting data were acquired and analyzed using the Xcalibur v.3.0 and Tracefinder v.3.2 software (Thermo Fisher Scientific, Waltham, MA, USA).
3.5. Quantitative Analysis
Quantitative analysis of the 23 compounds in JMT was performed on an Agilent 1290 Infinity II system coupled to an Agilent 6495C triple quadrupole mass spectrometer with an electrospray ionization (ESI) source (Agilent Technologies, California, USA). The separation was achieved on an Acquity BEH C18 column (100 × 2.1 mm, 1.7 μm). The mobile phase consisted of 0.1% formic acid in water (A) and acetonitrile (B), and the gradient elution conditions were as follows:3% B (0–1 min), 3–15% B (1–2 min), 15–50% B (2–13 min), 50–100% B (13–20 min), 100% B (20–23 min), and 3% B (23.5–27.5 min). The column was maintained at 40 ℃, and the flow rate and injection volume were 0.25 mL/min and 3.0 μL, respectively. Mass spectra were acquired in positive or negative ion mode, and operating parameters were as follows: gas temperature, 130 ℃; drying gas flow, 11 L/min; nebulizer gas, 25 psi; sheath gas temperature, 400 ℃; sheath gas flow, 12 L/min; capillary voltage (positive mode), 3500 V; capillary voltage (negative mode), 3000 V; nozzle voltage (positive mode), 500 V; nozzle voltage (negative mode), 1500 V. The analysis of 23 compounds was performed using the multiple reaction monitoring (MRM) mode, and the detailed MRM conditions for each analyte are summarized in Table 7. The Agilent MassHunter workstation quantitative analysis software was used for all the MS data acquisition and processing.
Table 7.
MRM parameters of the 23 compounds and the internal standards.
3.6. Method Validation of Quantitative Analysis
The analytical method for the quantitative determination of 23 compounds in JMT was validated and evaluated using validation parameters such as linearity, recovery, precision, and accuracy [43]. For the calibration curves, working solutions of the mixed reference compounds were diluted to the appropriate concentrations and analyzed. Next, the calibration curve for each analyte was established by plotting the peak area ratios (analyte to IS) versus analyte concentrations. The lower limit of quantification (LLOQ) was defined as the lowest concentration of the standard curve that could be quantified with acceptable accuracy and precision. The limit of quantification (LOQ) was determined at an S/N ratio of 10. A recovery test was performed by adding three known concentrations (low, medium, and high) of each analyte to the JMT sample. The recovery was calculated using the following equation: recovery (%) = (found amount/spiked amount) × 100. To validate the precision of the analytical method, the mixed standard solution was measured six times and then evaluated using the CV value calculated from the measured concentration. The analysis of intra- and inter-day precision was performed with measurements for one day and three consecutive days for the three concentrations, respectively.
4. Conclusions
In this study, chemical profiling of JMT, a traditional herbal prescription, was performed using UHPLC-Q-Orbitrap-MS, and 23 marker compounds were identified. In addition, an analytical method for the quantification of the constituent compounds using UPLC-TQ-MS/MS was verified and developed. As a result, a total of 23 compounds were identified and compared to the authentic standard compounds. In the quantitative analysis performed using the developed MRM method, 23 components were simultaneously measured within 20 min, and all compounds were efficiently quantified. The qualitative and quantitative analysis methods established in this study enable efficient quality control of JMT and can also be utilized as important basic data for oriental medicine prescription. Furthermore, it can also be used in related research, such as the discovery of biologically active substances and analysis of efficacy.
Author Contributions
Conceptualization, Y.-H.H.; investigation, S.J., A.L. and Y.-H.H.; writing—original draft preparation, S.J.; writing—review and editing, S.J. and Y.-H.H.; funding acquisition, Y.-H.H. All authors have read and agreed to the published version of the manuscript.
Funding
This research was funded by the Korea Institute of Oriental Medicine (grant number KSN2211020).
Institutional Review Board Statement
Not applicable.
Informed Consent Statement
Not applicable.
Data Availability Statement
The data presented in this study are available on request from the corresponding author.
Conflicts of Interest
The authors declare no conflict of interest.
References
- Chen, J.; Yang, Y.; Shi, Y.P. Simultaneous quantification of 12 active components in Yiqing granule by ultra-performance liquid chromatography: Application to quality control study. Biomed. Chromatogr. 2011, 25, 1045–1053. [Google Scholar] [CrossRef] [PubMed]
- Seo, C.S.; Shin, H.K. Simultaneous analysis for quality control of traditional herbal medicine, Gungha-tang, using liquid chromatography-tandem mass spectrometry. Molecules 2022, 27, 1223. [Google Scholar] [CrossRef] [PubMed]
- Li, H.; Lu, R.; Pang, Y.; Li, J.; Cao, Y.; Fu, H.; Fang, G.; Chen, Q.; Liu, B.; Wu, J.; et al. Zhen-Wu-Tang protects against IgA nephropathy in rats by regulating exosomes to inhibit the NF-kappaB/NLRP3 pathway. Front. Pharmacol. 2020, 11, 1080. [Google Scholar] [CrossRef] [PubMed]
- Liang, C.L.; Wu, J.B.; Lai, J.M.; Ye, S.F.; Lin, J.; Ouyang, H.; Zhan, J.Y.; Zhou, J.Y. Protection effect of Zhen-Wu-Tang on adriamycin-induced nephrotic syndrome via inhibiting oxidative lesions and inflammation damage. Evid. Based Complement. Altern. Med. 2014, 2014, 131604. [Google Scholar] [CrossRef]
- La, L.; Wang, L.; Qin, F.; Jiang, J.; He, S.; Wang, C.; Li, Y. Zhen-wu-tang ameliorates adenine-induced chronic renal failure in rats: Regulation of canonical Wnt4/beta-catenin signaling in the kidneys. J. Ethnopharmacol. 2018, 219, 81–90. [Google Scholar] [CrossRef] [PubMed]
- Liu, B.; Lu, R.; Li, H.; Zhou, Y.; Zhang, P.; Bai, L.; Chen, D.; Chen, J.; Li, J.; Yu, P.; et al. Zhen-wu-tang ameliorates membranous nephropathy in rats by inhibiting the NF-κB pathway and NLRP3 inflammasome. Phytomedicine 2019, 59, 152913. [Google Scholar] [CrossRef]
- Liu, Q.; Hu, S.; He, Y.; Zhang, J.; Zeng, X.; Gong, F.; Liang, L. Protective effects of Zhen-Wu-Tang against cisplatin-induced acute kidney injury in rats. PLoS ONE 2017, 12, e0179137. [Google Scholar] [CrossRef]
- Li, S.; Xiao, X.; Han, L.; Wang, Y.; Luo, G. Renoprotective effect of Zhenwu decoction against renal fibrosis by regulation of oxidative damage and energy metabolism disorder. Sci. Rep. 2018, 8, 14627. [Google Scholar] [CrossRef]
- Miao, H.; Li, M.-H.; Zhang, X.; Yuan, S.-J.; Ho, C.C.; Zhao, Y.-Y. The antihyperlipidemic effect of Fu-Ling-Pi was associated with abnormal fatty acid metabolism, as assessed by UPLC-HDMS-based lipidomics. RSC Adv. 2015, 5, 64208–64219. [Google Scholar] [CrossRef]
- Parker, S.; May, B.; Zhang, C.; Zhang, A.L.; Lu, C.; Xue, C.C. Ppharmacological review of bioactive constituents of Paeonia lactiflora Pallas and Paeonia veitchii Lynch. Phytother. Res. 2016, 30, 1445–1473. [Google Scholar] [CrossRef]
- Wang, D.D.; Liang, J.; Yang, W.Z.; Hou, J.J.; Yang, M.; Da, J.; Wang, Y.; Jiang, B.H.; Liu, X.; Wu, W.Y.; et al. HPLC/qTOF-MS-oriented characteristic component dataset and chemometric analysis for the holistic quality control of complex TCM preparations: Niuhuang Shangqing pill as an example. J. Pharm. Biomed. Anal. 2014, 89, 130–141. [Google Scholar] [CrossRef] [PubMed]
- Zhu, G.; Zhang, G.; Wang, M.; Wang, J.; Zeng, W.; Gao, X. Simultaneous determination of nine active compounds of the traditional Chinese medicinal prescription Shaoyao-Gancao-Tang and analysis of the relationship between therapeutic effect and compatibility of medicines. Evid. -Based Complement. Altern. Med. 2014, 2014, 521038. [Google Scholar] [CrossRef] [PubMed]
- He, M.; Yang, Z.Y.; Yang, T.B.; Ye, Y.; Nie, J.; Hu, Y.; Yan, P. Chemometric-enhanced one-dimensional comprehensive two-dimensional gas chromatographic analysis for bioactive terpenoids and phthalides in Chaihu Shugan San essential oils. J. Chromatogr. B Anal. Technol. Biomed. Life Sci. 2017, 1052, 158–168. [Google Scholar] [CrossRef] [PubMed]
- Xie, M.; Yu, Y.; Zhu, Z.; Deng, L.; Ren, B.; Zhang, M. Simultaneous determination of six main components in Bushen huoxue prescription by HPLC-CAD. J. Pharm. Biomed. Anal. 2021, 201, 114087. [Google Scholar] [CrossRef] [PubMed]
- Wang, X.; Zhou, W.; Wang, Q.; Zhang, Y.; Ling, Y.; Zhao, T.; Zhang, H.; Li, P. A novel and comprehensive strategy for quality control in complex Chinese medicine formulas using UHPLC-Q-Orbitrap HRMS and UHPLC-MS/MS combined with network pharmacology analysis: Take the Tangshen formula as an example. J. Chromatogr. B Anal. Technol. Biomed. Life Sci. 2021, 1183, 122889. [Google Scholar] [CrossRef] [PubMed]
- Wang, X.; Zhang, A.A.; Yan, G.; Han, Y.; Sun, H. UHPLC-MS for the analytical characterization of traditional Chinese medicines. TrAC Trends Anal. Chem. 2014, 63, 180–187. [Google Scholar] [CrossRef]
- Zou, Y.T.; Long, F.; Wu, C.Y.; Zhou, J.; Zhang, W.; Xu, J.D.; Zhang, Y.Q.; Li, S.L. Dereplication strategy for identifying triterpene acid analogs in Poria cocos by comparing predicted and acquired UPLC-ESI-QTOF-MS/MS data. Phytochem. Anal. 2019, 30, 292–310. [Google Scholar] [CrossRef]
- Li, P.; Shen, J.; Wang, Z.; Liu, S.; Liu, Q.; Li, Y.; He, C.; Xiao, P. Genus Paeonia: A comprehensive review on traditional uses, phytochemistry, pharmacological activities, clinical application, and toxicology. J. Ethnopharmacol. 2021, 269, 113708. [Google Scholar] [CrossRef]
- Kondapalli, N.B.; Hemalatha, R.; Uppala, S.; Yathapu, S.R.; Mohammed, S.; Venkata Surekha, M.; Rajendran, A.; Bharadwaj, D.K. Ocimum sanctum, Zingiber officinale, and Piper nigrum extracts and their effects on gut microbiota modulation (prebiotic potential), basal inflammatory markers, and lipid levels: Oral supplementation study in healthy rats. Pharm. Biol. 2022, 60, 437–450. [Google Scholar] [CrossRef]
- Wu, C.Y.; Kong, M.; Zhang, W.; Long, F.; Zhou, J.; Zhou, S.S.; Xu, J.D.; Xu, J.; Li, S.L. Impact of sulfur fumigation on the chemistry of ginger. Food Chem. 2018, 239, 953–963. [Google Scholar] [CrossRef]
- Shan, G.S.; Zhang, L.X.; Zhao, Q.M.; Xiao, H.B.; Zhuo, R.J.; Xu, G.; Jiang, H.; You, X.M.; Jia, T.Z. Metabolomic study of raw and processed Atractylodes macrocephala Koidz by LC-MS. J. Pharm. Biomed. Anal. 2014, 98, 74–84. [Google Scholar] [CrossRef] [PubMed]
- Huang, D.; Zhao, X.; Liu, X.; Chao, R. Determination of five aminoalcohol-diterpenoid alkaloids in the lateral root of Aconitum carmichaeli by HPLC-ELSD with SPE. J. Chromatogr. Sci. 2017, 55, 940–945. [Google Scholar] [CrossRef] [PubMed]
- Liang, C.L.; Zhang, P.C.; Wu, J.B.; Liu, B.H.; Yu, H.; Lu, R.R.; Zhou, J.; Zhou, J.Y. Zhen-wu-tang attenuates adriamycin-induced nephropathy by regulating AQP2 and miR-92b. Biomed. Pharmacother. 2019, 109, 1296–1305. [Google Scholar] [CrossRef] [PubMed]
- Luo, H.; Huang, Z.; Tang, X.; Yi, J.; Chen, S.; Yang, A.; Yang, J. Dynamic variation patterns of aconitum alkaloids in daughter root of Aconitum Carmichaelii (Fuzi) in the decoction process based on the content changes of nine Aconitum alkaloids by HPLC-MS-MS. Iran. J. Pharm. Res. 2016, 15, 263–273. [Google Scholar]
- Sabaragamuwa, R.; Perera, C.O.; Fedrizzi, B. Ultrasound-assisted extraction and quantification of targeted bioactive compounds of Centella asiatica (Gotu Kola) by ultra-high-performance liquid MRM tandem mass spectroscopy. Food Chem. 2022, 371, 131187. [Google Scholar] [CrossRef] [PubMed]
- Chang, C.-L.; Wu, R.-T. Quantification of (+)-catechin and (−)-epicatechin in coconut water using LC–MS. Food Chem. 2011, 126, 710–717. [Google Scholar] [CrossRef]
- Lambert, M.; Meudec, E.; Verbaere, A.; Mazerolles, G.; Wirth, J.; Masson, G.; Cheynier, V.; Sommerer, N. Hhigh-throughput UHPLC-QqQ-MS method for polyphenol profiling of rose wine. Molecules 2015, 20, 7890–7914. [Google Scholar] [CrossRef]
- Lei, H.; Zhang, Y.; Ye, J.; Cheng, T.; Liang, Y.; Zu, X.; Zhang, W. A comprehensive quality evaluation of Fuzi and its processed product through the integration of UPLC-QTOF/MS combined MS/MS-based mass spectral molecular networking with multivariate statistical analysis and HPLC-MS/MS. J. Ethnopharmacol. 2021, 266, 113455. [Google Scholar] [CrossRef]
- Sun, L.; You, G.; Cao, X.; Wang, M.; Ren, X. Comparative investigation of raw and processed Aconiti Lateralis radix using chemical UPLC-MS profiling and multivariate classification techniques. J. Food Drug. Anal. 2019, 27, 365–372. [Google Scholar] [CrossRef]
- Huang, Q.; Chen, J.J.; Pan, Y.; He, X.F.; Wang, Y.; Zhang, X.M.; Geng, C.A. Chemical profiling and antidiabetic potency of Paeonia delavayi: Comparison between different parts and constituents. J. Pharm. Biomed. Anal. 2021, 198, 113998. [Google Scholar] [CrossRef]
- Rojas-Garbanzo, C.; Zimmermann, B.F.; Schulze-Kaysers, N.; Schieber, A. Characterization of phenolic and other polar compounds in the peel and flesh of pink guava (Psidium guajava L. cv. “Criolla”) by ultra-high performance liquid chromatography with diode array and mass spectrometric detection. Food Res. Int. 2017, 100, 445–453. [Google Scholar] [CrossRef] [PubMed]
- Chen, L.; Qi, J.; Chang, Y.X.; Zhu, D.; Yu, B. Identification and determination of the major constituents in traditional Chinese medicinal formula Danggui-Shaoyao-San by HPLC-DAD-ESI-MS/MS. J. Pharm. Biomed. Anal. 2009, 50, 127–137. [Google Scholar] [CrossRef] [PubMed]
- Xu, Y.; Cai, H.; Cao, G.; Duan, Y.; Pei, K.; Tu, S.; Zhou, J.; Xie, L.; Sun, D.; Zhao, J.; et al. Profiling and analysis of multiple constituents in Baizhu Shaoyao San before and after processing by stir-frying using UHPLC/Q-TOF-MS/MS coupled with multivariate statistical analysis. J. Chromatogr. B Anal. Technol. Biomed. Life Sci. 2018, 1083, 110–123. [Google Scholar] [CrossRef] [PubMed]
- Tong, L.; Zhou, D.; Gao, J.; Zhu, Y.; Sun, H.; Bi, K. Simultaneous determination of naringin, hesperidin, neohesperidin, naringenin, and hesperetin of Fractus aurantii extract in rat plasma by liquid chromatography-tandem mass spectrometry. J. Pharm. Biomed. Anal. 2012, 58, 58–64. [Google Scholar] [CrossRef] [PubMed]
- Ying, X.; Liu, M.; Liang, Q.; Jiang, M.; Wang, Y.; Huang, F.; Xie, Y.; Shao, J.; Bai, G.; Luo, G. Identification and analysis of absorbed components and their metabolites in rat plasma and tissues after oral administration of ‘Ershiwuwei Shanhu’ pill extracts by UPLC-DAD/Q-TOF-MS. J. Ethnopharmacol. 2013, 150, 324–338. [Google Scholar] [CrossRef]
- Asamenew, G.; Kim, H.-W.; Lee, M.-K.; Lee, S.-H.; Kim, Y.J.; Cha, Y.-S.; Yoo, S.M.; Kim, J.-B. Characterization of phenolic compounds in normal ginger (Zingiber officinale Rosc.) and black ginger (Kaempferia parviflora Wall.) using UPLC–DAD–QToF–MS. Eur. Food Res. Technol. 2018, 245, 653–665. [Google Scholar] [CrossRef]
- Jiang, H.; Somogyi, A.; Timmermann, B.N.; Gang, D.R. Instrument dependence of electrospray ionization and tandem mass spectrometric fragmentation of gingerols. Rapid Commun. Mass. Spectrom. 2006, 20, 3089–3100. [Google Scholar] [CrossRef]
- Wang, S.P.; Liu, L.; Wang, L.L.; Jiang, P.; Zhang, J.Q.; Zhang, W.D.; Liu, R.H. Screening and analysis of the multiple absorbed bioactive components and metabolites in rat plasma after oral administration of Jitai tablets by high-performance liquid chromatography/diode array detection coupled with electrospray ionization tandem mass spectrometry. Rapid Commun. Mass. Spectrom. 2010, 24, 1641–1652. [Google Scholar] [CrossRef]
- Shi, Y.Y.; Guan, S.H.; Tang, R.N.; Tao, S.J.; Guo, D.A. Simultaneous determination of atractylenolide II and atractylenolide III by liquid chromatography-tandem mass spectrometry in rat plasma and its application in a pharmacokinetic study after oral administration of Atractylodes macrocephala rhizoma extract. Biomed. Chromatogr. 2012, 26, 1386–1392. [Google Scholar] [CrossRef]
- Li, Y.; Hong, Y.; Han, Y.; Wang, Y.; Xia, L. Chemical characterization and comparison of antioxidant activities in fresh, dried, stir frying, and carbonized ginger. J. Chromatogr. B Anal. Technol. Biomed. Life Sci. 2016, 1011, 223–232. [Google Scholar] [CrossRef]
- Liu, B.; He, Y.; Lu, R.; Zhou, J.; Bai, L.; Zhang, P.; Ye, S.; Wu, J.; Liang, C.; Zhou, Y.; et al. Zhen-wu-tang protects against podocyte injury in rats with IgA nephropathy via the PPARgamma/NF-κB pathway. Biomed. Pharmacother. 2018, 101, 635–647. [Google Scholar] [CrossRef] [PubMed]
- Kim, Y.J.; Jeon, W.-Y.; Hwang, Y.-H.; Lee, M.-Y. Inhibitory effects of Gyeji-tang on MMP-9 activity and the expression of adhesion molecules in IL-4-and TNF-α-stimulated BEAS-2B cells. Plants 2021, 10, 951. [Google Scholar] [CrossRef] [PubMed]
- Center for Biologics Evaluation and Research (CBER). Guidance for Industry; ICH: Rockville, MD, USA, 1996. [Google Scholar]


Publisher’s Note: MDPI stays neutral with regard to jurisdictional claims in published maps and institutional affiliations. |
© 2022 by the authors. Licensee MDPI, Basel, Switzerland. This article is an open access article distributed under the terms and conditions of the Creative Commons Attribution (CC BY) license (https://creativecommons.org/licenses/by/4.0/).