Article

In Vitro Screening for Anti-Acetylcholinesterase and Antioxidant Activities of Hottonia palustris L. Extracts and Their Unusual Flavonoids

1
Department of Pharmacognosy, Faculty of Pharmacy with the Division of Laboratory Medicine, Medical University of Białystok, ul. Mickiewicza 2a, 15-230 Białystok, Poland
2
Students’ Scientific Association, Department of Pharmacognosy, Faculty of Pharmacy, Medical University of Bialystok, ul. Mickiewicza 2a, 15-230 Białystok, Poland
*
Author to whom correspondence should be addressed.
Molecules 2022, 27(22), 8034; https://doi.org/10.3390/molecules27228034
Submission received: 25 October 2022 / Revised: 16 November 2022 / Accepted: 17 November 2022 / Published: 19 November 2022

Abstract

:
Hottonia palustris L. is from the genus Hottonia (Primulaceae), and the understanding of its phytochemical and pharmacological properties is limited. In this study, the use of chromatographic techniques led to the isolation of a further eleven compounds, including three new flavonoids: 2′,5-dihydroxyflavone 2′-O-β-glucopyranoside, 5,6-dihydroxyflavone 6-O-(6”-O-glucopyranosyl)-β-glucopyranoside (hottonioside A), and 4′,5,7-trihydroxyflavone 7-O-(2”-O-β-glucuronide)-β-glucopyranoside. Their structures were determined using extensive 1D and 2D NMR data and mass spectrometry (HRMS). The qualitative assessment of the chemical composition of the investigated extracts and fractions was performed using the LC-HRMS technique. Furthermore, the antioxidant potential of extracts, fractions, and compounds and their ability to inhibit acetylcholinesterase were also evaluated. Thus, we may conclude that the observed biological effects are the result of the presence of many biologically active compounds, of which dibenzoylmethane is the most active. Therefore, H. palustris is a source of substances with desirable properties in the prevention and treatment of neurodegenerative diseases.

1. Introduction

The genus Hottonia L. (Primulaceae) is represented by two confirmed flora species, H. inflata Elliott and H. palustris L., as well as one of ambiguous status, H. serrata Willd. H. inflata is a species that is native to the flora of North America. It is commonly referred to as the American featherfoil [1,2]. Previous studies indicate that the use of this species in folk medicine is helpful for individuals with heart disease [3]. The Eurasia region is the habitat of the second species, H. palustris [4,5,6]. Previous studies of its lipophilic extracts allowed the isolation of new and biologically active methoxyflavones [7], while an analysis of its alcoholic and hydroalcoholic extracts led to compound isolations [8]. Considering the medicinal potential of H. palustris, this study aimed to isolate further novel bioactive flavone and flavonol derivatives. A further nineteen compounds were isolated and characterized by spectroscopic and spectrometric analyses, five of which are described detail for the first time. Moreover, detailed qualitative and quantitative analyses of the extracts were carried out, and an evaluation of the antioxidant potential of the extracts and compounds was completed. Finally, we addressed the growing interest in the search for new, as well as known, effective substances to inhibit the neurodegenerative processes underlying the etiology of Alzheimer’s disease [9,10,11,12] and carried out an evaluation of the inhibitory effect on acetylcholinesterase.

2. Results and Discussion

A detailed study of chloroform extract, as well as ethyl acetate and n-butanol fractions from the H. palustris herb, led to the isolation of eleven compounds. These were identified as 5,6,2′,6′-tetramethoxyflavone (zapotin) (8), 5,2′-dihydroxyflavone 2′-O-β-glucopyranoside (9) 5,6-dihydroxyflavone 6-O-(6″-O-glucopyranosyl)-β-glucopyranoside (hottonioside A) (10), 5,2′-dihydroxyflavone (11), 5,6-dihydroxyflavone (12), 5,7-dihydroxyflavone (chrysin) (13), apigenin 7-O-(2″-O-β-glucuronide)-β-glucopyranoside (14), kaempferol 3-O-(6″-O-α-rhamnopyranosyl)-β-glucopyranoside (nicotiflorin) (15), kaempferol-3-O-(6″-O-β-xylopyranosyl)-β-glucopyranoside (16), kaempferol (17), quercetin 3-O-(6″-O-β-xylopyranosyl)-β-glucopyranoside (18), and quercetin 3-O-(6″-O-α-rhamnopyranosyl)-β-glucopyranoside (rutin) (19) (see Figure 1 and Figure 2). Moreover, evidence of the structures of compounds 9, 10, 14 was discovered for the first time. Notably, compounds 16 and 18 were characterized in meticulous detail for the first time.

2.1. Determination of Isolated Compounds 8–19

The chemical structures of compounds 8–19 were elucidated by their UV, HRMS spectrum, similarity with the retention times of commercial standards, and 1H and 13C NMR data, as well as through 2D NMR correlation experiments. The ultraviolet spectra of compounds 15–19 showed similar absorption bands at maxima of 253–268 and 350–368 nm, indicating a C3-O-X-free or substituted flavonol backbone. The values of the band maxima in the others suggest a lack of substitution at C-3, whereas differences in the values demonstrate the varying degree of oxidation of the A and B rings of flavone [13]. The analysis of the HRMS spectra of compounds 9, 10, 14, 15–16, and 18–19 showed the loss of neutral fragments, such as M-132, M-146, M-162, and M-174 m/z, representing pentose, deoxy-hexose, hexose, and uronic acid, which indicates the glycosidic nature of these compounds. More detailed information was provided by an in-depth analysis of correlated spectral and spectroscopic data of selected compounds.

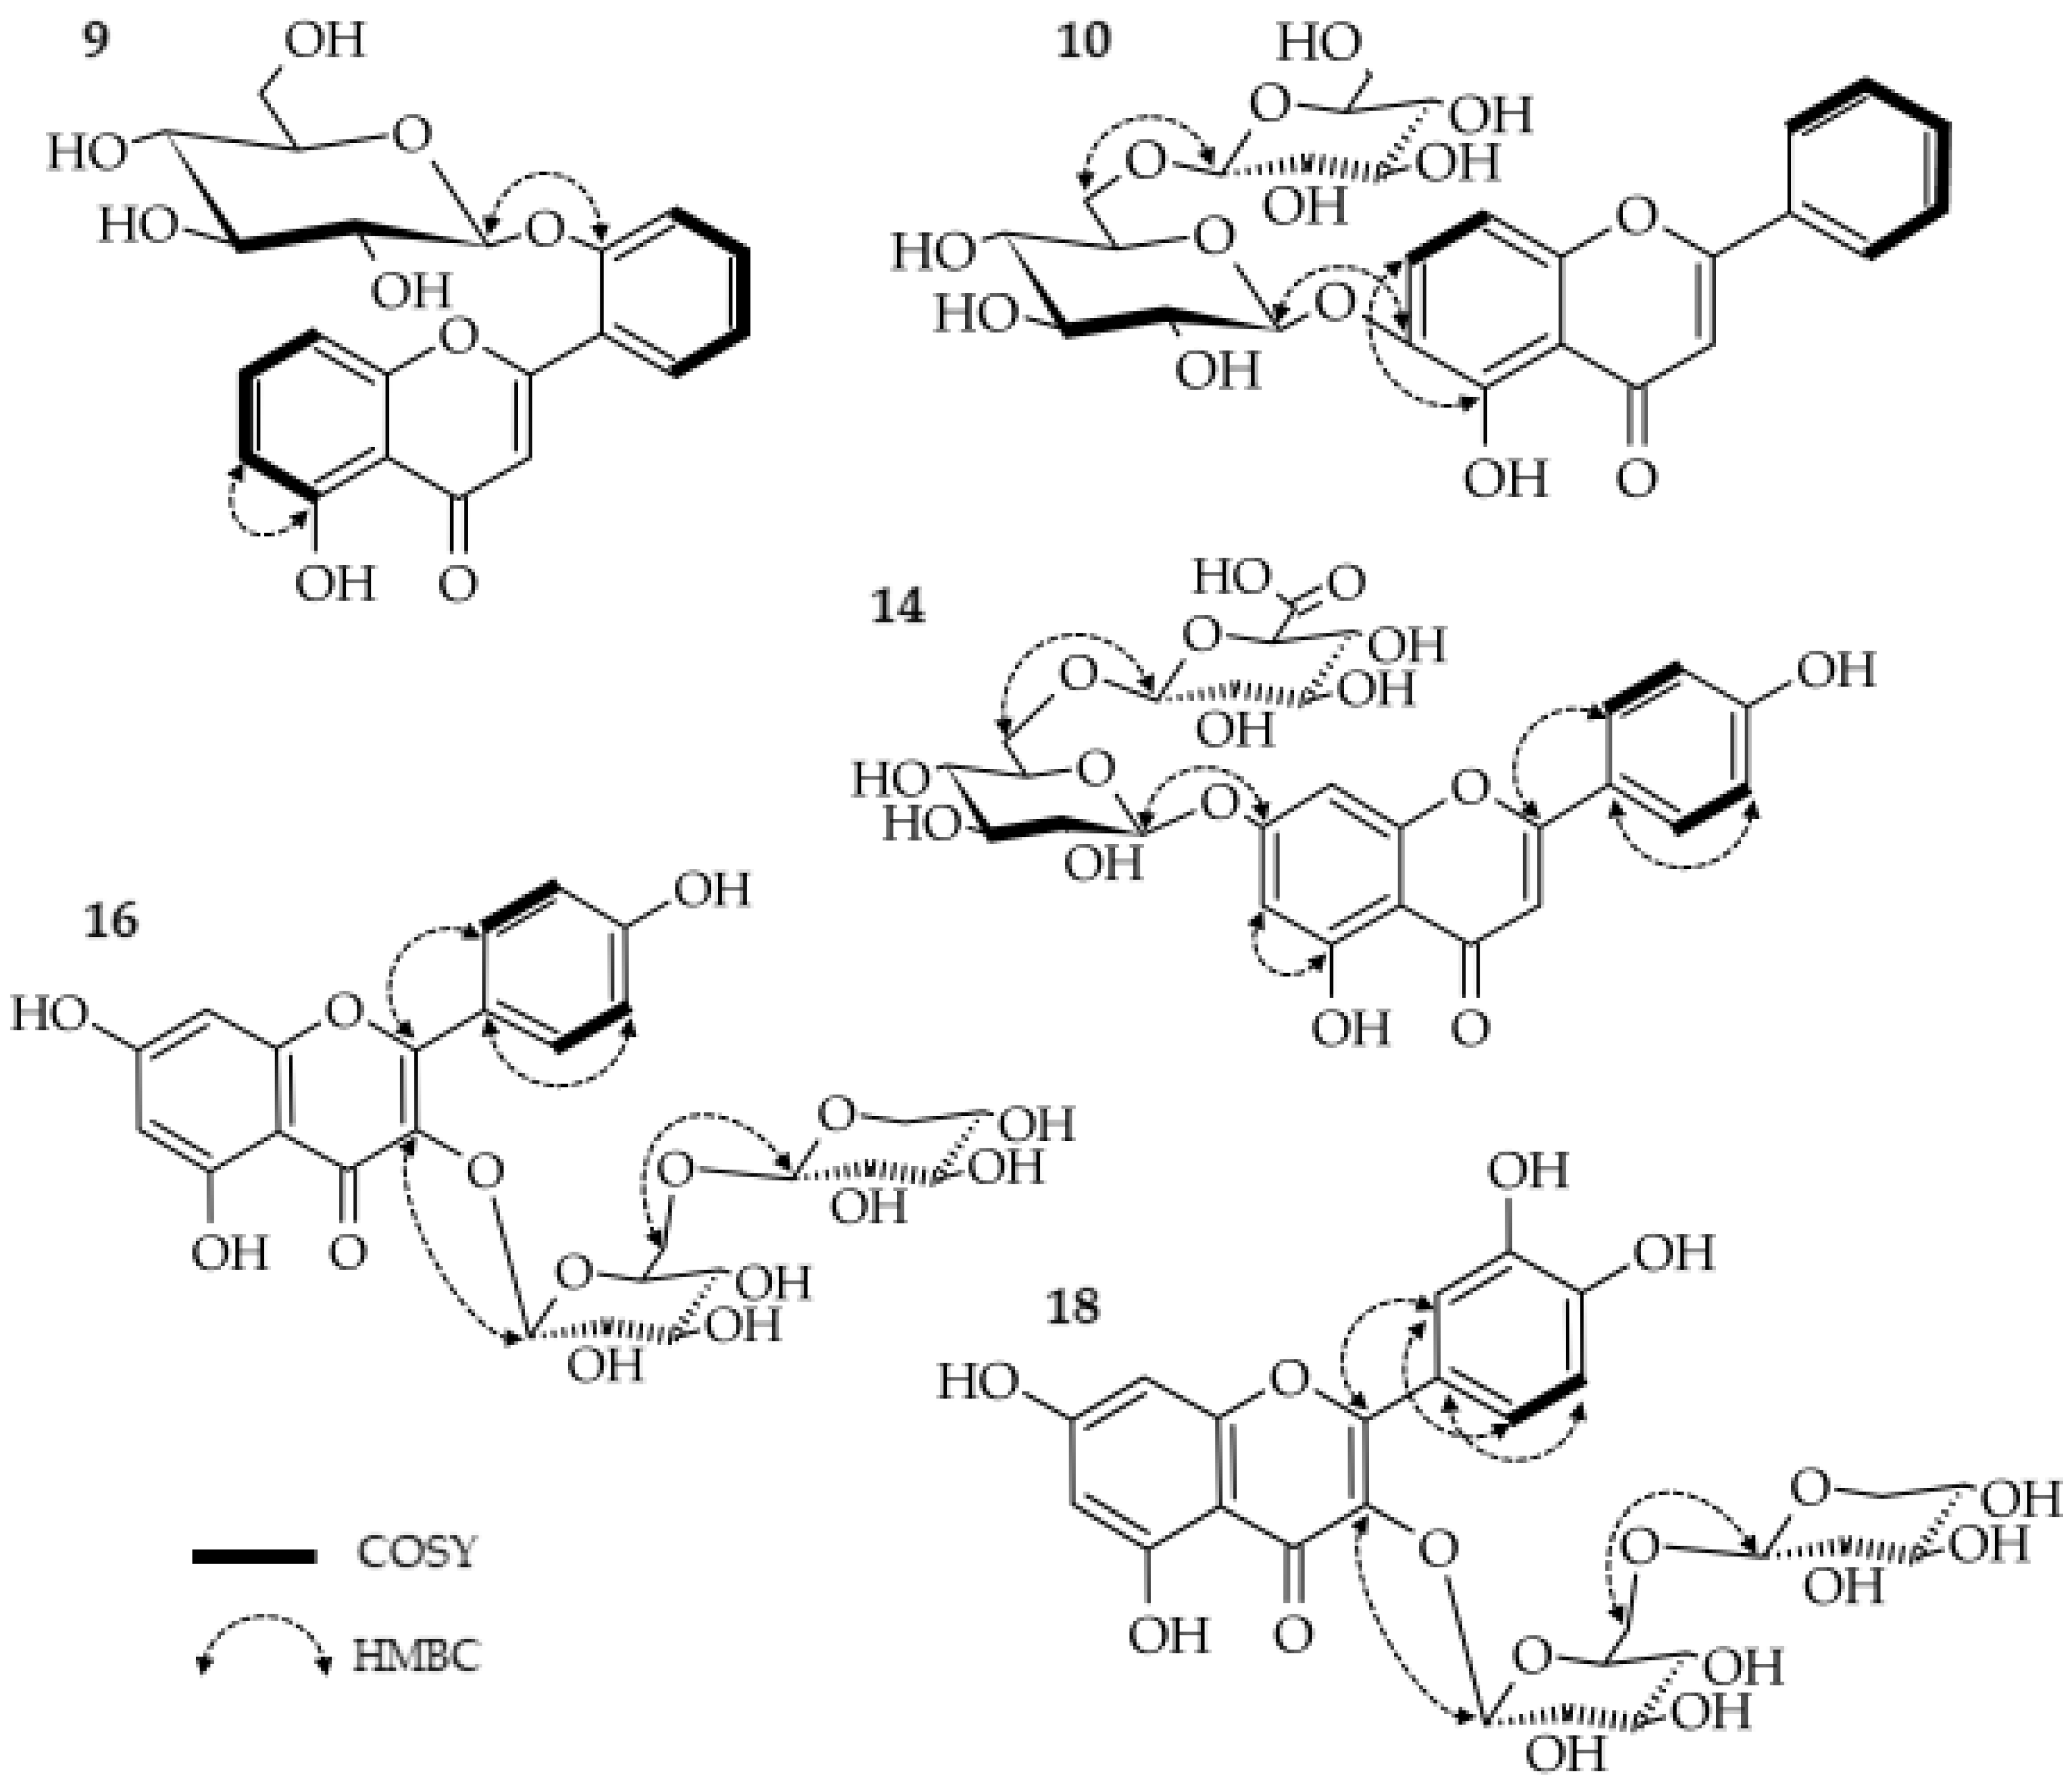
2.1.1. 5,2′-Dihydroxyflavone 2′-O-β-glucopyranoside (9)

Compound 9 was obtained as a white, amorphous powder. Its molecular formula was determined to be C21H20O9 by 13C NMR, and the pseudomolecular ion m/z 417.1187 [M+H]+ was recorded (see Figures S1 and S2). The 1H NMR displayed typical signals for flavones, such as olefinic δH = 7.16, which corresponded to a C-3 value of δC = 110.78 [14], as well as a recorded UV spectrum (see Figures S3 and S4). The 1H NMR spectrum showed a downfield signal at δH = 12.71, which could be attributed to a C-5 hydroxyl group (see Figure S3). The correlation of protons in COSY confirmed substitution at the C-5 positions in ring A, as well as at C-2′ in ring B (see Figure S5). The assignment of protons attached directly to carbons was carried out based on HSQC (see Figure S6). Furthermore, an anomeric proton signal at δH = 5.13, (d, J = 7.03 Hz) suggested the presence of a sugar residue with a β-configuration. This was confirmed to be glucose when 9 was subjected to acid hydrolysis. The HMBC correlation supported the presence of a glycosidic bond by correlating the anomeric proton with C-2′ (δC = 155.63) (see Figure 3 and Figure S7). On the basis of the foregoing studies, the structure of 9 was established as 5,2′ -dihydroxyflavone 2′-O-β-glucopyranoside. To the best of the authors’ knowledge, the structure is new and has not yet been characterized in the literature. The NMR data are provided in Table 1.

2.1.2. 5,6-Dihydroxyflavone 6-O-(6″-O-β-glucopyranosyl)-β-glucopyranoside (hottonioside A) (10)

Compound 10, obtained as a yellow, amorphous powder, gave HRMS and 13C NMR spectra indicating the formula C27H30O14 (see Figures S8 and S9). The mentioned compound exhibited ultraviolet absorption at 279, 310sh (shift), and 345 nm (see Figure S10) and showed a pseudo-molecular ion at m/z 579 [M+H]+ and ions at m/z 417 [M+H-162]+ and m/z 255 [M+H-162-162]+, which suggests the existence of two hexoses. These conclusions were proved by an investigation of the hydrolysis products. The presence of glucose and aglycon corresponding to compound 11 was confirmed. The 1H NMR displayed typical signals for flavones, such as olefinic δH = 7.03, which corresponded to a C-3 value of δC = 104.97 [14]. It is noteworthy that the proton spectrum lacks a signal for H-6, and the signals of H-7 and H-8 are shifted downfield. However, a hydroxyl group connected to C-5 is present (δH = 12.73, s) (see Figure S11). The COSY analysis confirmed a lack of substitution in the B ring (see Figure S12). Directly attached protons were assigned using HMQC (see Figure S13). The glycosylation link of both glucosyl units was determined using an HMBC experiment, which showed a cross-peak between the H-1″ doublet (δH = 4.92, J = 6.53 Hz) and the C-6 carbon (δC = 140.59). The second unit was based on a cross-peak between the H-1′″ doublet (δH = 4.2, J = 7.78 Hz) and the C-6″ carbon (δC 68.76), forming a gentiobiose moiety (see Figure 3 and Figure S14). In summary, this precise analysis of the ultraviolet and mass spectra, as well as one and two-dimensional NMR data, provides sufficient evidence to establish compound 10 as 5,6-dihydroxyflavone 6-O-(6″-O-β-glucopyranosyl)-β-glucopyranoside or 5,6-dihydroxyflavone 6-O-gentobioside as a new natural product named hottonioside A. Detailed data from the NMR experiments are provided in Table 1.

2.1.3. Apigenin 7-O-(2″-O-β-glucuronide)-β-glucopyranoside (14)

Compound 14 was obtained as a light-brown, amorphous powder. The HRMS showed an [M−H] pseudomolecular ion at m/z 607.13. The 13C NMR and HRMS data suggested a molecular formula of C27H28O16 (see Figures S15 and S16). The UV spectrum (270, 332 nm) indicates that the compound belongs to the flavone family (see Figure S17), while the MS data revealed the presence of a serially O-substituted aglycone m/z 271, [M+H-338]+ with a glycosyl moiety. The product of hydrolysis proved the presence of glucose and glucuronic acid, as well as apigenin. The 1H NMR and COSY spectra exhibited signals characteristic for apigenin, as well as signals of two anomeric protons (δH = 5.2, d, J = 7.03 Hz; δH 4.55, d, J = 7.78 Hz) (see Figure S18 and S19). The presence of the second carbonyl group confirmed the presence of a uronic acid moiety by a signal at 170.67 ppm in the 13C NMR spectrum (see Figure S18). Directly attached protons were assigned using HMQC (see Figure S20). The glycosylation position was determined by the HMBC experiment, which revealed a glucose cross-peak between the H-1″ doublet (δH = 5.2) and the C-7 carbon (δC = 162.76). The glucuronic acid linkage was established based on the cross-peak between the H-1′″ doublet (δH = 4.55) and the C-2″ carbon (δC = 82.74) (see Figure 3 and Figure S21). In summary, the obtained data provide sufficient evidence to establish compound 14 as the first reported apigenin 7-O-(2″-O-β-glucuronide)-β-glucopyranoside. Detailed data from the NMR experiments are given in Table 1.

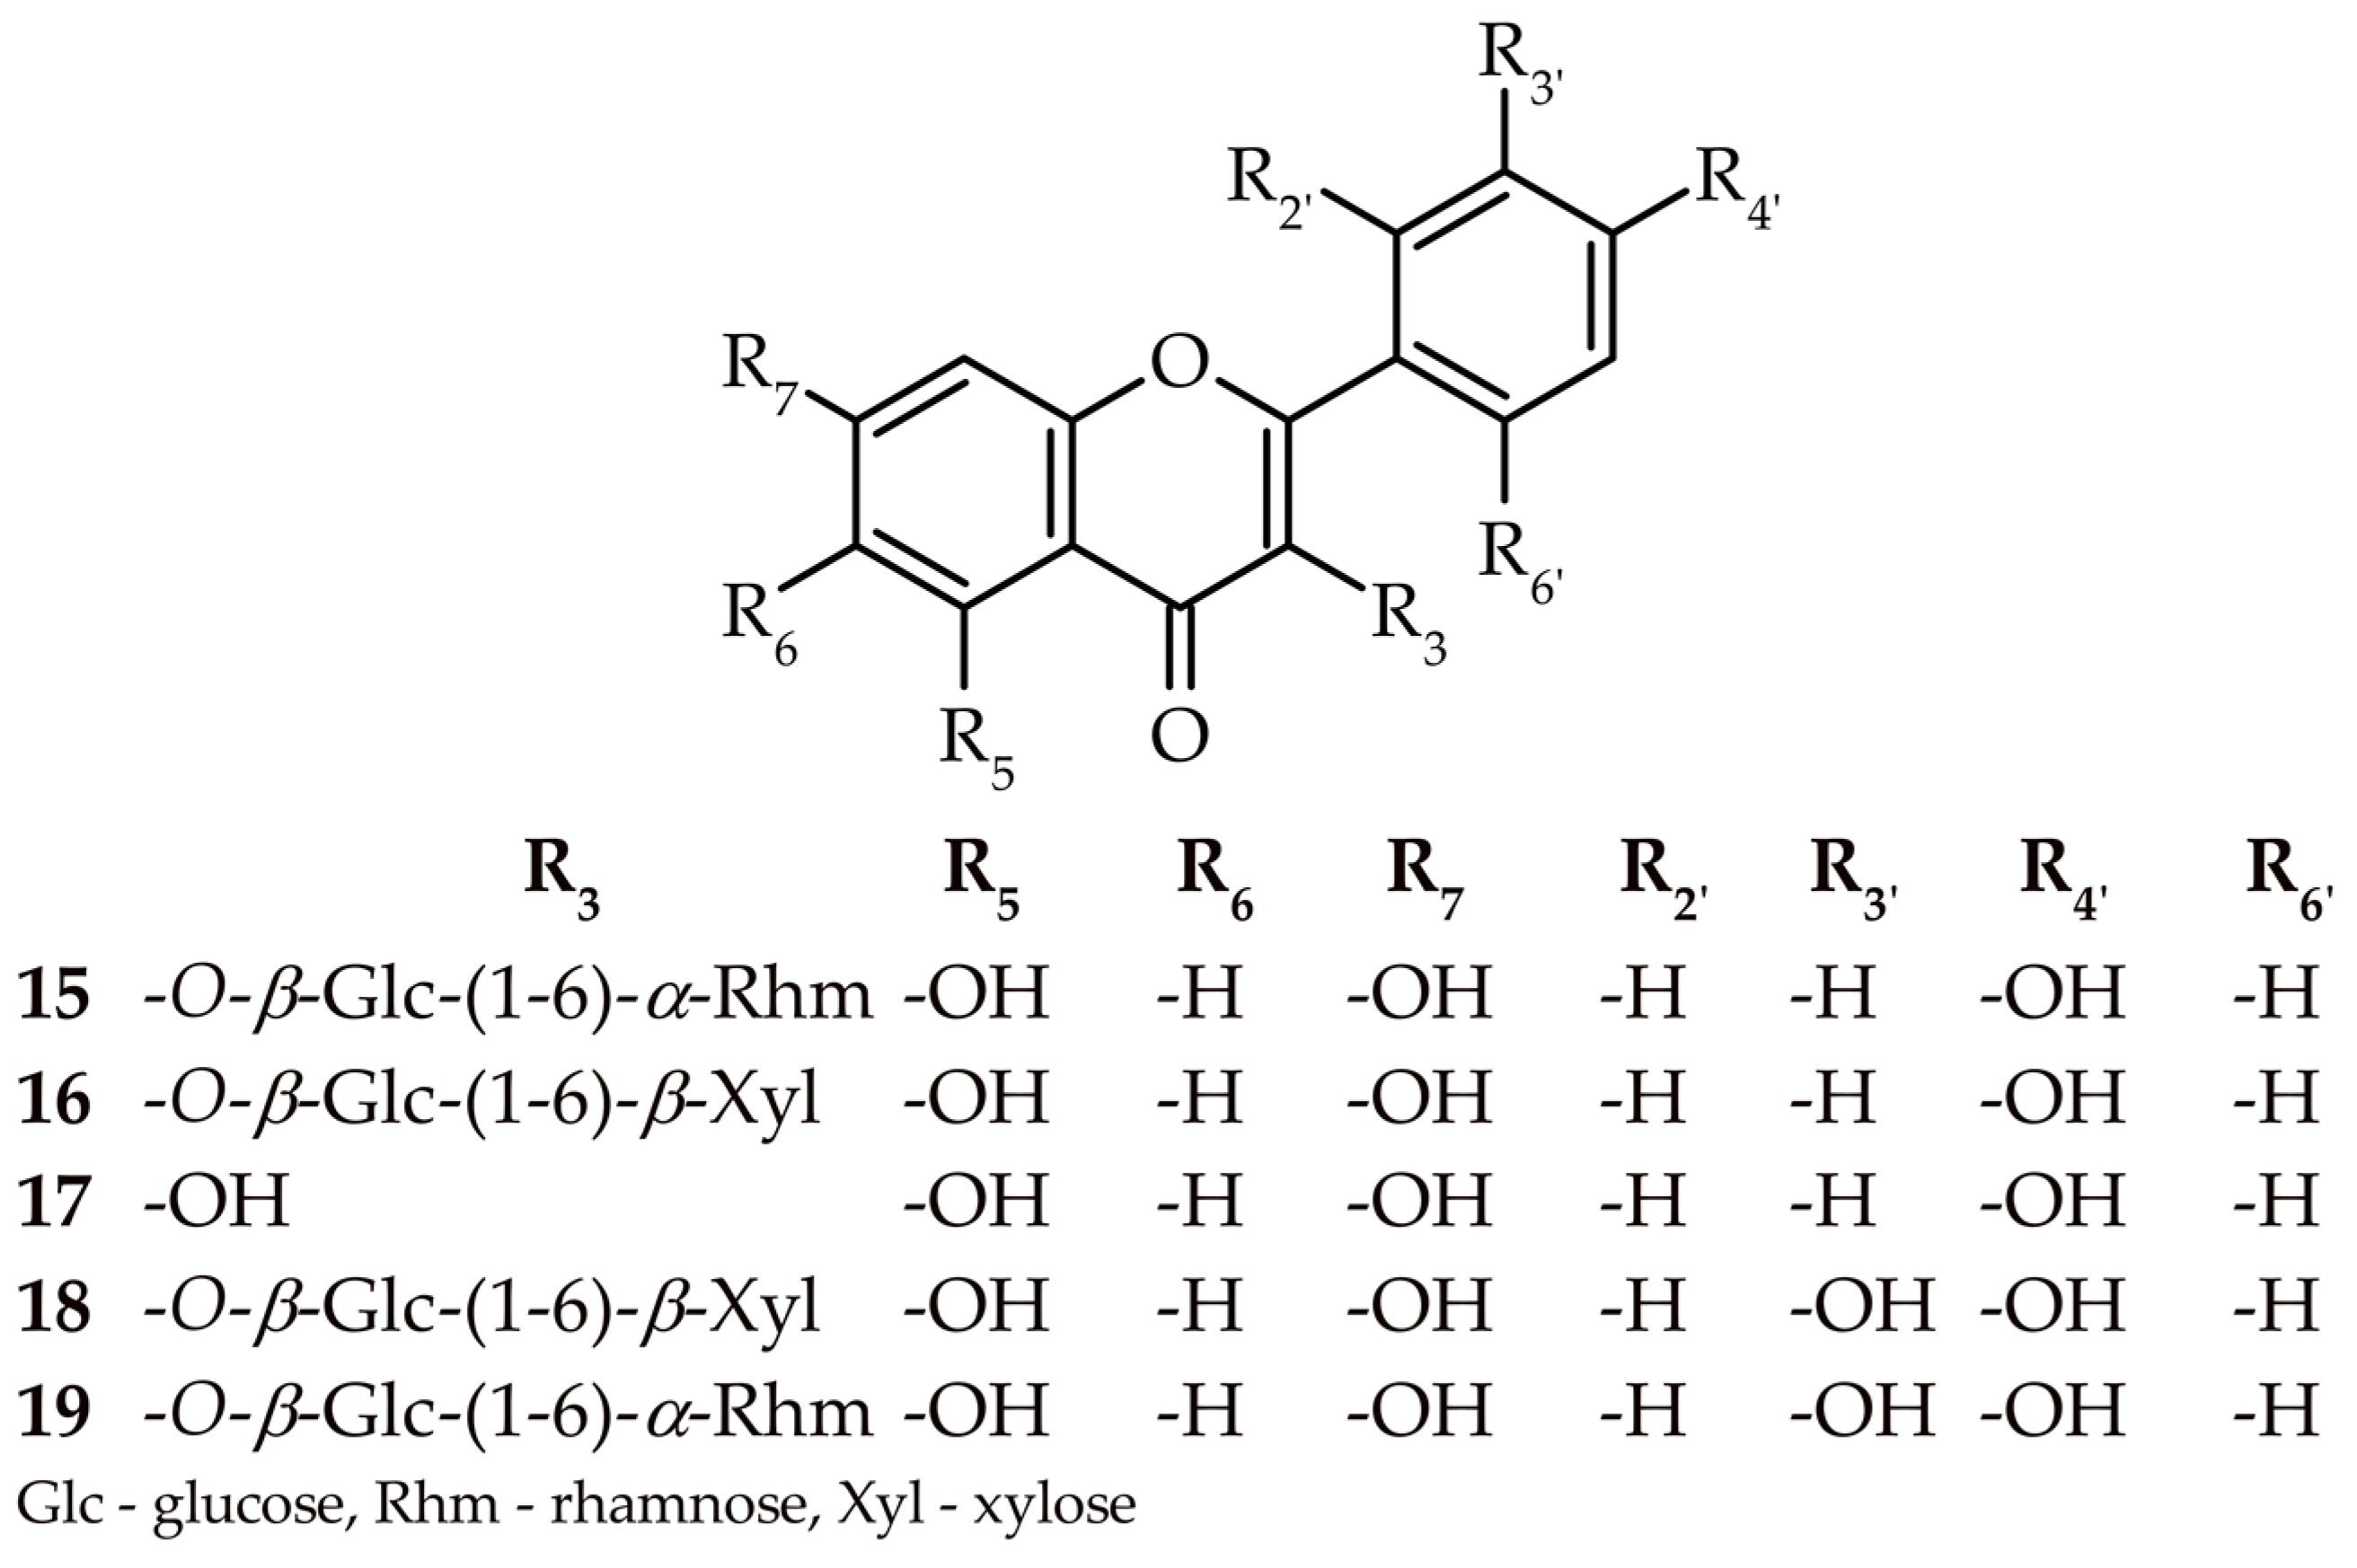
2.1.4. Kaempferol 3-O-(6″-O-β-xylopyranosyl)-β-glucopyranoside (16)

Compound 16 was obtained as a yellow, amorphous powder. The HRMS showed an [M−H] predominant ion at m/z 579.1358. The HRMS and 13C NMR data suggested a molecular formula of C26H28O15 with a mass difference of 0.6 ppm (see Figures S22 and S23). The UV spectrum (268, 351 nm) indicates that this compound belongs to the flavonol family (see Figure S24). Examination of the hydrolytic degradation products yielded glucose and xylose moieties, as well as kaempferol as aglycone. The proton spectrum confirmed signals corresponding to the suspected flavonol [13] and two doublets from the anomeric protons of the attached sugars (δH = 5.37,d, J = 7.53 Hz; δH = 4.00, d, J = 7.28 Hz). Finally, the value of the coupling constant indicated that the glycosides were β-anomers (see Figure S25). The protons assigned using COSY and HMQC confirmed the above conclusions (see Figure 3, Figures S26 and S27). The glycosylation link of glucose was determined by an HMBC experiment, which showed a cross-peak between the H-1″ doublet (δH = 5.37) and the C-3 carbon (δC = 133.69). The attachment of xylose was determined by a cross-peak between the H-1″’ doublet (δH = 4.00) and the C-6″ carbon (δC = 68.35) (see Figure S28). After evaluation of the 1D and 2D NMR spectra, compound 16 was established as kaempferol 3-O-(6″-O-β-xylopyranosyl)-β-glucopyranoside. The molecule deduced from the data had already been discovered, but the erroneous [15] and incomplete data encouraged the current authors to characterize it accurately (Figures S22–S28 and Table 1).

2.1.5. Quercetin 3-O-(6″-O-β-xylopyranosyl)-β-glucopyranoside (18)

Compound 18, obtained as yellow, amorphous powder, was characterized by a UV spectrum that is typical for flavonols (258, 300sh, 359 nm) [13] (see Figure S29). The analysis of the 13C NMR and HRMS spectra permitted the determination of the molecular formula C26H28O16 (see Figures S30–S31). The proton spectrum confirmed the presence of signals that, according to the literature, correspond to quercetin [13]. In the spectrum, the two visible doublets in the low chemical field (δH = 5.37, d, J = 7.28 Hz; δH = 4.01, d, J = 7.28 Hz) suggested the presence of two sugar molecules linked by bonds in the β-configuration (see Figure S32). An analysis of the hydrolytic degradation products also confirmed the presence of quercetin, glucose, and xylose. Protons directly attached to the carbons were assigned by COSY and HMQC analyses (see Figures S33 and S34). The manner of attachment of sugars was carried out using the HMBC correlation. The cross-peak visible in the spectrum between the H-1″ doublet (δH = 5.37) and the C-3 carbon (δC = 133.69) points out the attachment of a glucose molecule. The binding of the xylosyl unit was based on the cross-peak between the H-1″ doublet (δH = 4.00) and the C-6′ carbon (δC = 68.35) (see Figure 3 and Figure S35). All data presented above indicate that compound 18 is quercetin 3-O-(6″-O-β-xylopyranosyl)-β-glucopyranoside.

2.2. Evaluation of H. palustris Metabolome

2.2.1. Qualitative LC-PDA-HRMS Analysis of H. palustris Extracts and Fractions

To understand the metabolome of H. palustris, extracts with a wide range of polarities were analyzed, as well as fractions characterized by the selective accumulation of specific groups of compounds. The LC-PDA-HRMS analysis revealed the presence of 31 compounds attributed to two main groups: flavonoids and triterpenes. Extremely non-polar extracts (HP6–HP8) were characterized by the presence of mainly methoxylated 5-hydroxyflavone derivatives (P22–23, P25–26, P28), monohydroxyflavone (P27), and dihydroxyflavones (P18, P20, P24), particularly in sugar combinations (P12). Extracts with moderately polar and polar properties were rich sources of flavones (P2, P9–10) and flavonol (P1, P3–8) diglycosides with a small representation of their free forms (P11, P13–14). In addition, a diketone representative (P29), dibenzoylmethane, was found, as well as significant compounds with high retention to a non-polar phase with unassigned identity (P30–31). Triterpene compounds (P15–17, P19), which are characteristic chemophenetic markers of the Primulaceae family, were also detected through the use of a mass spectrometer. Detailed chromatographic data are shown in Table 2 and Figures S37–S44 in the Supplementary Material.

2.2.2. Quantitative Characteristics (TPC, TFC, TPAC, TTC) of H. palustris Extracts and Fractions

Except for compounds detected using the LC-MS method, other phytoconstituents and their synergic actions may be responsible for the biological activity of extracts and fractions from H. palustris. The total contents of phenolic (TPC), flavonoid (TFC), phenolic acids (TPAC), and tannins (TTC) are presented in Table 3. The total phenolic content of H. palustris extracts and fractions (HP1–HP8) varied from 12.44 (HP3) to 67.81 (HP4) mg Peq/g, while the TFC ranged from 1.62 (HP3) to 9.23 (HP6) mg Leq/g. Based on these values, HP6 (3.03 mg CAeq/g) and HP7 (3.48 mg CAeq/g) contained the highest total phenolic acid contents, while the total tannin content was elevated in HP5 (5.40 mg Peq/g).

2.3. Assessment of the Antioxidant and Acetylcholinesterase Inhibiting Activities

The need to assess the antioxidant potential of natural products is well documented. Such measurements were conducted to moderate the effects of oxidative stress in the surrounding healthy cells, leading to the amplification of pathological processes. Furthermore, the protective roles of chelator agents against the development of neurodegenerative disease have been reported previously [16,17]. The antioxidant capacity of the samples was evaluated via four different methods, including radical scavenging (DPPH, ABTS), reducing power (CUPRAC), and metal chelating (FRAP) assays (Table 4 and Table 5).
Based on the scores outlined in Table 4, HP3 and HP8 were shown to possess the lowest antioxidant activity with all tested methods. Among the tested compounds, 12, 18, and 19 were found to be the leading antiradical agents, while 1–5 and 7 exhibited the lowest antioxidant activity. It is worth noticing that compounds 1–7 were included in this study to assess qualitative content and anti-acetylcholinesterase or antioxidant potentials [7].
These results can be understood as demonstrating the compounds with high total phenolic/flavonoid contents in extracts and fractions. Moreover, the limitation of the antioxidant potential of all tested compounds can be related to the methylation of the hydroxyl group in the flavonoid B-ring, as shown in compounds 1–5 and 7. These conclusions are supported by previously reported research and available literature data [18,19].
In recent times, the involvement of enzyme inhibition in human diseases has been considered one of the most accessible therapeutic strategies in illness therapy. This aspect makes acetylcholinesterase inhibitors the principal class of drugs used for the treatment of Alzheimer’s disease (AD), among which galantamine (IC50 = 91.23 ± 0.52 µg/mL) is the only naturally occurring substance. At this point, there is growing interest in the use of plant-based natural enzyme inhibitors to avoid the side effects of available treatments [20]. The acetylcholinesterase (AChE) inhibitory activity of H. palustris and its main metabolites is reported in Table 4 and Table 5. The extracts and fractions were graded from the strongest to the weakest, as follows: HP2 > HP8 > HP7 > HP1 > HP6 > HP4. HP3 and HP5 showed no significant inhibitory activity, probably because they have the lowest levels of methoxylated flavonoids. All nineteen compounds exhibited restrained anti-acetylcholinesterase activity. The greatest activity of all compounds isolated from H. palustris was observed in compound 1 (IC50 = 144.83 ± 1.30 µM). In the available literature data, the determination of the structure–activity relationship for flavonoids is complicated due to their diverse chemical structures. For example, some studies imply that methylation of the hydroxyl group at C4′ and the presence of a 7-O-sugar moiety are crucial for AChE inhibition [21,22]. The demonstrated strong biological activity of HP1-HP7 correlates with the activity of individual compounds (1–19) present in the analyzed fractions and extracts. The identification of apigenin 7-O-(2″-O-β-glucuronide)-β-glucopyranoside apigenin (14) showed its dominant content in HP3 and HP5 fractions. In the HP2 fraction, the dominant compounds are rutinosides of quercetin (19) and kaempferol (15). In addition, kaempferol (17) presents in many fractions and extracts and cannot be overlooked for the demonstrated biological activity. In the case of the HP4 fraction, the effect may also depend on the presence of kaempferol 3-O-(6’-O-β-xylopyranosyl)-β-glucopyranoside (16) and the dominant nicotiflorin (15). For HP1 and HP8, the effect is probably the result of the entire metabolite complex, although HP1 is characterized by compounds such as kaempferol (17), zapotin (8), 5-hydroxy-2’-methoxyflavone (3), and the diketone-1,3-diphenylpropan- 1,3-dione (1). The HP6 and HP7 extracts can be characterized as a mixture of methoxyflavones, where zapotin (8), 5-hydroxy-2’-methoxyflavone (3), and 1,3-diphenylpropane-1,3-dione (1) can be considered the most biologically active compounds.

3. Materials and Methods

3.1. Chemicals and General Experimental Procedures

Comprehensive descriptions of the reagents used in the extraction, isolation, and identification processes, as well as in the evaluation of the antioxidant potential and acetylcholinesterase inhibition, are included in the Supplementary Materials. Notably, the aglycone standards used for the hydrolytic decomposition product and LC-MS analysis, apigenin, kaempferol, and quercetin (purity > 96%), were isolated from the leaves and flowers of Arctium tomentosum Mill. (Asteraceae) [23]. Compounds: 1,3-diphenylpropane-1,3-dione (1), 5-hydroxyflavone (2), 5-hydroxy-2′-methoxyflavone (3), 5-hydroxy-2’,6’-dimethoxyflavone (4), 5-hydroxy-2’,3’,6’-trimethoxyflavone (5), 2’,5-dihydroxy-6-methoxyflavone (6), and 5,6′-dihydroxy-2′,3′-dimethoxyflavone (7) used for qualitative HPLC analysis and evaluation of acetylcholinesterase inhibition have been isolated from the petrol extract of H. palustris herb (purity > 98%, HPLC) [7].

3.2. Plant Materials

According to our previous studies [7], the plant material consisted of leafy stems of Hottonia palustris L. (HP) (Primulaceae), collected without crawling roots or flowers (Podlasie, Poland; GPS: 53°17′13.2″ N, 22°53′42.0″ E). The species was authenticated based on the literature [8]. A voucher specimen (No. HP-17040) was deposited in the plant collection of the Department of Pharmacognosy, Medical University of Białystok, Poland.

3.3. Preparation of Extracts and Isolation Procedure

3.3.1. Extraction

After purification in a Soxhlet apparatus and the collection of petrol (HP6) and chloroform (HP7) extracts and the chloroform fraction (HP8) [7], air-dried parts of H. palustris were extracted with solvents of increasing polarity. The freeze-dried part of the aqueous residue was dissolved and then fractionated by liquid–liquid extraction with ethyl acetate (75 × 250 mL) and butan-1-ol (110 × 250 mL). The combined organic layers were evaporated to dryness to yield 10.5 g of ethyl acetate residue (HP4), 76 g of butan-1-ol residue (HP5), and aqueous residue. Afterwards, to isolate the phenolics, the HP4–HP6 residues were purified. Ultrasound-assisted extraction was used to prepare crude extracts: methanolic (HP1), 50% methanolic (HP2), and aqueous (HP3). Powdered plant parts (15 g) were etched with a proper solvent five times (temperature below 40 °C). Then, the combined portion of the extract was centrifuged, filtered, and evaporated to dryness under a vacuum. Finally, residues were suspended in water and then frozen and lyophilized.

3.3.2. Isolation Using the MPLC and HPLC Techniques

The HP8 extract (7 g) was dissolved in the necessary volume of methanol:DMSO solution (9:1) and then fractionated on a self-packed SPE column with C18-modified silica gel. Elution was performed with a water–methanol mixture in 4 steps (25%, 50%, 75%, and 100% methanol, 300 mL per step). Based on the HPLC analysis, fraction 3 (75%) was selected for isolation by the preparative HPLC technique. This process provided the following compounds: 10 (60 mg, tR = 6.5–7 min), 9 (55 mg, tR = 8.75–9.25 min), 12 (12 mg, tR = 9.75–10.25 min), 13 (14 mg, tR = 10.75–11.25 min), 8 (120 mg, tR = 12–13.75 min), and 11 (19 mg, tR = 20.75–21.25 min). In a subsequent step, the obtained eluate was reduced under vacuum and recrystallized (water:ethanol (5:95, v/v)). The HP5 fraction was dissolved in a mixture of 10% methanol and then subjected to a self-packed C18 SPE column (25 g). Elution was carried out with a mixture of water (A) and methanol (B), with the B content increasing in steps (10–100% B, 200 mL per step). Based on the HPLC analysis, the combined fractions of 2–3 (20–30%) constituted a homogeneous component of 14 (108 mg) with >98% HPLC purity. After being eluted out in succession, fractions 4–5 (40–50%) were combined and selected for further purification using preparative HPLC. Pooled eluates were evaporated from residual organics and lyophilized to yield homogeneous compounds labeled compounds 18 (23 mg, tR = 25–26 min), 19 (45 mg, tR = 27.75–29 min), 16 (58 mg, tR = 30.75–32 min), and 15 (47 mg, tR = 35–36.5 min). The elution time windows of the compounds and their yields (mg) are shown in Figure 4.

3.3.3. Hydrolysis of the Glycosides

Acid hydrolysis was performed as previously described by Mabry [13] with the following modifications. Samples of the glycosides were refluxed under acidic conditions for 2–6 h instead of 1 h. Subsequently, HCl (hydrochloric acid) residue was removed under a vacuum by adding portions of methanol. The aqueous residue was extracted three times with diethyl ether, dried under anhydrous Na2SO4 (sodium sulfate), evaporated, and analyzed as a methanolic solution along with the aglycone standards apigenin, kaempferol, and quercetin [23] by LC-PDA-MS. The aqueous layer was evaporated to dryness, and the residue was dissolved in methanol and analyzed with monosaccharide and uronic acid standards by cellulose TLC (thin-layer chromatography) (ethanol:ammonia:water, 20:1:4, v/v; derivative agent: aniline phthalate spray solution). The values of monosaccharide spots were observed as retention factors (Rfs) after aniline phthalate derivatization (110 °C, 10 min) as follows: L-arabinose, Rf = 0.48; D-xylose, Rf = 0.63; D-galactose, Rf = 0.34; D-glucose, Rf = 0.45; L-rhamnose, Rf = 0.77; glucuronic acid, Rf = 0.3; and galacturonic acid, Rf = 0.1.

3.4. Elucidation of Chemical Structure of Compounds 8–19

5,6,2’,6’-tetramethoxyflavone (zapotin) (8): grayish white, matte crystals, UV λmax nm: 231, 258.7sh (shift), 327; +NaOMe: 237, 258.7sh, 327; +AlCl3: 230, 258sh, 328 nm; +NaOAc: 228, 265sh, 325; +H3BO3: 230, 263sh, 324. HPLC Rt min = 57.06. HRMS m/z = 344.1251 [M+H]+ (calculated for C19H18O6), difference = −1.01 ppm. Purity 98% by HPLC. The 1H-NMR and 13C-NMR results agree with the data provided in the literature [24].
5,2′-Dihydroxyflavone 2′-O-β-glucopyranoside (9): white, amorphous powder, (mp.: 259, 1–262 °C); [α]D: −34 (DMSO; c = 0.1); UV λmax nm: 268, 326; +NaOMe: 274, 308sh, 386; +AlCl3: 284, 329, 489; +NaOAc: 267, 325; +H3BO3: 268, 325. HPLC Rt min = 48.87. HRMS m/z = 417.1187 [M+H]+ (calculated for C21H20O9), difference = 1.81 ppm. Purity 98% by HPLC. Predicted acidic pKa = 8.75; logP = −0.26 and logS = −3.84. The NMR data are provided in Table 1 and Figures S1–S7.
5,6-Dihydroxyflavone 6-O-(6″-O-β-glucopyranosyl)-β-glucopyranoside (hottonioside A) (10): yellow, amorphous powder, (mp.: 178–179,5 °C); [α]D: −66,18 (DMSO; c = 0.1); UV λmax nm: 279, 310sh (shift), 345; +NaOMe: 280, 329sh, 391; +AlCl3: 301, 332sh, 408 nm; +NaOAc: 279, 308sh, 350; +H3BO3: 278, 308sh, 342. HPLC Rt min = 44.11. HRMS m/z = 577.1561 [M−H] (calculated for C27H30O14), difference = 0.11 ppm. Purity 98% by HPLC. Predicted acidic pKa = 9.09; logP = −2.38 and logS = −3.36. The NMR data are provided in Table 1 and Figures S8–S14.
5,2′ -Dihydroxyflavone (11): pale-yellow needle crystal, UV λmax nm: 268, 340; +NaOMe: 248, 267sh, 398; +AlCl3: 278sh, 289, 349, 383; +NaOAc: 266, 346, 405; +H3BO3: 268, 340. HPLC Rt min = 66.27. HRMS m/z = 255.0506 [M−H] (calculated for C15H10O4), difference = 1.25 ppm. Purity 98% by HPLC. The 1H-NMR and 13C-NMR results agree with the data provided in the literature [25,26,27,28].
5,6-Dihydroxyflavone (12): yellow, amorphous powder, UV λmax nm: 283, 359; +NaOMe: 298, 416; +AlCl3: 306, 335sh, 425; +NaOAc: 284, 380; +H3BO3: 284, 380. HPLC Rt min = 54.54. HRMS m/z = 253.0506 [M−H] (calculated for C15H10O6), difference = 2.21 ppm. Purity 98% by HPLC. For NMR spectral data, see [29].
5,7-Dihydroxyflavone (chrysin) (13): yellow, amorphous powder, UV λmax nm: 247sh (shift), 268, 313; +NaOMe: 287, 262sh, 278, 361; +AlCl3: 250, 279, 331, 380; +NaOAc: 278, 360; +H3BO3: 269, 315. HPLC Rt min = 54.9. HRMS m/z = 253.0511 [M−H] (calculated for C15H10O4), difference = 2.03 ppm. Purity 98% by HPLC. For NMR spectral data, see [30].
Apigenin 7-O-(2″-O-β-glucuronide)-β-glucopyranoside (14): light-brown, amorphous powder, (mp.: 219–221 °C); [α]D: −56,53 (DMSO; c = 0.1); UV λmax nm: 270, 332; +NaOMe: 271, 305, 343sh, 385; +AlCl3: 277, 300, 347, 385; +NaOAc: 269, 345, 394; +H3BO3: 270, 336. HPLC Rt min = 19.87. HRMS m/z = 607.13 [M−H] (calculated for C27H28O16), difference = −0.49 ppm. Purity 98% by HPLC. Predicted acidic pKa = 2.98; logP = −2.26 and logS = −3.04. The NMR data are provided in Table 1 and Figures S15–S21.
Kaempferol 3-O-(6″-O-α-rhamnopyranosyl)-β-glucopyranoside (nicotiflorin) (15): yellow powder UV λmax nm: 267, 350; +NaOMe: 276, 327sh, 401; +AlCl3: 275, 305sh, 353, 398; +NaOAc: 275, 304sh, 369; +H3BO3: 267, 353. HPLC Rt min = 35.11. HRMS m/z = 593.1514 [M−H] (calculated for C27H30O15), difference = 0.39 ppm. Purity 98% by HPLC. The 1H-NMR and 13C-NMR results agree with the data provided in the literature [31].
Kaempferol-3-O-(6″-O-β-xylopyranosyl)-β-glucopyranoside (16): yellow, amorphous powder, UV λmax nm: 268, 351; +NaOMe: 276, 328sh, 402; +AlCl3: 276, 306sh, 353sh, 400; +NaOAc: 275, 305sh, 376; +H3BO3: 268, 353. HPLC Rt min: 29.56. HRMS m/z = 579.1356 [M−H] (calculated for C26H28O15), difference = 0.29 ppm. Purity 98% by HPLC. Predicted acidic pKa = 7.62; logP = −2.99 and logS = −2.68. The NMR data are provided in Table 1 and Figures S22–S28.
Kaempferol (17): yellow, amorphous powder, UV λmax nm: 253sh, 266, 322sh, 368; +NaOMe: 281, 321, 421; +AlCl3: 270, 305, 352, 425; +NaOAc: 273, 307,377; +H3BO3: 268, 324sh, 366. HPLC Rt min: 51.53. HRMS m/z = 285.0407 [M−H] (calculated for C15H10O6), difference = −0.12 ppm. Purity 98% by HPLC. The 1H-NMR and 13C-NMR results agree with the data provided in the literature [27].
Quercetin 3-O-(6″-O-β-xylopyranosyl)-β-glucopyranoside (18): yellow, amorphous powder, UV λmax nm: 258, 300sh, 359; +NaOMe: 273, 332sh, 411; +AlCl3: 275, 307sh, 338sh, 434; +NaOAc: 272, 327sh, 375; +H3BO3: 262, 297sh, 379. HPLC Rt min: 22.69. HRMS m/z = 595.1316 [M−H] (calculated for C26H28O16), difference = 2.29 ppm. Purity 98% by HPLC. Predicted acidic pKa = 7.62; logP = −3.28 and logS = −2.18. Purity 98% by HPLC. The NMR data are provided in Table 1 and Figures S29–S35.
Quercetin 3-O-(6″-O-α-rhamnopyranosyl)-β-glucopyranoside (rutin) (19): yellow, amorphous powder, UV λmax nm: 259, 300sh, 356; +NaOMe: 274, 331, 405; +AlCl3: 276, 305sh, 345sh, 427; +NaOAc: 271, 321, 369; +H3BO3: 264, 298, 375. HPLC Rt min: 25.57. HRMS m/z = 609.1460 [M−H] (calculated for C27H30O16), difference = 0.02 ppm. Purity 98% by HPLC. The 1H-NMR and 13C-NMR results agree with the data provided in the literature [31].

3.5. Conditions of Chromatographic Analysis

3.5.1. Sample Preparation

A sample of the crude plant extract (20 mg/mL), as well as an isolated compound (1 mg/mL) and standards (1 mg/mL), were dissolved in DMSO, centrifuged, and then filtered through a 0.2 µm PVDF membrane. Then, samples were diluted in the initial mobile (95:5, ultra-pure water:acetonitrile) phase (1:10, v/v). All samples were prepared just before analysis.

3.5.2. LC-PDA-HRMS Data Acquisition

The analysis was performed using a 1260 Infinity LC system consisting of a binary pump, a column oven, and a photo-diode array (PDA) detector combined with a 6230 LC/TOF mass spectrometer equipped with electrospray ionization (Agilent, Santa Clara, CA, USA). The autosampler was programmed to inject 5 µL of each sample. Separation of the analytes was carried out using a Kinetex XB-C18 (150 × 2.1 mm ID, 1.7 µm particle, batch No.: 5605-0180) column (Phenomenex, Torrance, CA, USA) guarded by a pre-column and maintained at 15 °C. The mobile phase ran at a flow rate of 0.2 mL/min with a run time of 110 min using the following gradient program (phase mobile A: ultra-pure water; phase mobile B: acetonitrile, both with 10 mM ammonia acetate buffer, pH 4.8): t = 0–3 min, 95:5; t = 10 min, 84:16; t = 38 min, 82:18; t = 45 min, 62:38; t = 72 min, 60:40; t = 100–103 min, 20:80 (mobile phase A:B), with a 7 min equilibration time. The PDA detector recorded spectra over a range of 190–600 nm, and the UV–Vis chromatogram was conducted at 270, 340, and 360 nm to match the values of the most intense absorption for polyphenols and methoxyflavones, flavones, and flavonols, respectively.
The ESI parameters were set as follows: a capillary voltage of 2.5 kV for negative mode with a nozzle voltage of 1 kV; a drying and sheath gas temperature of 350 °C; and a drying and sheath gas flow rate of 11 L/min. The nebulizer was set at 60 psi. The time-of-flight (TOF) MS was operated in high-resolution mode. The data were acquired over a mass range of m/z 120–1700. The Mass Hunter Qualitative Analysis 10.0 (Agilent, Santa Clara, CA, USA) software was used to complete and process the chromatographic data. Compounds were characterized based on the maxima observed in their UV–Vis spectra, as well as their MS spectra and retention times.

3.5.3. Preparative HPLC

The analysis was conducted using an LC 1260 Infinity system equipped with a 1260 FC-AS G1364C fraction collector. The system was operated under the control of Open Lab CDS 2.7 software (Agilent, Santa Clara, CA, USA). The separation was optimized on a Luna C18(2) (150 × 4.6 mm ID, 5 µm particle, batch No.: 5291-0217) column (Phenomenex, Torrance, CA, USA) guarded by a pre-column. Isolation was performed using a Luna C18(2) (150 × 10 mm ID, 5 µm particle, batch No.: 5291-0227) column (Phenomenex, Torrance, CA, USA) that was fitted with a pre-column. Parameters were scaled up according to the increase in the column diameter. The collection of fractions was carried out on the basis of fixed time windows considering the latency and threshold recorded at 280 and 340 nm. For the optimized separation of HP5, a two-step gradient was used: 0–5 min at 10% B, followed by 45 min at 20% B extended for equilibration. A flow rate of 0.6 mL/min was used. For the HP8 fraction, an isocratic of 45% B was used. In both cases, the mobile phase was ultra-pure water (A) and acetonitrile (B) with 0.1% formic acid. The thermostat temperature was set at 25 °C. Parameters were scaled up according to the increase in the column diameter.

3.6. Quantitative Characteristics of H. palustris Extracts

3.6.1. Determination of the Total Phenol Content (TPC)

The total phenolic content (TPC) was determined using the Folin–Ciocalteu method [32]. In this method, 80 µL of extract or fraction solution (1 mg/mL), 80 µL of Folin–Ciocalteu (9:1, v/v) reagent, and 80 µL of 10% Na2CO3 (sodium carbonate) were mixed and incubated for 1 h at room temperature. The absorbance was measured at 630 nm (each measurement was repeated three times). The TPC is expressed in pyrogallol equivalents from the calibration curve.

3.6.2. Determination of the Total Flavonoid Content (TFC)

The total flavonoid content (TFC) was determined using a previously described [33] method with Folin–Ciocalteu reagent, in which 50 µL of the sample was mixed with 10 µL of 10% AlCl3, 150 µL of 96% ethanol, and 10 µL of 1M CH3COOH. The absorbance was measured at 415 nm after 1 h of incubation at room temperature, and the values are expressed as luteolin equivalents. All tests were performed in triplicate.

3.6.3. Determination of Total Phenolic Acid Content (TPAC)

The total phenolic acid content (TPAC) was determined spectrophotometrically using Arnov’s reagent [29]. In this method, 30 µL of the sample, 150 µL of distilled water, 30 µL of 0.5 M HCl, 30 µL of Arnov’s reagent, and 30 µL of 1 M NaOH were mixed into a clear, flat-bottomed 96-well plate. The absorbance of the resulting solution was measured at 490 nm. The TPAC was determined using a standard curve with caffeic acid.

3.6.4. Determination of the Total Tannin Content (TTC)

The total tannin content (TTC) was examined using a previously described method [33] based on the difference between TPC values. Briefly, 1 mL of the sample was shaken with 10 mg of leather powder and then percolated. Afterwards, the filtrate (80 µL) was mixed with Folin–Ciocalteu (9:1, v/v) reagent (80 µL) and 10% sodium carbonate (80 µL). After 1 h of incubation, the absorbance was measured at 630 nm. Each assay was repeated in triplicate, and the results are presented as pyrogallol equivalents.

3.7. Antioxidant Activity (DPPH, ABTS, CUPRAC, FRAP)

3.7.1. Free Radical Scavenging Activity (DPPH Assay)

The methanolic solutions of fractions or compounds (130 µL) were added to the DPPH solution (70 µL). The sample’s absorbance was recorded after 30 min of incubation in darkness. All tests were performed in triplicate [33]. The radical scavenging activity of the tested samples was calculated using an equation obtained through linear regression of the Trolox standard curve. The methanolic solutions of fractions or compounds (130 µL) were added to the DPPH solution (70 µL). The sample absorbance was recorded after 30 min of incubation in darkness. All tests were performed in triplicate [33]. The radical scavenging activity of the tested samples was calculated using the equation obtained through linear regression of the Trolox standard curve.

3.7.2. ABTS [2,2′-azino-bis(3-ethylbenzothazoline-6-sulphonic acid)] Radical Cation Scavenging Activity

The potential inhibition of the production of the radical cation was measured using an Antioxidant Assay Kit. In short, the mixed solution, including 10 µL of the test sample, 20 µL of the myoglobin working solution, and 150 µL of the ABTS working solution, was incubated for 5 min. Then, 100 µL of the stop solution was added, and the absorbance was measured at 405 nm. All tests were performed in triplicate. The results were expressed as µM of Trolox equivalents obtained from the standard curve.

3.7.3. Ferric-Reducing Antioxidant Power Method (FRAP)

The ferric-reducing power was measured using the Ferric-Reducing Antioxidant Power Assay Kit. In brief, 10 µL of the tested solution was added to 190 µL of the reaction solutions (containing FRAP Assay Buffer, FeCl3 solution, and FRAP Probe). All of the absorbance values were recorded at 594 nm after 1 h of incubation at 37 °C. The chelating activity was determined using a standard curve and evaluated as mM of ferrous ion equivalents. All tests were performed in triplicate.

3.7.4. Cupric Ion Reducing Method (CUPRAC)

The total antioxidant capacity was determined using an Antioxidant Assay Kit MAK334. In short, 20 µL of each fraction or compound solution was added to 100 µL of the Reaction Mix in the clear, flat-bottomed 96-well plate. The absorbance was measured at 570 nm after 10 min of incubation at room temperature. The results were determined using a standard curve evaluated for Trolox.

3.8. Acetylcholinesterase Inhibitory Activity

Acetylcholinesterase inhibition was determined according to the previously described method [34] with a slight modification. The assay was carried out in Tris-HCl buffer (pH = 8 at 25 °C). The test extracts or compounds were diluted in the same buffer to the appropriate concentrations. Firstly, the reaction mixture containing the sample solution (50 µL), AChE solution (25 µL, 0.25 U/mL), and Ellman’s Reagent (3 mM, 125 µL) was incubated for 15 min at room temperature. Subsequently, 25 µL of ACh iodide (15 mM) was added, and after a further quarter-hour of incubation, the absorbance was estimated at 405 nm. The blank well contained the same amount of Tris-HCl buffer instead of the sample solution. Galantamine was used as a positive control. All measurements were conducted in triplicate, and the values are presented as IC50 means with standard deviations (SDs). The percent inhibition was calculated using the following formula:
Enzyme inhibition activity (%) = (B − S)/B × 100%
where B is the blank, and S is the sample absorbance.

4. Statistical Analysis and Simulated Data

All results from the enzyme inhibitory tests are presented as the mean ± standard deviation (SD) from at least three independent replicates. Calculations for the biological analysis were performed using GraphPad Prism 9 software (Trial, GraphPad Software, San Diego, CA, USA) and MS Excel 2019 (Microsoft, Redmond, WA, USA). Statistical differences and linear regression parameters for the standard curve were established using ANOVA with verification of the statistical significance. The physico-chemical properties, pKa, log P, and log S values, were calculated using Chemaxon’s Protonation software (Basel, Switzerland).

5. Conclusions

In our study, twelve flavonoid compounds were isolated from the aerial parts of H. palustris, three of which are new natural products and two were comprehensively characterized for the first time. In addition, the qualitative analysis showed the presence of 31 secondary metabolites of H. palustris, which included phytoconstituents characteristic of the Primulaceae family, such as saponins and flavone derivatives, polymethoxyflavones. Quantitative analysis showed a high content of polyphenols in the analyzed fractions and extracts. All tested samples were characterized by high antioxidant potential. The ethyl acetate fraction characterized by a strong ability to inhibit acetylcholinesterase was also described, while the tested compounds showed a moderate inhibitory effect. The most active compound turned out to be dibenzoylmethane. In summary, the chemical composition of the H. palustris herb resembles the well-known representatives of the Primulaceae family, as evidenced by the presence of the described chemophenetic markers. In addition, after additional toxicological analysis, it may be a good source of very rare polyphenolic compounds with a protective effect against oxidative stress and its degenerative effects on sensitive tissues.

Supplementary Materials

The following supporting information can be downloaded at: https://www.mdpi.com/article/10.3390/molecules27228034/s1, Figure S1: 13C NMR spectrum (100 MHz) of compound 9 in DMSO-d6. Figure S2: Mass spectrum in positive ion mode (fragmentor = 180 V) of compound 9. Figure S3: 1H NMR spectrum (400 MHz) of compound 9 in DMSO-d6. Figure S4: The UV spectrum of compound 9. Figure S5: The COSY spectrum of compound 9 in DMSO-d6. Figure S6: The HSQC spectrum of compound 9 in DMSO-d6. Figure S7: The HMBC spectrum of compound 9 in DMSO-d6. Figure S8: Mass spectrum in negative ion mode (fragmentor = 180 V) of compound 10. Figure S9: 13C NMR spectrum (100 MHz) of compound 10 in DMSO-d6. Figure S10: The UV spectrum of compound 10. Figure S11: 1H NMR spectrum (400 MHz) of compound 10 in DMSO-d6. Figure S12: The COSY spectrum of compound 10 in DMSO-d6. Figure S13: The HMQC spectrum of compound 10 in DMSO-d6. Figure S14: The HMBC spectrum of compound 10 in DMSO-d6. Figure S15: 13C NMR spectrum (100 MHz) of compound 14 in DMSO-d6. Figure S16: Mass spectrum in negative ion mode (fragmentor = 180 V) of compound 14. Figure S17: The UV spectrum of compound 14. Figure S18: 1H NMR spectrum (400 MHz) of compound 14 in DMSO-d6. Figure S19: The COSY spectrum of compound 14 in DMSO-d6. Figure S20: The HSQC spectrum of compound 14 in DMSO-d6. Figure S21: The HMBC spectrum of compound 14 in DMSO-d6. Figure S22: Mass spectrum in negative ion mode (fragmentor = 180 V) of compound 16. Figure S23: 13C NMR spectrum (100 MHz) of compound 16 in DMSO-d6. Figure S24: The UV spectrum of compound 16. Figure S25: 1H NMR spectrum (400 MHz) of compound 16 in DMSO-d6. Figure S26: The COSY spectrum of compound 16 in DMSO-d6. Figure S27: The HMQC spectrum of compound 16 in DMSO-d6. Figure S28: The HMBC spectrum of compound 16 in DMSO-d6. Figure S29: The UV spectrum of compound 18. Figure S30: 13C NMR spectrum (100 MHz) of compound 18 in DMSO-d6. Figure S31: Mass spectrum in negative ion mode (fragmentor = 180 V) of compound 18. Figure S32: 1H NMR spectrum (400 MHz) of compound 18 in DMSO-d6. Figure S33: The COSY spectrum of compound 18 in DMSO-d6. Figure S34: The HMQC spectrum of compound 18 in DMSO-d6. Figure S35: The HMBC spectrum of compound 18 in DMSO-d6. Figure S36: The DEPT spectrum of compound 16 in DMSO-d6. Figure S37: The UV chromatogram of extract HP1 obtained by LC-PDA-HRMS. Figure S38: The UV with crucial MS chromatogram of extract HP2 obtained by LC-PDA-HRMS. Figure S39: The UV with crucial MS chromatogram of extract HP3 obtained by LC-PDA-HRMS. Figure S40: The UV chromatogram of fraction HP4 obtained by LC-PDA-HRMS. Figure S41: The UV with crucial MS chromatograms of fraction HP5 obtained by LC-PDA-HRMS. Figure S42: The UV chromatogram of extract HP6 obtained by LC-PDA-HRMS. Figure S43: The UV chromatogram of extract HP7 obtained by LC-PDA-HRMS. Figure S44: The UV with crucial MS chromatograms of fraction HP8 obtained by LC-PDA-HRMS.

Author Contributions

Conceptualization, J.W.S. and M.T.; methodology, J.W.S. and K.J.; formal analysis, J.W.S. and K.J.; investigation, J.W.S., K.J. and Z.K.; writing—original draft preparation, J.W.S. and K.J.; writing—review and editing, J.W.S. and M.T.; visualization, J.W.S. and K.J; supervision, M.T. All authors have read and agreed to the published version of the manuscript.

Funding

This study received funding from Medical University of Białystok under grant No. SUB/2/DN/22/002/2212.

Institutional Review Board Statement

Not applicable.

Informed Consent Statement

Not applicable.

Data Availability Statement

Data are contained within the article and in the Supplementary Material.

Acknowledgments

The authors would like to thank Jolanta Nazaruk for her kind help with collecting and identifying the plant material. We give special thanks to Krzysztof Bielawski from the Medical University of Białystok for providing a laboratory in which to conduct the melting point study for new compounds.

Conflicts of Interest

The authors declare no conflict of interest.

Sample Availability

Samples of compounds 8–19 are available from the authors.

Abbreviations

UVultraviolet spectroscopy
HRMShigh-resolution mass spectrometry
NMRnuclear magnetic resonance
2D NMRtwo-dimensional nuclear magnetic resonance
COSYcorrelation spectroscopy
HSQCheteronuclear single quantum coherence
HMBCheteronuclear multiple bond correlation
DEPTdistortionless enhancement by polarization transfer
UV–Visultraviolet–visible spectroscopy
TPCtotal phenolic content
TFCtotal flavonoid content
TPACtotal phenolic acid content
TTCtotal tannin content
ABTS2,2′-azino-bis(3-ethylbenzthiazoline-6-sulfonic acid)
FRAPferrous reducing antioxidant potential
DPPH2,2-diphenyl-1-picrylhydrazyl
CUPRACcupric reducing antioxidant capacity
FeCl3ferric (III) chloride
AChEacetylcholinesterase
ACh iodideacetylcholine iodide
SDstandard deviation
IC50concentration at which a substance exerts half of its maximal inhibitory effect

References

  1. Elliott, S. A Sketch of the Botany of South Carolina and Georgia; J.R. Schenck: Charleston, SC, USA, 1821. [Google Scholar]
  2. World Flora Online. Hottonia inflata Elliott. Available online: http://www.worldfloraonline.org/taxon/wfo-0001105360 (accessed on 16 September 2022).
  3. Ramesh, S.; Rajan, R.; Santhanam, R. Freshwater Phytopharmaceutical Compounds; CRC Press: Boca Raton, FL, USA, 2013. [Google Scholar]
  4. World Flora Online. Hottonia palustris L. Available online: http://www.worldfloraonline.org/taxon/wfo-0000725040 (accessed on 16 September 2022).
  5. von Linneé, C.; Salvius, L. Species Plantarum: Exhibentes Plantas Rite Cognitas, Ad Genera Relatas, Cum Differentiis Specificis, Nominibus Trivialibus, Synonymis Selectis, Locis Natalibus, Secundum Systema Sexuale Sigestas; Impensis GC Nauk: Stockholm, Sweden, 1797; Volume 2. [Google Scholar]
  6. Lauber, K.; Wagner, G.; Gygax, A. Flora Helvetica—Illustrierte Flora der Schweiz, 6th ed.; Haupt Verlag: Bern, Switzerland, 2018. [Google Scholar]
  7. Strawa, J.W.; Jakimiuk, K.; Szoka, Ł.; Brzezinski, K.; Drozdzal, P.; Pałka, J.A.; Tomczyk, M. New polymethoxyflavones from Hottonia palustris evoke DNA biosynthesis-inhibitory activity in an oral squamous carcinoma (SCC-25) cell line. Molecules 2022, 27, 4415. [Google Scholar] [CrossRef] [PubMed]
  8. Broda, B.; Mowszowicz, J. Przewodnik Do Oznaczania Roślin Leczniczych, Trujących I Użytkowych; Wydawnictwo Lekarskie PZWL: Warszawa, Poland, 1996. [Google Scholar]
  9. World Health Organization. Global Action Plan on the Public Health Response to Dementia 2017–2025; WHO: Geneva, Switzerland, 2017. [Google Scholar]
  10. World Health Organization. Risk Reduction of Cognitive Decline and Dementia: WHO Guidelines; WHO: Geneva, Switzerland, 2019. [Google Scholar]
  11. Li, R.S.; Wang, X.B.; Hu, X.J.; Kong, L.Y. Design, Synthesis and evaluation of flavonoid derivatives as potential multifunctional acetylcholinesterase inhibitors against Alzheimer’s disease. Bioorganic Med. Chem. Lett. 2013, 23, 2636–2641. [Google Scholar] [CrossRef] [PubMed]
  12. Nair, V.P.; Hunter, J.M. Anticholinesterases and anticholinergic drugs. Contin. Educ. Anaesth. Crit. Care Pain 2004, 4, 164–168. [Google Scholar] [CrossRef] [Green Version]
  13. Mabry, T.J.; Markham, K.R.; Thomas, M.B. The Systematic Identification of Flavonoids; Springer: Berlin/Heidelberg, Germany, 1970. [Google Scholar]
  14. Dias, M.C.; Pinto, D.C.G.A.; Silva, A.M.S. Plant flavonoids: Chemical characteristics and biological activity. Molecules 2021, 26, 5377. [Google Scholar] [CrossRef]
  15. Ding, H.-Y.; Chen, Y.-Y.; Chang, W.-L.; Lin, H.-C. Flavonoids from the flowers of Pueraria lobata. J. Chin. Chem. Soc. 2004, 51, 1425–1428. [Google Scholar] [CrossRef]
  16. Mainka, M.; Czerwińska, M.E.; Osińska, E.; Ziaja, M.; Bazylko, A. Screening of antioxidative properties and inhibition of inflammation-linked enzymes by aqueous and ethanolic extracts of plants traditionally used in wound healing in Poland. Antioxidants 2021, 10, 698. [Google Scholar] [CrossRef]
  17. Alinezhad, H.; Zare, M.; Nabavi, S.F.; Naqinezhad, A.; Nabavi, S.M. Antioxidant, antihemolytic, and inhibitory activities of endemic Primula heterochroma against Fe2+ - induced lipid peroxidation and oxidative stress in rat brain in vitro. Pharm. Biol. 2012, 50, 1391–1396. [Google Scholar] [CrossRef]
  18. Spiegel, M.; Andruniów, T.; Sroka, Z. Flavones and flavonols antiradical structure—Activity relationship—A quantum chemical study. Antioxidants 2020, 9, 461. [Google Scholar] [CrossRef]
  19. Burda, S.; Oleszek, W. Antioxidant and antiradical activities of flavonoids. J. Agric. Food Chem. 2001, 49, 2774–2779. [Google Scholar] [CrossRef]
  20. dos Santos, T.C.; Gomes, T.M.; Pinto, B.A.S.; Camara, A.L.; de Andrade Paes, A.M. Naturally occurring acetylcholinesterase inhibitors and their potential use for Alzheimer’s disease. Front. Pharmacol. 2018, 9, 1192. [Google Scholar] [CrossRef]
  21. Uriarte-Pueyo, I.; Calvo, M. Flavonoids as acetylcholinesterase inhibitors. Curr. Med. Chem. 2011, 18, 5289–5302. [Google Scholar] [CrossRef] [PubMed]
  22. Fan, P.; Hay, A.-E.; Marston, A.; Hostettmann, K. Acetylcholinesterase-inhibitory activity of linarin from Buddleja davidii, structure-activity relationships of related flavonoids and chemical investigation of Buddleja nitida. Pharm. Biol. 2008, 46, 596–601. [Google Scholar] [CrossRef]
  23. Strawa, J.; Wajs-Bonikowska, A.; Jakimiuk, K.; Waluk, M.; Poslednik, M.; Nazaruk, J.; Tomczyk, M. Phytochemical examination of woolly burdock Arctium tomentosum leaves and flower heads. Chem. Nat. Compd. 2020, 56, 345–347. [Google Scholar] [CrossRef]
  24. Strawa, J.W.; Jakimiuk, K.; Tomczyk, M. Zapotin, a polymethoxyflavone, with potential therapeutic attributes. Int. J. Mol. Sci. 2021, 22, 13227. [Google Scholar] [CrossRef]
  25. Abraham, M.H.; Acree, W.E.; Earp, C.E.; Vladimirova, A.; Whaley, W.L. Studies on the hydrogen bond acidity and other descriptors and properties for hydroxyflavones and hydroxyisoflavones. J. Mol. Liq. 2015, 208, 363–372. [Google Scholar] [CrossRef]
  26. Wollenweber, E.; Mann, K.; Inuma, M.; Tanaka, T.; Mizuno, M. 8,2′-Dihydroxyflavone from Primula pulverulenta. Phytochemistry 1988, 27, 1483–1486. [Google Scholar] [CrossRef]
  27. Harborne, J.B. The Flavonoids Advances in Research since 1986, 1st ed.; Routledge: New York, NY, USA, 2017. [Google Scholar]
  28. Agrawal, P.K. Carbon-13 NMR of Flavonoids, 1st ed.; Elseiver: New York, NY, USA, 1989. [Google Scholar]
  29. Ricelli, A.; De Angelis, M.; Primitivo, L.; Righi, G.; Sappino, C.; Antonioletti, R. Role of some food-grade synthesized flavonoids on the control of ochratoxin A in Aspergillus carbonarius. Molecules 2019, 24, 2553. [Google Scholar] [CrossRef] [Green Version]
  30. Park, Y.; Moon, B.-H.; Lee, E.; Lee, Y.; Yoon, Y.; Ahn, J.-H.; Lim, Y. 1H and 13C-NMR data of hydroxyflavone derivatives. Magn. Reson. Chem. 2007, 45, 674–679. [Google Scholar] [CrossRef]
  31. Ganbaatar, C.; Gruner, M.; Mishig, D.; Duger, R.; Schmidt, A.W.; Knölker, H.-J. Flavonoid glycosides from the aerial parts of Polygonatum odoratum (Mill.) Druce growing in Mongolia. Open Nat. Prod. J. 2015, 8, 1–7. [Google Scholar] [CrossRef] [Green Version]
  32. Ciganović, P.; Jakimiuk, K.; Tomczyk, M.; Končić, M.Z. Glycerolic licorice extracts as active cosmeceutical ingredients: Extraction optimization, chemical characterization, and biological activity. Antioxidants 2019, 8, 445. [Google Scholar] [CrossRef]
  33. Jakimiuk, K.; Strawa, J.W.; Granica, S.; Locatelli, M.; Tartaglia, A.; Tomczyk, M. Determination of flavonoids in selected Scleranthus species and their anti-collagenase and antioxidant potential. Molecules 2022, 27, 2015. [Google Scholar] [CrossRef] [PubMed]
  34. Grochowski, D.M.; Uysal, S.; Aktumsek, A.; Granica, S.; Zengin, G.; Ceylan, R.; Locatelli, M.; Tomczyk, M. In vitro enzyme inhibitory properties, antioxidant activities and phytochemical profile of Potentilla thuringiaca. Phytochem. Lett. 2017, 20, 365–372. [Google Scholar] [CrossRef]
Figure 1. Chemical structures of isolated flavones (8–14).
Molecules 27 08034 g001
Figure 2. Chemical structures of the isolated flavonols (15–19).
Molecules 27 08034 g002
Figure 3. Relevant COSY and HMBC correlations occurring in the spectra of compounds 9, 10, 14, 16, and 18 isolated from H. palustris.
Molecules 27 08034 g003
Figure 4. Time windows for collecting eluates from purification of chloroform fraction (HP8) and n-butanol fraction (HP5) by preparative HPLC.
Molecules 27 08034 g004
Table 1. The 13C and 1H spectral data of compounds 9, 10, 14, 16, and 18 (400 MHz for 1H and 100 MHz for the 13C spectrum; δ in ppm, J in Hz, DMSO-d6).
C No.910141618
δ Cδ Hδ Cδ Hδ Cδ Hδ Cδ Hδ Cδ H
2161.85 C-164.58 C-164.26 C-157 C-156.19 C-
3110.78 B7.16, s104.97 B7.03, s103.05 B6.85, s133.69 C-133.26 C-
4183.29 C-183.85 C-182.06 C-177.86 C-177.23 C-
5159.8 C-148.51 C-161.13 C-161.64 C-161.14 C-
6110.69 B6.82, d, J = 8.16140.59 C-99.54 B6.45, s99.19 B6.19, s98.88 B6.15, s
7135.9 B7.68, t, J = 8.28, 8.16107.11 B7.72, d, J = 9.03162.76 C-164.69 C-164.94 C-
8107.53 B7.38, d, J = 8.28124.14 B7.18, d, J = 9.0395.25 B6.82, s94.21 B6.41, s93.7 B6.35, s
9156.2 C-150.49 C-156.83 C-156.93 C-156.41 C-
10110.03 C-110.61 C-105.4 C-104.49 C-103.72 C-
5-OH 12.71, s-12.73, s-12.96, s-12.59, s-12.61, s
4′-OH ----10.44, s-10.24, s-nd
1′120.07 C-130.84 C-121.04 C-121.35 C-121.08 C-
2′155.63-126.84 B8.09, d, J = 7.03128.61 B7.95, d, J = 8.53131.42 B8.03, d, J = 8.66116.15 B7.56, s
3′115.59 B7.17, d, J = 6.78 A129.46 B7.6, m115.99 B6.94, d, J = 8.53115.57 B6.88, d, J = 8.66144.82 C-
4′133.23 B7.58, t, J = 7.4, 7.4132.58 B7.6, m161.36 C-160.4 C-148.6 C-
5′122.04 B7.23, t, J = 7.4, 7.4129.46 B7.6, m115.99 B6.94, d, J = 8.53115.57 B6.88, d, J = 8.66115.24 B6.83, d, J = 8.03
6′129.26 B7.94, d, J = 6.78126.84 B8.09, d, J = 7.03128.61 B7.95, d, J = 8.53131.42 B8.03, d, J = 8.66121.66 B7.58, d, J = 2.26
2′-O-glucosyl6-O-glucosyl7-O-glucosyl3-O-glucosyl3-O-glucosyl
1″100.275.13, d, J = 7.03 B1014.92, d, J = 6.53 B98.295.2, d, J = 7.03 B101.485.37, d, J = 7.53 B100.945.37, d, J = 7.28 B
2″73.333.31 A,B73.812.96 A,B82.743.54 A,B73.612.85 A,B73.983.21 A,B
3″77.213.46 A,B76.963.05 A,B75.763.15 A,B76.733.22 A,B76.35 A3.24 A,B
4″69.563.2 A,B70.313.12 A,B69.143.26 A,B70.133.13 A,B69.762.98 A,B
5″76.723.32 A,B76.803.33 A,B76.983.5 A,B76.642.85 A,B76.212.87 A,B
6″60.593.72, d, J = 11.5468.763.99, d, J = 9.7960.483.73, d, J = 9.7968.353.79, d, J = 11.2969.413.81, d, J = 10.79
3.49, d, J = 5.27 B3.62 A,B3.57 A,B3.45 A,B3.44 A,B
-6″-O-glucosylglucuronide moiety2″-O-xylosyl2″-O-xylosyl
1″′--103.5 B4.2, d, J = 7.78104.44 B4.55, d, J = 7.78104.13 B4.0, d, J = 7.28103.65 B4.01, d, J = 7.28
2″′--73.433.29 A,B74.253.04 A,B74.553.16 A,B73.132.82 A,B
3″′--76.823 A,B75.553.71 A,B76.7 A,D3.22 A,B76.35 A3.24 A,B
4″′--70.023.30 A,B71.693.24 A,B69.862.81 A,B69.413.27 A,B
5″′--76.163.61 A,B75.623.49 A,B65.793.51 A,B65.323.54 A,B
2.76 A,B2.75 A,B
6″′--61.243.67 A,B170.67-----
3.41 A,B
A—signals or overlapping multiplets; B—chemical shift based on the HSQC/HMQC spectrum; C—chemical shift based on the HMBC spectrum; D—chemical shift based on the DEPT spectrum (see Figure S36).
Table 2. The UV–Vis and MS data of compounds identified in HP1–HP8 by liquid chromatography–photodiode detection array–high-resolution mass spectrometry (LC-PDA-HRMS).
NoRt [min]λ Max
[nm]
Observed #FormulaΔ
[ppm]
FragmentationCompoundsPresence in HP
Negative/PositiveHP1HP2HP3HP4HP5HP6HP7HP8
P117.35256, 266, 348623.1267 AC27H28O172.26623, 447, 285/625, 287kaempferol hex-uro derivativexxx x
P219.87268, 336607.13 AC27H28O16−0.49607, 269/609, 271apigenin 7-O-(2″-O-β-gluc)-β-glu (14)xxxxx x
P322.27254, 266, 295, 354595.1317 AC26H28O162.29595, 300/597, 465, 303quercetin pent-hexxx x x
P422.69254, 266, 295, 354595.1316 AC26H28O162.29595, 300/597, 465, 303quercetin 3-O-(6″-O-β-xyl)-β-glu (18)xx xx x
P526.10256, 266, 295, 354609.146 AC27H30O160.02609, 300/611, 465, 303rutin (19)xxxxx x
P628.83256, 264, 292, 352579.1355 AC26H28O153.6579, 284/581, 417, 287kaempferol pent-hexxx xx x
P729.56256, 264, 292, 352579.1356 AC26H28O150.29579, 284/581, 417, 287kaempferol 3-O-(6″-O-β-xyl)-β-glu (16)xx xx x
P835.11266, 294, 348593.1514 AC27H30O150.39593, 284/595, 449, 287nicotiflorin (15)xxxxx x
P944.11278, 314sh, 352sh577.1561 AC27H30O140.11577, 253/579, 417, 255hottonioside A (10) xx x
P1046.63278, 314sh, 352sh577.1565 AC27H30O14−0.76577, 254/579, 255dihydroxyflavone hex-hex x x
P1148.65257, 368301.0354 AC15H10O73.31301/303quercetinSxxx
P1248.87268, 324417.1187 BC21H20O91.81-/417, 2552′,5-dihydroxyflavone 2′-O-β-glu (9) x xx
P1350.16268, 290sh, 336269.0457 AC15H10O50.69269/271apigeninSxxxx xx
P1451.53250, 265, 295sh, 320sh, 365285.0407 AC15H10O60.12285/287kaempferol (17)xxxx xx
P1553.46nd1249.6214 AC60H98O27−0.191249, 328/-sakurasosaponin xx x x
P1654.12nd1103.5664 AC54H88O231.531103, 328/-primulasaponin 1 xx x x
P1754.36nd1219.612 AC54H88O231.531219/-triterpene saponin derivative xx x x
P1854.54282, 318, 360253.0506 AC15H10O42.21253/2555,6-dihydroxyflavone (12) xxx
P1954.69nd957.5111 AC41H82O24−1.1957/-triterpene saponin derivative x x
P2054.9272, 302, 334253.0511 AC15H10O42.03253/255chrysin (13) xxx
P2157.06230, 258, 335344.1251 BC19H18O6−1.01-/343, 328, 313, 299zapotin (8)xxx xxx
P2259.29258, 333313.0718 AC17H14O60.67313, 298, 283/3155,6′-dihydroxy-2′,3′-dimethoxyflavone (7)xxx xxx
P2359.95259, 327283.0612 AC16 H12 O50.82283, 268/2852’,5-dihydroxy-6-methoxyflavone (6)xxx xxx
P2466.27268, 340255.0506 AC15H10O41.25253/2552’,5-dihydroxyflavone (11)xx xxx
P2572.64257, 331327.0887 AC18H16O61.36327/329, 2995-hydroxy-2’,3’,6’-trimethoxyflavone (5)x xxx
P2681.71260, 327297.0772 AC17H14O51.35297/2995-hydroxy-2’,6’-dimethoxyflavone (4)xx xxx
P2781.71271, 336239.0740 BC15H10O34.78237/2395-hydroxyflavone (2)xx xxx
P2884.87260, 327267.0663 AC16H12O40.93267/269, 2545-hydroxy-2′-methoxyflavone (3)xx xxx
P2991.94252, 345223.0765 AC15H12O23.2223/2251,3-diphenylpropane-1,3-dione (1)xx xxx
P3097.48310, 340, 460687.2346 AC52H30O21.02687, 365/-unknown x
P3199.46280, 325, 395, 410591.2645 AC34H40O9−3.65591/631, 593unknown xx xx x
#—exact mass registered in [M−H] (A) or [M+H]+ (B) ion; sh—peak shoulder; nd—not detected; Δ—error mass; bold—most abundant; S—reference substance; hex—hexose; pent—pentose; uro—uronide; glu—glucose; xyl—xylose; gluc—glucuronide acid.
Table 3. Phytochemical analysis of the total phenolic (TPC), total flavonoid (TFC), phenolic acid (TPAC), and tannin contents (TTC) of HP1HP8.
ExtractsTPCTFCTPACTTC
(mg Peq/g extract) A(mg Leq/g extract) B(mg CAeq/g extract) C(mg Peq/g extract) A
HP164.58 ± 1.017.10 ± 0.411.02 ± 0.062.94 ± 0.12
HP249.54 ± 1.752.58 ± 0.160.58 ± 0.012.00 ± 0.31
HP312.44 ± 0.201.62 ± 0.070.51 ± 0.012.11 ± 0.46
HP467.81 ± 2.023.23 ± 0.290.80 ± 0.044.07 ± 0.82
HP551.60 ± 2.372.69 ± 0.050.64 ± 0.035.40 ± 0.86
HP664.52 ± 1.879.23 ± 0.123.03 ± 0.143.24 ± 0.58
HP762.12 ± 1.677.63 ± 0.363.48 ± 0.211.51 ± 0.28
HP858.31 ± 1.923.88 ± 0.120.76 ± 0.013.33 ± 0.82
A—expressed as pyrogallol equivalents (Peq); B—expressed as luteolin equivalents (Leq); C—expressed as caffeic acid equivalents (CAeq). All data are represented as the mean with standard deviation from triplicate measurements.
Table 4. Antioxidant and acetylcholinesterase inhibitory activities of HP1–HP8.
ExtractsDPPH AABTS AFRAP BCUPRAC AAChE C
(µM Teq)(µM Teq)(mM Fe2+/mL)(µM Teq)IC50 (µg/mL)
HP1409.98 ± 4.83945.81 ± 4.032.63 ± 0.04354.42 ± 2.01274.15 ± 0.98
HP2299.23 ± 3.59774.72 ± 2.502.50 ± 0.04375.08 ± 1.32378.25 ± 3.22
HP3384.66 ± 3.65773.90 ± 3.691.55 ± 0.1579.67 ± 0.32na
HP4452.16 ± 4.371132.21 ± 2.503.68 ± 0.21385.19 ± 1.52219.77 ± 0.37
HP5298.18 ± 3.591001.30 ± 2.282.36 ± 0.17399.26 ± 2.63na
HP6384.66 ± 1.831075.37 ± 3.714.35 ± 0.45219.03 ± 0.76260.24 ± 1.60
HP7494.35 ± 4.831099.42 ± 3.254.69 ± 0.14306.95 ± 2.75282.46 ± 0.47
HP8376.23 ± 3.48945.81 ± 3.032.16 ± 0.06129.79 ± 1.32290.26 ± 1.51
A—expressed as Trolox equivalents (Teq) and B—expressed as Fe2+/mL where all data are represented as the mean with standard deviation from triplicate measurements; C—data are represented as the mean of the IC50 value with standard deviation from at least triplicate measurements; galantamine (IC50 = 91.23 ± 0.52 µg/mL) was used as a positive control; na—no significant activity.
Table 5. Antioxidant and acetylcholinesterase inhibitory activities of compounds 1–19.
CompoundsDPPH AABTS AFRAP BCUPRAC AAChE C
(µM Teq)(µM Teq)(mM Fe2+/mL)(µM Teq)IC50 (µM)
139.81 ± 2.76300.12 ± 4.97na3.18 ± 0.32144.83 ± 1.30
241.71 ± 2.28317.47 ± 3.91nana314.38 ± 1.72
339.39 ± 1.59330.59 ± 4.04nana279.70 ± 0.45
428.63 ± 2.40326.76 ± 6.64nana325.42 ± 3.21
534.32 ± 0.97280.02 ± 1.55nana284.61 ± 0.80
6227.55 ± 2.85781.28 ± 4.3815.81 ± 0.85366.29 ± 1.24391.78 ± 1.06
737.85 ± 1.90277.56 ± 2.88nana390.83 ± 0.66
8167.89 ± 1.08756.95 ± 5.100.05 ± 0.01na464.45 ± 1.66
9170.56 ± 2.49204.59 ± 2.26na20.33 ± 1.57399.72 ± 0.64
10204.31 ± 3.31624.94 ± 5.70na19.79 ± 1.03376.11 ± 1.87
11175.83 ± 2.83661.30 ± 3.810.07 ± 0.0144.50 ± 1.35371.51 ± 0.66
121522.38 ± 7.311052.41 ± 5.5154.25 ± 1.031060.42 ± 5.33362.19 ± 0.39
13227.51 ± 1.83728.26 ± 1.080.08 ± 0.01na330.15 ± 1.77
14341.42 ± 3.16746.84 ± 1.851.63 ± 0.0366.48 ± 0.56417.78 ± 1.11
15250.72 ± 1.65702.29 ± 2.470.40 ± 0.0656.81 ± 1.52407.44 ± 1.41
16300.29 ± 1.87717.32 ± 3.470.67 ± 0.0674.40 ± 1.49364.34 ± 1.79
17792.53 ± 7.311095.04 ± 1.8536.87 ± 1.20848.64 ± 3.49276.90 ± 1.41
181336.75 ± 6.331147.52 ± 7.0663.98 ± 1.751401.11 ± 2.64302.85 ± 3.33
191467.53 ± 5.481149.16 ± 5.2552.98 ± 1.351258.68 ± 3.49445.32 ± 0.35
A—expressed as Trolox equivalents (Teq) and B—expressed as Fe2+/mL, where all data are represented as the mean with standard deviation from triplicate measurements; C—data are represented as the mean of IC50 value with standard deviation from at least triplicate measurements; galantamine (IC50 = 91.23 ± 0.52 µg/mL) was used as a positive control; na—no significant activity.
Publisher’s Note: MDPI stays neutral with regard to jurisdictional claims in published maps and institutional affiliations.

