Article

Insights into the Dynamics and Binding of Two Polyprotein Substrate Cleavage Points in the Context of the SARS-CoV-2 Main and Papain-like Proteases

by
Zainab Kemi Sanusi
1 and
Kevin Alan Lobb
1,2,*
1
Department of Chemistry, Rhodes University, Makhanda 6140, South Africa
2
Research Unit in Bioinformatics (RUBi), Rhodes University, Makhanda 6140, South Africa
*
Author to whom correspondence should be addressed.
Molecules 2022, 27(23), 8251; https://doi.org/10.3390/molecules27238251
Submission received: 28 September 2022 / Revised: 25 October 2022 / Accepted: 3 November 2022 / Published: 26 November 2022
(This article belongs to the Section Medicinal Chemistry)

Abstract

:
It is well known that vital enzymes in the replication process of the coronavirus are the SARS-CoV-2 PLpro and SARS-CoV-2 3CLpro, both of which are important targets in the search for anti-coronavirus agents. These two enzymes are responsible for cleavage at various polyprotein sites in the SARS-CoV-2 lifecycle. Herein, the dynamics of the polyprotein cleavage sequences for the boundary between non-structural proteins Nsp1 and Nsp2 (CS1) and between Nsp2 and Nsp3 (CS2) in complex with both the papain-like protein PLpro and the main protease 3CLpro were explored using computational methods. The post dynamics analysis reveals that CS1 and CS2 both have greater stability when complexed with PLpro. Of these two, greater stability is observed for the CS1–PLpro complex, while destabilization resulting in loss of CS2 from the PLpro active site is observed for CS2-PLpro, suggesting the rate of exchange by the papain-like protease is faster for CS2 compared to CS1. On the other hand, the 3CLpro main protease also reveals stability for CS1 suggesting that the main protease could also play a potential role in the cleavage at point CS1. However, destabilization occurs early in the simulation for the complex CLpro–CS2 suggesting a poor interaction and non-plausible protease cleavage of the polyprotein at CS2 by the main protease. These findings could be used as a guide in the development and design of potent COVID-19 antiviral inhibitors that mimic the CS1 cleavage site.

1. Introduction

The severe acute respiratory syndrome—coronavirus 2 (SARS-CoV-2) belongs to the family of β-coronaviruses, and it is a causative agent of the novel coronavirus disease 2019 (COVID-19) [1,2,3]. For over two decades now, β-coronaviruses (β-CoVs) have caused three epidemics, namely SARS-CoV in 2002, MERS-CoV in 2013 and recently SARS-CoV-2 in 2019 [4,5]. The SARS-CoV-2 virus epidemic, which originated in Wuhan, China, and quickly spread throughout the world, was declared a pandemic by the World Health Organization (WHO) and has resulted in more than 6 million deaths globally as of present [6]. COVID-19 mainly affects the respiratory system and causes a flu-like illness with symptoms such as fever, cough and, in more acute cases, difficulty in breathing. The mortality rate is high in older (>60 years) individuals and people with underlying conditions [7,8]. COVID-19 is not limited to respiratory distress and failure; the virus is now known to emerge as a systemic inflammation that leads to severe cardiac injury, heart failure, sepsis and multi-organ dysfunction in individuals at high risk [3,9].
Tremendous work/research has been conducted by scientists all over the world to study the symptoms and risk factors for this disease, as well as understand the fundamental mechanism of the SARS-CoV-2 virus [8,10,11,12]. Currently, a few vaccines such as the Pfizer-BioNTech, Moderna and Johnson & Johnson vaccines are approved by the Food and Drug Administration (FDA), while Remdesivir [13] is the only antiviral drug approved by FDA [14,15]. Even though immunity can be achieved by taking the available vaccines, transmission of the virus is still possible; hence, wearing of masks, frequent washing of hands and social distancing are nevertheless mandated. Owing to the rapid infection and mortality rate, as well as emergence of new mutations of the virus, the COVID-19 virus does not seem to be disappearing. Hence, more effort is required in the elucidation of the pathogen’s strategies in search for more potential and effective therapeutic drugs.
The SARS-CoV-2 is an RNA-based genome and infects the human host cells by binding to the cell surface of ACE2 through the receptor-binding domain (RBD) of its S protein [2,16]. A detailed insight into SARS-CoV-2 pathobiology/pathophysiology is still being developed, although the virus genome sequence is available in NCBI database (NC_045512.2) [17] and several possible antiviral targets have been identified [2,5,8]. These include the RNA-dependent RNA polymerase (RDRp), trans-membrane protease serine 2 (TMPRSS2), spike protein (S protein), angiotensin AT2 receptor (AT2), angiotensin-converting enzyme 2 (ACE2), papain-like protein (PLpro) and the main protease (3CLpro) [2,5,8]. The 3D structure of the SARS-CoV-2 main protease is illustrated in Figure 1.
The coronavirus main protein, also known as the chymotrypsin-like cysteine protease (3CLpro) [21], is a cysteine protease with a catalytic dyad (Cys145/His41) active site [12,17]. Like other cysteine proteases [22], the SARS-CoV-2 3CLpro cleaves its target using this dyad [12,21]. Other residues (Thr25, Thr26, Leu27, Ser46, Met49, Tyr54, Phe140, Leu141, Asn142, Gly143, His163, Met165, Glu166, Leu167, Pro168, Phe185, Asp187, Gln189, Thr190, Ala191 and Gln192) within the active site have been recognized as substrate binding residues and therefore play a significant role in the effective development of SARS-CoV-2 3CLpro inhibitors [23,24].
Both proteases (PLpro and 3CLpro) play a crucial role in viral polyprotein processing of the polyproteins that are translated from viral RNA during the replication and release of new SARS-CoV-2 virions [5,8]. Previous studies have shown that the papain-like protease (PLpro) recognizes and cleaves the viral polyproteins (pp1a and pp1ab) at the N-terminal to produce three non-structural protein (Nsp1, Nsp2 and Nsp3) [23,25,26], while the 3CLpro also recognizes and cleaves the viral polyprotein at the C-terminal and produces at least 11 new individual mature non-structural proteins. This is true throughout the wider coronavirus family, and it is observed that both protases are well conserved [5,8,27]. The specificity in cleaving polyproteins at points after Gly and after Gln residues is another conserved characteristic of the SARS-CoV-2 PLpro [28] and SARS-CoV-2 3CLpro [29] enzymes, respectively, which is also observed in other coronavirus proteases but not in human enzymes [27] (Table 1). Preventing the activity of these proteases would inhibit the lifecycle of the virus [5,23].
In the literature, there has been development of several competitive non-covalent inhibitors of PLpro from analogs of protein substrates of PLpro which consists of Leu-X-Gly-Gly amino acid peptides [23]. It is, therefore, necessary to understand how PLpro recognizes and cleaves the protein substrate (CS1 and CS2) and also if there is any analogous behavior by the 3CLpro enzyme. This is possible through computer simulations with the availability of solved X-ray structures [27,30,31] of the SARS-CoV-2 3CLpro and PLpro enzymes (Figure 1).
The 3CLpro is a primary target in the search for agents to treat the novel coronavirus infection [5]. In this study, we aim to investigate the dynamics of the structural properties and substrate binding landscape of the 3CLpro complex with the protein substrates (CS1 and CS2) [5], and this is compared with the corresponding PLpro complexes. Herein, a long-timescale molecular dynamics (MD) simulation was performed to provide adequate information on the complex dynamics. This was achieved by first performing molecular docking to generate both 3CLpro–CS1 and 3CLpro–CS2 complexes, as well as the PLpro–CS1 and PLpro–CS2 complexes. Post dynamics analysis, including root-mean-square deviation and fluctuation (RMSD and RMSF), the radius of gyration (RoG), dynamic cross-correlation matrices (DCCMs), hydrogen bonding (HB) and binding free energy calculations, was carried out. The findings demonstrate the conformational and structural features of the 3CLpro in complex with the studied protein substrates in comparison with the corresponding PLpro protease complexes. This could assist in the development of new inhibitors with improved and additional selective activity.

2. Results and Discussion

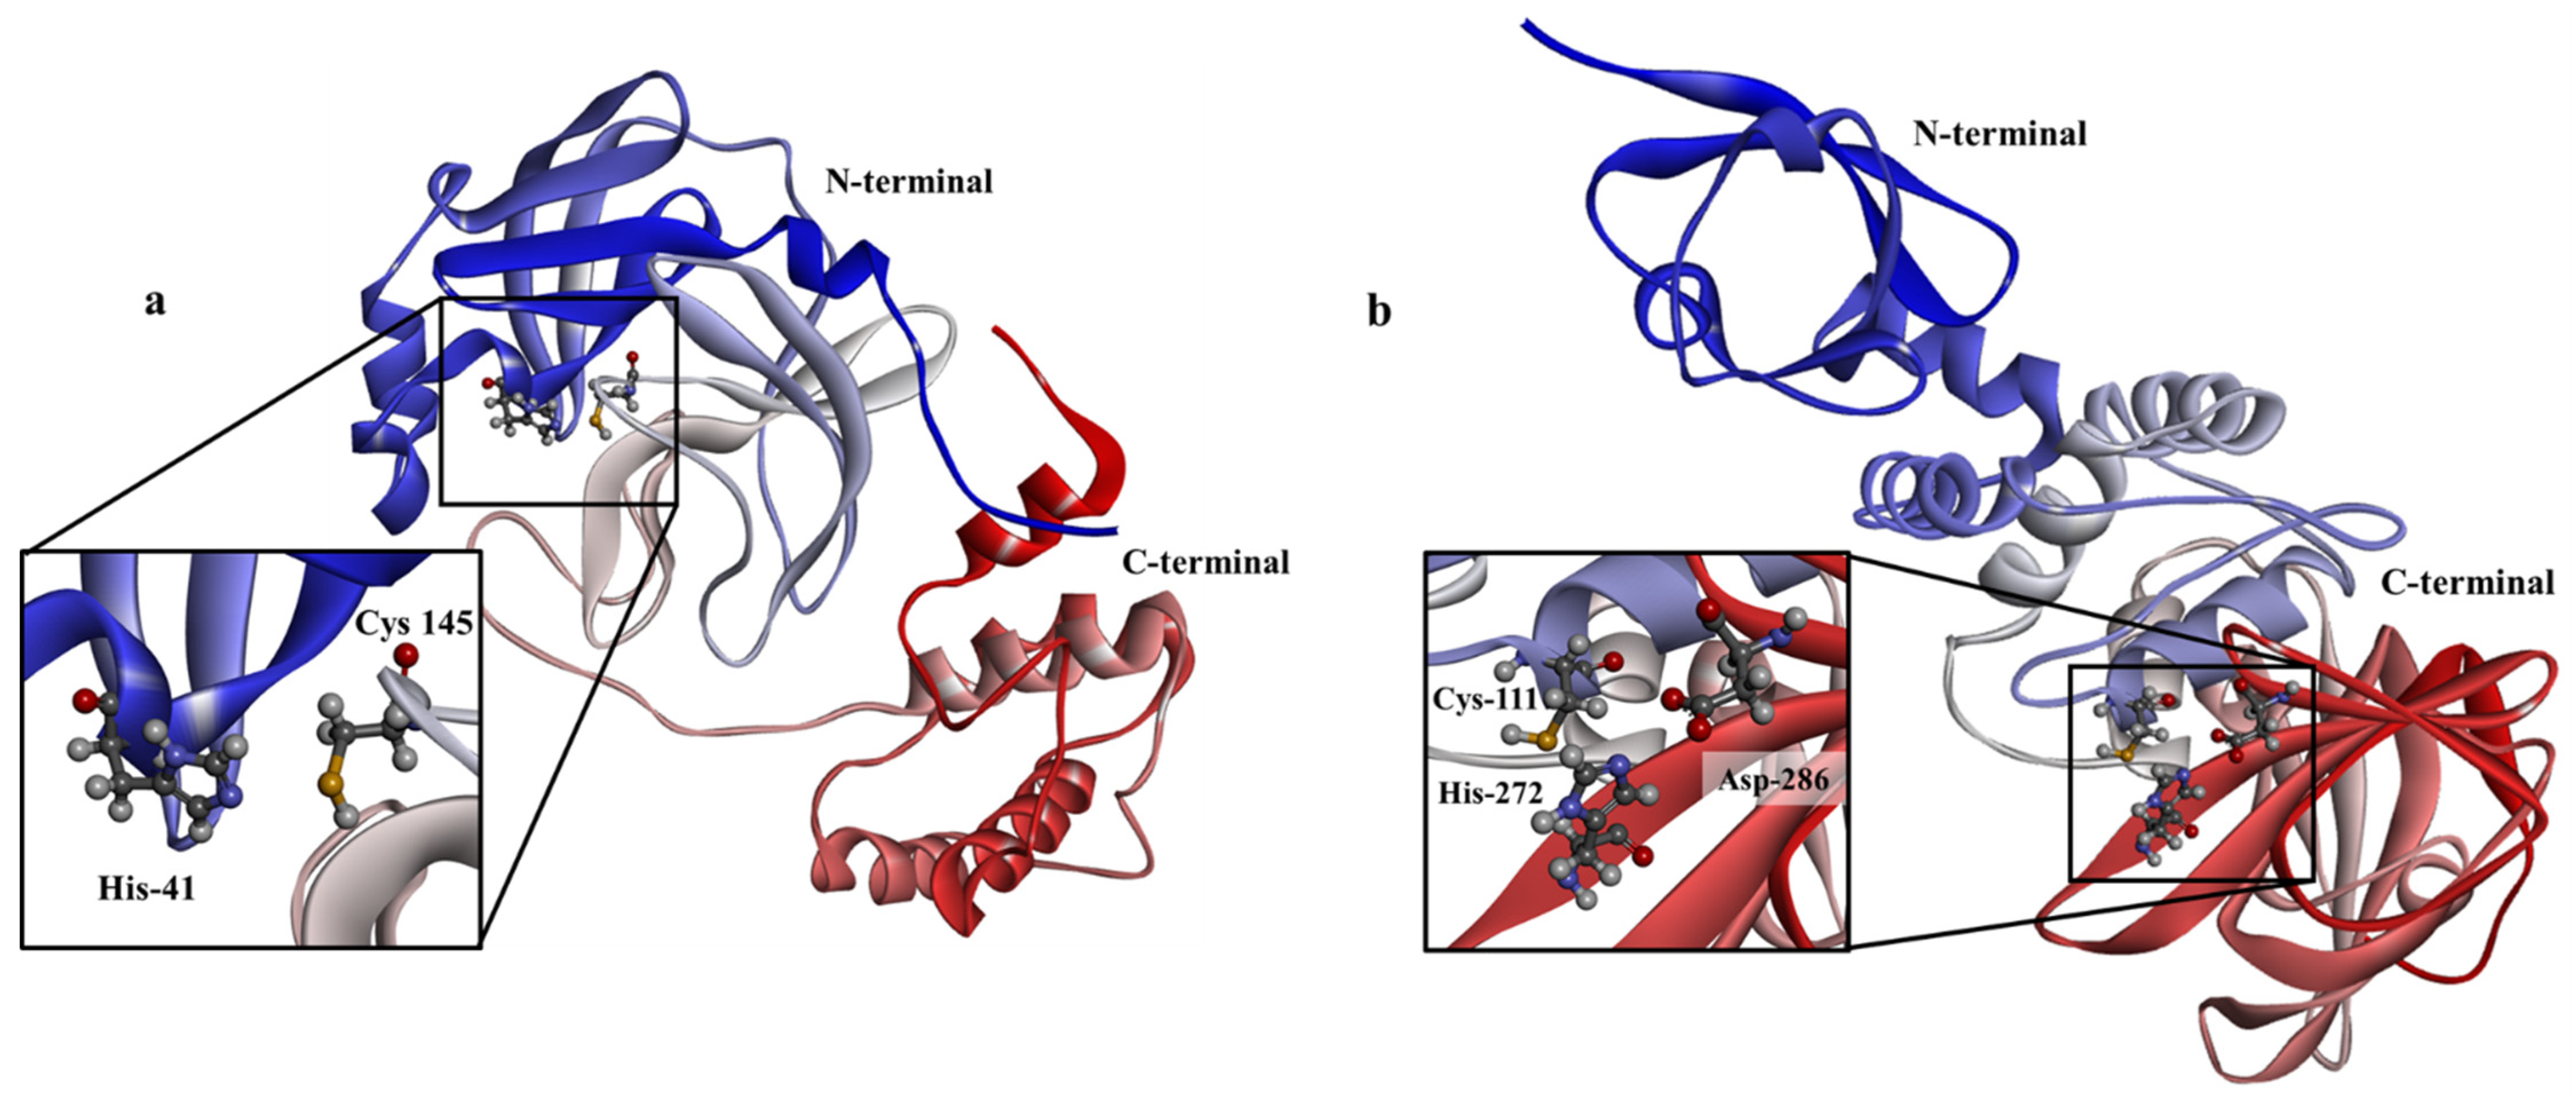
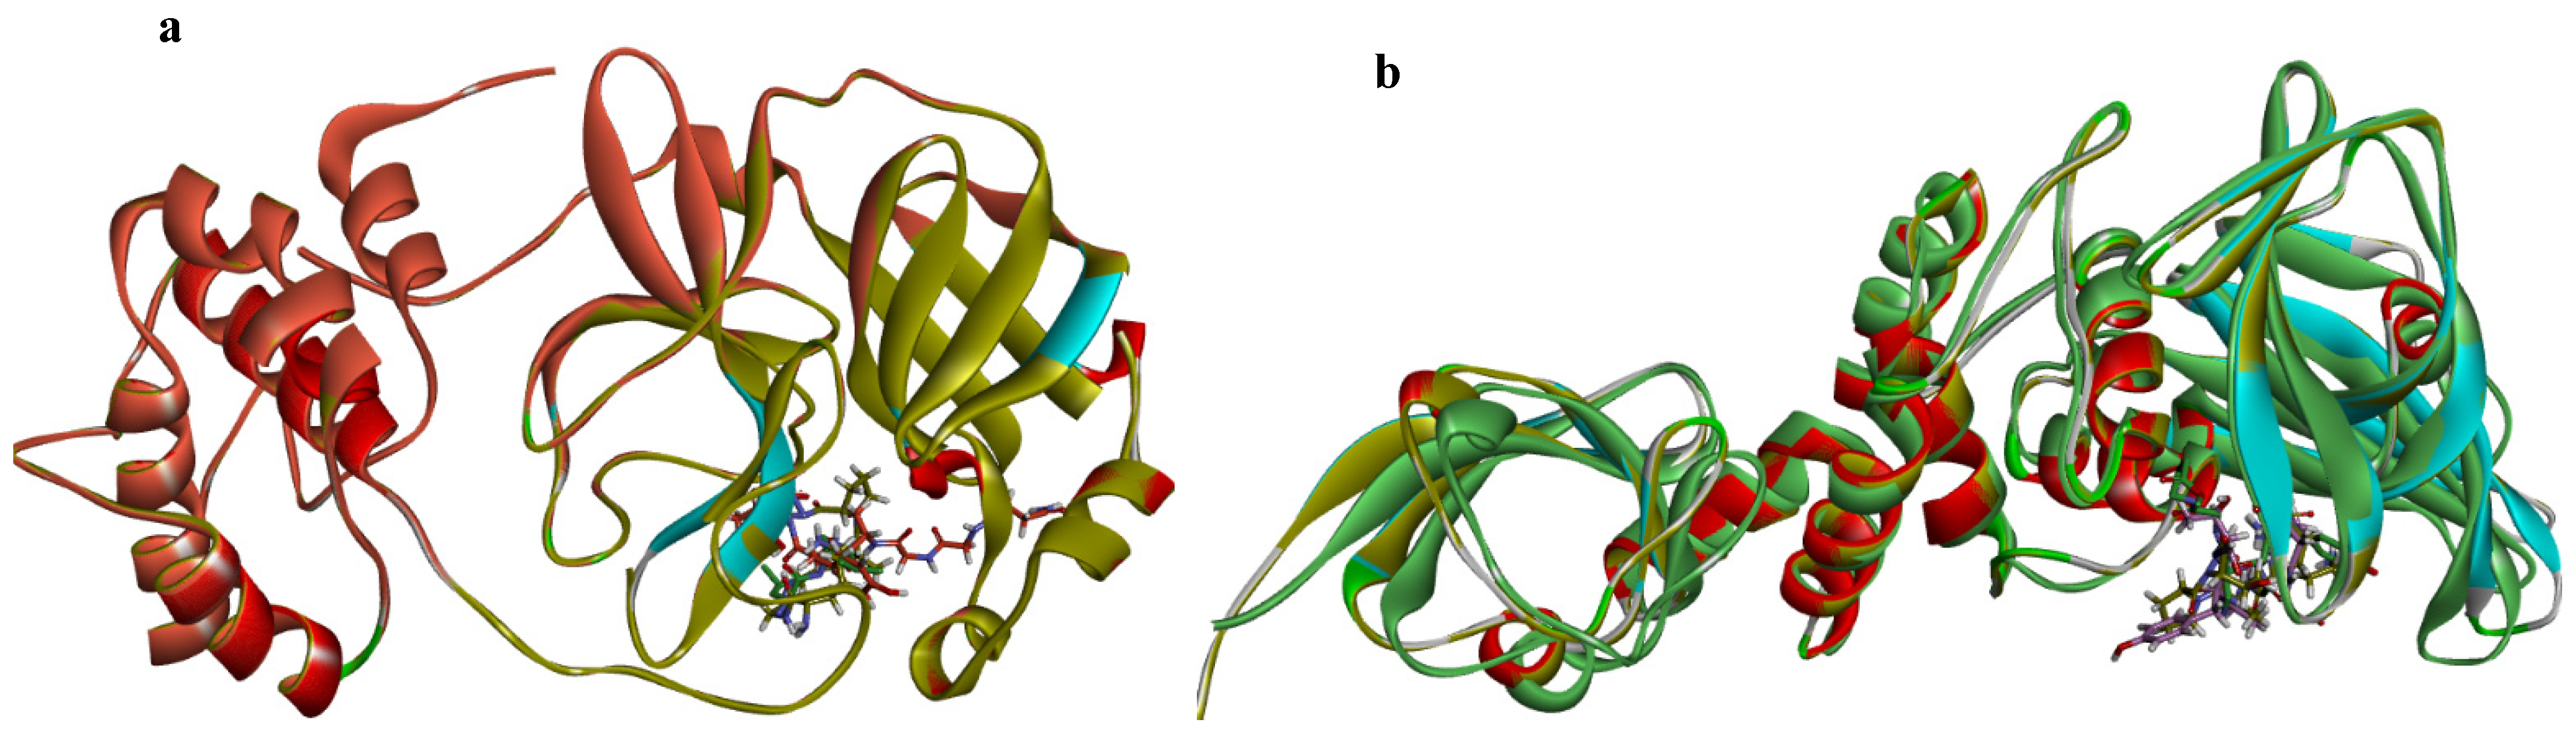
2.1. Docking Validation

The objective of re-docking is to validate the docking procedure, and this was achieved firstly by simply removing the co-crystallized inhibitors from PDB and saving them separately as new inhibitors in PDB format. The co-crystallized inhibitors were then re-docked into the active sites of both proteases (3CLpro and PLpro) using AutoDock Vina 1.2.0 [32], and the same protocol as described previously including search parameters was applied in order to ensure that the inhibitors bind precisely to the active sites.
The re-docked complexes were later superimposed using BIOVIA Discovery Studio [20], first on the native co-crystallized 6XA43 and 6WX4 complexes from PDB. A root-mean-square deviation (RMSD) of less than 1 Å was observed, respectively, validating the docking procedure. Subsequently, the native complexes were also superimposed on the 3CLpro–CS1/CS2 and PLpro–CS1/CS2, making a total of six superimposed amino peptide residues (Table 2 and Figure 2). This proves to an extent the validity and appreciable efficiency of the docking protocol.

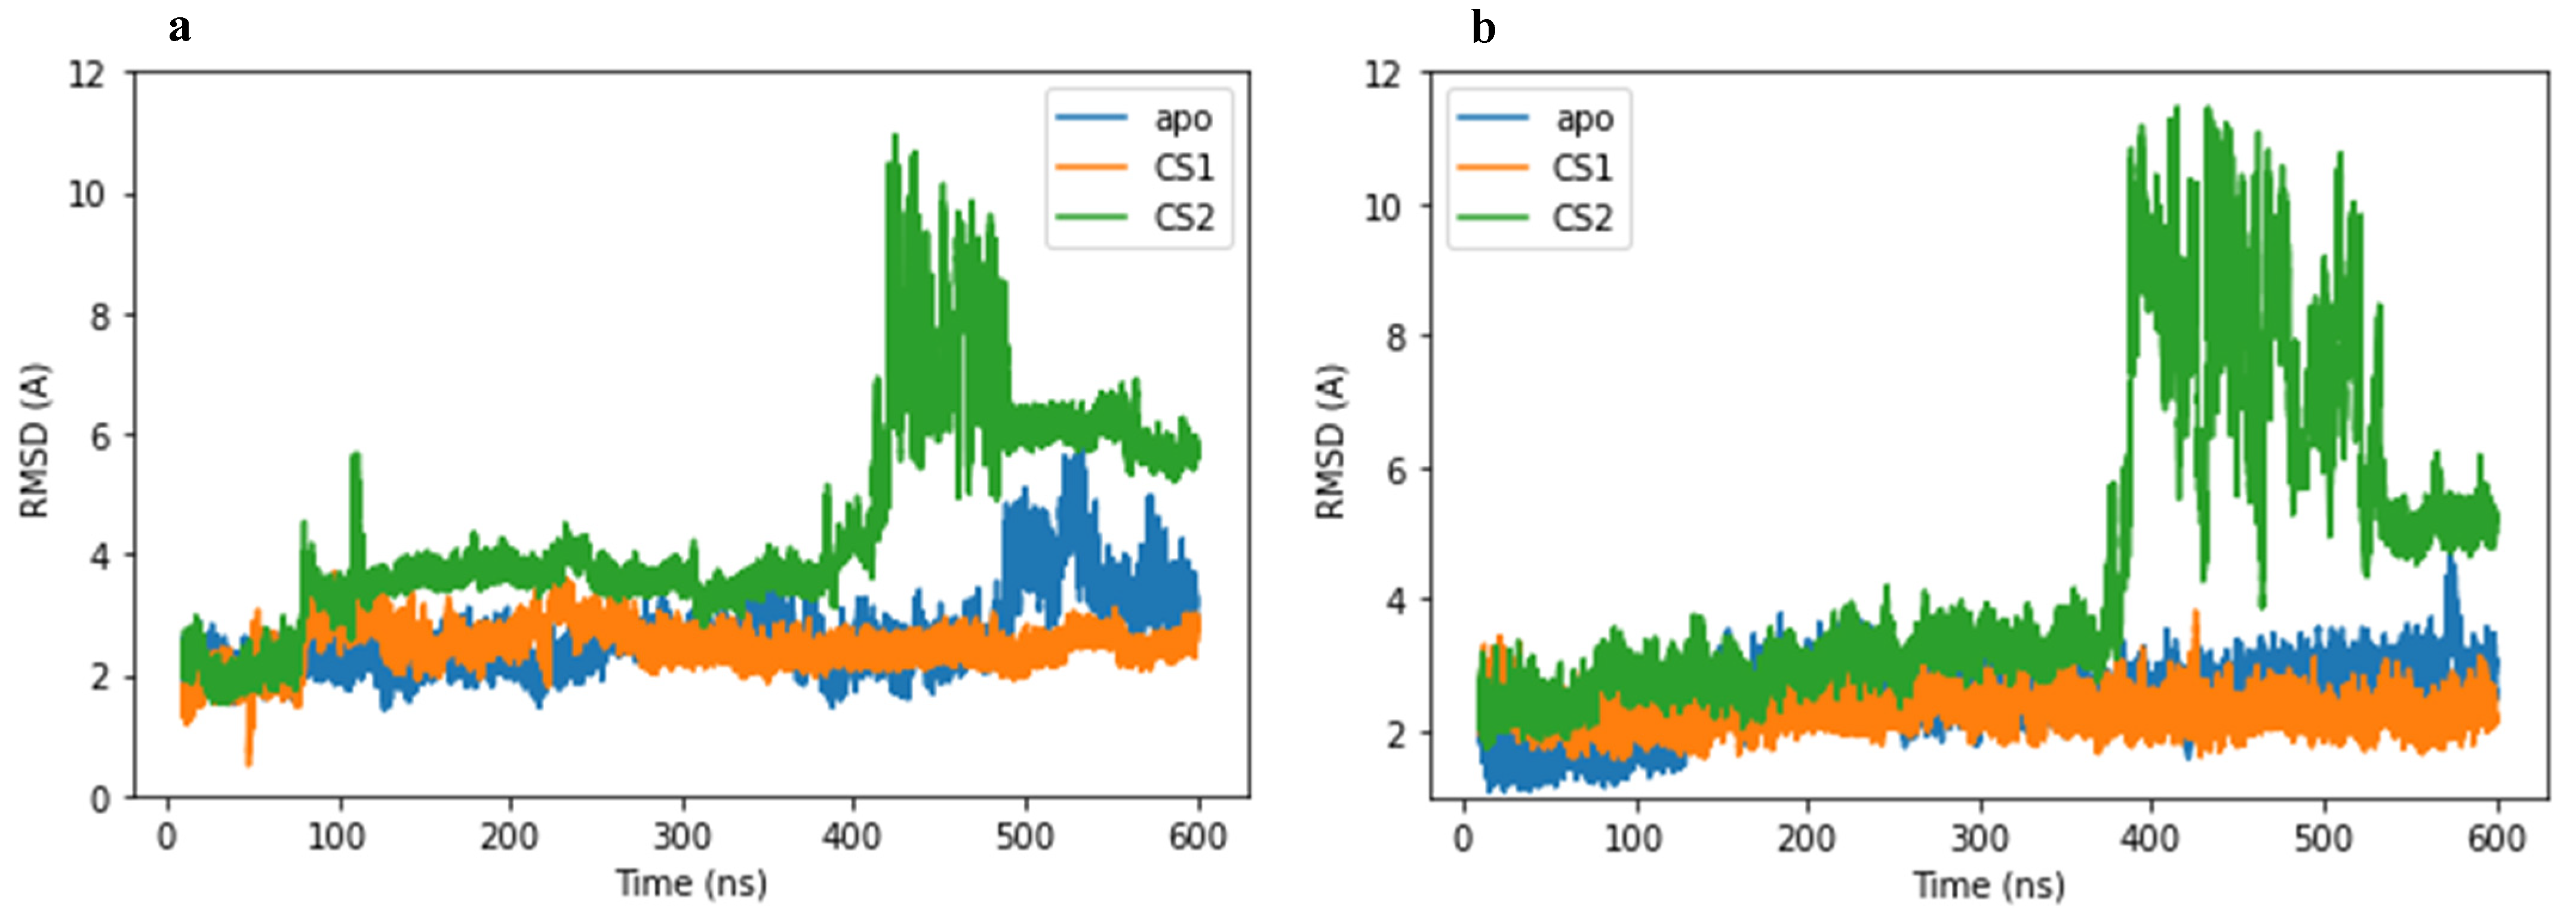
2.2. System Stability

The studied systems, 3CLpro main protease and PLpro papain-like protease in complex with two protein substrates (CS1 and CS2), after 600 ns MD simulations were tested for structural stability using root-mean-square deviation (RMSD) analysis. It is known that the lower the RMSD, the more stable the protein [33]; herein, the 3CLpro and PLpro apo-proteins were considered as control in our MD simulations. The RMSD for the 3CLpro apo-protein was found to increase initially and reached an average of 2.67 Å for the 600 ns simulation; the observed motion between conformations of the 3CLpro main protease suggested the opening and closing of the protease. Similarly, for the PLpro apo-protein, stability was observed during the 600 ns simulation with an average RMSD value of 2.50 Å.
The RMSD values from MD simulation of the protein–ligand complexes studied were based on the alpha carbon backbone for the protein and the ligand together throughout the trajectory. Hence, the 3CLpro–CS1 complex shows stability throughout the simulation at an average RMSD of 2.50 Å; it is therefore possible that the presence of CS1 induces stability in the 3CLpro protease. It is notable to mention that during the 600 ns simulation, the protein substrate (CS1) maintained a reasonable distance to the active site residues (Cys145/His41), implying that the main protease could play a potential role in the cleavage of the CS1 substrate (Figure 3a and Figure S1). The 3CLpro–CS2 complex reached equilibrium around 100 ns into the simulation, and stability of the α-C backbone was observed for the next 300 ns of simulation with an average RMSD value of 4.35 Å. However, a significant deviation was observed after 400 ns, reaching a maximum value of 10.0 Å, indicating that destabilization occurs at this point in the simulation (Figure 3a). This major deviation is a result of the presence of CS2 protein substrate as evidenced by the lack of this destabilization in the apo-3CLpro case. It is also worth mentioning that the CS2 substrate moves from the active site, and this suggests the unlikelihood of cleavage of the CS2 substrate by 3CLpro in accordance with the literature [5,8] (Figure S2).
In the case of the PLpro–CS1 complex, stability was observed throughout the 600 ns of simulation with no considerable deviation and with an average RMSD value of 2.30 Å. The behavior was similar to the 3CLpro–CS1 complex, where the presence of CS1 again further increased the stability of the PLpro protease. Likewise, during the 600 ns simulation, the protein substrate (CS1) retained proximity to the active site (Cys 113/His 274/Asp 288); this observation supports that cleavage of the substrate CS1 can occur with this protease (Figure 3b and Figure S4). Finally, for the PLpro–CS2 complex, an initial stability evidenced by a constant initial RMSD value of approximately 4.42 Å is apparent; however, a significant deviation occurred around 400 ns with an increased RMSD value of 10.75 Å (Figure 3b). This destabilization was associated with the loss of the CS2 substrate from the active site (Figure S5). Given that there is literature evidence for cleavage of CS2 by PLpro, it may be that the rate of proteolysis by the papain-like protease is different for the cleavage of both CS1 and CS2 since we observe exchange during dynamics of the CS2 substrate. Overall, the protein substrates (CS1 and CS2) behave similarly in both the 3CLpro and PLpro proteases.
Comparison of all the complexes shows that the RMSD of the systems is stable in the region from 100 ns to 400 ns during MD simulations. Therefore, the binding affinity was considered in this region of dynamics for all the complexes.

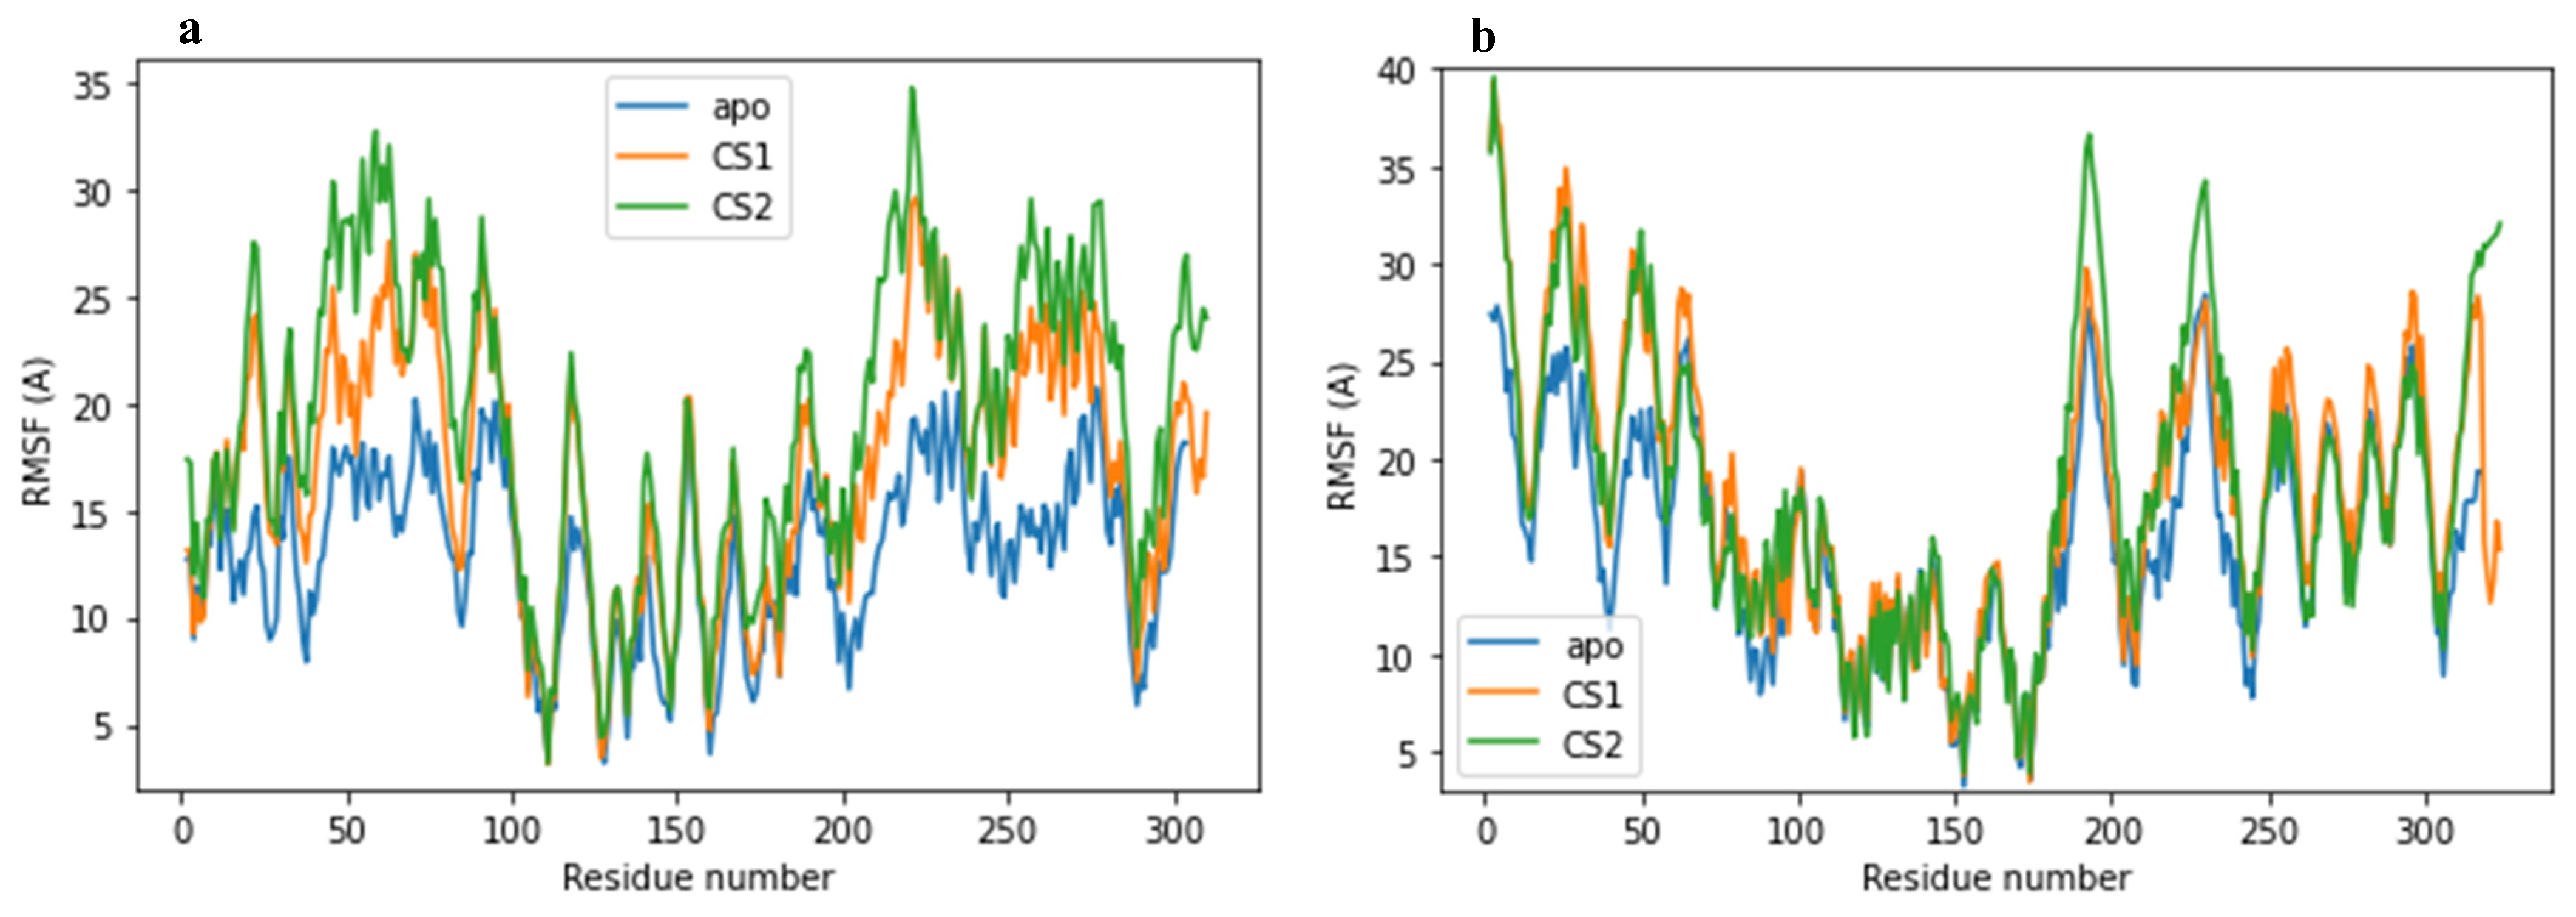
2.3. Structural Flexibility

The structural flexibility of the complexes was measured using the root-mean-square fluctuation (RMSF) parameter, defined as the residual fluctuation of every single atom about its average position [34]. All residual fluctuations were examined, with average RMSF values of 12.95, 17.00 and 19.38 Å for apo-enzyme, CS1 and CS2 in complex with the 3CLpro main protease; an average RMSF value of 15.96, 18.44 and 18.78 Å was observed for apo-enzyme, CS1 and CS2 in complex with the PLpro papain-like protease, respectively. Distinct residue fluctuations were observed for the loops and domains of 3CLpro [34] in the presence of the non-structural protein substrates (CS1 and CS2). While the RMSF suggests no significant protein functional difference for the apo-PLpro, CS1 and CS2 complexes. It can be observed from both RMSF graphs that the 3CLpro/PLpro–CS2 exhibits a higher level of fluctuations for both systems. Comparing all four complexes, the predominant motion by which 3CLpro/PLpro proteases could “pull” CS1 and CS2 substrates closer is more pronounced for CS2, indicative of poor/less interaction with their active sites, respectively, and possibly lower binding free energy against CS2 for the PLpro protease. This characteristic was monitored over the simulation time as shown in Figure 4a,b.

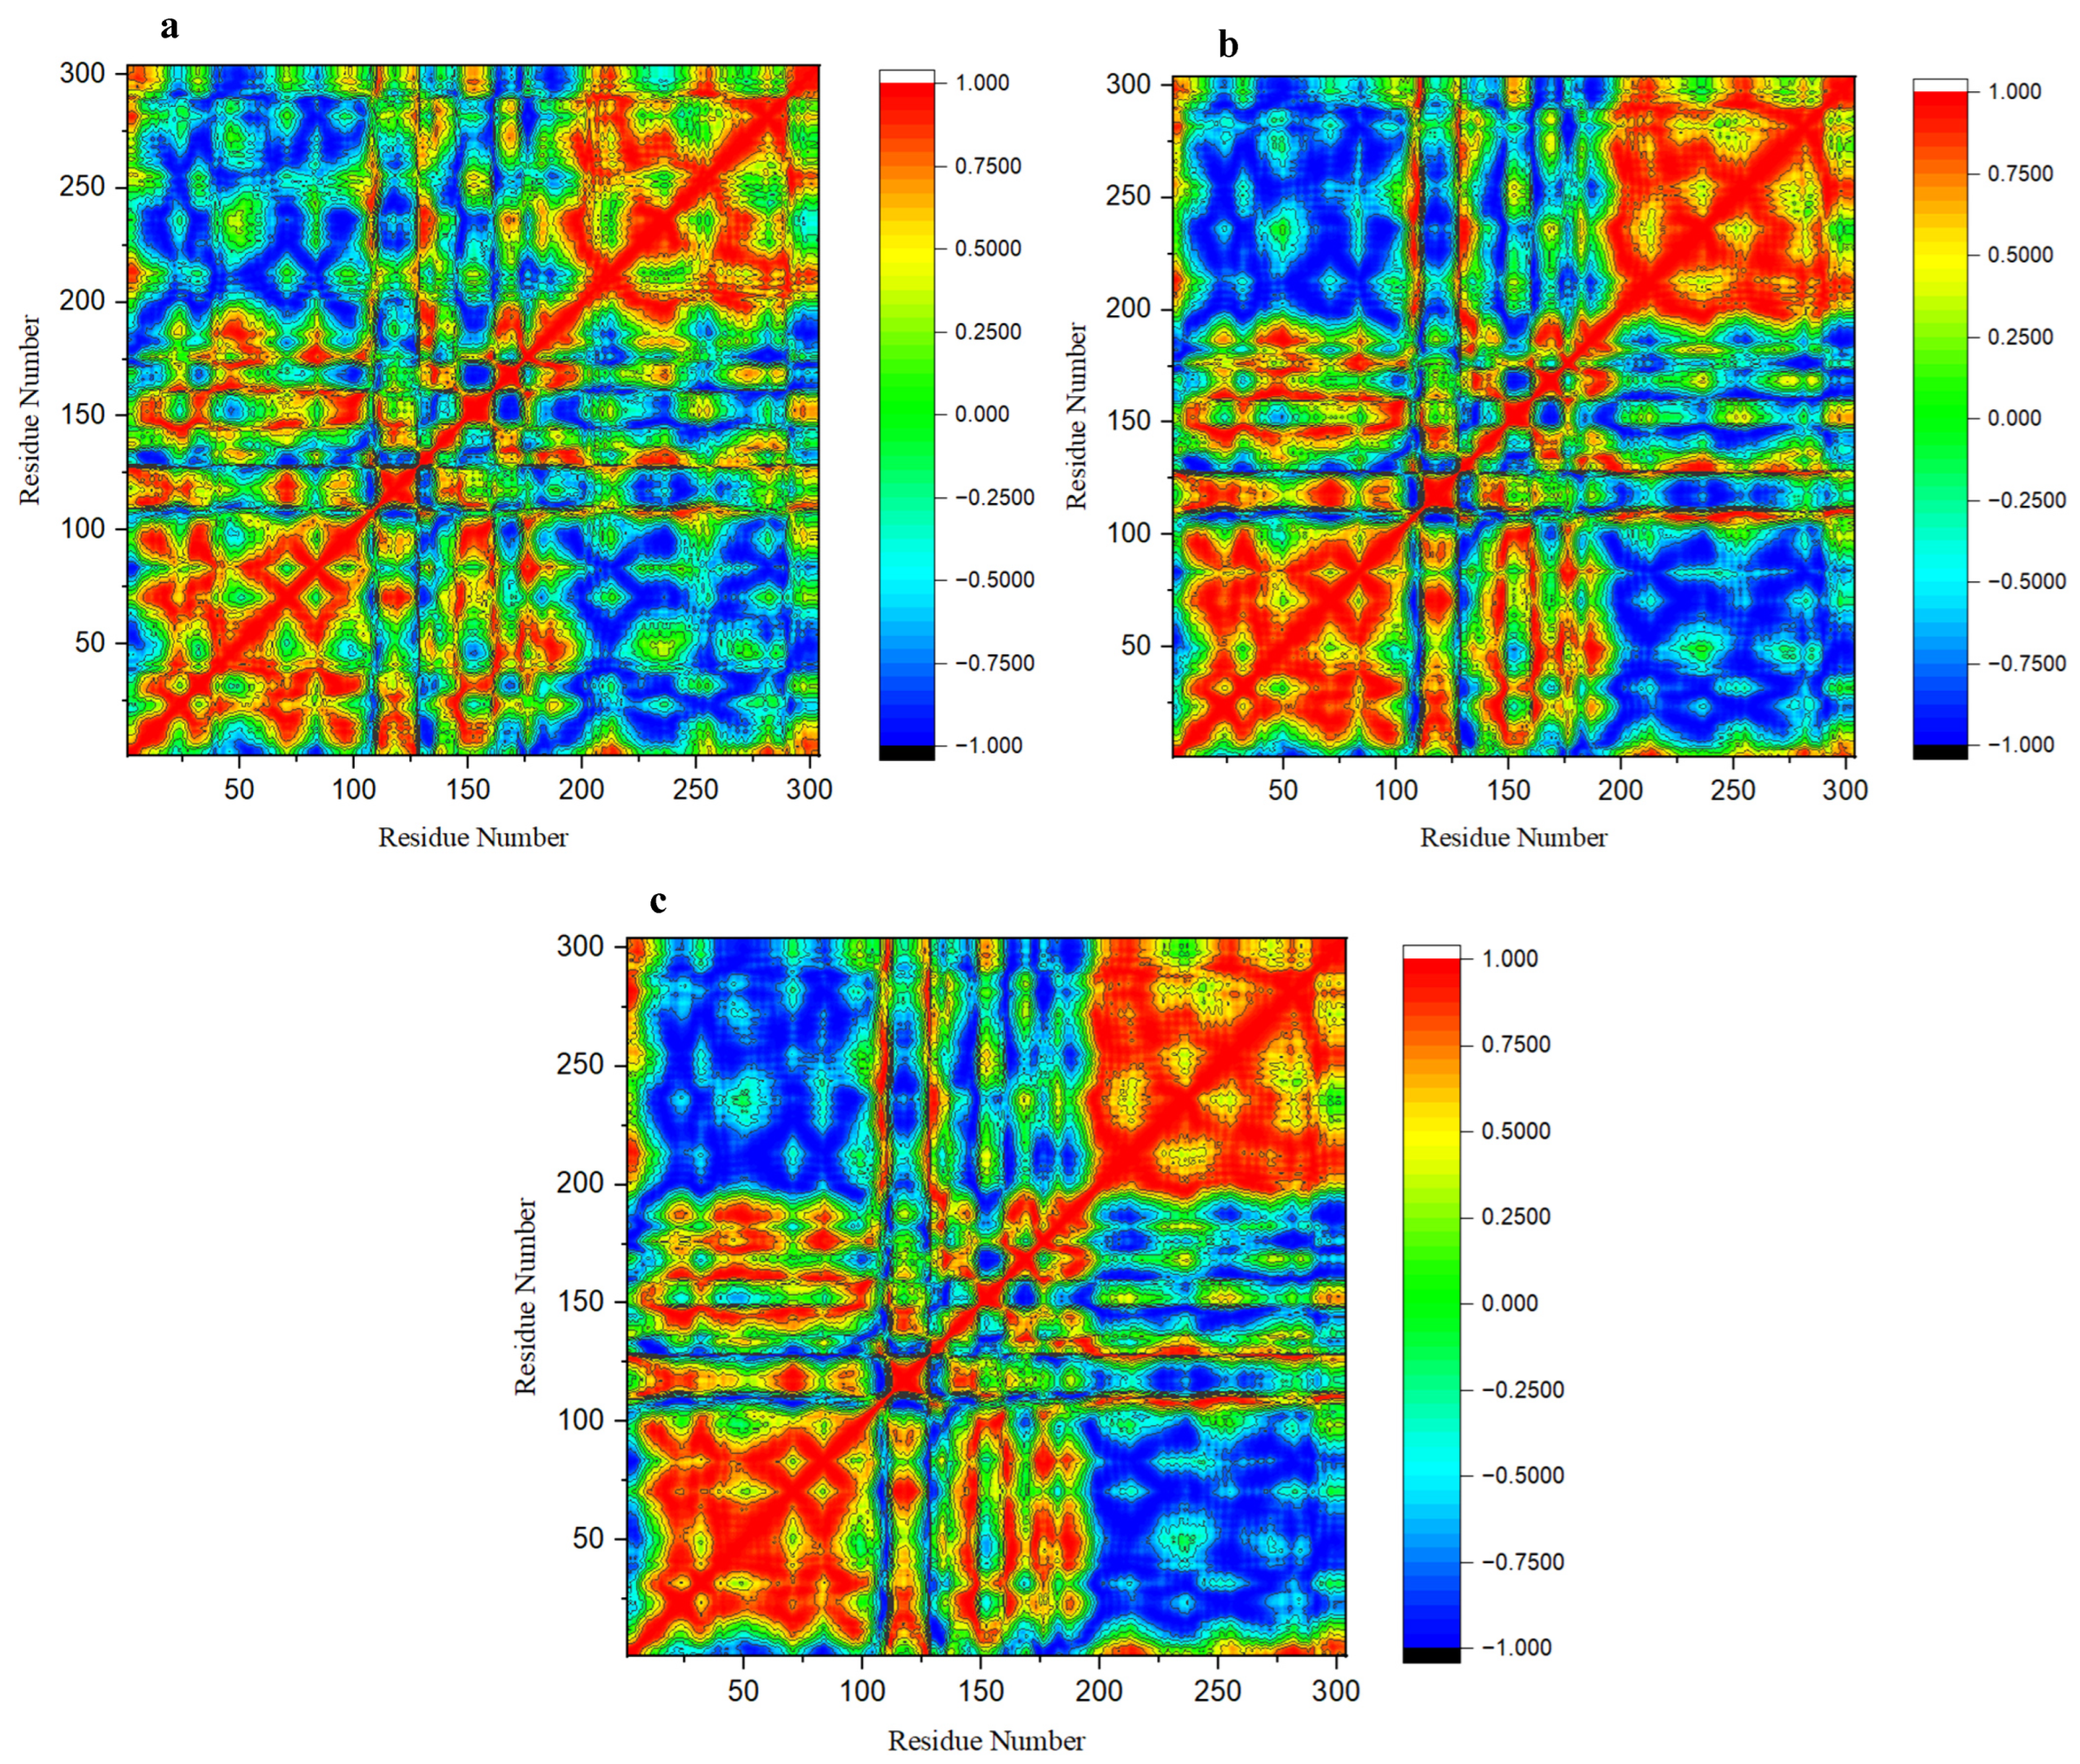
2.4. Dynamic Cross-Correlation Matrix (DCCM)

Further analysis of the conformational changes of the 3CLpro/PLpro proteases upon CS1 and CS2 binding was performed by computing the DCCM on the α-carbon atom positions, and this analysis allows the examination of the protein dynamics and available correlated motions. The DCCM of the backbone α-carbon atom variations within the complexes is represented in Figure 5 and Figure S7. The graph shows correlated (highly positive, 0.7500–1.000) and anti-correlated motions (highly negative, −0.7500–−1.000) of specific residues. In the case of 3CLpro protease, it was observed that the presence of both CS1 and CS2 protein substrates affects the DCCM of the 3CLpro apo-protein, where the active site residues are more anti-correlated and other residues of the protease show a more correlated motion. However, for the PLpro protease, the protein substrates (CS1 and 2) have no significant effect on the DCCM of the PLpro apo-protein (Figure S7). This could establish the observations from the literature that the papain-like protease is identified for cleavage at these points [23,26]. However, for the PLpro protease, the substrates (CS1 and 2) have no significant effect on the DCCM of the PLpro apo-protein.

2.5. Radius of Gyration

The radius of gyration (RoG) is a parameter used to determine the structural compactness of the studied systems. RoG values for all complexes (apo-3CLpro/PLpro, 3CLpro/PLpro–CS1 and 3CLpro/PLpro–CS2) are shown in Figure 6a,b. A more compacted and stable structure was observed for the CS1 complex with both 3CLpro and PLpro proteases. RoG values were mostly stable for the first 400 ns MD simulation, which was followed by a slight fluctuation in the presence of CS2 for both 3CLpro and PLpro proteases and then became stable indicating MD simulation reached equilibrium and compact structures. The average values for apo-3CLpro main protease, 3CLpro–CS1 and 3CLpro–CS2 complexes are 22.09, 22.06 and 22.07 Å, respectively, while for the apo-PLpro papain-like protease, PLpro–CS1 and PLpro–CS2 complexes, they were 24.12, 23.95 and 24.21 Å, respectively. The RoG values are approximately similar to each other which clearly indicates that there are only moderate conformational changes during the simulation [35,36]. In addition, the difference in/lower RoG value of 3CLpro/PLpro–CS1 complexes could reveal that the CS1 protein substrate binds better to both proteases than CS2.

2.6. Binding Free Energies
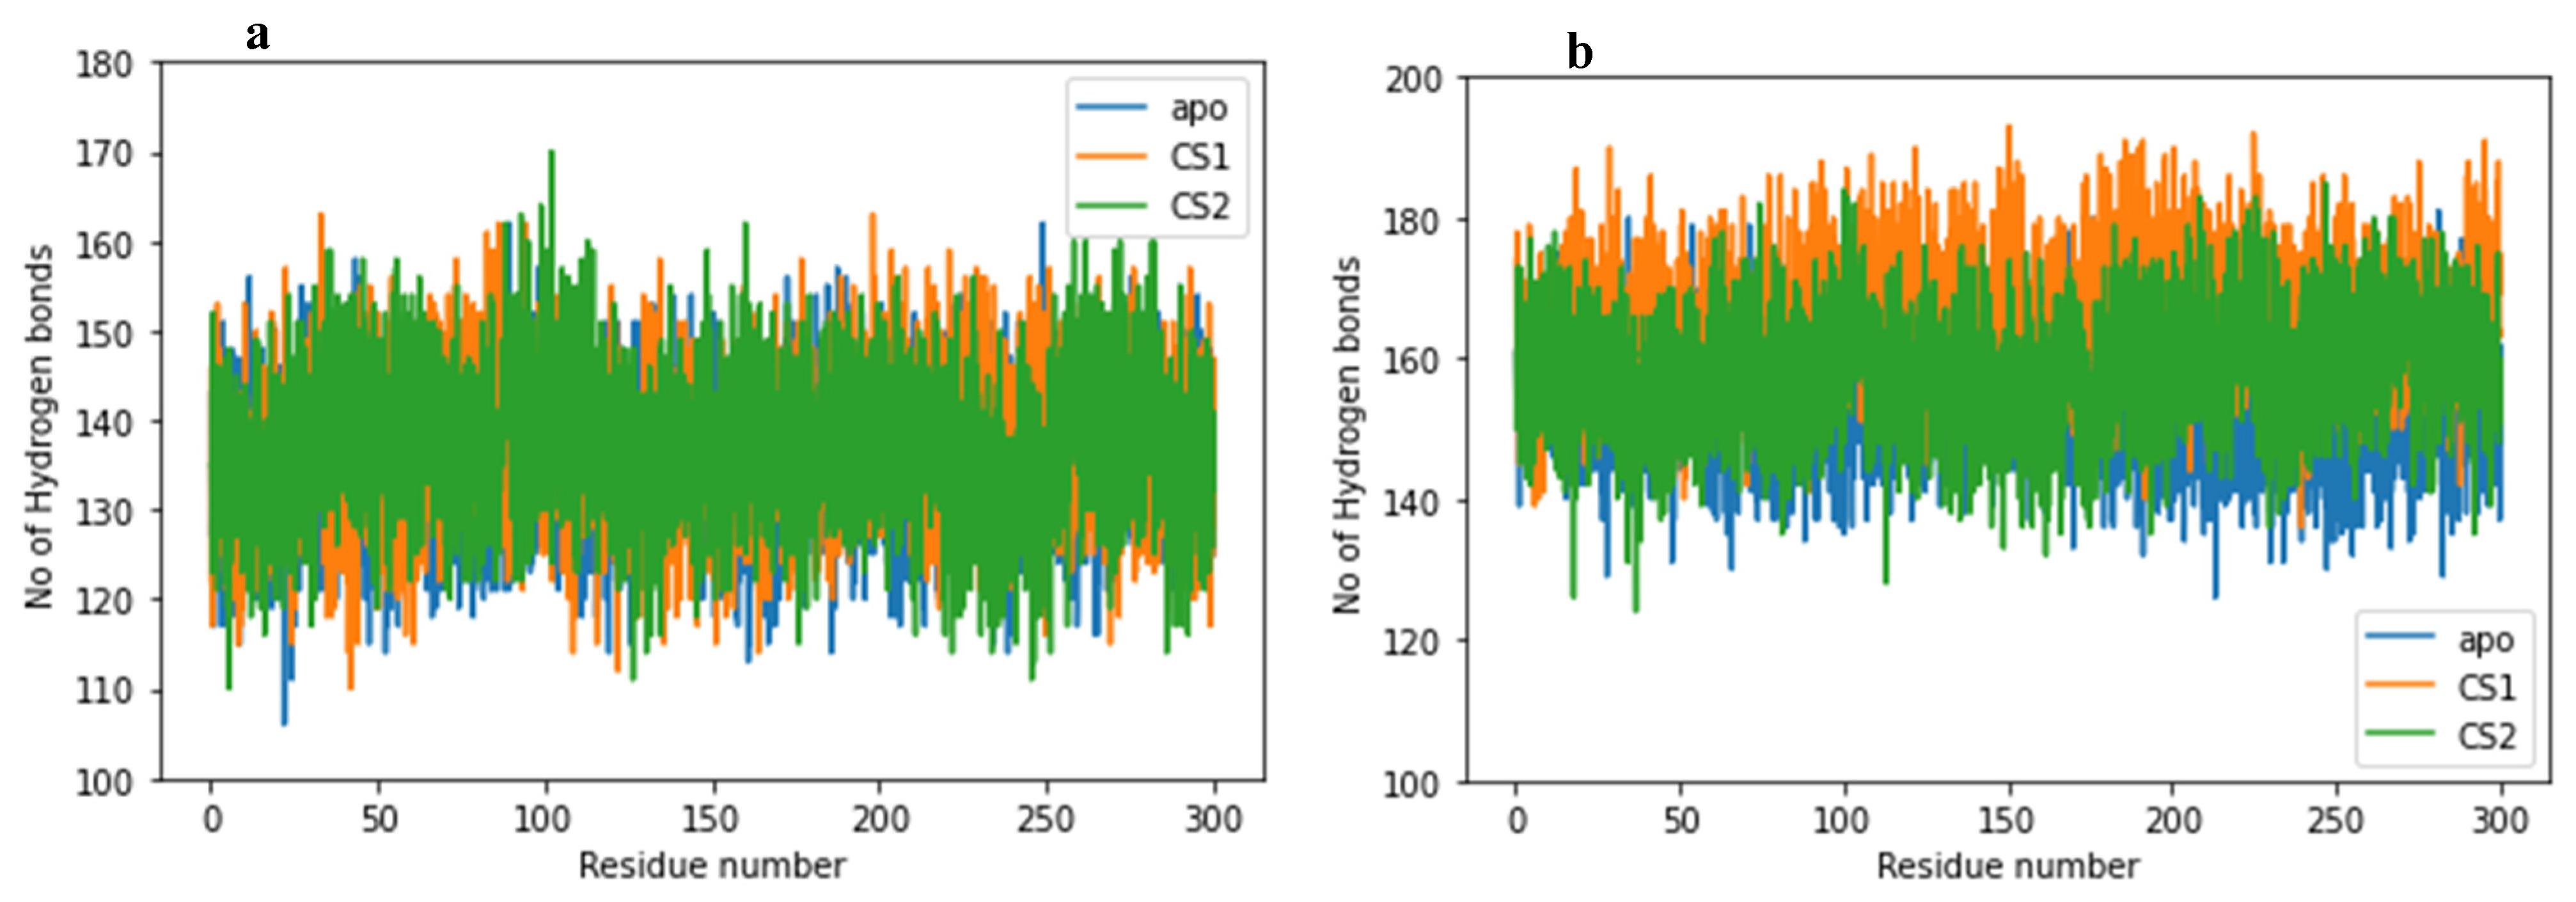
The binding affinities of the protein substrates (CS1 and CS2) were estimated toward the 3CLpro main protease and PLpro papain-like protease, in the range of 100 ns to 400 ns (due to reasons mentioned above). The MM/PBSA algorithm evaluates energies through trajectory snapshots extracted from a system MD production run; the estimated energy functions and the binding free energies are shown in Table 3. A highly negative result denotes a favored ligand binding, i.e., the more negative the interacting energy, the better the ligand selectivity and affinity for the protease. Snapshots were taken within the range of 400 ns trajectories to determine the MM/PBSA energies, and it was observed that both CS1 and CS2 have relatively similar binding affinities toward the 3CLpro protease at −10.10/−10.23 kcal mol−1. Interestingly, the docking score, RMSD and RMSF analysis indicates a remarkable binding for 3CLpro–CS1. Based on the aforementioned observations, it is possible that the CS2 is binding with strength to a different site from the active site of the 3CLpro main protease, which further establishes the non-possibility of the main protease cleaving the CS2 protein substrate [5,8]. While only CS1 shows a more favored binding affinity toward the PLpro protease with a binding energy value of −15.83 kcal mol−1, the difference between binding of the PLpro–CS1 and PLpro–CS2 is −14.31 kcal mol−1 which is very high, indicative of the loss of the CS2 protein substrate (less interaction) in the active site. The observed lower RoG values for 3CLpro–CS1 and PLpro–CS1 22.06/23.95 Å, respectively, could potentially indicate a lengthier inhibitor residence time in the binding sites. It can also be seen from Table 3 that the electrostatic contribution is crucial in driving the total binding energies of the complexes in comparison to the van der Waals energies. Likewise, the computed ΔGgas values for all the complexes are high but relatively low (−9.31 kcal mol−1) in the 3CLpro–CS1 complex, showing a more hydrophilic interaction, and this could contribute to its binding affinity and possible cleavage of the CS1 by the 3CLpro protease.
Although there is no experimental value for these protein substrates from the literature, the binding energy value for N3 in complex with 3CLpro −42 kJ mol−1 (−10.0 kcal mol−1) has been estimated theoretically [37], which is comparable with the computed binding energies for 3CLpro–CS1/CS2 in this study.

2.7. Hydrogen Bonds

Hydrogen bonds promote molecular interaction, protein–ligand interaction and binding. The presence of hydrogen bond formation between amino acid residues is an important factor in determining the stability of the amino acids. Therefore, we measured the hydrogen bond formed during the 600 ns MD simulation time and graphically represent it in Figure 7a,b.
The 3CLpro apo-protein, 3CLpro–CS1 and 3CLpro–CS2 complexes exhibit a relative average H-bond formation of 135.66, 136.92 and 137.18, respectively. The higher average H-bond formation observed for the 3CLpro–CS2 is comparable to its binding energy where the CS2 is predicted to bind with strength to a different site of the 3CLpro main protease, whereas the PLpro apo-protein, PLpro–CS1 and PLpro–CS2 complexes show an average H-bond formation of 153.82, 165.79 and 158.23, respectively. The relative decrease in the H-bond formation for the PLpro–CS2 could be a response from the loss of the CS2 from the active site which invariably affects its binding strength. H-bond reduction could result in structural destabilization and conformational changes which affect the binding affinities of drug/protein substrates. To further assess the relative stability of the studied complex systems, the H-bond distances and occupancy were monitored throughout the simulation time, and the results are presented in Table 4.
In the 3CLpro–CS1 system, CYS 144 exhibits H-bond occupancy of 54.42% with an average H-bond distance of 2.87 Å at an angle of 157.75°, while CYS_144 in 3CLpro–CS2 exhibits a higher H-bond occupancy of 56.41% with an average H-bond distance of 2.88 Å at an angle of 158.46°. In contrast, HIE 40 in 3CLpro–CS1 shows 28.89% higher H-bond occupancy, with a relative H-bond distance of 2.91 Å at an angle of 154.64°, and 3CLpro–CS2 shows a 15.23% H-bond occupancy with an H-bond distance of 2.92 Å at an angle of 156.07°. Both HIS 40 and CYS 144 are prime active site residues in 3CLpro, which contributes effectively to the ligand binding having high H-bond occupancy (Table 4).
However, for the active site residues CYS 113, HIS 274 and ASP 288 in the SARS-CoV-2 PLpro for CS1 substrate, we record an H-bond occupancy of 75.14% (2.83 Å—H-bond distance), 28.32% (2.91 Å—H-bond distance) and 42.95% (2.82 Å—H-bond distance), respectively, while for CS2 substrate, CYS 113, HIS 274 and ASP 288 exhibit an H-bond occupancy of 77.47% (2.79 Å—H-bond distance), 35.22% (2.90 Å—H-bond distance) and 44.35% (2.82Å—H-bond distance), respectively (Table 4). The different H-bond occupancy and angle recorded for the different residues of the protease substrates (CS1 and CS2) in the various active site conformational space could be responsible for their binding energies, which eventually determine the mechanism of proteolysis.

3. Materials and Methods

3.1. System and Ligand Preparations

The X-ray co-crystal structure of 3CLpro main protease (PDB ID: 6XA4) [18] and PLpro protease (PDB: 6WX4) [19] were obtained from Protein Data Bank (PDB) at 1.41 Å and 1.66 Å resolutions for molecular docking calculations. The proteins were prepared by isolating the co-crystalized ligands and water molecules present using the graphical user interface (GUI) of BIOVIA Discovery Studio [20]; in the case of 3CLpro, chain A was isolated for docking. The enzyme was saved in PDBQT format after the addition of hydrogen atoms. The protein substrate sequences (CS1 and CS2) were built from a Jupyter notebook, and the structures were optimized within the notebook using the Universal forcefield (UFF) [38]; these were also converted to PDBQT format after the addition of hydrogen atoms so as to be ready to be used for molecular docking (Figure 8).

3.2. Molecular Docking

The molecular docking procedure for all complexes (3CLpro/PLpro–CS1 and 3CLpro/PLpro–CS2) considered in this study involves the pose assessment and binding energy prediction using Autodock Vina 1.2.0 [32]. The Gasteiger partial charges algorithm [39] was used to assign atomic charges to both the ligand and protein from AutoDock that is provided by MGL tools 1.2.0 while utilizing AutoDock atom types for outlining both the ligand and protein. The grid box was set with centers x = 20.29 Å, y = 73.09 Å and z = 13.05 Å for PLpro protease and x = 11.06 Å, y = −0.36 Å and z = 22.24 Å for 3CLpro protease, while a search space of 40 Å was set for all (x, y, z) dimensions, and the Vina exhaustiveness was set to 4000. The selected dimensions allowed for the peptide structures of CS1 and CS2 to be contained in the protein complex. Several docking runs were performed using the Lamarckian genetic algorithm [39] in AutoDock Vina 1.2.0 to assess reproducibility of the docking procedure. The docked conformations with the stable and highest binding energies (−9.1 kcal mol−1 for CS1 and −6.7 kcal mol−1 for CS2) were selected for molecular dynamics (MD) calculations involving the 3CLpro main protease, while the highest and stable docked conformation for CS1 −7.1 kcal mol−1 and CS2 −6.8 kcal mol−1, respectively, were selected for the MD calculations complex with the PLpro protease. The docking process was validated by re-docking the co-crystalized inhibitor from PDB which was then superimposed on the native co-crystal protein complexes from PDB.

3.3. Molecular Dynamics Simulations

Before performing MD simulations, the H++ server [40] was used in assigning protonation states for the protein. The restrained electrostatic potential (RESP) method was used to fit the charges of the protein substrate (CS1 and CS2) at the HF/6-31G* level of theory/basis set using Gaussian16 package [41]. Afterward, MD simulations were carried out by adding missing atoms to the complex (SARS-CoV-2 3CLpro/PLpro–CS1 and SARS-CoV-2 3CLpro/PLpro–CS2) systems using the Leap module implemented in the AMBER 18 MD package [42]. All systems considered in this study were solvated using an octahedral TIP3P water box [43], extending at 12 Å outside the protein on all sides to maintain a constant and acceptable system solvation throughout the simulation. Counterions were added and positioned around the protein to ensure the system was neutralized, and both the protein and natural substrate ligands were described using the AMBER force field 16SB [44,45].
The complexes were first energy-minimized at 5000 minimization steps of each steepest descent and conjugate gradient methods, while a restraint of 20 kcal mol−1−2 was applied to the backbone atoms of both protein and natural substrate peptide residues. Gradual heating of the system was performed from 0 to 300 K using the Langevin thermostat [46] at a constant volume over 1000 ps, with 10 kcal mol−1−2 restraints on the backbone atoms. Subsequently, equilibration of the systems was performed at a constant pressure for 1000 ps at 300 K, with harmonic restraint of 5 kcal mol−1−2, which was later relaxed using weak restraints of 2 kcal mol−1−2 on only the backbone atoms. All the simulation steps which involve partial and full minimizations, heating and equilibration utilized a non-bonded cutoff of 8 Å. Particle mesh Ewald (PME) was used in calculating the long-range Coulomb forces, and the time step was set to 2 fs, while the SHAKE algorithm [47] was used to constrain the bond length between the heavy atoms and hydrogen atoms to its equilibrium value during the MD simulations. Post dynamics analysis, which includes RMSD, RMSF, RoG, hydrogen bonding and DCCM, was performed after the MD simulations using CPPTRAJ modules in AMBER 18. The trajectories were visualized using Chimera 1.16 software [48], and plots were generated using Matplotlib graphics [49].

3.4. Post-Simulation Analysis and Thermodynamics Calculation

3.4.1. System Stability

The system stability is assessed by evaluating the conformational backbone changed via the root-mean-square deviation (RMSD) calculation. The RMSD trajectory of the protein backbone alpha carbon (Cα) was generated with the CPPTRAJ module according to Equation (1) (Equation (1)).
R M S D ( v , w ) = 1 n i = 1 n | | v i w i | | 2  
In Equation (1), the standard deviation between two amino acids v and w is calculated according to the interatomic distance where vi and wi are the coordinates of Cα atom in v and w at the time i, respectively, over n frames. To measure the molecular stability of biological systems, the radius of gyration was employed, which is the moment of Cα atom inertia from its center of mass. The RoG is the square root of the inertia moment (I) divided by mass (m) Equation (2). The parameter was generated using the CPPTRAJ [50] module implemented in the AMBER 18 suite.
I = m R 2  

3.4.2. Dynamics Conformation

The root-mean-square fluctuation (RMSF) and dynamic cross-correlation matrix (DCCM) were estimated for the 3CLpro/PLpro–CS1 and 3CLpro/PLpro–CS2 complexes. This analysis facilitates the study of the conformational changes induced by the protein substrate (CS1 and CS2) binding. The RMSF prediction approach followed by the CPPTRAJ module is represented in Equation (3), where xi(j) denotes the ith Cα atom position in the jth model structure, and (xi) represents the averaged location of the ith Cα backbone atom in all models.
R M S F = 1 n j n | x i ( j ) ( x i ) | 2  
Cross-correlation of protein residues is predicted through 3D contour graphics that show time-correlated data across the residues [51]. To examine the dynamics induced by CS1 and CS2, the DCCM was estimated. This analysis helps in predicting the cross-correlated shifts that occur in the protein Cα backbone (Equation (4)), and outputs were generated using the CPPTRAJ module available in the AMBER 18 program.
C i j = Δ r i     Δ r j / ( Δ r i 2 Δ r j 2 ) 1 / 2  
Note that ∆ri and ∆rj symbolize the shift of ith and jth atoms from the average, respectively, while i and j denote the ith and jth Cα residues. The Cij parameter ranges from −1 to +1, and the higher and lower bounds indicate the best correlated (+) and anti-correlated (−) motions for the simulation.

3.4.3. Binding Free Energy Calculations

To provide detailed information on the interaction between the enzyme and protein substrate, the binding energies were calculated, and this was achieved by utilizing the molecular mechanism integrated with the Poisson–Boltzmann (MM-PBSA) method [52]. From the MM-PBSA approach, the binding free energies were obtained for both 3CLpro/PLpro–CS1 and 3CLpro/PLpro–CS2 complexes. This analysis provides a better understanding of various energy contributions such as entropy and enthalpy of the molecular recognition [52,53]. For 600 ns trajectories, we considered 1000 snapshots during the binding free energy calculation. Equations (5)–(8) below are used to describe the enzyme–substrate binding free energy (∆Gbind) and its components for each molecular species (complex, protein and ligand).
Δ G bind = G complex G receptor G ligand
Δ G bind = E gas + G sol TS  
E gas = E int + E vdW + E ele
G sol = G GB + G SA
In Equations (5)–(8), the parameters Egas, Eint, Eele and Evdw denote the gas-phase energy, internal energy, Coulombs’ energy and van der Waals energy, respectively. Egas is directly parametrized from the FF14SB forcefield terms. The solvation free energy (Gsol), which is evaluated from the polar states (GGB) and non-polar states energy (GSA), provides a quantitative analysis of the explicit water that is contributing to the binding process, while parameters T and ∆S are the temperature and the total solute entropy, respectively. Predicting the active residue contribution was also made possible by the binding free energy method of MM/PBSA.

4. Conclusions

In this study, we used a combination of molecular dockings and MD simulation to provide a broad insight into the dynamics of non-structural protein (CS1 and CS2) against SARS-CoV-2 3CLpro and PLpro proteases. This protocol allows a comparative study of the recognition of the protein substrate (CS1 and CS2). Post molecular dynamics analyses, such as thermodynamics calculations, DCCM analysis and hydrogen bond occupancy, were performed which provided a range of information on the binding impact of both CS1 and CS2 substrates on 3CLpro and PLpro proteases, respectively.
The molecular docking analysis showed that CS1 has the highest binding affinity of −9.1 kcal mol−1 and −7.1 kcal mol−1 for 3CLpro and PLpro protease, respectively. The MD simulations enabled us to determine the binding conformation of the investigated protein substrate, and it was observed that there exists a possibility of the 3CLpro protease cleaving the CS1 substrate (due to the strength of interaction) and not the CS2 protein substrate (this second observation supports reports in the literature). For the former observation, exploration of the proteolysis mechanism of CS1 by 3CLpro using QM/MM techniques will be necessary to explain why it has not been observed experimentally.
On the other hand, the cleavage of CS2 by PLpro is observed experimentally, yet exchange is observed during dynamics. It could be that the rate of proteolysis of CS2 by PLpro protease is very fast, followed by a rapid loss of the CS2 substrate, which is supported by the computed free binding energies. The binding energy and hydrogen bond formation for the 3CLpro–CS2 system is higher compared to the 3CLpro–CS1 complex, and this may be due to the difference in binding for the CS2 protein substrate, supported by the difference in distance between the substrate and protease during both dynamics simulations (see Supplementary Material). Based on the parameters studied herein, CS1 substrate exhibits favorable binding to 3CLpro/PLpro protease from the docking score and high stability through the RMSD, RMSF and RoG plots.
In summary, the findings provide an important insight that could help in the development of novel SARS-CoV-2 3CLpro inhibitors by mimicking the CS1 protein substrate; such an inhibitor could act on both 3CLpro and PLpro. Further QM/MM investigations of the proteolysis mechanism will provide insight as to why 3CLpro does not cleave CS1 experimentally.

Supplementary Materials

The following supporting information can be downloaded at: https://www.mdpi.com/article/10.3390/molecules27238251/s1. The distance plots and 3D structures generated from chimera for the SARS-CoV-2 3CLpro/PLpro complexed with the protein substrates (CS1 and 2) are provided in the supplementary information.

Author Contributions

Conceptualization, K.A.L.; methodology, Z.K.S. and K.A.L.; software, Z.K.S.; validation, Z.K.S.; formal analysis, Z.K.S. and K.A.L.; investigation, Z.K.S.; resources, K.A.L.; data curation, Z.K.S.; writing—original draft preparation, Z.K.S.; writing—review and editing, K.A.L.; visualization, Z.K.S.; supervision, K.A.L.; project administration, K.A.L.; funding acquisition, Z.K.S. and K.A.L. All authors have read and agreed to the published version of the manuscript.

Funding

This research was funded by the National Research Foundation grant number [129674] and the APC was funded by Rhodes University.

Institutional Review Board Statement

Not Applicable.

Informed Consent Statement

Not Applicable.

Acknowledgments

The authors thank Rhodes University and the National Research Foundation (both in South Africa) for financial support. We are also grateful to the Centre for High Performance Computing (www.chpc.ac.za), Cape Town, South Africa, for computational resources (project CHEM0802).

Conflicts of Interest

The authors declare no conflict of interest.

Sample Availability

Not applicable.

References

  1. Zhou, P.; Yang, X.-L.; Wang, X.-G.; Hu, B.; Zhang, L.; Zhang, W.; Si, H.-R.; Zhu, Y.; Li, B.; Huang, C.-L. A pneumonia outbreak associated with a new coronavirus of probable bat origin. Nature 2020, 579, 270–273. [Google Scholar] [CrossRef] [PubMed] [Green Version]
  2. Sheik Amamuddy, O.; Verkhivker, G.M.; Tastan Bishop, O.Z. Impact of early pandemic stage mutations on molecular dynamics of SARS-CoV-2 Mpro. J. Chem. Inf. Modeling 2020, 60, 5080–5102. [Google Scholar] [CrossRef]
  3. Huang, C.; Wang, Y.; Li, X.; Ren, L.; Zhao, J.; Hu, Y.; Zhang, L.; Fan, G.; Xu, J.; Gu, X. Clinical features of patients infected with 2019 novel coronavirus in Wuhan, China. Lancet 2020, 395, 497–506. [Google Scholar] [CrossRef] [PubMed] [Green Version]
  4. Wang, L.; Wang, Y.; Ye, D.; Liu, Q. Review of the 2019 novel coronavirus (SARS-CoV-2) based on current evidence. Int. J. Antimicrob. Agents 2020, 55, 105948. [Google Scholar] [CrossRef] [PubMed]
  5. Gioia, M.; Ciaccio, C.; De Simone, G.; Fasciglione, G.F.; di Masi, A.; Di Pierro, D.; Bocedi, A.; Ascenzi, P.; Coletta, M. Role of proteolytic enzymes in the COVID-19 infection and promising therapeutic approaches. Biochem. Pharmacol. 2020, 182, 114225. [Google Scholar] [CrossRef]
  6. World Health Organization. Therapeutics and COVID-19: Living Guideline, 14 July 2022; World Health Organization: Geneva, Switzerland, 2022. [Google Scholar]
  7. Zou, L.; Ruan, F.; Huang, M.; Liang, L.; Huang, H.; Hong, Z.; Yu, J.; Kang, M.; Song, Y.; Xia, J. SARS-CoV-2 viral load in upper respiratory specimens of infected patients. N. Engl. J. Med. 2020, 382, 1177–1179. [Google Scholar] [CrossRef] [PubMed]
  8. Naqvi AA, T.; Fatima, K.; Mohammad, T.; Fatima, U.; Singh, I.K.; Singh, A.; Atif, S.M.; Hariprasad, G.; Hasan, G.M.; Hassan, M.I. Insights into SARS-CoV-2 genome, structure, evolution, pathogenesis and therapies: Structural genomics approach. Biochim. Et Biophys. Acta (BBA)-Mol. Basis Dis. 2020, 1866, 165878. [Google Scholar] [CrossRef]
  9. Wang, D.; Hu, B.; Hu, C.; Zhu, F.; Liu, X.; Zhang, J.; Wang, B.; Xiang, H.; Cheng, Z.; Xiong, Y. Clinical characteristics of 138 hospitalized patients with 2019 novel coronavirus–infected pneumonia in Wuhan, China. JAMA 2020, 323, 1061–1069. [Google Scholar] [CrossRef] [PubMed]
  10. Chen, Y.; Liu, Q.; Guo, D. Emerging coronaviruses: Genome structure, replication, and pathogenesis. J. Med. Virol. 2020, 92, 418–423. [Google Scholar] [CrossRef] [Green Version]
  11. Chenthamarakshan, V.; Das, P.; Hoffman, S.C.; Strobelt, H.; Padhi, I.; Lim, K.W.; Hoover, B.; Manica, M.; Born, J.; Laino, T. Cogmol: Target-specific and selective drug design for COVID-19 using deep generative models. arXiv 2020, arXiv:2004.01215. [Google Scholar]
  12. Świderek, K.; Moliner, V. Revealing the molecular mechanisms of proteolysis of SARS-CoV-2 M pro by QM/MM computational methods. Chem. Sci. 2020, 11, 10626–10630. [Google Scholar] [CrossRef] [PubMed]
  13. Gao, Y.; Yan, L.; Huang, Y.; Liu, F.; Zhao, Y.; Cao, L.; Wang, T.; Sun, Q.; Ming, Z.; Zhang, L. Structure of the RNA-dependent RNA polymerase from COVID-19 virus. Science 2020, 368, 779–782. [Google Scholar] [CrossRef] [PubMed] [Green Version]
  14. Trougakos, I.P.; Stamatelopoulos, K.; Terpos, E.; Tsitsilonis, O.E.; Aivalioti, E.; Paraskevis, D.; Kastritis, E.; Pavlakis, G.N.; Dimopoulos, M.A. Insights to SARS-CoV-2 life cycle. pathophysiology, and rationalized treatments that target COVID-19 clinical complications. J. Biomed. Sci. 2021, 28, 9. [Google Scholar] [CrossRef] [PubMed]
  15. Beigel, J.H.; Tomashek, K.M.; Dodd, L.E.; Mehta, A.K.; Zingman, B.S.; Kalil, A.C.; Hohmann, E.; Chu, H.Y.; Luetkemeyer, A.; Kline, S. Remdesivir for the treatment of COVID-19—preliminary report. N. Engl. J. Med. 2020, 383, 1813–1826. [Google Scholar] [CrossRef]
  16. Xu, Z.; Shi, L.; Wang, Y.; Zhang, J.; Huang, L.; Zhang, C.; Liu, S.; Zhao, P.; Liu, H.; Zhu, L. Pathological findings of COVID-19 associated with acute respiratory distress syndrome. Lancet Respir. Med. 2020, 8, 420–422. [Google Scholar] [CrossRef]
  17. Lu, R.; Zhao, X.; Li, J.; Niu, P.; Yang, B.; Wu, H.; Wang, W.; Song, H.; Huang, B.; Zhu, N. Genomic characterisation and epidemiology of 2019 novel coronavirus: Implications for virus origins and receptor binding. Lancet 2020, 395, 565–574. [Google Scholar] [CrossRef] [Green Version]
  18. Hoffman, R.L.; Kania, R.S.; Brothers, M.A.; Davies, J.F.; Ferre, R.A.; Gajiwala, K.S.; He, M.; Hogan, R.J.; Kozminski, K.; Li, L.Y. Discovery of ketone-based covalent inhibitors of coronavirus 3CL proteases for the potential therapeutic treatment of COVID-19. J. Med. Chem. 2020, 63, 12725–12747. [Google Scholar] [CrossRef]
  19. Rut, W.; Lv, Z.; Zmudzinski, M.; Patchett, S.; Nayak, D.; Snipas, S.J.; El Oualid, F.; Huang, T.T.; Bekes, M.; Drag, M. Activity profiling and crystal structures of inhibitor-bound SARS-CoV-2 papain-like protease: A framework for anti–COVID-19 drug design. Sci. Adv. 2020, 6, eabd4596. [Google Scholar] [CrossRef]
  20. Systèmes, D. BIOVIA, Discovery Studio Visualizer, Release 2019; Dassault Systèmes: San Diego, CA, USA, 2020. [Google Scholar]
  21. Manandhar, A.; Blass, B.E.; Colussi, D.J.; Almi, I.; Abou-Gharbia, M.; Klein, M.L.; Elokely, K.M. Targeting SARS-CoV-2 M3CLpro by HCV NS3/4a Inhibitors: In Silico Modeling and In Vitro Screening. J. Chem. Inf. Modeling 2021, 61, 1020–1032. [Google Scholar] [CrossRef]
  22. Siklos, M.; BenAissa, M.; Thatcher, G.R. Cysteine proteases as therapeutic targets: Does selectivity matter? A systematic review of calpain and cathepsin inhibitors. Acta Pharm. Sin. B 2015, 5, 506–519. [Google Scholar] [CrossRef] [Green Version]
  23. Parks, J.; Sanders, B.; Pohkrel, S.; Labbe, A.; Mathews, I.; Cooper, C.; Davidson, R.; Phillips, G.; Weiss, K.; Zhang, Q. Potent and Selective Covalent Inhibitors of the Papain-like Protease from SARS-CoV-2. Res. Sq. 2021, Preprint. [Google Scholar]
  24. Hsu, M.-F.; Kuo, C.-J.; Chang, K.-T.; Chang, H.-C.; Chou, C.-C.; Ko, T.-P.; Shr, H.-L.; Chang, G.-G.; Wang, A.H.-J.; Liang, P.-H. Mechanism of the Maturation Process of SARS-CoV 3CL Protease*[boxs]. J. Biol. Chem. 2005, 280, 31257–31266. [Google Scholar] [CrossRef] [PubMed]
  25. Lee, H.-J.; Shieh, C.-K.; Gorbalenya, A.E.; Koonin, E.V.; La Monica, N.; Tuler, J.; Bagdzhadzhyan, A.; Lai, M.M. The complete sequence (22 kilobases) of murine coronavirus gene 1 encoding the putative proteases and RNA polymerase. Virology 1991, 180, 567–582. [Google Scholar] [CrossRef] [PubMed]
  26. Lindner, H.A.; Fotouhi-Ardakani, N.; Lytvyn, V.; Lachance, P.; Sulea, T.; Ménard, R. The papain-like protease from the severe acute respiratory syndrome coronavirus is a deubiquitinating enzyme. J. Virol. 2005, 79, 15199–15208. [Google Scholar] [CrossRef] [Green Version]
  27. Zhang, L.; Lin, D.; Sun, X.; Curth, U.; Drosten, C.; Sauerhering, L.; Becker, S.; Rox, K.; Hilgenfeld, R. Crystal structure of SARS-CoV-2 main protease provides a basis for design of improved α-ketoamide inhibitors. Science 2020, 368, 409–412. [Google Scholar] [CrossRef] [Green Version]
  28. Barretto, N.; Jukneliene, D.; Ratia, K.; Chen, Z.; Mesecar, A.D.; Baker, S.C. The papain-like protease of severe acute respiratory syndrome coronavirus has deubiquitinating activity. J. Virol. 2005, 79, 15189–15198. [Google Scholar] [CrossRef] [PubMed] [Green Version]
  29. Hilgenfeld, R. From SARS to MERS: Crystallographic studies on coronaviral proteases enable antiviral drug design. FEBS J. 2014, 281, 4085–4096. [Google Scholar] [CrossRef] [Green Version]
  30. Douangamath, A.; Fearon, D.; Gehrtz, P.; Krojer, T.; Lukacik, P.; Owen, C.D.; Resnick, E.; Strain-Damerell, C.; Aimon, A.; Ábrányi-Balogh, P. Crystallographic and electrophilic fragment screening of the SARS-CoV-2 main protease. Nat. Commun. 2020, 11, 5047. [Google Scholar] [CrossRef]
  31. Jin, Z.; Du, X.; Xu, Y.; Deng, Y.; Liu, M.; Zhao, Y.; Zhang, B.; Li, X.; Zhang, L.; Peng, C. Structure of M pro from SARS-CoV-2 and discovery of its inhibitors. Nature 2020, 582, 289–293. [Google Scholar] [CrossRef] [Green Version]
  32. Trott, O.; Olson, A. Software News and Update AutoDock Vina: Improving the Speed and Accuracy of Docking with a New Scoring Function. Effic. Optim. Multithreading 2009, 31, 455–461. [Google Scholar]
  33. Aier, I.; Varadwaj, P.K.; Raj, U. Structural insights into conformational stability of both wild-type and mutant EZH2 receptor. Sci. Rep. 2016, 6, 34984. [Google Scholar] [CrossRef] [Green Version]
  34. Shahraki, O.; Zargari, F.; Edraki, N.; Khoshneviszadeh, M.; Firuzi, O.; Miri, R. Molecular dynamics simulation and molecular docking studies of 1. 4-Dihydropyridines as P-glycoprotein’s allosteric inhibitors. J. Biomol. Struct. Dyn. 2018, 36, 112–125. [Google Scholar] [CrossRef] [PubMed]
  35. Nayeem, S.; Sohail, E.M.; Ridhima, G.; Reddy, M.S. Target SARS-CoV-2: Computation of binding energies with drugs of dexamethasone/umifenovir by molecular dynamics using OPLS-AA force field. Res. Biomed. Eng. 2022, 38, 117–126. [Google Scholar] [CrossRef]
  36. Malleda, C.; Ahalawat, N.; Gokara, M.; Subramanyam, R. Molecular dynamics simulation studies of betulinic acid with human serum albumin. J. Mol. Modeling 2012, 18, 2589–2597. [Google Scholar] [CrossRef] [PubMed]
  37. Abu-Saleh, A.A.-A.A.; Awad, I.E.; Yadav, A.; Poirier, R.A. Discovery of potent inhibitors for SARS-CoV-2’s main protease by ligand-based/structure-based virtual screening. MD simulations, and binding energy calculations. Phys. Chem. Chem. Phys. 2020, 22, 23099–23106. [Google Scholar] [CrossRef] [PubMed]
  38. Rappé, A.K.; Casewit, C.J.; Colwell, K.; Goddard, W.A., III; Skiff, W.M. UFF, a full periodic table force field for molecular mechanics and molecular dynamics simulations. J. Am. Chem. Soc. 1992, 114, 10024–10035. [Google Scholar]
  39. Mittal, R.R.; Harris, L.; McKinnon, R.A.; Sorich, M.J. Partial charge calculation method affects CoMFA QSAR prediction accuracy. J. Chem. Inf. Modeling 2009, 49, 704–709. [Google Scholar] [CrossRef]
  40. Anandakrishnan, R.; Aguilar, B.; Onufriev, A.V. H++ 3.0: Automating p K prediction and the preparation of biomolecular structures for atomistic molecular modeling and simulations. Nucleic Acids Res. 2012, 40, W537–W541. [Google Scholar] [CrossRef] [Green Version]
  41. Frisch, M.; Trucks, G.; Schlegel, H.; Scuseria, G.; Robb, M.; Cheeseman, J.; Scalmani, G.; Barone, V.; Petersson, G.; Nakatsuji, H. Gaussian 16; Gaussian, Inc.: Wallingford, CT, USA, 2016. [Google Scholar]
  42. Case, D.; Ben-Shalom, I.; Brozell, S.; Cerutti, D.; Cheatham, T., III; Cruzeiro, V.; Darden, T.; Duke, R.; Ghoreishi, D.; Gilson, M. AMBER 2018; University of California: San Francisco, CA, USA, 2018. [Google Scholar]
  43. Jorgensen, W.L.; Chandrasekhar, J.; Madura, J.D.; Impey, R.W.; Klein, M.L. Comparison of simple potential functions for simulating liquid water. J. Chem. Phys. 1983, 79, 926–935. [Google Scholar] [CrossRef]
  44. Hornak, V.; Abel, R.; Okur, A.; Strockbine, B.; Roitberg, A.; Simmerling, C. Comparison of multiple Amber force fields and development of improved protein backbone parameters. Proteins: Struct. Funct. Bioinform. 2006, 65, 712–725. [Google Scholar] [CrossRef] [Green Version]
  45. Maier, J.A.; Martinez, C.; Kasavajhala, K.; Wickstrom, L.; Hauser, K.E.; Simmerling, C. ff14SB: Improving the accuracy of protein side chain and backbone parameters from ff99SB. J. Chem. Theory Comput. 2015, 11, 3696–3713. [Google Scholar] [CrossRef] [PubMed] [Green Version]
  46. Pastor, R.W.; Brooks, B.R.; Szabo, A. An analysis of the accuracy of Langevin and molecular dynamics algorithms. Mol. Phys. 1988, 65, 1409–1419. [Google Scholar] [CrossRef]
  47. Ryckaert, J.-P.; Ciccotti, G.; Berendsen, H.J. Numerical integration of the cartesian equations of motion of a system with constraints: Molecular dynamics of n-alkanes. J. Comput. Phys. 1977, 23, 327–341. [Google Scholar] [CrossRef] [Green Version]
  48. Pettersen, E.F.; Goddard, T.D.; Huang, C.C.; Couch, G.S.; Greenblatt, D.M.; Meng, E.C.; Ferrin, T.E. UCSF Chimera—a visualization system for exploratory research and analysis. J. Comput. Chem. 2004, 25, 1605–1612. [Google Scholar] [CrossRef] [PubMed]
  49. Hunter, J.D. Matplotlib: A 2D graphics environment. Comput. Sci. Eng. 2007, 9, 90–95. [Google Scholar] [CrossRef]
  50. Roe, D.R.; Cheatham, T.E., III. PTRAJ and CPPTRAJ: Software for processing and analysis of molecular dynamics trajectory data. J. Chem. Theory Comput. 2013, 9, 3084–3095. [Google Scholar] [CrossRef]
  51. Ndagi, U.; Mhlongo, N.N.; Soliman, M.E. The impact of Thr91 mutation on c-Src resistance to UM-164: Molecular dynamics study revealed a new opportunity for drug design. Mol. Biosyst. 2017, 13, 1157–1171. [Google Scholar] [CrossRef]
  52. Genheden, S.; Kuhn, O.; Mikulskis, P.; Hoffmann, D.; Ryde, U. The normal-mode entropy in the MM/GBSA method: Effect of system truncation, buffer region, and dielectric constant. J. Chem. Inf. Modeling 2012, 52, 2079–2088. [Google Scholar] [CrossRef] [Green Version]
  53. Ndagi, U.; Mhlongo, N.N.; Soliman, M.E. Emergence of a promising lead compound in the treatment of triple negative breast cancer: An insight into conformational features and ligand binding landscape of c-Src protein with UM-164. Appl. Biochem. Biotechnol. 2018, 185, 655–675. [Google Scholar] [CrossRef]
Figure 1. Three-dimensional structure of SARS-CoV-2 (a) main protease (3CLpro, PDB ID: 6XA4) [18] and (b) papain-like protease (PLpro, PDB ID: 6WX4) [19] showing the active site and essential domain within the enzyme (rendered using BIOVIA Discovery Studio [20]).
Molecules 27 08251 g001
Figure 2. (a) Three-dimensional representation of the superimposed SARS-CoV-2 3CLpro (6XA4, blue) from PDB, 3CLpro–CS1(light brown) and 3CLpro–CS2 (red). (b) Superimposed SARS-CoV-2 PLpro (6WX4, blue) from PDB, PLpro–CS1(light brown) and PLpro–CS2 (red) to validate docking binding at the active site of the proteases.
Molecules 27 08251 g002
Figure 3. Root-mean-square deviation plot for (a) apo-3CLpro protease (blue) and complexes of 3CLpro with CS1 (orange) and CS2 (green) during the 600 ns MD simulation time. (b) apo-PLpro protease (blue) and complexes of PLpro with CS1 (orange) and CS2 (green) during the 600 ns MD simulation time.
Molecules 27 08251 g003
Figure 4. Root-mean-square fluctuation plot for (a) apo-3CLpro protease (blue) and complexes of 3CLpro with CS1 (orange) and CS2 (green) during the 600 ns MD simulation time. (b) apo-PLpro protease (blue) and complexes of PLpro with CS1 (orange) and CS2 (green) during the 600 ns MD simulation time.
Molecules 27 08251 g004
Figure 5. DCCM plot of the alpha carbon fluctuations for the 600 ns simulation period: (a) 3CLpro apo-protein; (b) 3CLpro–CS1 complex; (c) 3CLpro–CS2 complex.
Molecules 27 08251 g005
Figure 6. Radius of gyration plot for (a) apo-3CLpro protease (blue) and complexes of 3CLpro with CS1 (orange) and CS2 (green) during the 600 ns MD simulation time. (b) apo-PLpro protease (blue) and complexes of PLpro with CS1 (orange) and CS2 (green) during the 600 ns MD simulation time.
Molecules 27 08251 g006
Figure 7. Hydrogen bond formation plot for (a) apo-3CLpro protease (blue) and complexes of 3CLpro with CS1 (orange) and CS2 (green) during the 600 ns MD simulation time. (b) apo-PLpro protease (blue) and complexes of PLpro with CS1 (orange) and CS2 (green) during the 600 ns MD simulation time.
Molecules 27 08251 g007
Figure 8. Two-dimensional structures of the non-structural protein cleavage points (a) CS1 and (b) CS2 used in the study.
Molecules 27 08251 g008
Table 1. List of non-structural proteins cleaved by PLpro and 3CLpro, respectively, with * marking the cleavage point.
Proteolytic Cleaved Sites by PLproNon-Structural Protein ID
Asn-Gly-Gly*Ala-Tyr-ThrNsp1-Nsp2 (CS1)
Lys-Gly-Gly*Ala-Pro-ThrNsp2-Nsp3 (CS2)
Lys-Gly-Gly*Lys-Iso-ValNsp3-Nsp4
Proteolytic cleaved sites by 3CLpro
Val-Leu-Gln*Ser-Gly-PheNsp4-Nsp5
Thr-Phe-Gln*Ser-Ala-ValNsp5-Nsp6
Thr-Val-Gln*Ser-Lys-MetNsp6-Nsp7
Table 2. Root-mean-square values (in Å), or overlay similarity of the superimposed amino peptide residues of re-docked complexes with native and docked complexes considered in this study.
NoComplexesRMSD Value (Å)
3CLpro
16XA4 PDB vs. re-docked 6XA40.86 (RMSD)
26XA4 PDB vs. 3CLpro–CS10.77 (overlay similarity)
36XA4 PDB vs. 3CLpro–CS20.78 (overlay similarity)
PLpro
66WX4 PDB vs. re-docked 6WX40.83 (RMSD)
76WX4 PDB vs. PLpro–CS10.74 (overlay similarity)
86WX4 PDB vs. PLpro–CS20.73 (overlay similarity)
Table 3. Calculated binding free energies and their corresponding components (in kcal mol−1) for the complexes of 3CLpro/PLpro with CS1 and CS2 using the AMBER18 package.
SystemΔEvdwΔEeleΔGgasΔGpolarΔGnonpolarΔGsolΔGbind
3CLpro
CS1−9.97−75.60−9.311.21−2.00−0.79−10.10
CS2−8.09−133.21−68.1360.05−2.1657.90−10.23
PLpro
CS1−15.96−154.29−95.6682.71−2.8779.83−15.83
CS2−4.24−148.23−80.1279.69−1.0978.60−1.52
Note: ΔEvdw = van der Waals energy, ΔEele = electrostatic energy, ΔGbind = total binding energy, ΔGsolv = solvation free energy.
Table 4. Hydrogen bonds between the complexes of 3CLpro/PLpro with CS1 and CS2 over the simulation time.
System 3CLproAcceptorDonorOccupancy (%)Distance (Å)Angle (°)
CS1CYS_144@OASN_27@H-N54.422.8722157.7537
GLY_307@OGLU_165@H-N33.422.8901162.1835
HIE_40@OCYS_43@H-N28.892.9051154.6399
THR_310@OTHR_189@H-N26.292.8622158.9503
CYS_144@OASN_27@HD22-ND225.392.8489158.2798
THR_310@OALA_190@H-N18.732.8603159.0912
TYR_309@OGLN_188@HE22-N32215.132.8431159.6982
THR_310@OXTALA_190@H-N12.562.8654157.2788
THR_310@OXTTHR_189@H-N9.632.8664153.5904
GLY_307@OTRY_309@H-N7.662.9030146.1381
TYR_309@OTHR_310@HG1-OG16.962.8039161.6148
ASN_305@OALA_308@H-N4.472.9094152.8739
ASN_305@OD1GLY_306@H-N3.702.8340144.2798
ASN_305@OSER_45@HG-OG3.402.7780159.0601
ALA_308@OASN_305@H1-N3.002.8331153.1770
CS2CYS_144@OASN_27@H-N56.412.8798158.4557
GLY_306@OSER_138@HG-OG43.592.7128161.2717
THR_310@OARG_3@HH21-NH228.062.8006158.7969
THR_310@OXTARG_3@HH21-NH218.332.8087156.1145
HIE_40@OCYS_43@H-N15.232.9166156.0746
HIE_40@ND1HIE_40@H-N12.302.9060141.5077
PRO_309@OTHR_310@HG1-OG12.972.8355159.3578
ALA_308@OLEU_140@H-N1.932.8732154.1803
PLpro
CS1CYS_113@OTHR_117@HG1-OG175.142.8348158.5441
THR_324@OGLY_273@H-N71.532.8464161.7714
ASN_319@OD1TYR_323@H-N54.022.8828162.5650
ASP_288@OD2HIE_274@HE2-NE242.952.8187157.9014
CYS_113@OTHR_117@H-N39.452.9013159.4459
ASN_319@OD1ALA_322@H-N38.322.8724153.1878
ASP_288@OLEU_291@H-N32.422.9040159.4916
THR_324@OXTASN_111@HD22-ND231.662.8407149.4410
HIE_274@OTHR_267@H-N28.322.9130162.4926
TRY_323@OASN_319@H1-N13.062.7518145.6913
GLY_20@OTYR_270@HH-OH4.472.7677161.4565
ASN_319@OD1GLY_320@H-N4.232.8071144.6121
CS2CYS_113@OTHR_117@HG1-OG177.472.7872162.2125
ASP_288@OD2HIE_274@HE2-NE244.352.8228160.2619
CYS_113@OTHR_117@H-N38.592.9075159.0521
ASP_288@OD1HIE_274@HE2-NE237.652.8263159.7712
HIE_274@OTHR_267@H-N35.222.9013161.0575
ASP_288@OLEU_291@H-N30.362.9058158.9475
PRO_323@OARG_168@HH12-NH16.832.8173156.2786
PRO_323@OTHR_324@HG1-OG16.702.8011162.3707
THR_324@OTHR_324@HG1-OG14.632.7763146.7643
THR_324@OG1ARG_168@HH22-NH22.832.8560155.1610
GLY_320@OARG_168@HH22-NH22.302.8517150.3676
PRO_318@OXTLYS_219@HZ1-NZ2.172.7873159.4122
LYS_319@OGLN_176@HE21-NE22.102.8605158.4366
Publisher’s Note: MDPI stays neutral with regard to jurisdictional claims in published maps and institutional affiliations.

