Article

Adsorption Equilibrium and Mechanism and of Water Molecule on the Surfaces of Molybdenite (MoS2) Based on Kinetic Monte-Carlo Method

1
Faculty of Geosciences and Environmental Engineering, Southwest Jiaotong University, Chengdu 611756, China
2
Department of Geochemistry, Chengdu University of Technology, Chengdu 610059, China
3
Key Laboratory of Sedimentary Basin and Oil and Gas Resources, China Geological Survey, Ministry of Land and Resources & Chengdu Center of Geological Survey, Chengdu 610081, China
4
Key Laboratory of Coal Science and Technology of Ministry of Education and Shanxi Province, Taiyuan University of Technology, Taiyuan 030024, China
*
Author to whom correspondence should be addressed.
Molecules 2022, 27(24), 8710; https://doi.org/10.3390/molecules27248710
Submission received: 21 August 2022 / Revised: 26 November 2022 / Accepted: 29 November 2022 / Published: 8 December 2022

Abstract

:
The oxidation/weathering of molybdenite (MoS2) is too slow to be monitored, even under pure oxygen and high temperatures, while it proceeds rapidly through humid air. The adsorption of water molecules on molybdenite is necessary for the wet oxidation/weathering of molybdenite. Therefore, we employ kinetic Monte Carlo modeling to clarify the adsorption isotherm, site preferences and kinetics of water on different surfaces of molybdenite. Our results indicate that (1) the adsorption capacity and adsorption rate coefficient of H2O on the (110) surface are significantly larger than those on the (001) surface at a temperature of 0~100 °C and a relative humidity of 0~100%, suggesting that the (110) surface is the predominant surface controlling the reactivity and solubility of molybdenite in its interaction with water; (2) the kinetic Monte Carlo modeling considering the adsorption/desorption rate of H2O, dissociation/formation rate of H2O and adsorption/desorption of dissociated H indicates that the adsorption and dissociation of H2O on the (110) surface can be completed in one microsecond (ms) at 298 K and in wet conditions; (3) the adsorption and dissociation of H2O on molybdenite are not the rate-limiting steps in the wet oxidation/weathering of molybdenite; and (4) kinetic Monte Carlo modeling explains the experimental SIMS observation that H2O and OH (rather than H+/H or H2O) occupy the surface of MoS2 in a short time. This study provides new molecular-scale insights to aid in our understanding of the oxidation/weathering mechanism of molybdenite as the predominant mineral containing molybdenum in the Earth’s crust.

1. Introduction

Molybdenum (4d55s1 at the outermost shell) is a typical transition metal and exists mainly as Mo(VI) and Mo(IV) in nature. Therefore, molybdenum acts as an important tracer to construct the paleo-ocean condition due to its redox sensitivity to the aqueous environment [1,2]. Molybdenum is an essential trace element for organisms because it can form a series of important enzymes [3,4]. Its abundance in the Earth’s crust ranges from 0.6 to 1.4 mg/kg [5]. Molybdenite (MoS2) has been considered as the only mineral category with commercial significance, and it usually coexists with other sulfide minerals (e.g., pyrite, chalcopyrite) in the crust [6,7]. Most of the molybdenum minerals, such as molybdenite (MoS2), ferrimolybdite (Fe2(MoO4)3·nH2O), molybdite (CaMoO4), kamilokite (Fe2Mo3O8), wulfenite (PbMoO4) and drysdallite (Mo(S,Se)2), are nearly insoluble. Therefore, the weathering/oxidation of molybdenite is the fundamental geochemical process controlling the release of molybdenum from the lithosphere to the hydrosphere.
The oxidation of molybdenite (MoS2) cannot be monitored by Raman spectroscopy, even when exposed to pure oxygen and temperatures up to 340 °C [8]. However, the wet oxidation/weathering of molybdenite’s surface can be monitored by X-ray photoelectron spectroscopy (XPS) and atomic force microscopy (AFM) after it has been immersed in water for one hour [9] and exposed to humid air [10,11]. All these factors suggest that the adsorption of water molecules on the surface of molybdenite is a precondition for the weathering/oxidation of molybdenite [9]. However, the adsorption isotherm, site preferences and kinetics of water molecules on the different surfaces of molybdenite at the size and time scale of geochemical interest are still poorly understood.
A series of studies applying density functional theory (DFT) were performed to determine the adsorption site stability for H2O adsorption on the surface of the monolayer of molybdenite [12,13,14], because the adsorption and dissociation of H2O on the molybdenite surface is difficult to control and discriminate in experiments. According to the adsorption energy of water molecules at different sites, the adsorption site preferences can be compared [12,13,14]. The adsorption of H2O on the basal plane of the (001) monolayer of MoS2 shows a positive adsorption enthalpy change, indicating a repulsive interaction between the free H2O molecule and the perfect MoS2 (001) surface [13,14]. By comparing the adsorption energy of H2O above two types of S atoms (S atom with a single S-Mo bond and S atom with double S-Mo bonds) and a Mo atom, the adsorption of H2O above the S atom was considered unstable due to the repulsive interaction between the S and O atoms, while H2O adsorption above Mo was considered stable due to the attractive interaction between the O and Mo atoms [14]. Moreover, there are also other possible adsorption geometries to decrease the repulsive interaction between O and S atoms, e.g., the bond between H and S atoms instead of O and S atoms. Therefore, the adsorption site preference of H2O on the surface of MoS2 needs more detailed research. Theoretical modeling through first-principle calculation is a useful tool to explore the adsorption mechanism, but present studies are mainly focused on the mono-layer of MoS2 (001 surface). The surface properties largely depend on the size scale of the mineral surface. In a microscopic view, the interaction among the atoms in the long range can also affect the adsorption site. Therefore, there is always a difference in interest and scale when directly applying physical calculation to solve problems with more geochemical interest. For example, the natural mineral MoS2(2H) is a three-dimensional object and has three surfaces, i.e., (001), (110), (010). The lack of studies of the water adsorption mechanism (e.g., sorption isotherm, adsorption energy and kinetics) on these surfaces inhibits our fundamental understanding of the oxidation/weathering of molybdenite. To clarify these basic adsorption reactions regarding the interaction at the water–molybdenite surface, we employ annealing dynamics and kinetic Monte Carlo modeling to investigate these fundamental problems.

2. Method

2.1. Thermodynamic Calculation of Eh-pH Diagrams and Reaction Forward Modeling

To fully understand the effect of oxidation on the surface of molybdenite, an Eh-pH diagram is drawn based on the PHREEPLOT [15]. Moreover, forward reaction modeling is performed using the code PHREEQC [16].

2.2. Molybdenite Crystal and Geometry Optimization

Molybdenite mainly exists as 2H-MoS2 (space group: P63/mmc) in nature. To date, the reported molybdenite crystal categories include (1) the octahedral coordination of Mo (1T) and (2) the trigonal prismatic coordination of Mo (2H, 3R and 4H), which depends on the stacking sequences in S-Mo-S at the z-axis [17]. However, molybdenite in nature exists only as 2H-MoS2 (space group: P63/mmc) and 3R-MoS2 (space group: C5-R3m) [18,19,20]. Moreover, 2H-MoS2 is the predominant crystal category of molybdenite in the deposit [18,19,20]. Therefore, 2H-MoS2 (Figure 1) was selected for this study. The calculations in this study were performed using the code of Material Studio (Accelrys). To obtain the primary cell of 2H-MoS2, geometry optimization was performed using the Gaussian-Plane Wave (GPW) method. Different sets of functional and cutoff energy were comparatively used to calculate the lattice constant and band gap. The lattice constant, calculated using the functional PBE, successfully converged, and its result was closer to the experimental value than LDA and PW91 (Table 1). The functional PBE and energy cutoff of 398 eV were selected. The K-point was set as 5 × 5 × 1 in the calculations at the reciprocal space.

2.3. Sorption Isotherm

The dissociation of H2O into OH and H has been considered to mainly occur at the adsorption site above the Mo atom [13,14,24]. If the adsorption of H2O above Mo is the most stable adsorption site (with the lowest energy after adsorption), it is very difficult to explain the factors that drive the H2O above Mo to break the strong O-H bond and dissociate into OH and H. The adsorption of water molecules on the mineral surface is affected by the surface layers in the supercell, while the initial multi-atom system can result in exponential growth in the calculation cost and time. The universal force field (UFF) was used in the molecular dynamics modeling of H2O adsorbed on the (001) and (110) surfaces of molybdenite. UFF is constructed using the general rules only based on the element, its hybridization and its connectivity [25], and it has been widely used in calculating the interactions among atoms in molecular dynamics simulation. The 5 × 5 × 2 supercell of each surface, (001) and (110), was constructed in the calculation in order to more closely reflect the real size of molybdenite and consider the long-range interactions among atoms. At a constant temperature, average numbers of H2O adsorbed for each cell of the (001) and (110) surfaces of molybdenite were sampled and calculated from the atmospheric pressure from 1 bar to 10 bar. The temperature was increased from 273 to 398 K (0~120 °C) with a step of 25 K. The summation method was based on the Ewald Group and atom-based van der Waals. At each simulation step, the metropolis method was used to sample the ensembles. The probability density of the canonical ensemble is shown in Equation (1).
ρ Γ = exp β E Γ d Γ exp β E )
where E(Γ) is the potential energy (eV) of the system in state Γ and β = 1/(KbT), in which Kb is the Boltzmann constant and T is the thermodynamic temperature (K).

2.4. Kinetic Monte Carlo and Rate Coefficient Calculation

The most likely site and geometry for H2O adsorbed on the (001) and (110) surfaces of MoS2 were explored through the annealing process, which was realized by increasing the temperature of the system in steps to 100,000 K, and then automatically decreasing it to 100 K. In the molecular dynamics process, we also used the UFF, but with the Monte Carlo method to sample the energy of each state. The process was repeated in 3 cycles with 15,000 steps in each cycle to explore the state with lower energy.
Based on the Monte Carlo kinetics, rate activation energy and rate coefficient calculated, we investigated the dissociative adsorption rate of water at the mineral surface. Kinetic Monte Carlo (KMC) modeling is based on the rate coefficient or activation energy of each step reaction to simulate the concentration and rate change as a function of time, being comparable to laboratory settings. Its visualization result can help us to understand the reaction process at the atomic scale. According to the experimental observation of OH and H2O on the mineral surface [24] and the theoretical prediction of H desorption as H2 from the surface, in this study, KMC is employed to combine the three-stage reactions, which requires the rate coefficient or activation energy of H2O adsorption, H2O dissociation and H2 desorption. We did not consider the diffusion of these species at the surface, because the effect of diffusion on the overall reaction rate is not significant if the time scale concerned is in seconds or less. The adsorption rate coefficient of H2O adsorption on the (001) surface was calculated based on Equation (2) [26]:
K H 2 O ads = P H 2 O   A site б 2 π m H 2 O K b T
where KH2O-ads is the rate coefficient for H2O adsorption at the surface of the mineral (s−1). Asite is the area of a single adsorption site (m2), which can be estimated based on the geometry of the cleaved surface in the calculation. PH2O is the pressure of water (atm). б is the sticking coefficient (s−1). mH2O is the molar mass of water molecules (g/mol). Kb is the Boltzmann constant (J/K) and T is the thermodynamic temperature (K).
The water vapor saturation pressure as a function of temperature is described with the Arden–Buck equation; see Equation (3) [27]. Its error compared to the experimental value [28] is less than 0.04% at the temperature range of 273.15 to 373.15 Kelvin.
P = 0.61121   exp 18.678 T 273.15 234.5 T 273.15 257.14 + T
P is the water vapor saturation pressure (KPa) and T is the thermodynamic temperature (K). Therefore, we can obtain the water adsorption rate coefficient reaching water vapor saturation at a certain temperature as Equation (4):
K H 2 O ads = 0.00603   exp 18.678 T 273.15 234.5 T 273.15 257.14 + T A site б 2 π m H 2 O K b T )
where Kb is the Boltzmann constant (J/K) and T is the thermodynamic temperature (K).
The rate coefficient of H2O dissociation at the (001) MoS2 surface has been reported previously [14]. The rate coefficient of H2 desorption from the (001) MoS2 surface has not been reported and no direct equation is available. The H2 desorption from the (001) MoS2 surface can be expressed as in Reaction 2. When obtaining the equilibrium between H2 adsorption and desorption on the (001) surface, the product of the H2 adsorption rate coefficient and H2 desorption rate coefficient will be equal to its equilibrium constant. Therefore, Equation (5) can be used to calculate the rate coefficient of H2 desorption from the (001) MoS2 surface (the detailed process is summarized in Supplementary Materials Section S1 as an elementary reaction.
2H-MoS2 = MoS2 + H2 (Reaction 2)
K eq = K forward K reverse = K H 2 desorption K H 2 adsorption
where Keq is the equilibrium constant of H2 adsorption and desorption at the (001) surface; Kforward and Kreverse are the rate coefficients (s−1) of the forward and reverse reaction, respectively; KH2-desorption and KH2-adsorption are the rate coefficients of H2 desorption and adsorption, respectively. The detailed calculation is presented in the Supplementary Materials Section S1. Supplementary Materials Section S1. The rate coefficient of H2 adsorption was also calculated using the same equation, Equation (2). Based on these parameters, the overall and step reaction rate in H2O’s dissociative adsorption as a function of time was predicted (Figure 2).

3. Results

3.1. Oxidation of Molybdenite Based on Thermodynamic Calculation

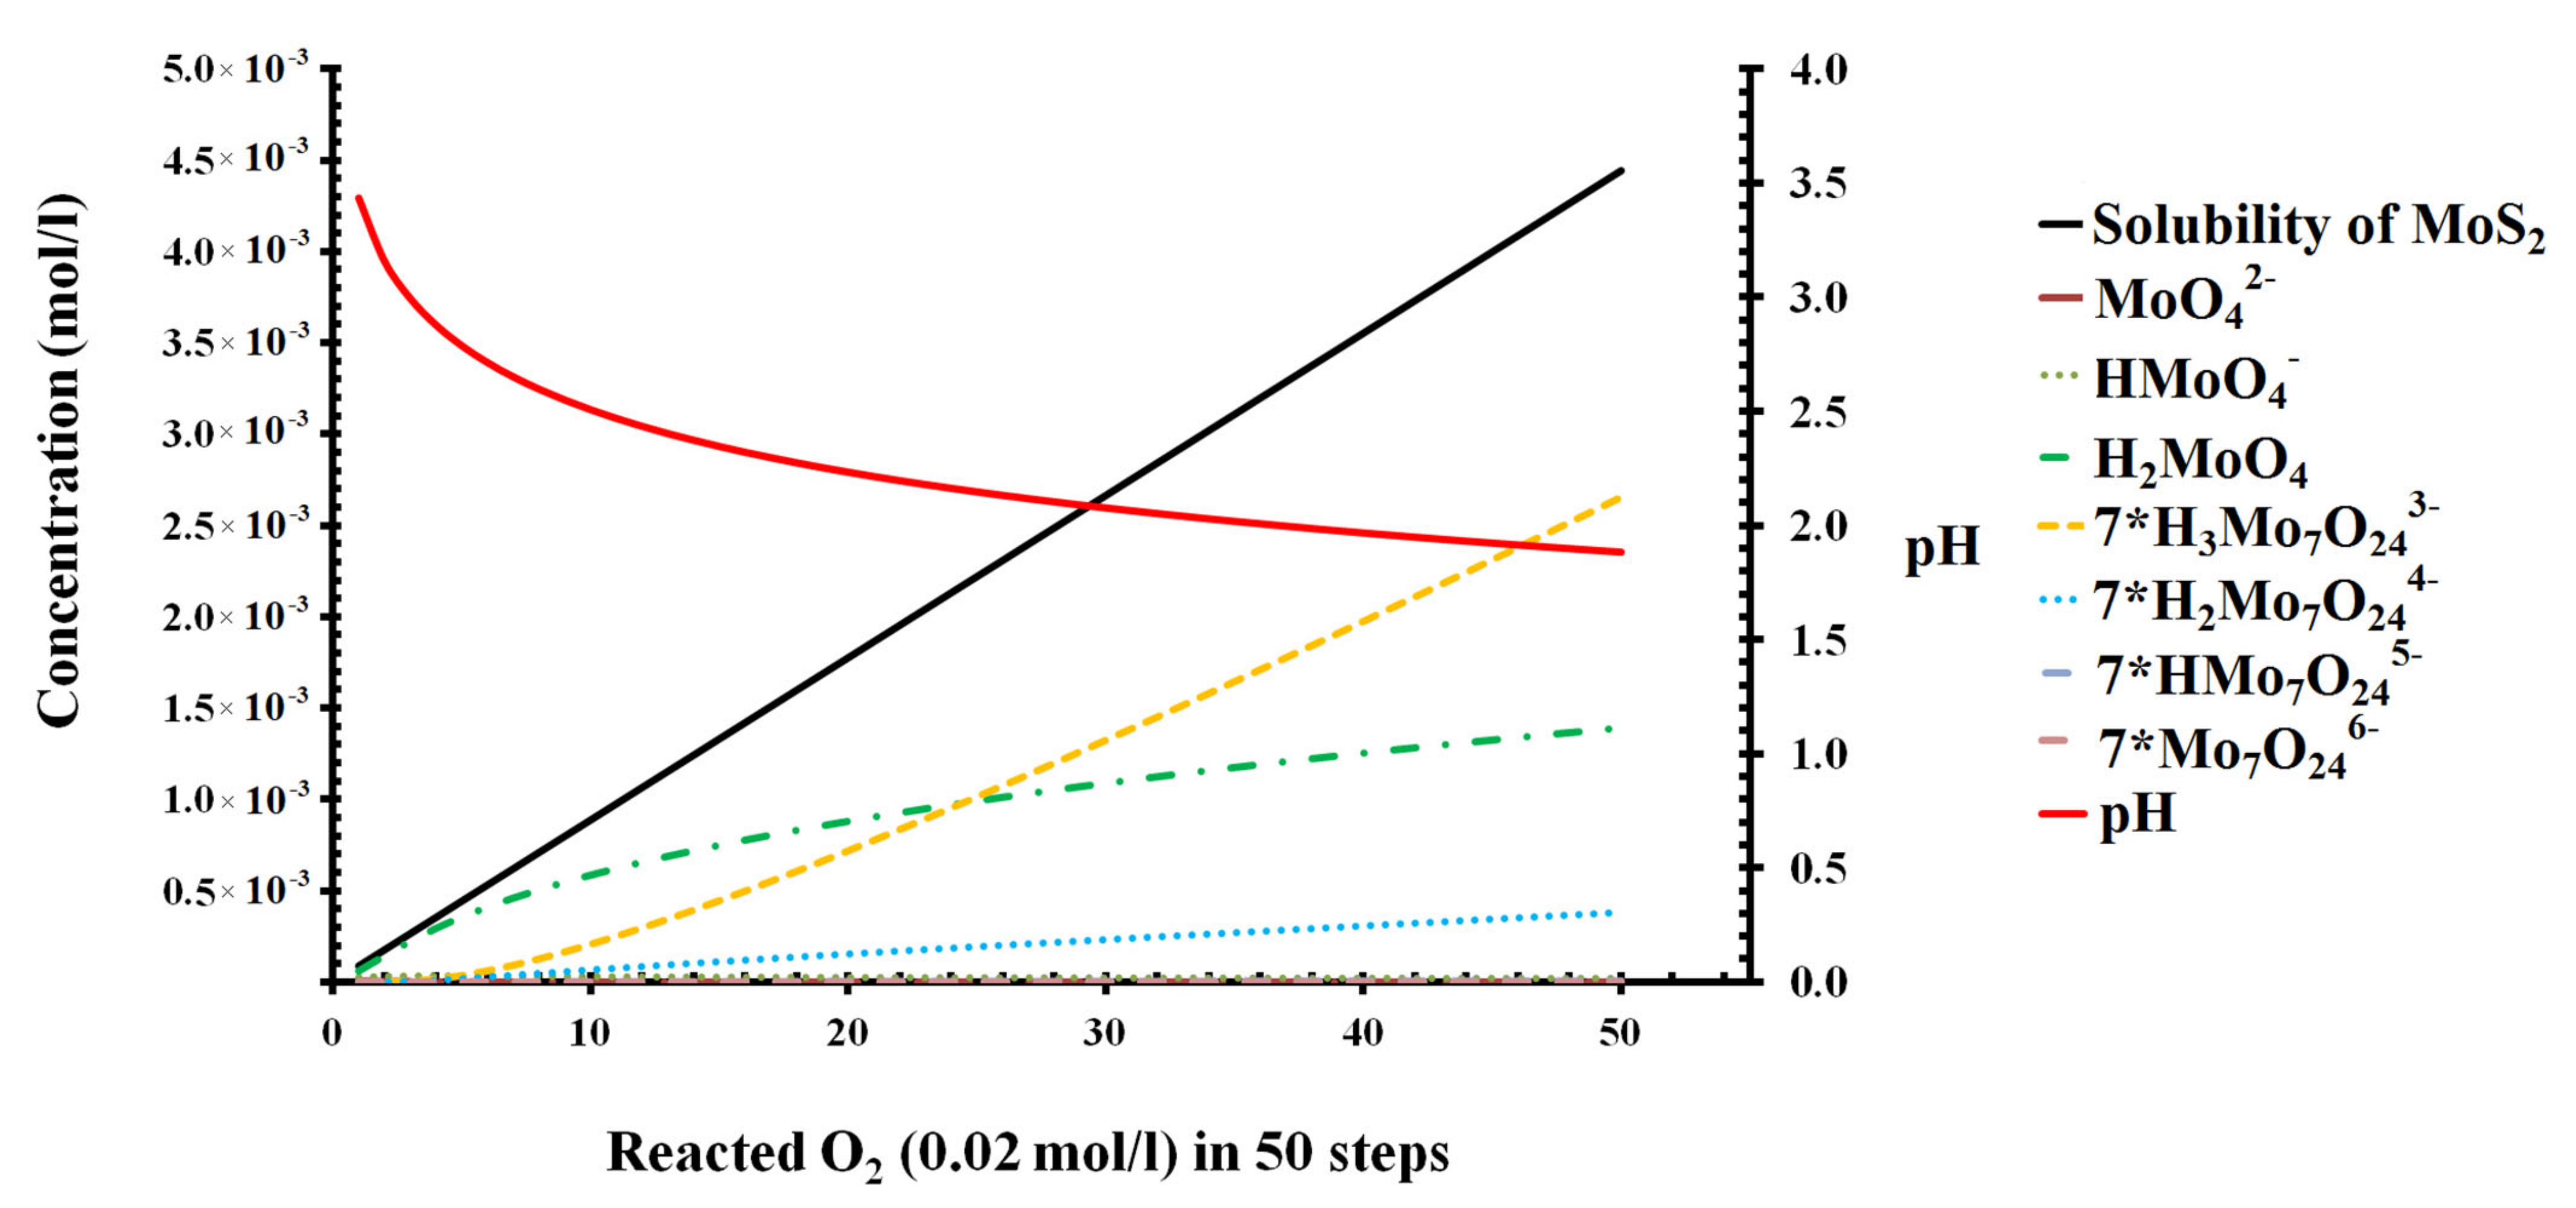
Based on the Eh-pH diagram of the Mo-S-H2O system at 25 °C and reference atmospheric pressure, we can find that MoS2 is stable under the acid and reductive conditions (Figure 2) and can be oxidized and transformed into Mo (VI) species in the surface environment. The oxidation energy difference varies from −0.9 to −2.4 eV based on the DFT calculation [29]. In acidic water (pH < 4.3) in the relatively oxidative condition, MoS2 can also remain stable (Figure 3). The forward path modeling of MoS2 oxidized by O2 indicates that oxidation will improve its solubility unlimitedly if there is sufficient O2/air and will decrease the pH (Figure 3). The increase in Mo (VI) and decrease in pH will form a series of aqueous species and complexes (Figure 3), such as MoO42−, HMoO4, H2MoO4, Mo7O246−. All of these suggest that the oxidation of molybdenite is very important in understanding the Mo aqueous species during oxidation.
2MoS2 + 6H2O + 9O2 = 2MoO42− + 12H+ + 4SO42− (Reaction 1)

3.2. Sorption Isotherm of H2O on the (001) and (110) Surfaces

All of the movement of H2O at the surface of MoS2 is random in the simulation. The sorption result of H2O on the (001) and (110) surfaces of MoS2 from 1 bar to 10 bar at 298 K is presented (Figure 4). The sorption capacity comparison and the isotherms at different temperatures and pressures are presented (Figure 5 and Figure 6). According to the number of water molecules adsorbed on the supercells of the (001) and (110) surfaces from 1 to 10 bar (Figure 4), we can calculate the average H2O molecules adsorbed for each cell (Figure 5). H2O molecules adsorbed on the (001) surface are clearly distributed in different layers in the space, while those water molecules adsorbed on the (110) surface are relatively evenly distributed in the space (Figure 4). The average loadings of H2O molecules for the cells of the surfaces (001) and (110) at 298 K both increased with the H2O fugacity in the range of 1 to 10 bar (Figure 5). Moreover, the H2O molecule sorption capacity of the (110) surface at 298 K was much larger than that of the d(001) surface, and the capacity difference between the two surfaces also increased significantly with the H2O fugacity (Figure 5). Based on the average loading of H2O molecules sorbed on the cell and the stoichiometry mass of H2O and the cell, we can obtain the sorption isotherm from the (001) and (110) surfaces as a function of H2O fugacity and temperature (Figure 6). There were significant and highly positive linear relationships between the H2O capacity on the two surfaces and the H2O fugacity (Figure 6). When the temperature increased from 273 to 398 K, the H2O sorption capacity on both the (001) and (110) surfaces decreased significantly, as shown by the decrease in slope for each isotherm line at the two surfaces (Figure 6). The sorption capacity of H2O on the (110) surface was stronger than that of the (001) surface at all temperatures and H2O fugacity values investigated (Figure 6).

3.3. Adsorption Energy Derived from the Annealing Dynamics of H2O on the (001) and (110) Surfaces

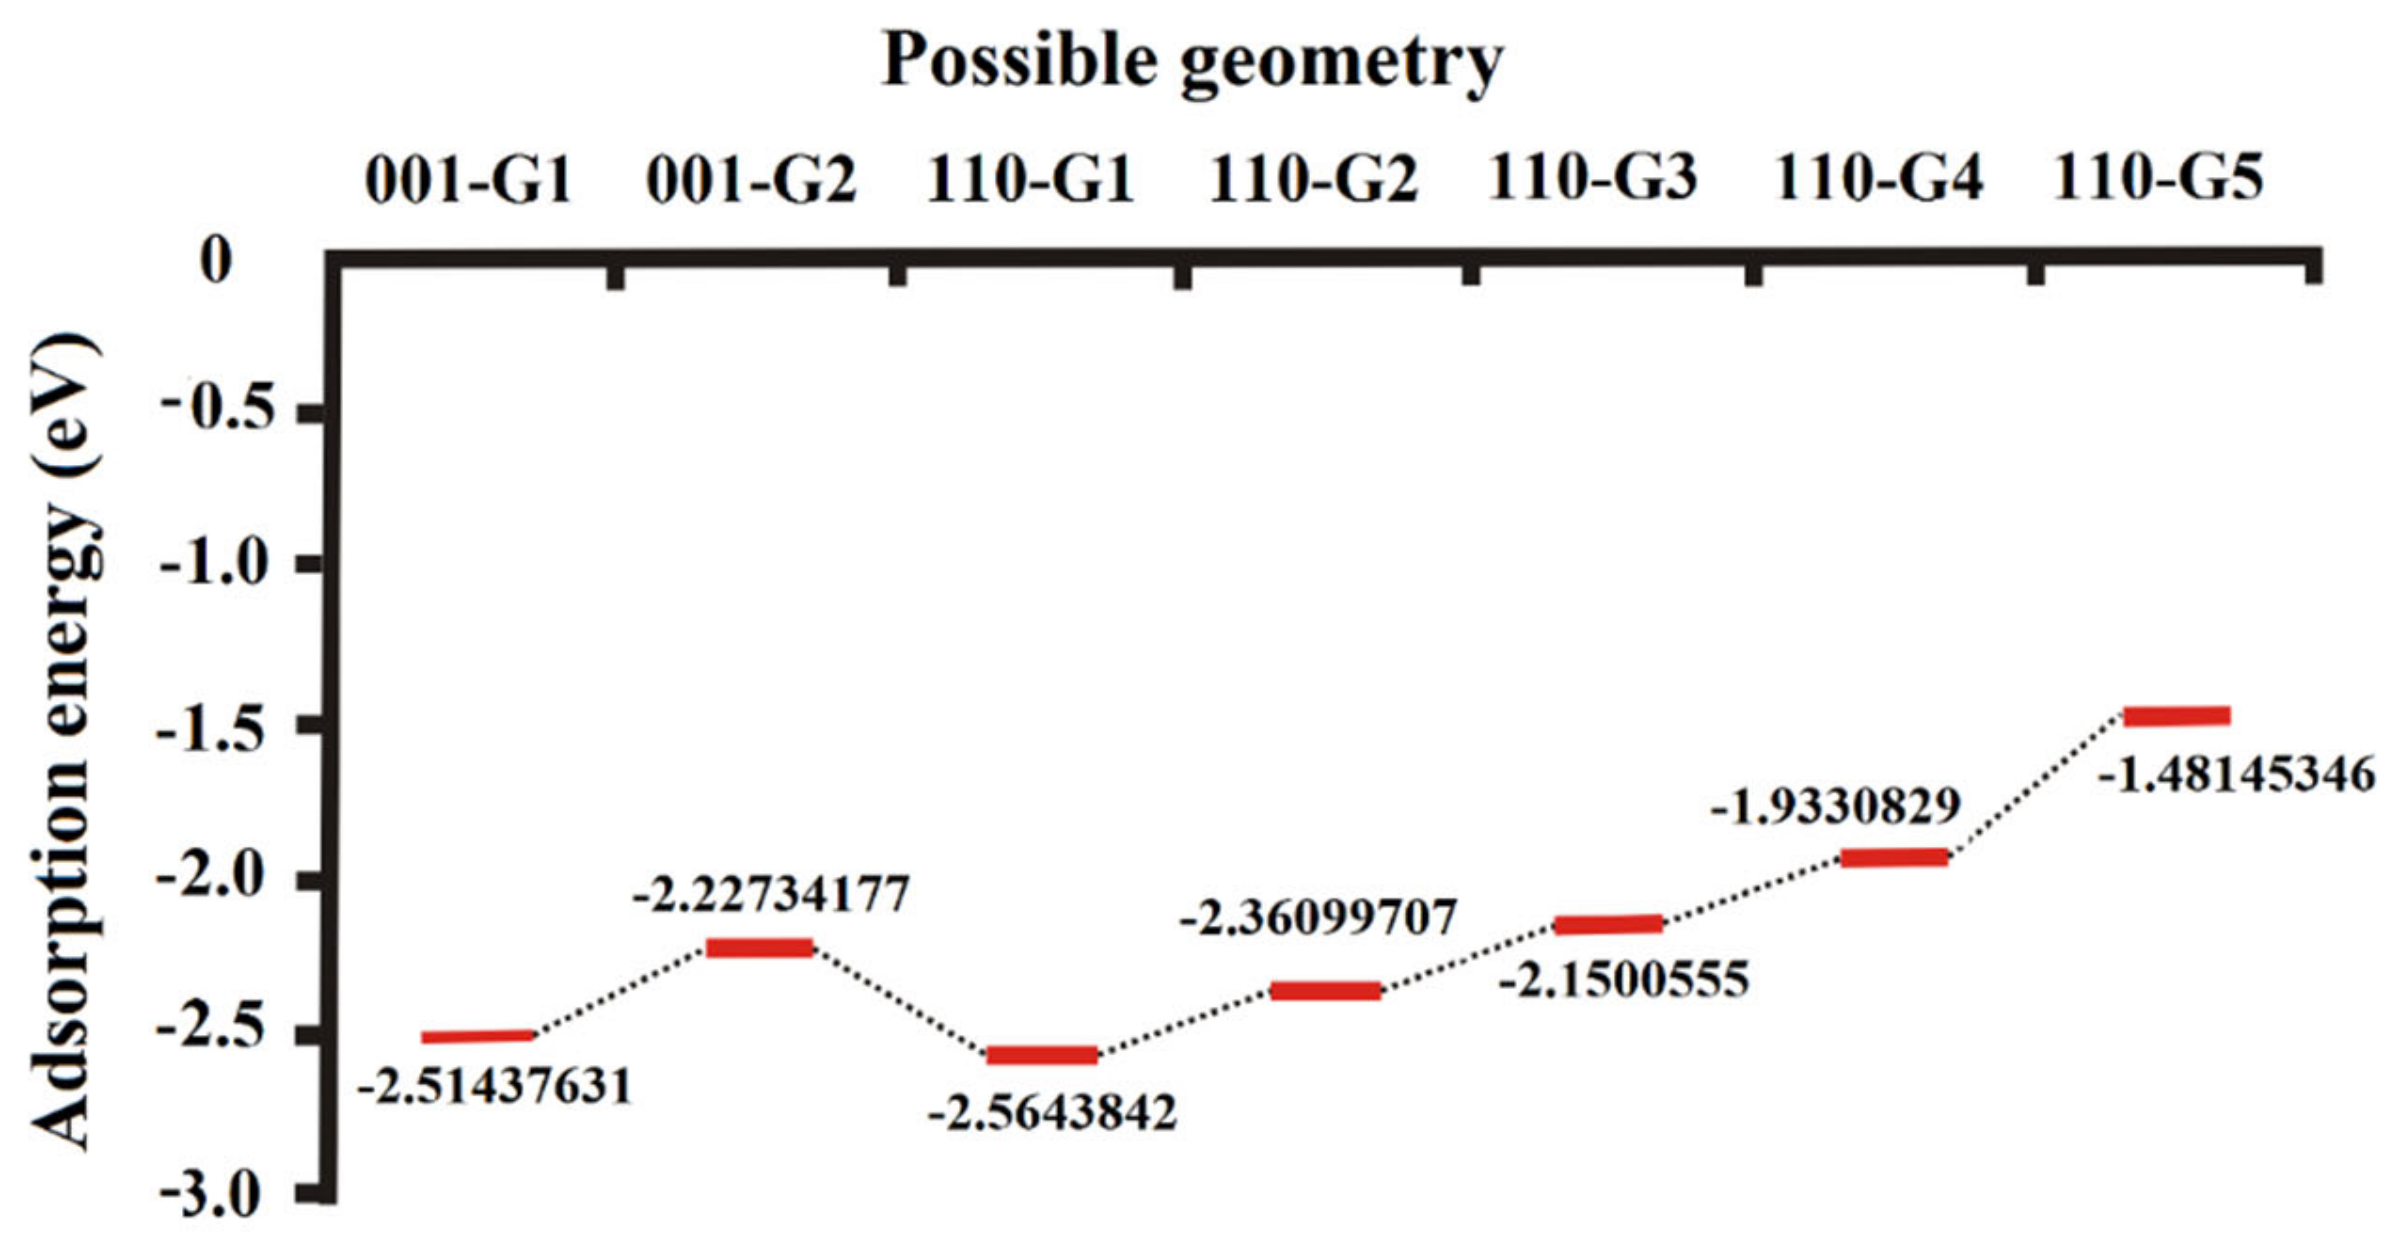
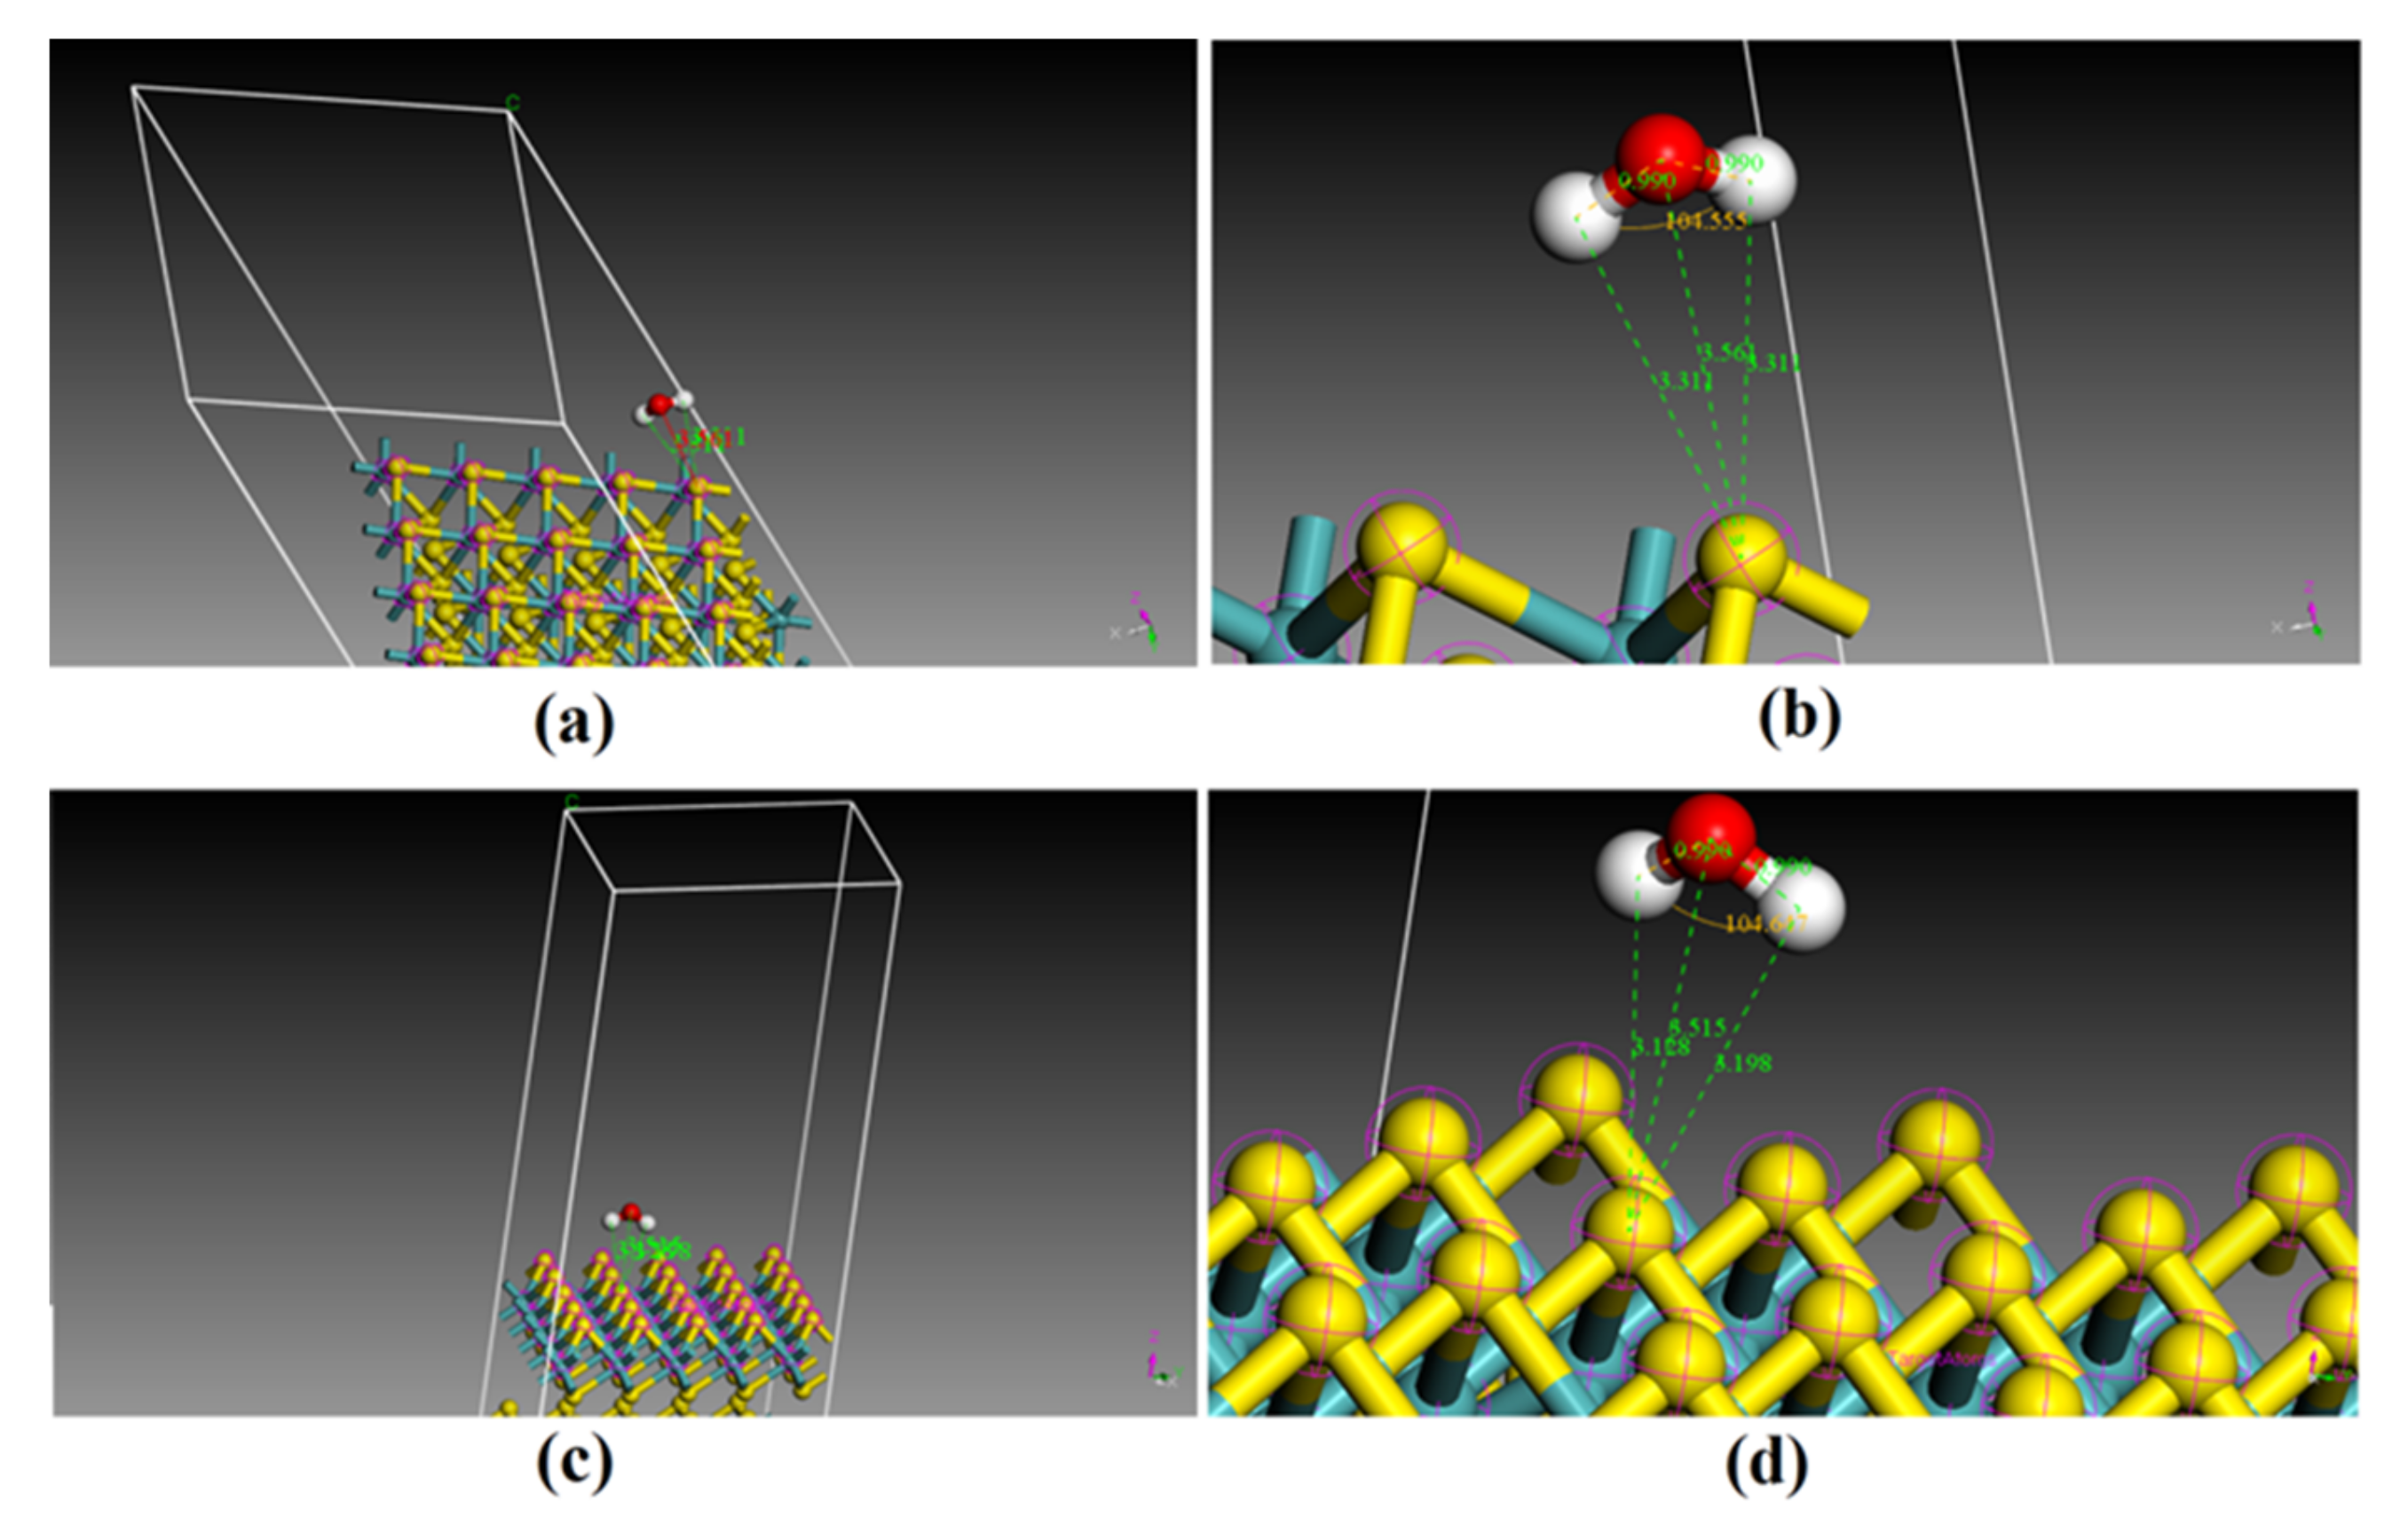
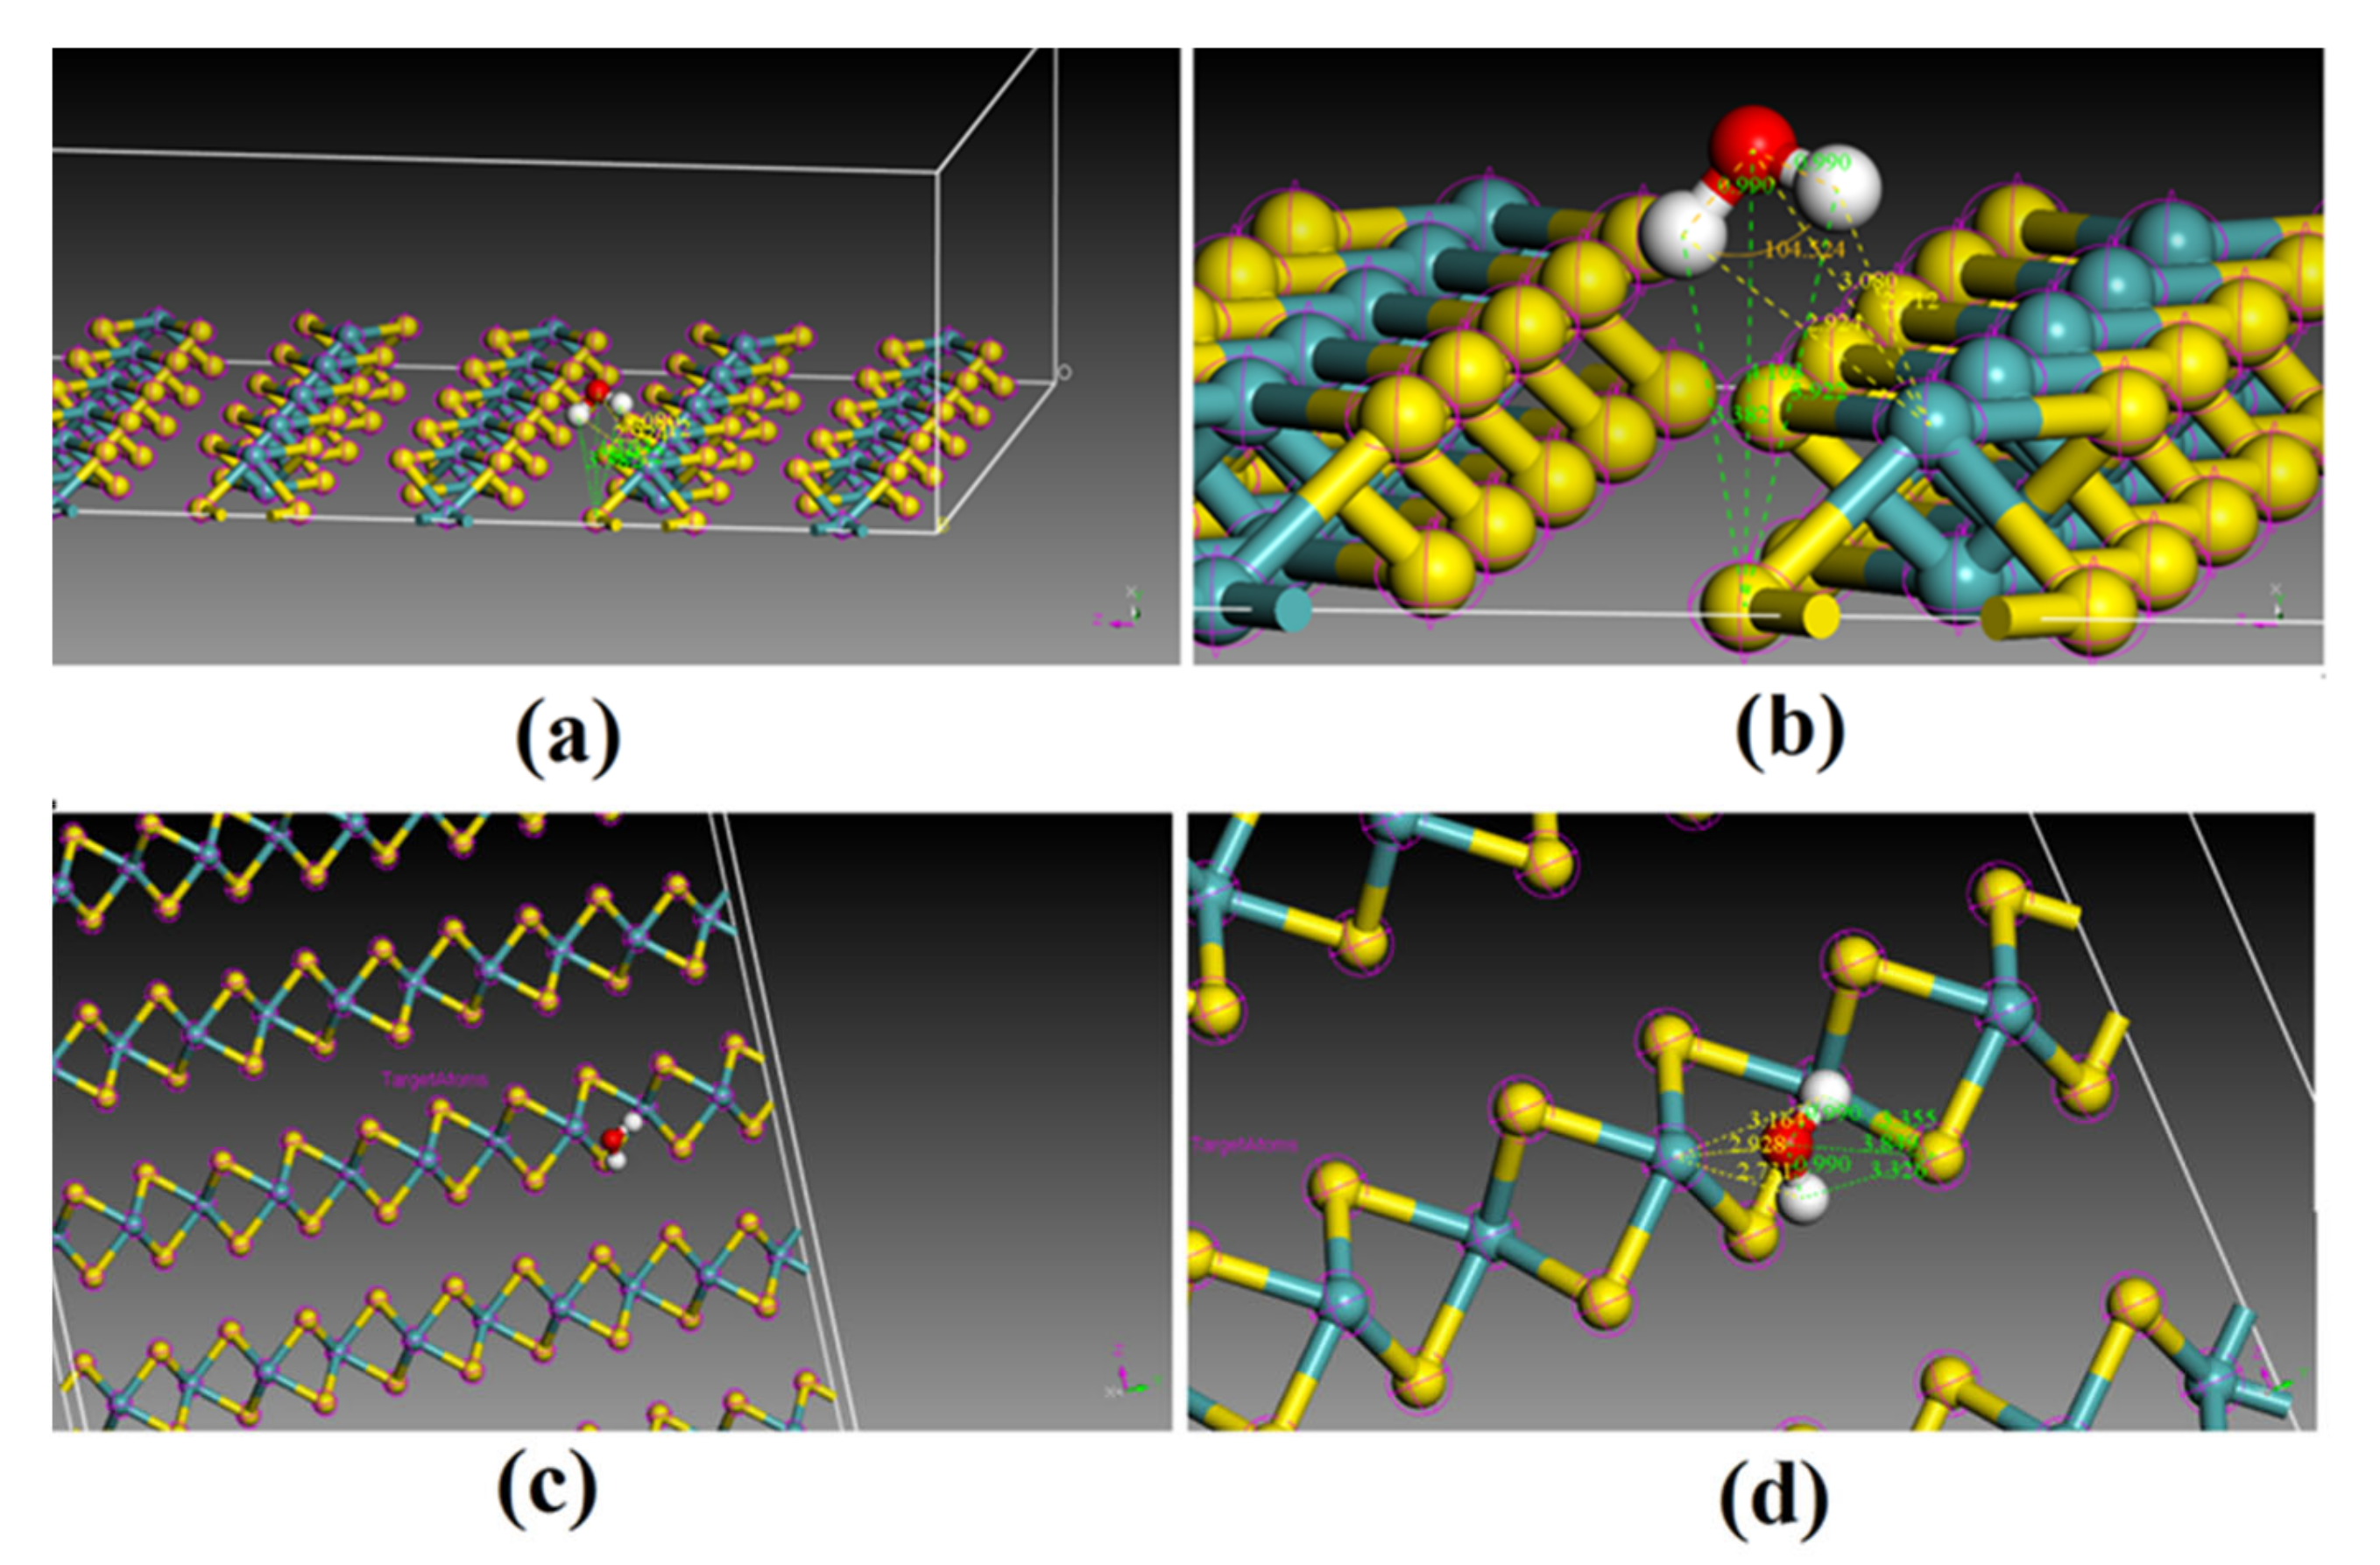
The annealing dynamics from 100,000 K to 100 K indicated that there were two possible adsorption sites on the (001) surface, 001-G1 and 001-G2, whose adsorption energy was −2.51 and −2.23 eV, respectively (Figure 7), and there were four possible adsorption sites on the (110) surface—110-G1, 110-G2, 110-G3 and 110-G4—whose adsorption energy was −2.56, −2.36, −2.15, −1.93 and −1.48 eV, respectively (Figure 7). The stability of different adsorption sites on the surfaces can be reflected by the potential energy. Correspondingly, the stability of the adsorption sites on molybdenite follows the order 110-G1 > 110-G2 > 001-G1 > 001-G2 > 110-G3 > 110-G4 > 110-G5, as shown by the increase in negative adsorption energy for H2O in the order (Figure 7). Moreover, the four most stable geometries of H2O adsorption sites are presented (Figure 8 and Figure 9). To clarify the geometry on the sites, the most stable adsorption sites on the (001) surface were (1) 001-G1, H2O above the S atom at the edge; (2) 001-G2, H2O above the S atom closing the edge. Both 001-G1 and 001-G2 were above the S atoms, with two H atoms oriented towards the S atom. The two most stable adsorption sites on the (110) surface were (1) 110-G1, H2O above the S-Mo bond at the edge, with two H atoms oriented towards the S atom and an O atom oriented towards the Mo atom (Figure 8); (2) 110-G2, H2O above the S-Mo bond close to the edge, with two H atoms oriented towards the S atom and an O atom oriented towards the Mo atom (Figure 9). The distance between two H atoms and an S atom for 001-G1, 001-G2, 110-G1 and 110-G2 was 3.311–3.313 3.128–3.198, 3.382–3.392, 3.326–3.355 Å, respectively, and only 001-G1 had two equal S-H distances (Figure 8 and Figure 9). The specific distances between O and H atoms from H2O and Mo and H atoms from MoS2 for the four most stable sites are presented (Figure 8 and Figure 9). The distance between the O atom and Mo atom of 001-G1 and 001-G2 could not be determined due to the uncertain direction and overly long distance (Figure 8).

3.4. Adsorption Rate Coefficient of H2O on the (001) and (110) Surfaces as a Function of the Temperature and Humidity

Based on Equation (2), we can calculate the adsorption rate coefficient of H2O on the mineral surface at certain partial pressure and temperature values; the Asite is the area of a single sorption site, which equals the reciprocal of the sorption site density. According to the area of the basal plane and the H2O adsorption number per cell, we can calculate the area of a single sorption site at the (001) and (110) surfaces, respectively (Table 2). Combined with the bulk equation, we can calculate the saturation vapor pressure of H2O at certain temperature ranges from 0 to 100 °C (Figure 10a) and calculate the corresponding adsorption rate coefficient at certain conditions. The adsorption rate coefficient of H2O on the (110) surface is close to that on the (001) surface at a temperature from 0 to 25 °C, but it increases more significantly than the (001) surface with the temperature. When reaching 100 °C, the adsorption rate coefficient of H2O on the (110) surface is approximately 16 times higher than that on the (001) surface. To explore the impact of humidity on the adsorption of H2O on MoS2, the adsorption rate coefficient of H2O on the (001) and (110) surfaces of MoS2 at 25 °C was presented as a function of relative humidity (Figure 10b). The adsorption rate coefficients of H2O on the (110) and (001) surfaces both increased with the humidity.

3.5. Kinetics of H2O Dissociative Adsorption on the (110) Surface

The adsorption mechanism and rate coefficient both indicate that H2O adsorption on the (110) surface is always favored at all of the temperature and humidity levels investigated. Therefore, the surface reactions of H2O on the (110) surface are selected in the KMC modeling, which includes the kinetics of (1) the adsorption of H2O on the surface; (2) the dissociation of H2O into OH and H on the surface; (3) the desorption of H as H2 molecules from the surface. According to Equations (2) and (3), we can obtain the rate coefficient of the three-stage reaction. When reaching the condition with 20% relative humidity of H2O in air at 298 K, the adsorption rate coefficient is 4.84 × 10⁷ S−1. The rate coefficient of H2O dissociation on the (110) surface of MoS2 at 300 K is 2.8 × 10¹⁰ S−1. The rate coefficient of H2 desorption on MoS2 is 2.38 × 10⁸ S−1 (detailed calculation is presented in Supplementary Materials Section S1.). To more closely approach the real situation, the rate coefficient of H2O desorption from MoS2 was also calculated (detailed calculation is presented in Supplementary Materials Section S3). The metadynamic calculation provides the rate coefficient of H2O dissociation on the MoS2 surface [14]. Based on the reaction free energy of the dissociation, we can calculate the reverse reaction (the formation of H2O from dissociated OH and H) rate coefficient as 2.9 × 10¹¹ S−1 (detailed calculation is presented in Supplementary Materials Section S2). The average H2O number adsorbed on the (110) surface is approximately 0.85 per cell at 298 K at the water vapor saturation pressure. Therefore, we constructed a surface composed of 32 × 32 adsorption sites, which represents a (110) surface composed of 37 × 37 cells, to predict the overall surface reactions as a function of time in seconds.
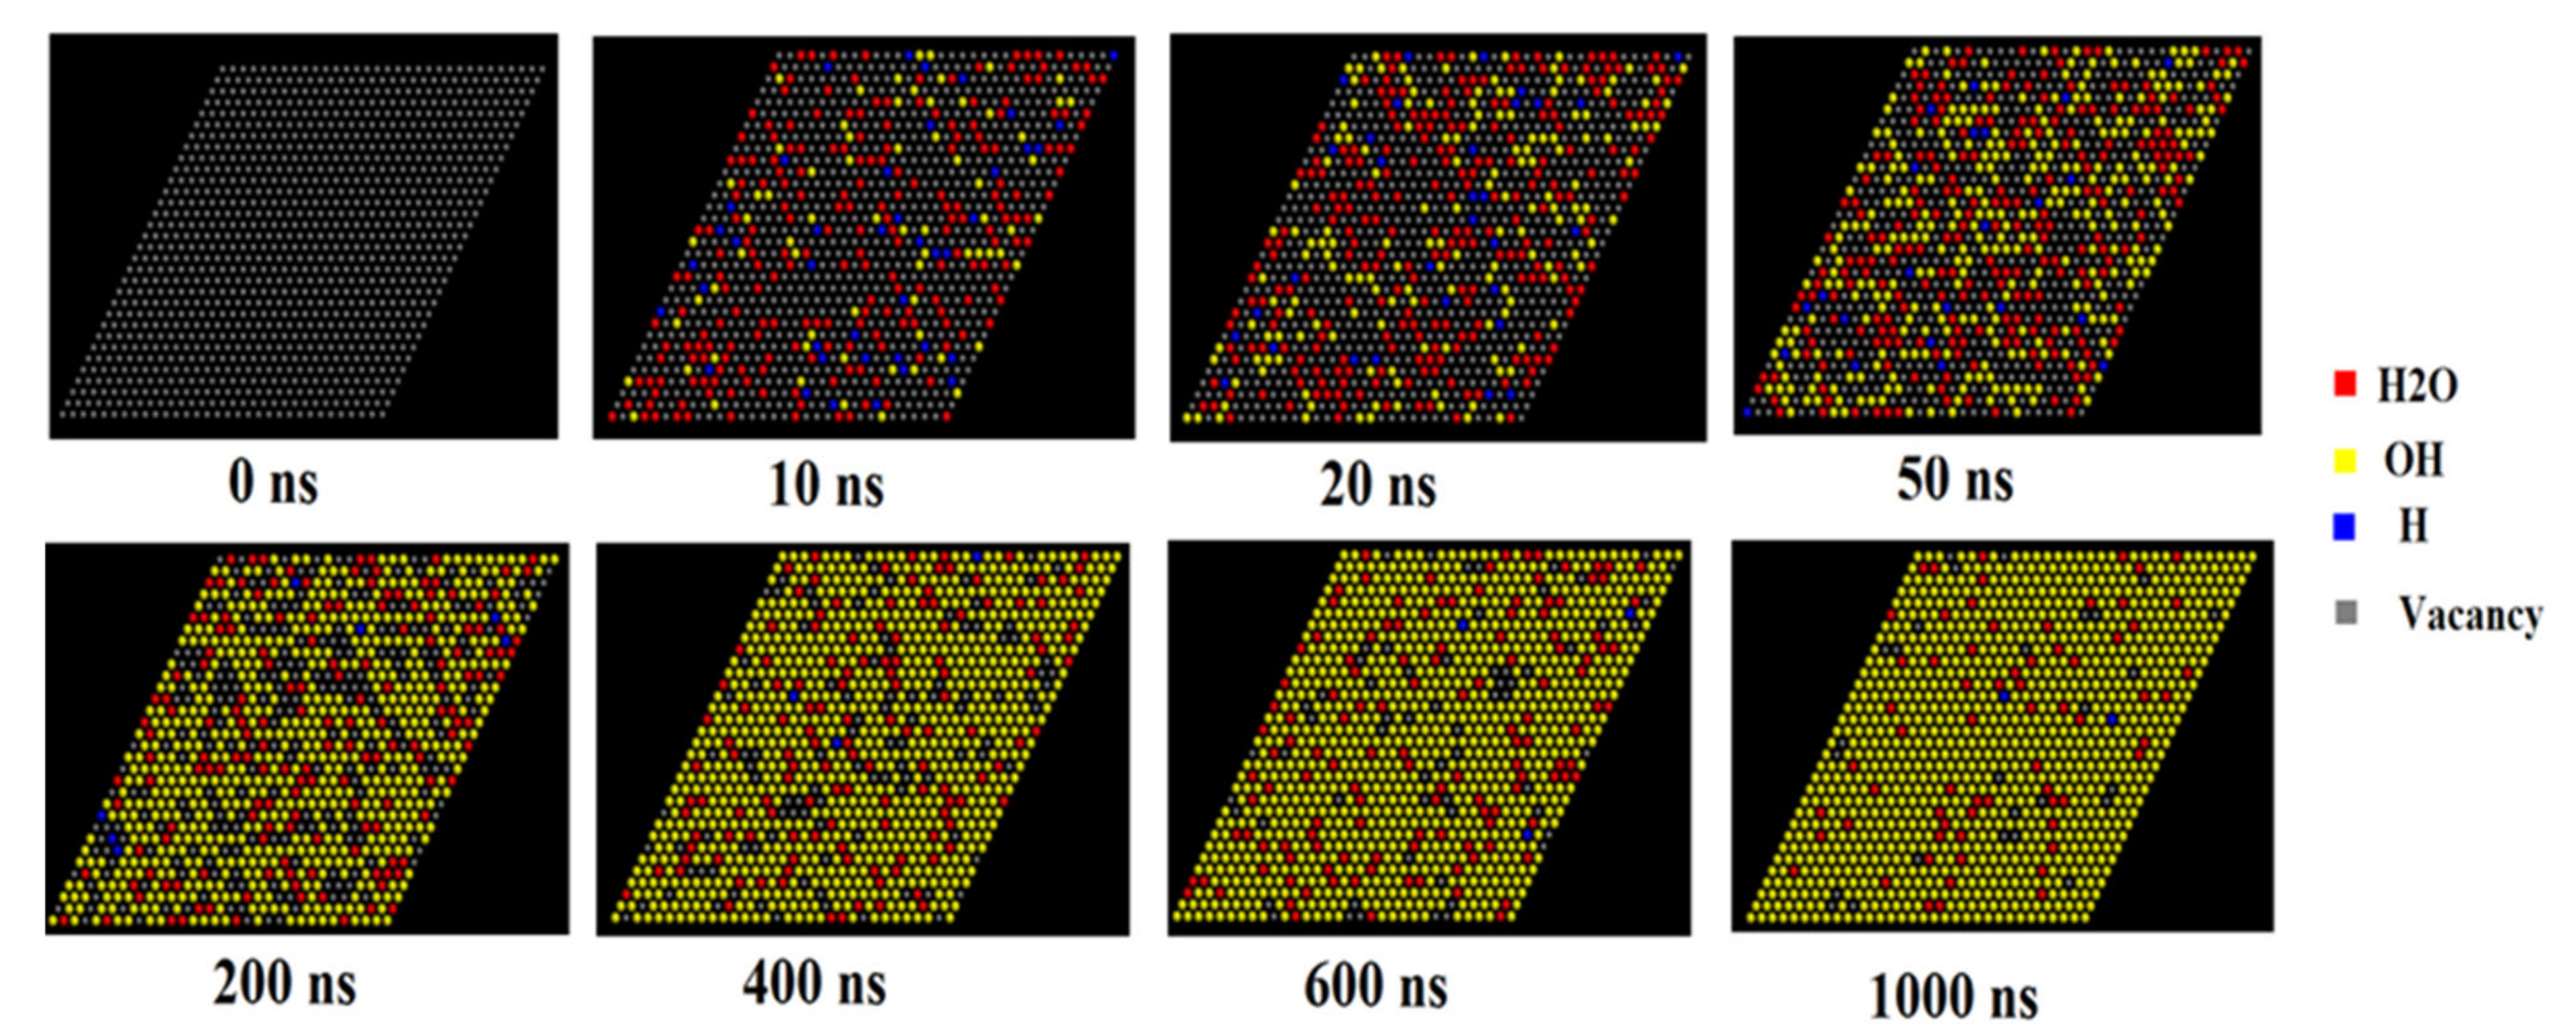
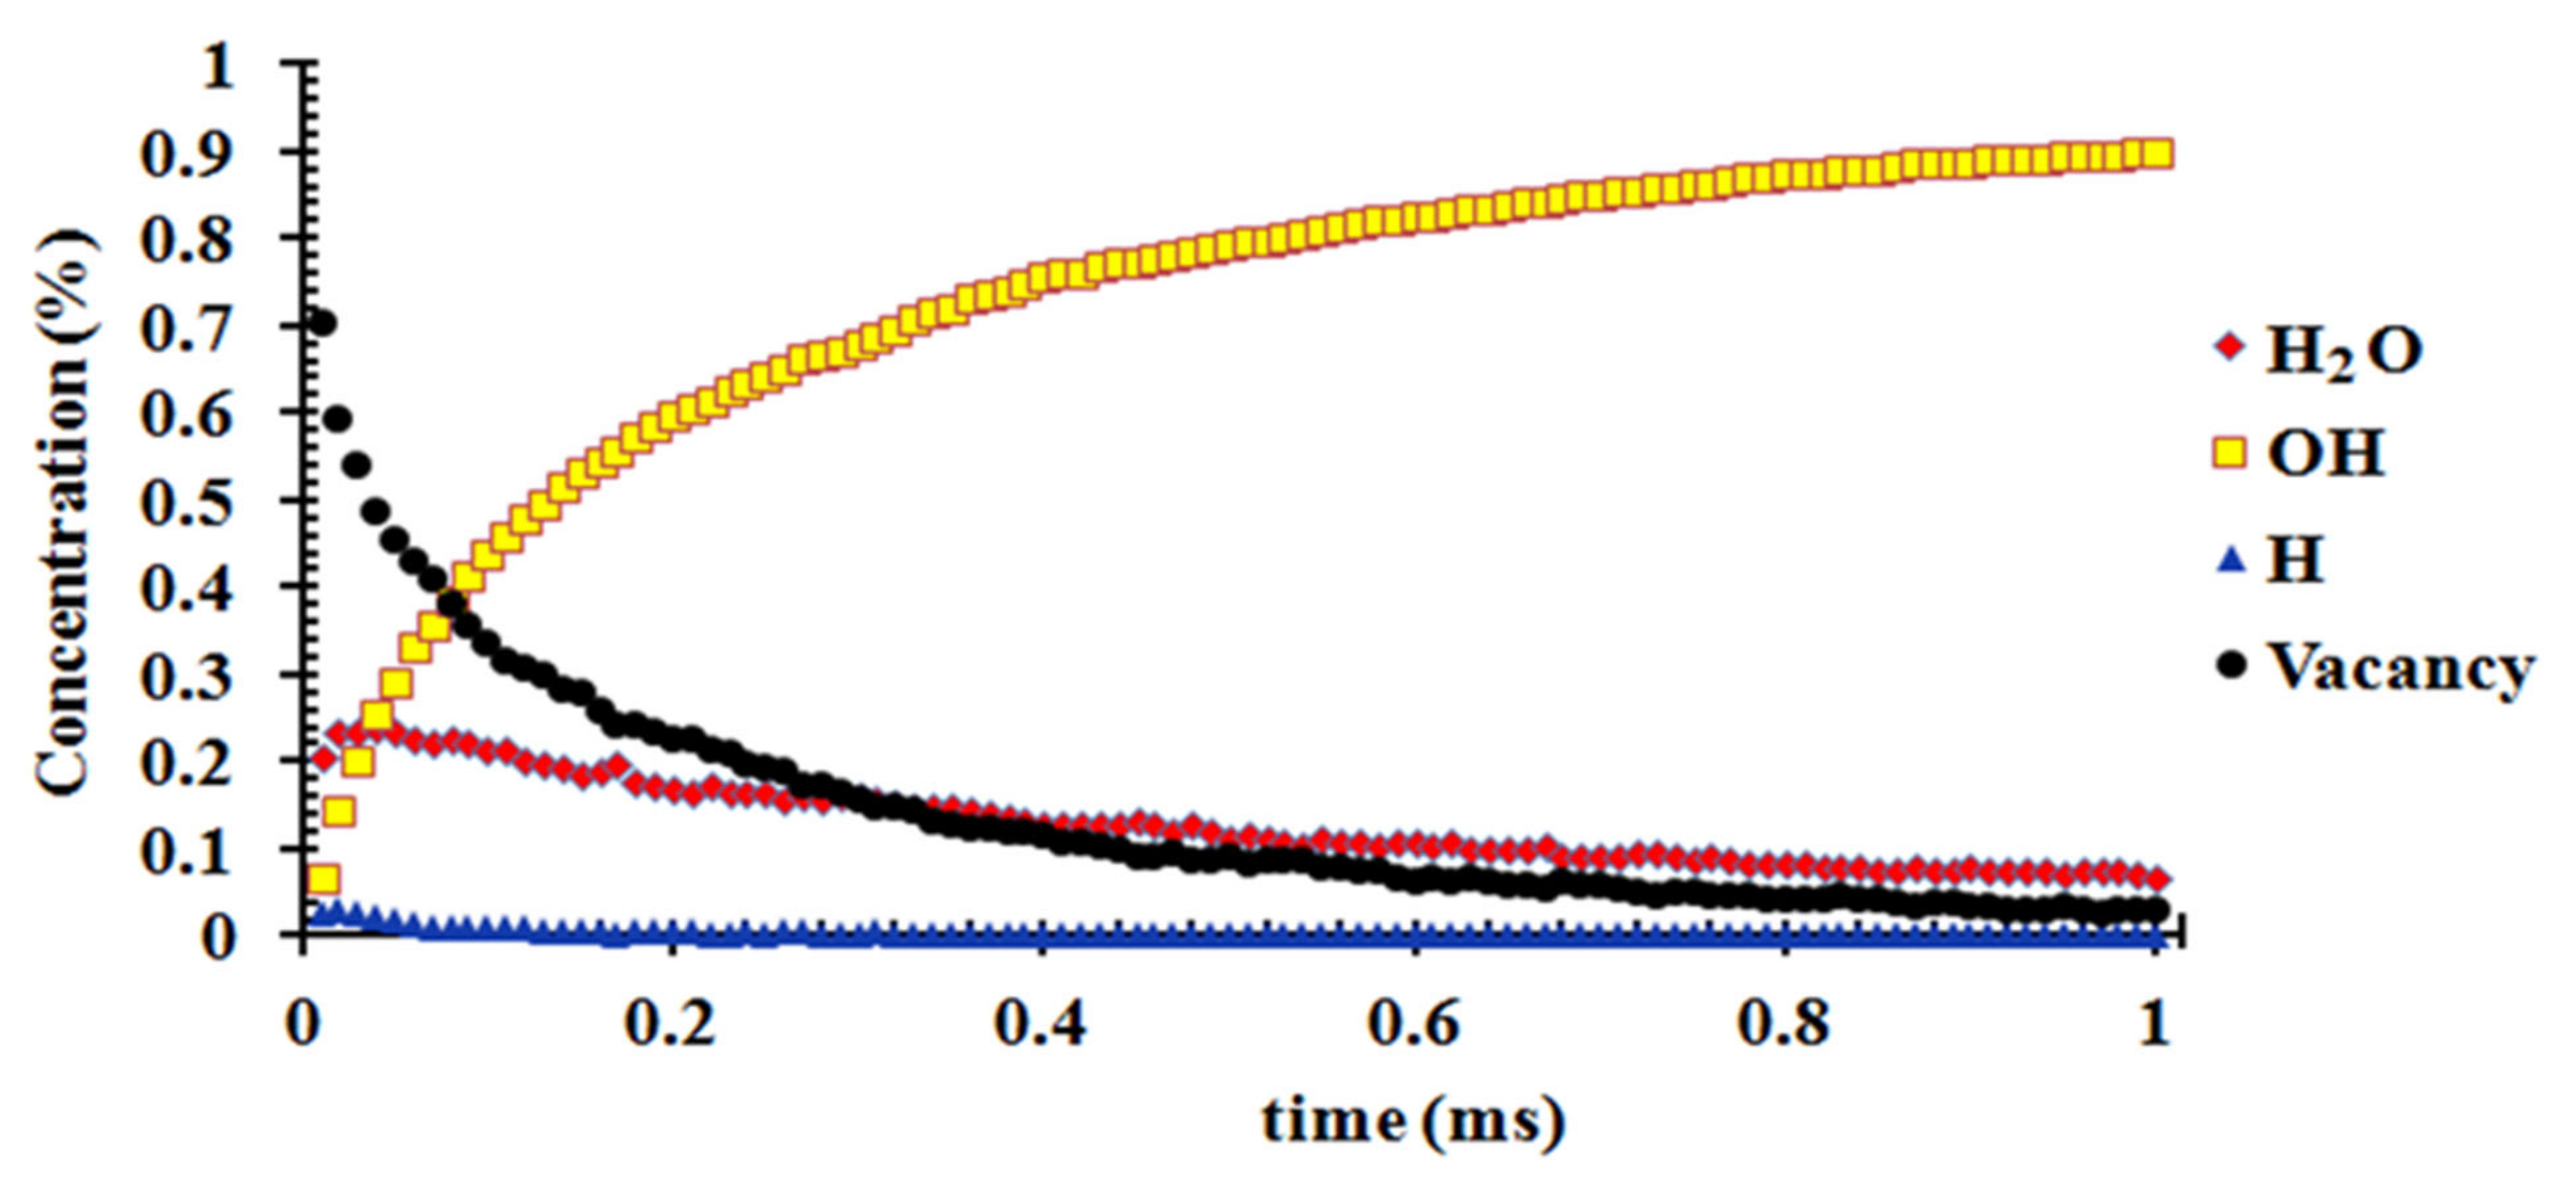
Reaction scheme in kinetic Monte Carlo and rate coefficient are presented in Table 3. Based on the reaction rate coefficient of these reactions, the kinetic model of the surface reaction on the (110) surface shows that H2O is firstly adsorbed on the surface and 20% of the adsorption sites are occupied by H2O, and only a few OH and H atoms appear at the surface at 10–20 ns (Figure 11 and Figure 12). The concentration of H2O adsorbed on the (110) surface increases at a reaction time of less than 40 ns, while it gradually decreases afterwards. The concentration of OH on the surface increases rapidly with time and reaches approximately 90% at a reaction time of 1 ms (Figure 11 and Figure 12). The concentration of H adsorbed on the surface is very low and decreases to nearly zero in 1 ms (Figure 11 and Figure 12).

4. Discussion

4.1. Adsorption Capacity and Rate Comparison of H2O on the Different Surfaces of Molybdenite and Its Implications for the Mineral Reactivity

The distribution of H2O molecules in the space above the surface is different between surfaces (001) and (110), indicating that the sorption capacity and mechanism of H2O on the two surfaces are significantly different (Figure 4). The H2O adsorption on the (001) surface is multi-layer adsorption, while the H2O adsorption on the (110) surface is single-layer adsorption (Figure 4). The periodic adsorption of H2O above the (001) surface (Figure 4) suggests that it is probably the result of the periodic repulsive force between the O atom of H2O and the S atom of MoS2. The sorption capacity of H2O on the two surfaces increases with the H2O fugacity but decreases with the temperature (0–120 °C), indicating that the relatively wet and cold environment is beneficial for the H2O molecules’ adsorption capacity on the mineral surface (Figure 7), while a very low temperature can decrease the adsorption rate of H2O on the surface (Figure 10). The sorption isotherm of H2O shows that the sorption capacity of the (110) surface is much stronger than that of the (001) surface (Figure 5 and Figure 6), indicating that the (110) surface can obtain more water adsorbed on its surface in the weathering of MoS2 and its interaction with water.
Although a temperature decrease can improve the sorption capacity of H2O on the MoS2 surface, it can significantly decrease the adsorption rate of H2O on the MoS2 surface, suggesting that the effect of temperature on water sorption on MoS2 is complicated. The adsorption rate coefficient of H2O on the (110) surface was always larger than that on the (001) surface at all the temperatures (0~100 °C) and relative humidity (0~100%) investigated (Figure 10). Therefore, both the adsorption capacity and rate coefficient of H2O on the (110) surface are stronger than those on the (001) surface, suggesting that the (110) surface is the predominant surface that controls the solubility and reactivity of MoS2 in its interaction with water, because the (110) surface can attract many more water molecules, and the atoms of Mo and S and their bonds are also exposed to the H2O molecules.

4.2. Adsorption Mechanism of H2O on the Surfaces of Molybdenite

Compared to the possible adsorption geometry optimization using DFT techniques at 0 K, the annealing dynamics method explores many more possible adsorption geometries at a larger temperature range from 10 to 100,000 K. The most stable adsorption sites of H2O on the (001) and (110) surfaces derived from annealing dynamics are much more stable than the sites derived from optimization with DFT. For example, the most stable adsorption site on the Mo and S atoms at the edge of the (001) surface (equivalent to the (110) surface) has the lowest adsorption energy of −0.55 eV [14], which is much higher than that of the adsorption sites with adsorption energy lower than −2.5 eV, e.g., 001-G1 and 110-G1 (Figure 7). The adsorption sites of H2O on the (001) surface have been considered unstable (positive adsorption energy) due to the repulsive interaction between S and O atoms [14], but the annealing dynamics indicated that H2O molecules adsorbed on the (001) surface can also remain stable (e.g., 001-G1 and 001-G2 with negative adsorption energy lower than −2.2 eV) by means of changing the direction of H2O molecules to direct the two H atoms towards the S atom at the surface in order to lower the total energy and repulsive interaction (Figure 8). For the (110) surface, the adsorption site 001-G1 has larger distances between Mo and O atoms and between S and H atoms than 001-G2, which causes the O atom (of H2O) and S atom (of MoS2) to receive more electrons from the Mo atom (of MoS2) and H atom (of H2O). However, the 001-G1 adsorption site is more stable than 001-G2, as shown by the lower adsorption energy (Figure 7), because 001-G1 has larger distances between O and S and between H and Mo atoms (Figure 9b,d), suggesting that the repulsive interactions between O and S and between H and Mo atoms are the major factors that control the energy level of the adsorption geometry. These results suggested that the annealing dynamics and larger supercells with more periodic clusters can provide more possible and stable sites than the common cluster optimization, which provides new, complete insights in understanding the adsorption mechanism at the level of geochemical interest.

4.3. Kinetic Modeling of Dissociative Adsorption of H2O on the (110) Surface and Its Implication for the Weathering of Molybdenite in the Surface Environment

We selected the (110) surface to predict the progress of H2O adsorption and dissociation as a function of time due to the great reactivity of the (110) surface of molybdenite. Although a previous study showed that the H2O adsorbed on molybdenite can dissociate into OH and H at room temperature [15], the effects of the adsorption/desorption rate of water, the formation rate of OH and H into H2O and the desorption and sorption rate of H on the overall reaction rate have not been considered. To more closely reflect the real situation, we calculated and considered the reaction rates of all of these step reactions in the KMC modeling, which was firstly applied to predict the dissociation adsorption of the H2O reaction on the (110) surface as a function of time (Figure 11 and Figure 12). The modeling result indicated that the adsorption and dissociation of H2O into OH and H can occur in the time scale of ns (10−9 s) at 25 °C and in a humid environment (Figure 11 and Figure 12). Moreover, the OH can occupy most adsorption sites of the (110) surface in one microsecond (Figure 11 and Figure 12), suggesting that OH covers the surface of MoS2 in a very short time, and the dissociative adsorption of H2O is not the rate-limiting step in the oxidation of MoS2 at a normal temperature. This explains the experimental SIM observation that H2O and OH (rather than H+/H or H2) occupied the surface of MoS2 in a short time [24]. In the overall reaction of MoS2 oxidation (Reaction 1), the adsorption/capture of molecular oxygen on the OH shell around molybdenite may be an important reaction controlling the rate of MoS2 oxidation/weathering, which needs further detailed investigation.

5. Conclusions

By employing molecular dynamics and kinetic Monte Carlo modeling, we investigated the adsorption isotherm of H2O on the (001) and (110) surfaces of molybdenite at temperatures ranging from 0 to 120 °C and H2O fugacity ranging from 1 to 10 bar, which indicated that an increase in fugacity and decrease in temperature can promote adsorption, but a very low temperature can lower the adsorption rate coefficient. The adsorption geometry of H2O on the (001) and (110) surfaces at 298 K was explored using annealing dynamics, which provides a more stable geometry with lower adsorption energy, relative to a previous report using DFT geometry optimization. The adsorption rate coefficient and capacity of H2O on the two surfaces indicated that the (110) and (010) surfaces are the predominant surfaces that control the solubility and reactivity of MoS2 in its interaction with water. The reaction time of 1 ms (10−3 s) is sufficient for H2O to adsorb and dissociate into OH at the (001) surface, suggesting that the adsorption and dissociation of H2O on the MoS2 surface is not the rate-limiting step in MoS2 oxidation/weathering.

Supplementary Materials

The following supporting information can be downloaded at: https://www.mdpi.com/article/10.3390/molecules27248710/s1. Section S1: Desorption rate of H2 from MoS2 unit cell based on geometry optimization; Section S2: Formation and dissociation rate coefficient of H2O above MoS2; Section S3: Adsorption and desorption rate coefficient of H2O above MoS2.

Author Contributions

Writing: R.W., Writing and visualization: X.W., Concept and method: Z.Z., Funding acquisition: S.N., J.D. and D.W. All authors have read and agreed to the published version of the manuscript.

Funding

National Supercomputing Center in Shenzhen, China for their technical support. We are grateful for the financial support of the National Natural Science Foundation of China (41807357, 21776197), Natural Science Foundation of Sichuan Province (22NSFSC0191, 22NSFSC3990). Everest Scientific Research Program of Chengdu University of Technology (80000-2021ZF11419) and Innovative training program (S202110616004).

Institutional Review Board Statement

Not applicable.

Informed Consent Statement

Not applicable.

Data Availability Statement

All the data used is included in the article and Supplementary Materials.

Acknowledgments

Thanks should be given to the anonymous reviewers and academic editors.

Conflicts of Interest

The authors declare no conflict of interest.

Abbreviations

KMCKinetic Monte Carlo
XPSX-ray photoelectron spectroscopy
AFMAtomic force microscopy
DFTDensity functional theory
SIMSSecondary ion mass spectroscopy
GPWGaussian-Plane Wave
PBEPerdew–Burke–Eenzerhof
LDALocal-density approximation
PW91Perdew-Wang, 1991
UFFUniversal force field

References

  1. Gardner, C.B.; Carey, A.E.; Lyons, W.B.; Goldsmith, S.T.; McAdams, B.; Trierweiler, A.M. Molybdenum, vanadium, and uranium weathering in small mountainous rivers and rivers draining high-standing islands. Geochim. Cosmochim. Acta 2017, 219, 22–43. [Google Scholar] [CrossRef]
  2. Greaney, A.T.; Rudnick, R.L.; Gaschnig, R.M.; Whalen, J.B.; Luais, B.; Clemens, J.D. Geochemistry of molybdenum in the continental crust. Geochim. Cosmochim. Acta 2018, 238, 36–54. [Google Scholar] [CrossRef] [Green Version]
  3. Mendel, R.R. Biology of the molybdenum cofactor. J. Exp. Bot. 2007, 58, 2289–2296. [Google Scholar] [CrossRef] [PubMed] [Green Version]
  4. Schwarz, G.; Mendel, R.R.; Ribbe, M.W. Molybdenum cofactors, enzymes and pathways. Nature 2009, 460, 839. [Google Scholar] [CrossRef] [PubMed]
  5. Wedepohl, K.H. The composition of the continental crust. Geochim. Cosmochim. Acta 1995, 59, 1217–1232. [Google Scholar] [CrossRef]
  6. Hess, F.L. Molybdenum Deposits, A Short Review; Government Publishing Office: Washington, DC, USA, 1924.
  7. LeAnderson, P.J.; Schrader, E.L.; Brake, S.; Kaback, D.S. Behavior of molybdenum during weathering of the Ceresco Ridge porphyry molybdenite deposit, Climax, Colorado and a comparison with the Hollister deposit, North Carolina. Appl. Geochem. 1987, 2, 399–415. [Google Scholar] [CrossRef]
  8. Yamamoto, M.; Einstein, T.L.; Fuhrer, M.S.; Cullen, W.G. Anisotropic etching of atomically thin MoS2. J. Phys. Chem. C 2013, 117, 25643–25649. [Google Scholar] [CrossRef]
  9. Zhang, X.; Jia, F.; Yang, B.; Song, S. Oxidation of molybdenum disulfide sheet in water under in situ atomic force microscopy observation. J. Phys. Chem. C 2017, 121, 9938–9943. [Google Scholar] [CrossRef]
  10. Ross, S.; Sussman, A. Surface oxidation of molybdenum disulfide. J. Phys. Chem. 1955, 59, 889–892. [Google Scholar] [CrossRef]
  11. Buck, V. Preparation and properties of different types of sputtered MoS2 films. Wear 1987, 114, 263–274. [Google Scholar] [CrossRef]
  12. Raybaud, P.; Hafner, J.; Kresse, G.; Kasztelan, S.; Toulhoat, H. Ab initio study of the H2–H2S/MoS2 gas–solid interface: The nature of the catalytically active sites. J. Catal. 2000, 189, 129–146. [Google Scholar] [CrossRef]
  13. Ataca, C.; Ciraci, S. Dissociation of H2O at the vacancies of single-layer MoS2. Phys. Rev. B 2012, 85, 195410. [Google Scholar] [CrossRef]
  14. Ghuman, K.K.; Yadav, S.; Singh, C.V. Adsorption and dissociation of H2O on monolayered MoS2 edges: Energetics and mechanism from ab initio simulations. J. Phys. Chem. C 2015, 119, 6518–6529. [Google Scholar] [CrossRef]
  15. Kinniburgh, D.G.; Cooper, D.M. PhreePlot: Creating Graphical Output with PHREEQC; Centre for Ecology and Hydrology: Gwynedd, UK, 2011. [Google Scholar]
  16. Parkhurst, D.L.; Appelo, C.A.J. Description of Input and Examples for PHREEQC Version 3—A Computer Program for Speciation, Batch-Reaction, One-Dimensional Transport, and Inverse Geochemical Calculations; U.S. Geological Survey Techniques and Methods: Denver, CO, USA, 2013. [Google Scholar]
  17. Raybaud, P.; Hafner, J.; Kresse, G.; Toulhoat, H. Ab initio density functional studies of transition-metal sulphides: II. Electronic structure. J. Phys. Condens. Matter 1997, 9, 11107. [Google Scholar] [CrossRef]
  18. Stotu, U.; Marnntall, T. Molybdenite polytypes in theory and occurrence. II. Some naturally-occurring polytypes of molybdenite. Am. Mineral. 1970, 55, 1857–1875. [Google Scholar]
  19. Luck, J.M.; Allègre, C.J. The study of molybdenites through the 187Re-187Os chronometer. Earth Planet. Sci. Lett. 1982, 61, 291–296. [Google Scholar] [CrossRef]
  20. Peng, J.; Zhou, M.F.; Hu, R.; Shen, N.; Yuan, S.; Bi, X.; Du, A.; Qu, W. Precise molybdenite Re–Os and mica Ar–Ar dating of the Mesozoic Yaogangxian tungsten deposit, central Nanling district, South China. Miner. Depos. 2006, 41, 661–669. [Google Scholar] [CrossRef]
  21. Dickinson, R.G.; Pauling, L. The crystal structure of molybdenite. J. Am. Chem. Soc. 1923, 45, 1466–1471. [Google Scholar] [CrossRef]
  22. Bronsema, K.D.; De Boer, J.L.; Jellinek, F. On the structure of molybdenum diselenide and disulfide. Z. Für Anorg. Und Allg. Chem. 1986, 540, 15–17. [Google Scholar] [CrossRef]
  23. Zubavichus, Y.V.; Slovokhotov, Y.L.; Schilling, P.J.; Tittsworth, R.C.; Golub, A.S.; Protzenko, G.A.; Novikov, Y.N. X-ray absorption fine structure study of the atomic and electronic structure of molybdenum disulfide intercalation compounds with transition metals. Inorg. Chim. Acta 1998, 280, 211–218. [Google Scholar] [CrossRef]
  24. Karolewski, M.A.; Cavell, R.G. SIMS study of Cs/MoS2 (0001): II. Chemisorption of O2, H2O, HCOOH, CO2 and CS2. Surf. Sci. 1989, 219, 261–276. [Google Scholar] [CrossRef]
  25. Rappe, A.K.; Casewit, C.J.; Colwell, K.S.; Goddard, W.A.; Skiff, W.M. UFF, a full periodic table force field for molecular mechanics and molecular dynamics simulations. J. Am. Chem. Soc. 1992, 114, 10024–10035. [Google Scholar] [CrossRef]
  26. Jansen, A.P.J. An Introduction to Kinetic Monte Carlo Simulations of Surface Reactions; Springer: Berlin, Germany, 2012. [Google Scholar]
  27. Buck, A.L. New equations for computing vapor pressure and enhancement factor. J. Appl. Meteorol. 1981, 20, 1527–1532. [Google Scholar] [CrossRef]
  28. Haynes, W.M. CRC Handbook of Chemistry and Physics; CRC Press: Boca Raton, FL, USA, 2014. [Google Scholar]
  29. Liang, T.; Sawyer, W.G.; Perry, S.S.; Sinnott, S.B.; Phillpot, S.R. Energetics of oxidation in MoS2 nanoparticles by density functional theory. J. Phys. Chem. C 2011, 115, 10606–10616. [Google Scholar] [CrossRef]
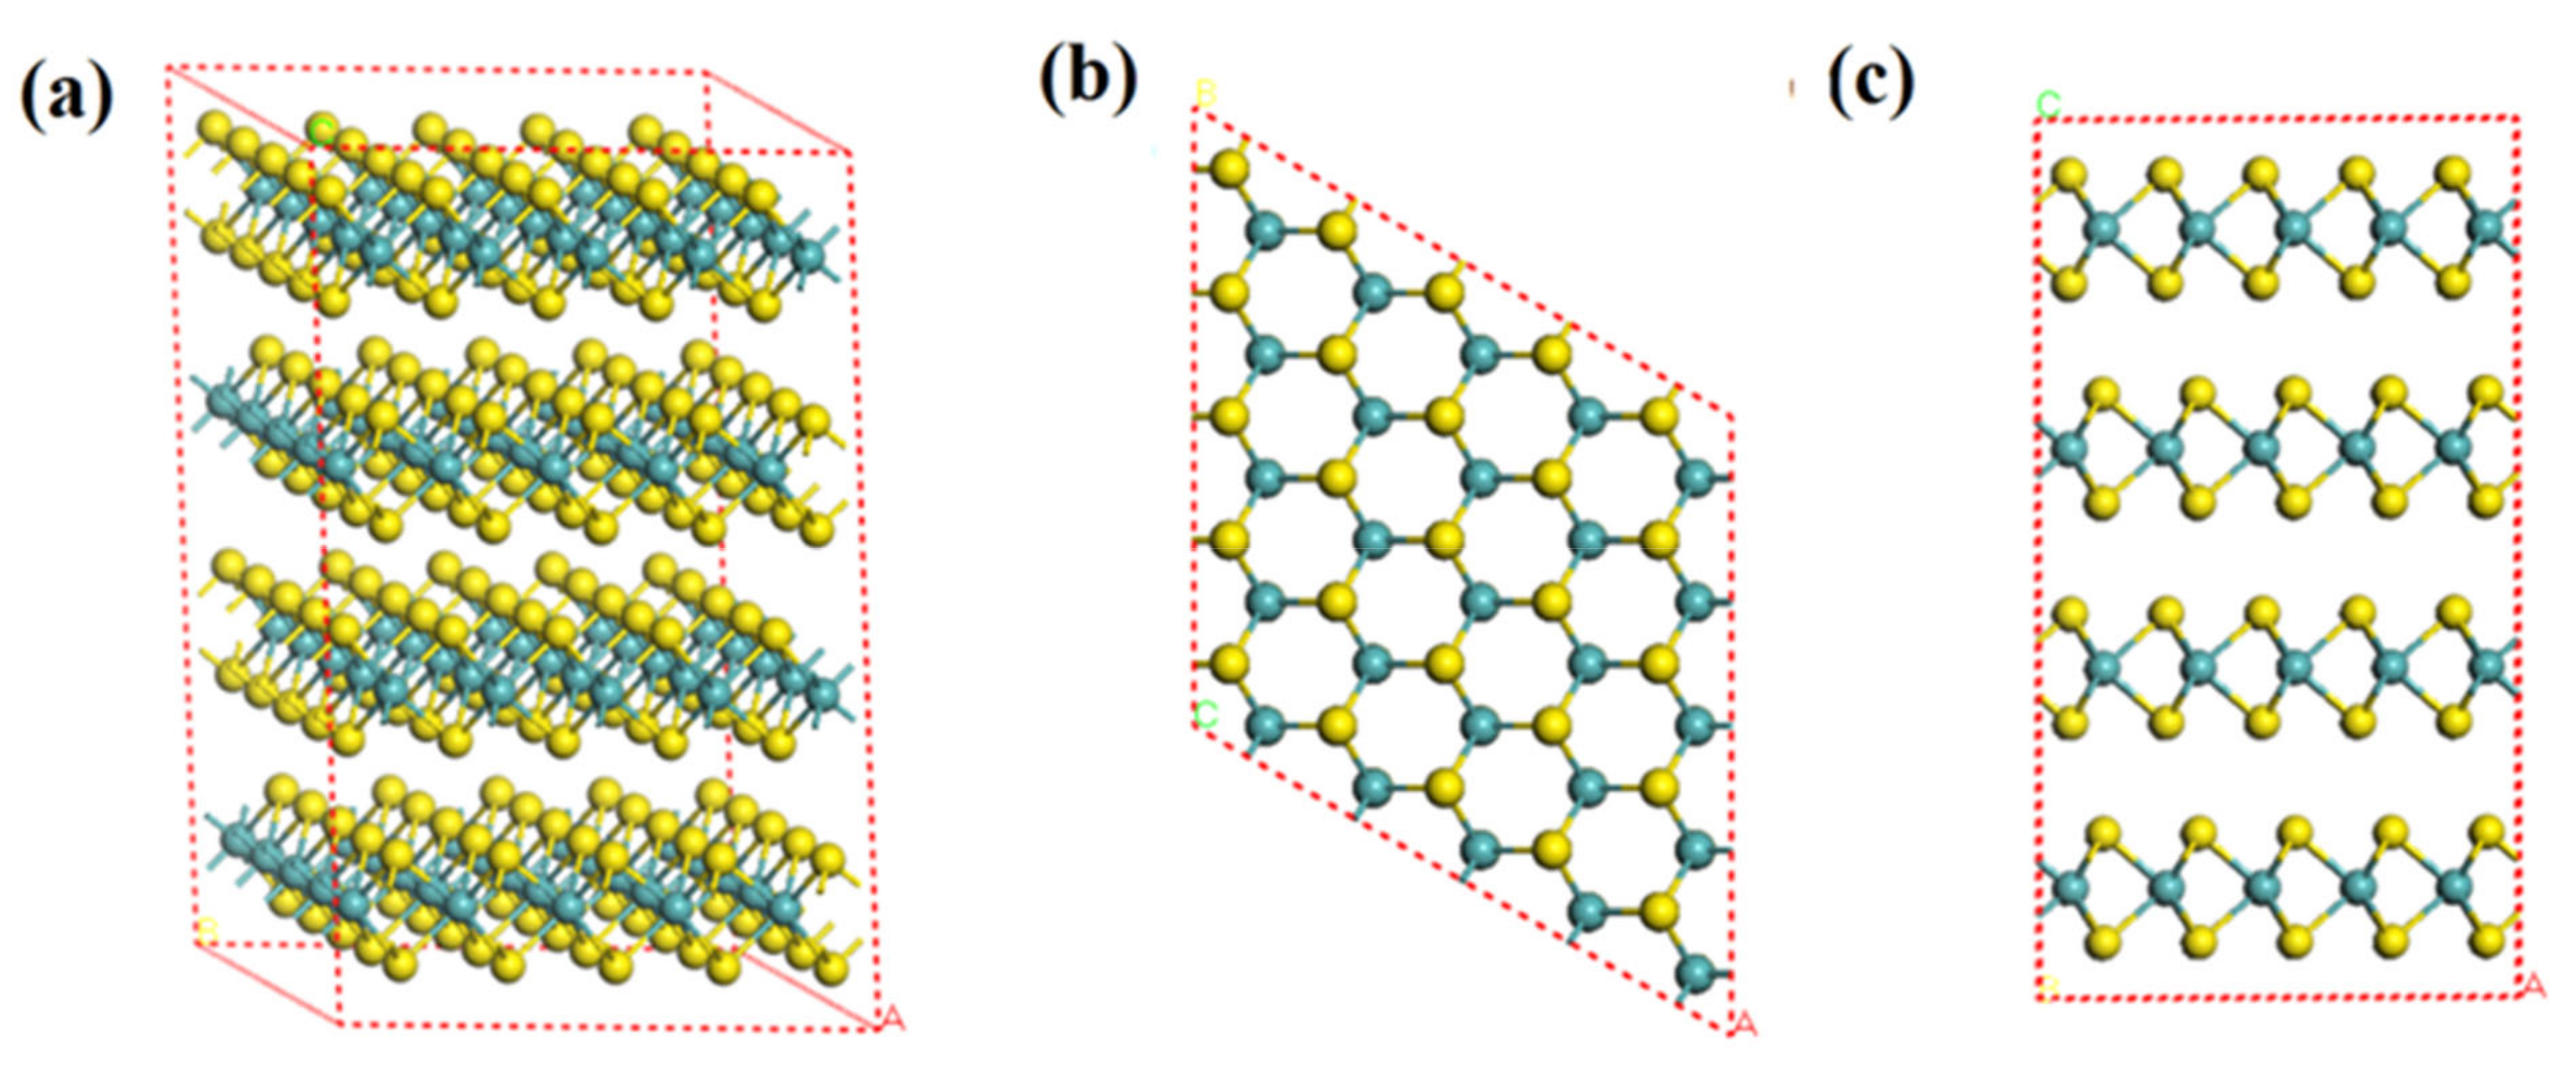
Figure 1. Supercell of MoS2(2H) crystal (5 × 5 × 2) (a): three-dimensional, (b): top view (001), (c): side view (110) (yellow ball is sulfur atom and blue ball is molybdenum atom).
Molecules 27 08710 g001
Figure 2. Eh-pH diagram of Mo-S-H2O system at 25 °C and 1 bar.
Molecules 27 08710 g002
Figure 3. Oxidation process of molybdenite and speciation change as a function of the number of reaction steps.
Molecules 27 08710 g003
Figure 4. Sorption saturation status of H2O molecule on the supercell (5 × 5 × 2) of (001) surface at (a) 1 bar and (b) 10 bar, and (110) surface at (c) 1 bar and (d) 10 bar (one red point represents one water molecule; yellow ball represents sulfur atom; blue ball represents molybdenum atom).
Molecules 27 08710 g004
Figure 5. Sorption capacity change of H2O on the (001) and (110) surfaces of MoS2 at 1 and 10 bar.
Molecules 27 08710 g005
Figure 6. Sorption isotherm of H2O molecules on the (a): (001) and (b): (110) surfaces as a function of temperature.
Molecules 27 08710 g006
Figure 7. Adsorption energy of H2O at different adsorption sites on the (001) and (110) surfaces.
Molecules 27 08710 g007
Figure 8. Geometry of the two most stable adsorption sites for H2O on the (001) surface: (a,b): 001-G1; (c,d): 001-G2 (yellow ball represents sulfur atom; blue ball represents molybdenum atom).
Molecules 27 08710 g008
Figure 9. Geometry of the two most stable adsorption sites for H2O at the (110) surface: (a,b): 110-G1; (c,d): 110-G2 (yellow ball represents sulfur atom; blue ball represents molybdenum atom).
Molecules 27 08710 g009
Figure 10. Adsorption rate coefficient of water molecules on molybdenite as a function of temperature (a) and relative humidity (b).
Molecules 27 08710 g010
Figure 11. KMC modeling of the dissociative adsorption of H2O on the molybdenite (001) surface in one microsecond at 298 K.
Molecules 27 08710 g011
Figure 12. Relative concentration variance of H2O, OH, H on the molybdenite (110) surface in one microsecond at 298 K.
Molecules 27 08710 g012
Table 1. Comparison of DFT calculation using different functional and experimental parameters in MoS2 cell geometry optimization.
SourceLattice Constant—a (Å)Lattice Constant—c (Å)Mo-S Bond Length (Å)S-S Bond Length (Å)Band Gap (eV)
LDA3.13612.0522.3813.1100.74
PBE3.16812.6162.4073.1281.102
PW913.18012.6902.4113.1261.023
Dickinson and Pauling, 1923 [21]3.1512.3 1.29
Swanson et al., 19553.1612.295 1.29
Bronsema et al., 1986 [22]3.1612.296
Zubavichus et al., 1998 [23] 2.393.16
Table 2. Adsorption rate coefficient of H2O (KH2O-ads) on the (001) and (110) surfaces of molybdenite at temperature (t) from 0 to 100 °C and corresponding water vapor saturation pressure (Pvp).
T (°C)Pvp (atm)A-Site (Å2)KH2O-ads (S−1)
(001)00.0063.232.97 × 107
250.03134.632.13 × 108
500.12184.577.84 × 108
750.38066.273.24 × 109
10016.097.98 × 109
(110)00.0065.685.22 × 107
250.03137.313.35 × 108
500.12188.921.53 × 109
750.380612.106.25 × 109
100111.611.52 × 1010
Table 3. Reaction scheme in kinetic Monte Carlo dynamics and rate coefficient.
ReactionRate Coefficient (S−1)
MoS2 + H2O = MoS2-H2O4.84 ×107
MoS2-H2O = MoS2 + H2O3.62 × 1010
MoS2-H2O = MoS2-OH + H2.8 × 1010
MoS2-OH + H = MoS2-H2O2.9 × 1011
2H-MoS2 = MoS2 + H22.38 × 108
MoS2 + H2 = 2H-MoS21.20 × 108
Publisher’s Note: MDPI stays neutral with regard to jurisdictional claims in published maps and institutional affiliations.