
Portable vs. Benchtop NIR-Sensor Technology for Classification and Quality Evaluation of Black Truffle

 , ,
, ,  ,
, 
Abstract
: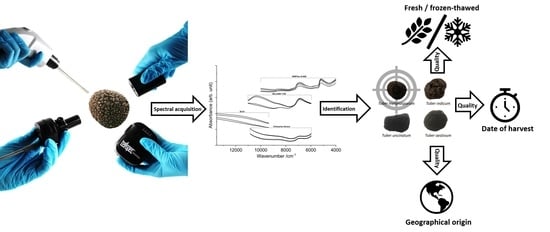
1. Introduction
2. Results
2.1. Visual Spectral Exploration and Investigation
2.2. Classification and Quality Assurance of Black Truffle
2.2.1. Classification of Fresh Truffle
2.2.2. Discrimination between T. melanosporum and T. indicum
2.2.3. Quality Evaluation—Discrimination between Fresh and Frozen/Thawed Truffle
2.2.4. Quality Evaluation—Aging Studies of T. aestivum
2.2.5. Feasibility Review—T. melanosporum Classification According to the Geographical Origin
3. Discussion
4. Materials and Methods
4.1. Truffle Samples
4.2. Spectroscopic Data Acquisition
4.3. Near Infrared Spectrometer
4.4. Spectral Processing and Multivariate Data Analysis
4.4.1. Spectral Pretreatments
4.4.2. Multivariate Data Analysis
5. Conclusions
Author Contributions
Funding
Institutional Review Board Statement
Informed Consent Statement
Data Availability Statement
Acknowledgments
Conflicts of Interest
References
- Weesepoel, Y.; Alewijn, M.; Wijtten, M.; Müller-Maatsch, J. Detecting Food Fraud in Extra Virgin Olive Oil Using a Prototype Portable Hyphenated Photonics Sensor. J. AOAC Int. 2021, 104, 7–15. [Google Scholar] [CrossRef] [PubMed]
- O’Brien, N.; Hulse, C.A.; Pfeifer, F.; Siesler, H.W. Near Infrared Spectroscopic Authentication of Seafood. J. Near Infrared Spectrosc. JNIRS 2013, 21, 299–305. [Google Scholar] [CrossRef] [Green Version]
- Liu, N.; Parra, H.A.; Pustjens, A.; Hettinga, K.; Mongondry, P.; van Ruth, S.M. Evaluation of portable near-infrared spectroscopy for organic milk authentication. Talanta 2018, 184, 128–135. [Google Scholar] [CrossRef]
- Okubo, N.; Kurata, Y. Nondestructive Classification Analysis of Green Coffee Beans by Using Near-Infrared Spectroscopy. Foods 2019, 8, 82. [Google Scholar] [CrossRef] [Green Version]
- Wiedemair, V.; de Biasio, M.; Leitner, R.; Balthasar, D.; Huck, C.W. Application of Design of Experiment for Detection of Meat Fraud with a Portable Near-Infrared Spectrometer. CAC 2018, 14, 58–67. [Google Scholar] [CrossRef]
- Oliveira, M.M.; Cruz-Tirado, J.P.; Barbin, D.F. Nontargeted Analytical Methods as a Powerful Tool for the Authentication of Spices and Herbs: A Review. Compr. Rev. Food Sci. Food Saf. 2019, 18, 670–689. [Google Scholar] [CrossRef] [Green Version]
- Guelpa, A.; Marini, F.; Du Plessis, A.; Slabbert, R.; Manley, M. Verification of authenticity and fraud detection in South African honey using NIR spectroscopy. Food Control 2017, 73, 1388–1396. [Google Scholar] [CrossRef]
- Ferreiro-González, M.; Espada-Bellido, E.; Guillén-Cueto, L.; Palma, M.; Barroso, C.G.; Barbero, G.F. Rapid quantification of honey adulteration by visible-near infrared spectroscopy combined with chemometrics. Talanta 2018, 188, 288–292. [Google Scholar] [CrossRef] [PubMed]
- Lindley, J. Food fraud: An international snapshot and lessons for Australia. JFC 2021, 28, 480–492. [Google Scholar] [CrossRef]
- Pei, X.; Tandon, A.; Alldrick, A.; Giorgi, L.; Huang, W.; Yang, R. The China melamine milk scandal and its implications for food safety regulation. Food Policy 2011, 36, 412–420. [Google Scholar] [CrossRef]
- Premanandh, J. Horse meat scandal-A wake-up call for regulatory authorities. Food Control 2013, 34, 568–569. [Google Scholar] [CrossRef]
- Valand, R.; Tanna, S.; Lawson, G.; Bengtström, L. A review of Fourier Transform Infrared (FTIR) spectroscopy used in food adulteration and authenticity investigations. Food Addit. Contam. Part Chem. Anal. Control Expo. Risk Assess. 2020, 37, 19–38. [Google Scholar] [CrossRef]
- Cozzolino, D. Recent Trends on the Use of Infrared Spectroscopy to Trace and Authenticate Natural and Agricultural Food Products. Appl. Spectrosc. Rev. 2012, 47, 518–530. [Google Scholar] [CrossRef]
- McGrath, T.F.; Haughey, S.A.; Islam, M.; Elliott, C.T. The potential of handheld near infrared spectroscopy to detect food adulteration: Results of a global, multi-instrument inter-laboratory study. Food Chem. 2021, 353, 128718. [Google Scholar] [CrossRef] [PubMed]
- Beć, K.B.; Grabska, J.; Huck, C.W. Principles and Applications of Miniaturized Near-Infrared (NIR) Spectrometers. Chemistry 2021, 27, 1514–1532. [Google Scholar] [CrossRef]
- Beć, K.B.; Grabska, J.; Siesler, H.W.; Huck, C.W. Handheld near-infrared spectrometers: Where are we heading? NIR News 2020, 31, 28–35. [Google Scholar] [CrossRef] [Green Version]
- Osborne, B.G. Near-infrared spectroscopy in food analysis. In Encyclopedia of Analytical Chemistry: Applications, Theory, and Instrumentation; Meyers, R.A., Ed.; Wiley: Chichester, NY, USA, 2000; ISBN 9780470027318. [Google Scholar]
- Wang, D.; Zhou, X.; Jin, T.; Hu, X.; Zhong, J.; Wu, Q. Application of near-infrared spectroscopy to agriculture and food analysis. Guang Pu Xue Yu Guang Pu Fen Xi 2004, 24, 447–450. [Google Scholar] [PubMed]
- Jimaré Benito, M.T.; Bosch Ojeda, C.; Sanchez Rojas, F. Process Analytical Chemistry: Applications of Near Infrared Spectrometry in Environmental and Food Analysis: An Overview. Appl. Spectrosc. Rev. 2008, 43, 452–484. [Google Scholar] [CrossRef]
- Kirchler, C.G.; Pezzei, C.K.; Beć, K.B.; Mayr, S.; Ishigaki, M.; Ozaki, Y.; Huck, C.W. Critical evaluation of spectral information of benchtop vs. portable near-infrared spectrometers: Quantum chemistry and two-dimensional correlation spectroscopy for a better understanding of PLS regression models of the rosmarinic acid content in Rosmarini folium. Analyst 2017, 142, 455–464. [Google Scholar] [CrossRef] [PubMed]
- El Karkouri, K.; Couderc, C.; Decloquement, P.; Abeille, A.; Raoult, D. Rapid MALDI-TOF MS identification of commercial truffles. Sci. Rep. 2019, 9, 17686. [Google Scholar] [CrossRef]
- Krauß, S.; Vetter, W. Geographical and Species Differentiation of Truffles (Tuber spp.) by Means of Stable Isotope Ratio Analysis of Light Elements (H, C, and N). J. Agric. Food Chem. 2020, 68, 14386–14392. [Google Scholar] [CrossRef]
- Šiškovič, N.; Strojnik, L.; Grebenc, T.; Vidrih, R.; Ogrinc, N. Differentiation between species and regional origin of fresh and freeze-dried truffles according to their volatile profiles. Food Control 2021, 123, 107698. [Google Scholar] [CrossRef]
- Schelm, S.; Siemt, M.; Pfeiffer, J.; Lang, C.; Tichy, H.-V.; Fischer, M. Food Authentication: Identification and Quantitation of Different Tuber Species via Capillary Gel Electrophoresis and Real-Time PCR. Foods 2020, 9, 501. [Google Scholar] [CrossRef]
- Segelke, T.; von Wuthenau, K.; Neitzke, G.; Müller, M.-S.; Fischer, M. Food Authentication: Species and Origin Determination of Truffles (Tuber spp.) by Inductively Coupled Plasma Mass Spectrometry and Chemometrics. J. Agric. Food Chem. 2020, 68, 14374–14385. [Google Scholar] [CrossRef] [PubMed]
- Segelke, T.; Schelm, S.; Ahlers, C.; Fischer, M. Food Authentication: Truffle (Tuber spp.) Species Differentiation by FT-NIR and Chemometrics. Foods 2020, 9, 922. [Google Scholar] [CrossRef] [PubMed]
- Marco, P.; Campo, E.; Oria, R.; Blanco, D.; Venturini, M.E. Effect of lyophilisation in the black truffle (Tuber melanosporum) aroma: A comparison with other long-term preservation treatments (freezing and sterilization). Acta Hortic. 2018, 1194, 831–838. [Google Scholar] [CrossRef]
- Culleré, L.; Ferreira, V.; Venturini, M.E.; Marco, P.; Blanco, D. Chemical and sensory effects of the freezing process on the aroma profile of black truffles (Tuber melanosporum). Food Chem. 2013, 136, 518–525. [Google Scholar] [CrossRef] [PubMed] [Green Version]
- Saltarelli, R.; Ceccaroli, P.; Cesari, P.; Barbieri, E.; Stocchi, V. Effect of storage on biochemical and microbiological parameters of edible truffle species. Food Chem. 2008, 109, 8–16. [Google Scholar] [CrossRef]
- Palacios, I.; Guillamón, E.; García-Lafuente, A.; Villares, A. Effects of Freeze-Drying Treatment on the Aromatic Profile of Tuber spp. Truffles. J. Food Process. Preserv. 2014, 38, 768–773. [Google Scholar] [CrossRef]
- Beganović, A.; Moll, V.; Huck, C.W. Comparison of Multivariate Regression Models Based on Water- and Carbohydrate-Related Spectral Regions in the Near-Infrared for Aqueous Solutions of Glucose. Molecules 2019, 24, 3696. [Google Scholar] [CrossRef] [Green Version]
- Wold, S.; Esbensen, K.; Geladi, P. Principal component analysis. Chemom. Intell. Lab. Syst. 1987, 2, 37–52. [Google Scholar] [CrossRef]
- Berrueta, L.A.; Alonso-Salces, R.M.; Héberger, K. Supervised pattern recognition in food analysis. J. Chromatogr. A 2007, 1158, 196–214. [Google Scholar] [CrossRef] [PubMed]
- Fisher, R.A. The Use Of Multiple Measurements In Taxonomic Problems. Ann. Eugen. 1936, 7, 179–188. [Google Scholar] [CrossRef]
- Kennard, R.W.; Stone, L.A. Computer Aided Design of Experiments. Technometrics 1969, 11, 137–148. [Google Scholar] [CrossRef]
- Tharwat, A.; Gaber, T.; Ibrahim, A.; Hassanien, A.E. Linear discriminant analysis: A detailed tutorial. AIC 2017, 30, 169–190. [Google Scholar] [CrossRef] [Green Version]


| Büchi NIRFlex N-500 | VIAVI Solutions MicroNIR 1700 | Consumer Physics SCiO | Tellspec Enterprise | |||||
|---|---|---|---|---|---|---|---|---|
| LDA a | Pred. b | LDA a | Pred. b | LDA a | Pred. b | LDA a | Pred. b | |
| Method 1 | 100% | 42/42 | 100% | 38/42 | 100% | 38/42 | 96.43% | 33/42 |
| Method 2 | 100% | 42/42 | 97.44% | 34/42 | 97.62% | 36/42 | 98.81% | 31/42 |
| Method 3 | 96.43% | 33/42 | 98.81% | 33/42 | 100% | 38/42 | 100% | 37/42 |
| Büchi NIRFlex N-500 | VIAVI Solutions MicroNIR 1700 | |||||
|---|---|---|---|---|---|---|
| LDA a | T.i. b | T.m. c | LDA a | T.i. b | T.m. c | |
| Method 1 | 100% | 13/13 | 8/8 | 100% | 12/12 | 9/9 |
| Method 2 | 100% | 11/11 | 10/10 | 100% | 13/13 | 8/8 |
| Method 3 | 100% | 9/9 | 12/12 | 100% | 12/13 | 8/8 |
| Consumer Physics SCiO | Tellspec Enterprise Sensor | |||||
| LDA a | T.i. b | T.m. c | LDA a | T.i. b | T.m. c | |
| Method 1 | 100% | 11/11 | 10/10 | 100% | 11/11 | 8/10 |
| Method 2 | 100% | 12/12 | 8/9 | 100% | 9/9 | 9/12 |
| Method 3 | 100% | 13/13 | 8/8 | 100% | 13/13 | 8/8 |
| Büchi NIRFlex N-500 | VIAVI MicroNIR 1700 | |||||
|---|---|---|---|---|---|---|
| Species | LDA. a | Pred. b | Pred. c | LDA. a | Pred. b | Pred. c |
| T. aestivum | 96.67% | 11/11 | 4/4 | 100% | 11/11 | 4/4 |
| T. indicum | 100% | 10/10 | 5/5 | 90% | 11/11 | 2/4 |
| T. melanosporum | 100% | 12/12 | 3/3 | 100% | 12/12 | 3/3 |
| T. uncinatum | 93.33% | 12/12 | 3/3 | 86.67% | 7/12 | 3/3 |
| Consumer Physics SCiO | Tellspec Enterprise | |||||
| LDA. a | Pred. b | Pred. c | LDA. a | Pred. b | Pred. c | |
| T. aestivum | 100% | 9/9 | 6/6 | 96.67% | 9/10 | 4/5 |
| T. indicum | 90.00% | 9/10 | 4/5 | 100% | 11/11 | 3/4 |
| T. melanosporum | 100% | 10/10 | 5/5 | 100% | 11/11 | 4/4 |
| T. uncinatum | 83.33% | 8/10 | 3/5 | 100% | 10/10 | 4/5 |
| Device | RMSECal /Days | RMSEVal /Days | R2Cal | R2Val | Factor |
|---|---|---|---|---|---|
| Büchi NIRFlex N-500 | 1.48 | 2.62 | 0.9536 | 0.859 | 10 |
| VIAVI solutions MicroNIR 1700 | 2.67 | 3.46 | 0.8486 | 0.7531 | 9 |
| Consumer Physics SCiO | 2.01 | 3.71 | 0.8700 | 0.7165 | 7 |
| Tellspec Enterprise | 3.91 | 4.48 | 0.7212 | 0.6471 | 4 |
| Büchi NIRFlex N-500 | Consumer Physics SCiO | Tellspec Enterprise Sensor | VIAVI Solutions MicroNIR 1700 | |
|---|---|---|---|---|
| 1 | log(1/R) | log(1/R) | log(1/R) | - |
| 2 | SNV | SNV | SG smoothing Polynomial order: 0 Smoothing points: 7 | SG smoothing Polynomial order: 0 Smoothing points: 7 |
| 3 | SG derivative Derivative order: 1 Polynomial order: 2 Smoothing Points: 11 | SG derivative Derivative order: 1 Polynomial order: 2 Smoothing points: 11 | SNV | SNV |
| 4 | Reduction | Reduction | SG derivative Derivative order: 1 Polynomial order: 2 Smoothing points: 11 | SG derivative Derivative order: 1 Polynomial order: 2 Smoothing points: 11 |
| 5 | Wavenumber region: 9980–4020 cm−1 | Wavenumber region: 13,422–9390 cm−1 | Reduction | Reduction |
| 6 | - | - | Wavenumber region: 10,641–6034 cm−1 | Wavenumber region: 10,052–6195 cm−1 |
Publisher’s Note: MDPI stays neutral with regard to jurisdictional claims in published maps and institutional affiliations. |
© 2022 by the authors. Licensee MDPI, Basel, Switzerland. This article is an open access article distributed under the terms and conditions of the Creative Commons Attribution (CC BY) license (https://creativecommons.org/licenses/by/4.0/).
Share and Cite
Kappacher, C.; Trübenbacher, B.; Losso, K.; Rainer, M.; Bonn, G.K.; Huck, C.W. Portable vs. Benchtop NIR-Sensor Technology for Classification and Quality Evaluation of Black Truffle. Molecules 2022, 27, 589. https://doi.org/10.3390/molecules27030589
Kappacher C, Trübenbacher B, Losso K, Rainer M, Bonn GK, Huck CW. Portable vs. Benchtop NIR-Sensor Technology for Classification and Quality Evaluation of Black Truffle. Molecules. 2022; 27(3):589. https://doi.org/10.3390/molecules27030589
Chicago/Turabian StyleKappacher, Christoph, Benedikt Trübenbacher, Klemens Losso, Matthias Rainer, Günther K. Bonn, and Christian W. Huck. 2022. "Portable vs. Benchtop NIR-Sensor Technology for Classification and Quality Evaluation of Black Truffle" Molecules 27, no. 3: 589. https://doi.org/10.3390/molecules27030589
APA StyleKappacher, C., Trübenbacher, B., Losso, K., Rainer, M., Bonn, G. K., & Huck, C. W. (2022). Portable vs. Benchtop NIR-Sensor Technology for Classification and Quality Evaluation of Black Truffle. Molecules, 27(3), 589. https://doi.org/10.3390/molecules27030589