Abstract
The possibility of mitigating climate change by switching to materials with low global warming potentials motivates a study of the spectroscopic and kinetic properties of a fluorinated olefin. The relative rate method was used to determine the rate constant for the reaction of heptafluorobut-1-ene (CF2=CFCF2CF2H) with chlorine atoms in air. A mercury UV lamp was used to generate atomic chlorine, which initiated chemistry monitored by FTIR spectroscopy. Ethane was used as the reference compound for kinetic studies. Oxidation of heptafluorobut-1-ene initiated by a chlorine atom creates carbonyl difluoride (CF2=O) and 2,2,3,3 tetrafluoropropanoyl fluoride (O=CFCF2CF2H) as the major products. Anharmonic frequency calculations allowing for several low-energy conformations of 1,1,2,3,3,4,4 heptafluorobut-1-ene and 2,2,3,3 tetrafluoropropanoyl fluoride, based on density functional theory, are in good accord with measurements. The global warming potentials of these two molecules were calculated from the measured IR spectra and estimated atmospheric lifetimes and found to be small, less than 1.
1. Introduction
Saturated hydrofluorocarbons (HFCs) are non-ozone depleting substitutes for chlorofluorocarbons deprecated under the 1987 Montreal Protocol on Substances that Deplete the Ozone Layer, but they exhibit high global warming potentials (GWPs) and the Kigali Amendment adopted in 2016 outlines their phase down. Unsaturated HFCs offer more reactive alternatives, whose likely short atmospheric lifetimes would imply small GWPs. Because their GWPs are smaller than those for saturated HFCs by several orders of magnitude, and especially for fully fluorinated examples, several halogenated olefins are under consideration for practical applications [1]. This has motivated recent studies by several groups [2,3]. Here, we focus on an example of a fluorinated olefin, 1,1,2,3,3,4,4-heptafluorobut-1-ene (denoted as HFB) whose terminal pi bond offers a reactive site for radical attack. New data for its infrared (IR) spectrum, its likely atmospheric degradation products and its GWP are presented. We show how computed vibrational spectra can assist IR identification of novel species. We also measure the rate constant k1 for the reaction
relative to k2 for
and use this information to help assess the atmospheric lifetime of HFB.
HFB + Cl→products
C2H6 + Cl→HCl + C2H5
2. Results
C2H6 was monitored by a band at 2868.0–2897.0 cm−1, and HFB by a band at 1767.0–1808.8 cm−1. Initial experiments with various concentrations prepared manometrically verified that the Beer–Lambert law was obeyed. We also verified that in the absence of UV light, no reaction occurred.
The IR spectrum of HFB has not been reported before, and it is shown in Figure 1. Detailed cross sections are listed in Table S1 of the Supplementary Material. Figure 1 also shows the computed IR spectrum, which is in good accord. The simulated spectrum reflects the influence of 9 conformers, which are summarized in Table 1. There is 1 unique conformation and 4 degenerate pairs. Two of the degenerate pairs dominate at room temperature, conformers A and C. The corresponding dihedral angles refer to Figure 2 and describe torsions around the two C-C bonds.
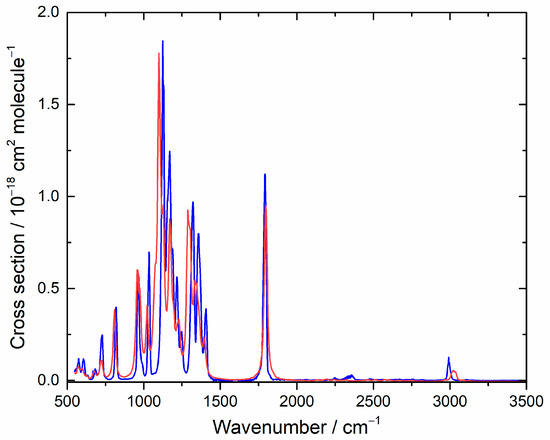
Figure 1.
Measured (blue) and computed (red) IR spectra for heptafluorobut-1-ene. In the simulation, lines were broadened with a 16 cm−1 FWHM Lorentzian function, and the cross section is in arbitrary units.

Table 1.
Properties of rotational conformers in heptafluorobut-1-ene.
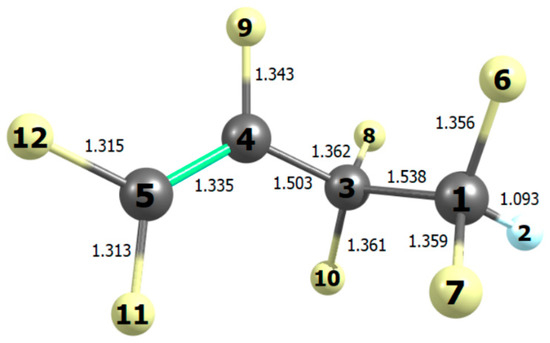
Figure 2.
Bond lengths (10−10 m) in the most stable conformation of heptafluorobut-1-ene computed with B2PLYP/N07D theory.
Four kinetic runs were performed to measure k1. Different initial concentrations were employed, with equal pressures of HFB and ethane and an excess of chlorine. The conditions are summarized in Table 2. The temperature was 296 ± 2 K and the total pressure was 1 bar, made up with Ar. Successive spectra were captured approximately 40 s apart, each one with 25 co-added scans.
Table 2.
Condition for relative rate measurements of Cl atoms with heptafluorobut-1-ene (k1) vs. C2H6 (k2).
Spectral subtraction from the initial conditions yields the ratios [HFB]0/[HFB] and [C2H6]0/[C2H6], and an example plot is shown in Figure 3. The slope of Figure 3 corresponds to the ratio k1/k2 (see Section 4.2). The intercepts of unconstrained linear fits were not significantly different from zero, so the intercepts were fixed at zero. We report 2σ statistical uncertainties in the slopes in Table 2. With k2 = (5.7 ± 0.6) × 10−11 cm3 molecule−1 s−1 [2], we estimate k1 = 2.5 × 10⁻¹¹ cm3 molecule−1 s−1. We further allow for up to 3% systematic error in the pressure measurements, and with the 7% uncertainty in k2 propose a 95% confidence interval of ±0.2 × 10⁻¹¹ cm3 molecule−1 s−1 for k1.
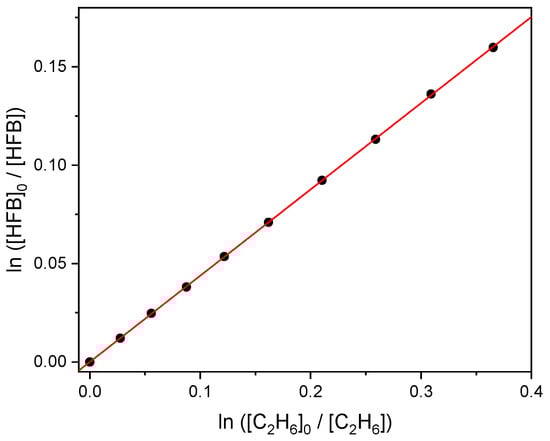
Figure 3.
Relative consumption of heptafluorobut-1-ene and ethane by atomic chlorine.
There are no prior determinations for comparison, but we note this value is similar to that for Cl + perfluorobut-1-ene. The latter compound, in which the terminal H atom of HFB is replaced by F, has a rate constant of (1.8 ± 0.4) × 10−11 cm3 molecule−1 s−1 [4]. If, instead, the C-H bond is retained and the C=C pi bond is replaced by a sigma bond, as in CF3CF2CF2CF2H (HFC-329p), then reactivity toward atomic Cl is 9 × 10⁴ times smaller than we find for HFB [5]. These comparisons suggest that the Cl chemistry of HFB starts at the pi bond.
Study of the products was carried out with two runs, where 10 back-to-back spectra with 185 co-added scans were obtained at intervals of 5 min. The initial reactant partial pressures are given in Table 3. The total pressure was made up to 1 bar with Ar.
Table 3.
Initial conditions for product studies in the Cl/heptafluorobut-1-ene/O2 system.
Figure 4 shows how during UV irradiation of these mixtures, new peaks appear. Some can be assigned to COF2, but there is a residual after accounting for COF2 and unreacted HFB.
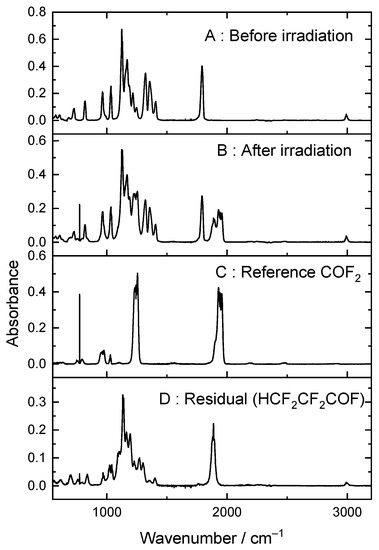
Figure 4.
(A) Heptafluorobut-1-ene/Cl2/O2/Ar mixture before irradiation and (B) after irradiation, (C) a reference spectrum of COF2, and (D) the residual after subtracting unreacted HFB and COF2, assigned to tetrafluoropropanoyl fluoride (see text).
Focusing first on COF2, an example plot of its yield compared to consumption of HFB, Figure 5, has a slope of 0.95 ± 0.01. The second determination reproduced the same value. With allowance for uncertainties in our reference spectrum for COF2, we report 0.95 ± 0.07 for the yield of COF2.
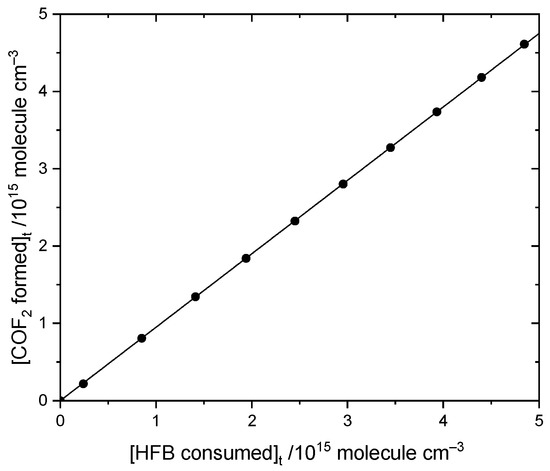
Figure 5.
Comparison of COF2 formation to heptafluorobut-1-ene loss by reaction with atomic Cl in the presence of oxygen.
This is consistent with the following mechanisms in Figure 6 and Figure 7, which both imply a 1:1 COF2:HFB ratio. They follow a standard form, where oxygen adds to the initial radical created by Cl addition to make a peroxy species. In the atmosphere, peroxy radicals are typically converted to alkoxy radicals via O-atom abstraction by NO. In our laboratory experiments, there is no NO, but Cl atoms might play a similar role. The main route to alkoxy is probably through the self-reaction of pairs of peroxy molecules, which is feasible because their concentration is much higher than in the atmosphere. In these alkoxy radicals, a C-O pi bond can be made, accompanied by breaking the weakest sigma bond to the carbon atom. If a C-Cl bond is present, the Cl atom will be eliminated; otherwise, a C-C bond will break, i.e., there is elimination of a carbonyl compound (in these schemes, the acid fluorides COF2 or CF2HCF2COF). In both schemes, the same product 2,2,3,3-tetrafluoropropanoyl fluoride (or TPF) is predicted, so the question is: can the residual spectrum be rationalized as coming from TPF?
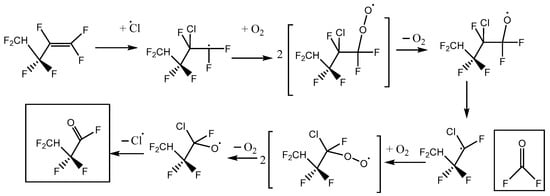
Figure 6.
Reaction scheme A for heptafluorobut-1-ene reaction with atomic Cl in the presence of oxygen, with initial Cl attack at the inner C atom of the pi-bonded pair.
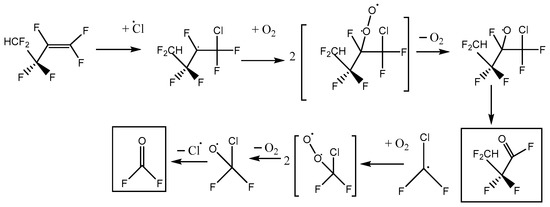
Figure 7.
Reaction scheme B for heptafluorobut-1-ene reaction with atomic Cl in the presence of oxygen, with initial Cl attack at the outer C atom of the pi-bonded pair.
To characterize the residual spectrum, we used the same procedure as described in Section 4.2, where data for various concentrations (based on an assumed unit yield) were combined at each frequency via the Beer–Lambert law to obtain the cross section. This spectrum is plotted in Figure 8, and σ values are provided in Table S2. An authentic spectrum of TPF is not available for comparison, so we apply our computational approach. Table 4 list the conformers we found and their relative Gibbs energies. As seen in Figure 8, agreement for the IR spectrum is good and consistent with TPF as the major co-product. Because typically the products of the Cl-initiated chemistry of organic compounds are similar to the products of OH-initiated processes, this product analysis gives insight into likely atmospheric degradation by OH, the dominant oxidizing agent.
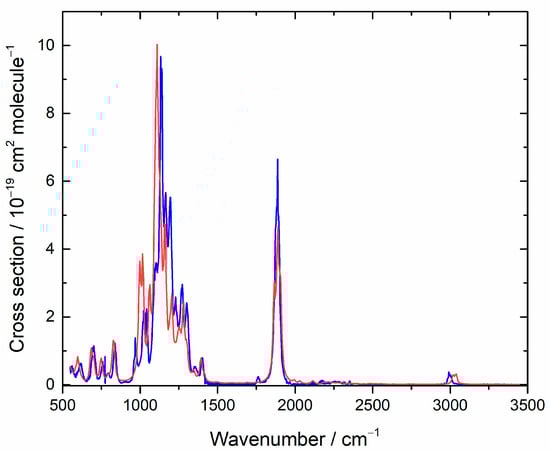
Figure 8.
Measured (blue) and computed (red) IR spectra for tetrafluoropropanoyl fluoride. In the simulation, lines were broadened with a 16 cm−1 FWHM Lorentzian function, and the cross section is in arbitrary units.
Table 4.
Computed properties of rotational conformers in tetrafluoropropanoyl fluoride.
Table 4.
Computed properties of rotational conformers in tetrafluoropropanoyl fluoride.
| Conformer | ΔG298 a/kJ mol−1 | Degeneracy | D1345 b | D2134 b | Weight |
|---|---|---|---|---|---|
| A | 0 | 2 | ±108.7 | ∓172.9 | 0.46 |
| B | 3.32 | 1 | 0 | 180.0 | 0.06 |
| C | 1.66 | 2 | ±127.3 | ±67.3 | 0.24 |
| D | 1.65 | 2 | ±24.0 | ∓57.3 | 0.24 |
a Computed Gibbs energy relative to the lowest conformer. b Dihedral angle in degrees (see Figure 9).
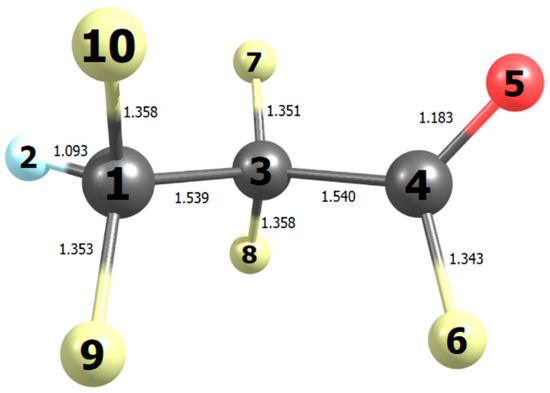
Figure 9.
Bond lengths (10−10 m) in the most stable conformation of tetrafluoropropanoyl fluoride computed with B2PLYP/N07D theory.
We note that a third reaction scheme is, in principle, possible, illustrated in Figure 10. This pathway leads to the net formation of two molecules of COF2 per molecule of HFB, plus chlorodifluoroacetyl fluoride. No C-Cl stretches were observed, and the yield of COF2~1, so Scheme C plays a minor role at best. In the alkoxy radical that appears in Schemes A and C, CF2HCF2CFO·CF2Cl, either C-C bond next to the oxygen atom can break. Density functional theory indicates that dissociation to make CF2Cl (Scheme A) is ca. 6 kJ mol−1 more favorable than making CF2HCF2 (Scheme C). This intermediate thermochemistry might drive the branching ratio toward Scheme A.
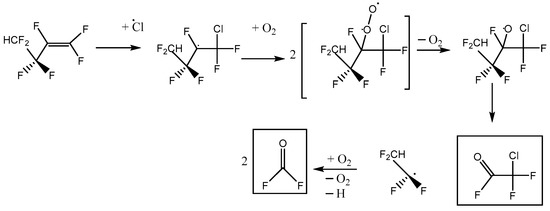
Figure 10.
Alternative reaction scheme C for heptafluorobut-1-ene reaction with atomic Cl in the presence of oxygen, with initial Cl attack at the outer C atom of the pi-bonded pair.
3. Discussion
The average tropospheric concentration of Cl atoms, ca. 3 × 10⁴ molecule cm−3 [6], leads to a 1/e lifetime τCl for destruction of HFB of 15 days. In the marine boundary layer, higher [Cl] may be expected, up to (1–3) × 105 molecule cm−3 [7,8], which implies a shorter lifetime of 1.5–4.5 days and in this specialized environment can be the fastest removal pathway. The rate constant for HFB + OH is unknown, but it is likely similar to that for OH + perfluorobut-1-ene by analogy with the Cl-atom reactivity ratio discussed above, i.e., (1.9 ± 0.3) × 10−12 cm3 molecule−1 s−1 [4]. With an average tropospheric [OH] = 1 × 10⁶ molecule cm−3 [9], the lifetime for removal by OH alone is τOH = 6.1 days. The overall tropospheric lifetime of HFB, given by 1/τ = 1/τCl + 1/τOH, is τ = 4.3 days. TPF is an acid fluoride and is therefore likely to hydrolyze rapidly in liquid water. This process has been analyzed by Kotamarthi et al. for CF3COF [10]. They considered diffusion into clouds, then absorption into water droplets, followed by aqueous hydrolysis, and obtained a lifetime of 2.6 days. By analogy, we use τ = 2.6 days for TPF. A similar argument applies to COF2, so the ultimate products of HFB oxidation are soluble fluorinated carboxylic acids, which will be rained out.
There is significant overlap between the IR absorptions of HFB and TPF and the blackbody radiation emitted from the Earth (the radiative forcing efficiency, RFE), especially in the region near 1200 cm−1 arising from C-F stretching modes, as seen in Figure 11. We use the method of Hodnebrog et al. [11] to derive the radiative efficiency (RE) and obtain RE = 0.29 and 0.18 W m−2 ppb−1 for HFB and TPF, respectively. For comparison, our RE value for HFB is similar to the value of 0.30 recommended for perfluorobut-1-ene [11]. Inclusion of the correction f(τ) for non-homogeneous vertical profiles of short-lived species [11] yields final values of RE = 0.013 and 0.0052 W m−2 ppb−1 for HFB and TPF, respectively.
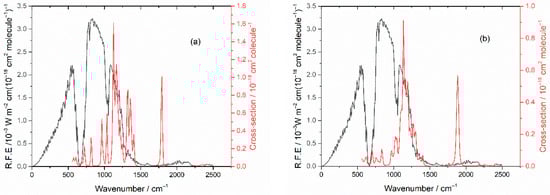
Figure 11.
Earth’s radiation (RFE) plotted in black, left-hand scale. (a) Absorption cross sections of HFB in red, right-hand scale. (b) Absorption cross sections of TPF in red, right-hand scale.
The GWP reflects the integrated IR absorbance and induced temperature change relative to CO2 on a per mass basis for a given time period. Over a 20-year time horizon, the GWP20 values for HFB and its decomposition product TPF are both small, at 0.36 and 0.07, respectively. Of course, extended horizons yield smaller values, and the GWP100, to the extent this is meaningful for short-lived species, is approximately 0.01–0.02 for both species.
4. Materials and Methods
4.1. Materials
The reagents used were HFB (Synquest, Alachua, FL, USA, 97% purity), ethane (Praxair, Danbury, CT, USA, 99.9%) and Cl2 (Aldrich, St. Louis, MO, USA, >99.5% purity), which we purified by freeze-pump-thaw cycles with liquid nitrogen. O2 and Ar (Air Liquide, Pasadena, TX, USA, >99.99% purity) were used directly from their cylinders. Carbonyl difluoride was photochemically synthesized from a mixture of 13 mbar perfluorobutadiene, 7 mbar Cl2 and 130 mbar O2, and then unreacted starting materials and side products were trapped with a pentane/liquid nitrogen slush at 143 K. The integrated absorbance of a strong band at 1968.75–1907.75 cm−1 was measured for several partial pressures of COF2, made up to 1 bar with Ar. The proportionality shown in Figure 12 confirms the applicability of the Beer–Lambert law and the slope yields an integrated band strength (base e) of (4.56 ± 0.05) × 10−17 cm molecule−1.
Figure 12.
Integrated base 10 absorbance of 1968.75–1907.75 cm−1 band of COF2 as a function of its partial pressure (1 Torr = 1.333 mbar), made up to 1 bar with Ar.
4.2. Experimental Method
We use IR spectroscopy to probe the chemistry initiated by photolytically generated chlorine atoms, evaluate reaction kinetics, identify products and quantify product yields. Our apparatus has been described in detail elsewhere [12]. In overview, mixtures of HFB and molecular chlorine diluted in a large excess of argon bath gas at 1 bar pressure and room temperature were exposed to steady UV illumination at 365 nm from a mercury lamp over time scales of 10–50 min. Experiments were carried out in a long-path multipass cell (ℓ = 240 cm) mounted inside the sample compartment of a Nicolet iS50 FT-IR spectrometer (Thermo Fisher Scientific, Madison, WI, USA). Sequential spectra were recorded at 1 cm−1 resolution with a mercury cadmium telluride detector (Thermo Fisher Scientific, Madison, WI, USA) cooled with liquid nitrogen, as a function of time while HFB was depleted by reaction 1.
For relative-rate kinetics measurements, ethane as a reference compound was added to the initial mixture, and it was also depleted with time, via reaction 2. With k1 and k2 as the bimolecular rate constants for reactions 1 and 2, integration of the ratio of the rate laws yields the standard result [13].
Because k2 is known, k1 is obtained from measurements of the concentrations of HFB and C2H6 ratioed to their initial values, as evaluated by spectral subtraction.
For product studies, no ethane reference is used, molecular oxygen is added to simulate atmospheric conditions, and product concentrations are obtained as a function of the amount of HFB consumed via the IR spectrum. When the base 10 absorbance A and concentration c are known, in terms of the Beer–Lambert law, we may write
where, with the path length ℓ in cm and c in molecule cm−3, the base e cross section σ is in cm2 molecule−1. We determine σ at every discrete frequency in the absorption spectrum from the slope of a linear plot of measured A vs. several values of c.
σ = 2.3026 A/(c ℓ)
4.3. Computational Method
Geometries and frequencies of target molecules were obtained via density functional theory with the B2-PLYP functional [14,15] combined with the N07D basis set developed by Barone and coworkers for vibrational analysis [16,17]. Calculations were made with the Gaussian16 program suite [18]. Rotation around sigma bonds leads to different local minima, which were systematically optimized. Predictions of the IR spectrum are made via second-order vibrational perturbation theory [17], which accounts for anharmonicity in the fundamental vibrational modes without empirical scale factors, and, further, incorporates contributions of overtones and combination bands. IR intensity data for each conformer were weighted by the relative abundance at T = 298 K. This was derived from the degeneracy of the given conformer energy, n, and the computed Gibbs energy, ΔGi, relative to the most stable conformer, as the ratio of ni exp(−ΔGi/RT) to the sum of all conformer terms.
5. Conclusions
For HFB, the IR absorption cross sections and reactivity toward Cl atoms have been characterized, as well as the main products in the presence of oxygen, carbonyl difluoride and TPF. Anharmonic IR spectra computed over Boltzmann distributions of conformers for HFB and TPF agree with observations and help assign TPF as a major product. The measurements yield small values for the GWP20, below 1. Because the atmospheric lifetimes are a few days, detailed evaluation is a function of local conditions, but the results suggest that emissions of HFB would have a negligible impact on climate change.
Supplementary Materials
The following supporting information can be downloaded online, Table S1: IR absorption cross sections for absorption by 1,1,2,3,3,4,4-heptafluorobut-1-ene; Table S2: IR absorption cross sections for absorption assigned to 2,2,3,3-tetrafluoropropanoyl fluoride.
Author Contributions
Conceptualization, P.M.; methodology, R.S. and P.M.; formal analysis, R.S.; investigation, R.S.; resources, P.M.; writing—original draft preparation, R.S.; writing—review and editing, P.M.; supervision, P.M.; project administration, P.M. All authors have read and agreed to the published version of the manuscript.
Funding
This research received no external funding.
Institutional Review Board Statement
Not applicable.
Informed Consent Statement
Not applicable.
Data Availability Statement
The data presented in this study are available on request from the corresponding author.
Acknowledgments
We thank George R. Rawling for assistance with some of the experiments.
Conflicts of Interest
The authors declare no conflict of interest.
Sample Availability
Not available.
References
- Wallington, T.J.; Andersen, M.P.S.; Nielsen, O.J. Atmospheric chemistry of short-chain haloolefins: Photochemical ozone creation potentials (POCPs), global warming potentials (GWPs), and ozone depletion potentials (ODPs). Chemosphere 2015, 129, 135–141. [Google Scholar] [CrossRef] [PubMed]
- Burkholder, J.B.; Sander, S.P.; Abbatt, J.; Barker, J.R.; Cappa, C.; Crounse, J.D.; Dibble, T.S.; Huie, R.E.; Kolb, C.E.; Kurylo, M.J.; et al. Chemical Kinetics and Photochemical Data for Use in Atmospheric Studies, Evaluation No. 19. Publication 19-5. NASA/JPL, Pasadena, CA, 2019. Available online: http://jpldataeval.jpl.nasa.gov (accessed on 1 December 2021).
- Andersen, M.P.S.; Sølling, T.I.; Andersen, L.L.; Volkova, A.; Hovanessian, D.; Britzman, C.; Nielsen, O.J.; Wallington, T.J. Atmospheric chemistry of (Z)-CF3CH=CHCl: Products and mechanisms of the Cl atom, OH radical and O3 reactions, and role of (E)–(Z) isomerization. Phys. Chem. Chem. Phys. 2018, 20, 27949–27958. [Google Scholar] [CrossRef] [PubMed]
- Young, C.J.; Hurley, M.D.; Wallington, T.J.; Mabury, S.A. Atmospheric chemistry of perfluorobutenes (CF3CF=CFCF3 and CF3CF2CF=CF2): Kinetics and mechanisms of reactions with OH radicals and chlorine atoms, IR spectra, global warming potentials, and oxidation to perfluorocarboxylic acids. Atmos. Environ. 2009, 43, 3717–3724. [Google Scholar] [CrossRef]
- Young, C.J.; Hurley, M.D.; Wallington, T.J.; Mabury, S.A. Atmospheric chemistry of CF3CF2H and CF3CF2CF2CF2H: Kinetics and products of gas-phase reactions with Cl atoms and OH radicals, infrared spectra, and formation of perfluorocarboxylic acids. Chem. Phys. Lett. 2009, 473, 251–256. [Google Scholar] [CrossRef]
- Wingenter, O.W.; Sive, B.C.; Blake, N.J.; Blake, D.R.; Rowland, F.S. Atomic chlorine concentrations derived from ethane and hydroxyl measurements over the equatorial pacific ocean: Implication for dimethyl sulfide and bromine monoxide. J. Geophys. Res. 2005, 110, D20308. [Google Scholar] [CrossRef]
- Chang, C.T.; Liu, T.H.; Jeng, F.T. Atmospheric concentration of the Cl atom, ClO radical, and HO radical in the coastal marine boundary layer. Environ. Res. 2004, 94, 67–74. [Google Scholar] [CrossRef] [PubMed]
- Pechtl, S.; von Glasow, R. Reactive chlorine in the marine boundary layer in the outflow of polluted continental air: A model study. Geophys. Res. Lett. 2007, 34, L11813. [Google Scholar] [CrossRef]
- Prinn, R.G.; Weiss, R.F.; Miller, B.R.; Huang, J.; Alyea, F.N.; Cunnold, D.M.; Fraser, P.J.; Hartley, D.E.; Simmonds, P.G. Atmospheric trends and lifetime of CH3CCl3 and global OH concentrations. Science 1995, 269, 187–192. [Google Scholar] [CrossRef] [PubMed]
- Kotamarthi, V.R.; Rodriguez, J.M.; Ko, M.K.W.; Tromp, T.K.; Sze, N.D.; Prather, M.J. Trifluoroacetic acid from degradation of HCFCs and HFCs: A three-dimensional modeling study. J. Geophys. Res. Atmos. 1998, 103, 5747–5758. [Google Scholar] [CrossRef] [Green Version]
- Hodnebrog, Ø.; Etminan, M.; Fuglestvedt, J.S.; Marston, G.; Myhre, G.; Nielsen, C.J.; Shine, K.P.; Wallington, T.J. Global warming potentials and radiative efficiencies of halocarbons and related compounds: A comprehensive review. Rev. Geophys. 2013, 51, 300–378. [Google Scholar] [CrossRef] [Green Version]
- Herath, T.N.; Clinch, E.C.; Orozco, I.; Raign, E.L.; Marshall, P. Relative rate and product studies of the reactions of atomic chlorine with tetrafluoroethylene, 1,2-dichloro-1,2-difluoroethylene, 1,1-dichloro-2,2-difluoroethylene, and hexafluoro- 1,3-butadiene in the presence of oxygen. J. Phys. Chem. A 2016, 120, 7311–7319. [Google Scholar] [CrossRef] [PubMed]
- Atkinson, R. Kinetics and mechanisms of the gas-phase reactions of the hydroxyl radical with organic compounds under atmospheric conditions. Chem. Rev. 1985, 85, 69–201. [Google Scholar] [CrossRef]
- Grimme, S.J. Semiempirical hybrid density functional with perturbative second-order correlation. Chem. Phys. 2002, 124, 034108. [Google Scholar] [CrossRef] [PubMed] [Green Version]
- Schwabe, T.; Grimme, S. Towards chemical accuracy for the thermodynamics of large molecules: New hybrid density functionals including non-local correlation effects. Phys. Chem. Chem. Phys. 2006, 8, 4398–4401. [Google Scholar] [CrossRef] [PubMed]
- Biczysko, M.; Panek, P.; Scalmani, G.; Bloino, J.; Barone, V. Harmonic and anharmonic vibrational frequency calculations with the double-hybrid b2plyp method: Analytic second derivatives and benchmark studies. J. Chem. Theory Comput. 2010, 6, 2115–2125. [Google Scholar] [CrossRef] [PubMed]
- Barone, V.; Biczysko, M.; Bloino, J. Fully anharmonic ir and raman spectra of medium-size molecular systems: Accuracy and interpretation. Phys. Chem. Chem. Phys. 2014, 16, 1759–1787. [Google Scholar] [CrossRef] [PubMed]
- Frisch, M.J.; Trucks, G.W.; Schlegel, H.B.; Scuseria, G.E.; Robb, M.A.; Cheeseman, J.R.; Scalmani, G.; Barone, V.; Petersson, G.A.; Nakatsuji, H.; et al. Gaussian 16; Revision A.03; Gaussian, Inc.: Wallingford, CT, USA, 2016. [Google Scholar]
Publisher’s Note: MDPI stays neutral with regard to jurisdictional claims in published maps and institutional affiliations. |
© 2022 by the authors. Licensee MDPI, Basel, Switzerland. This article is an open access article distributed under the terms and conditions of the Creative Commons Attribution (CC BY) license (https://creativecommons.org/licenses/by/4.0/).