
Investigating Chaperone like Activity of Green Silver Nanoparticles: Possible Implications in Drug Development

 , ,
, ,  , and
, and 
Abstract
:1. Introduction
2. Materials and Methods
2.1. Materials
2.1.1. Biological Synthesis of B-AgNPs by Rosa (Rose) Petals
2.1.2. Characterization of B-AgNPs
UV-Visible Spectroscopy
Transmission Electron Microscopy (TEM) and Dynamic Light Scattering (DLS)
2.1.3. Protein Sample Preparation
2.1.4. In Vitro Exploration of the Role of B-AgNPs on the Aggregation Pathway of HSA
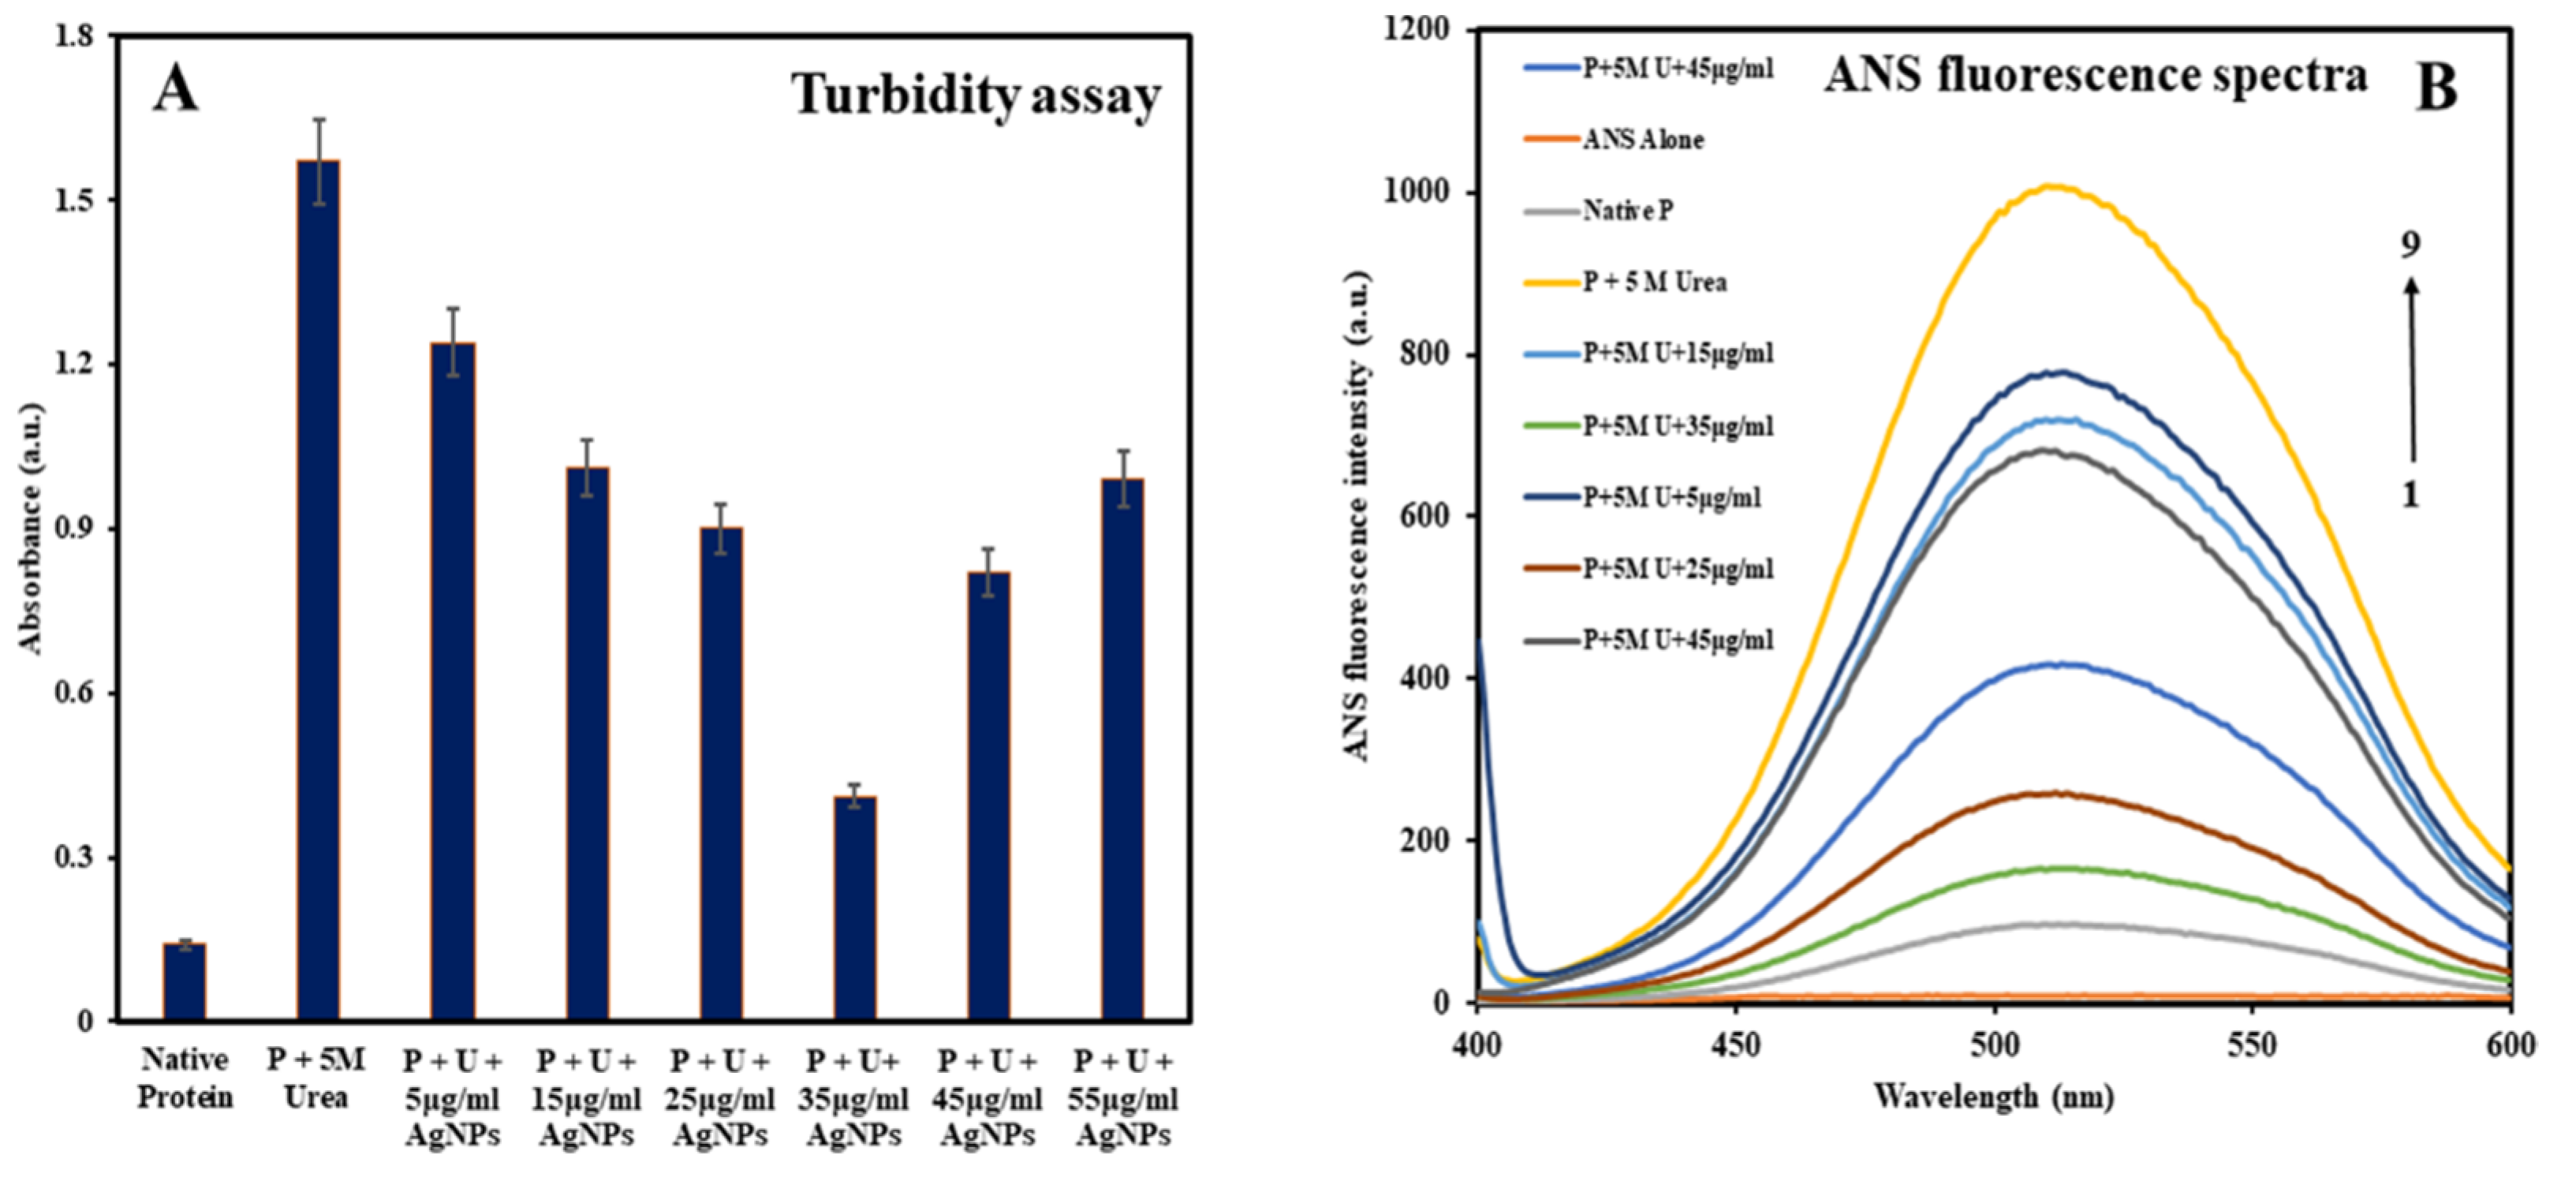
Turbidity Assay
8-Anilino-1-Naphthalene-Sulphonic Acid (ANS) Fluorescence Measurements
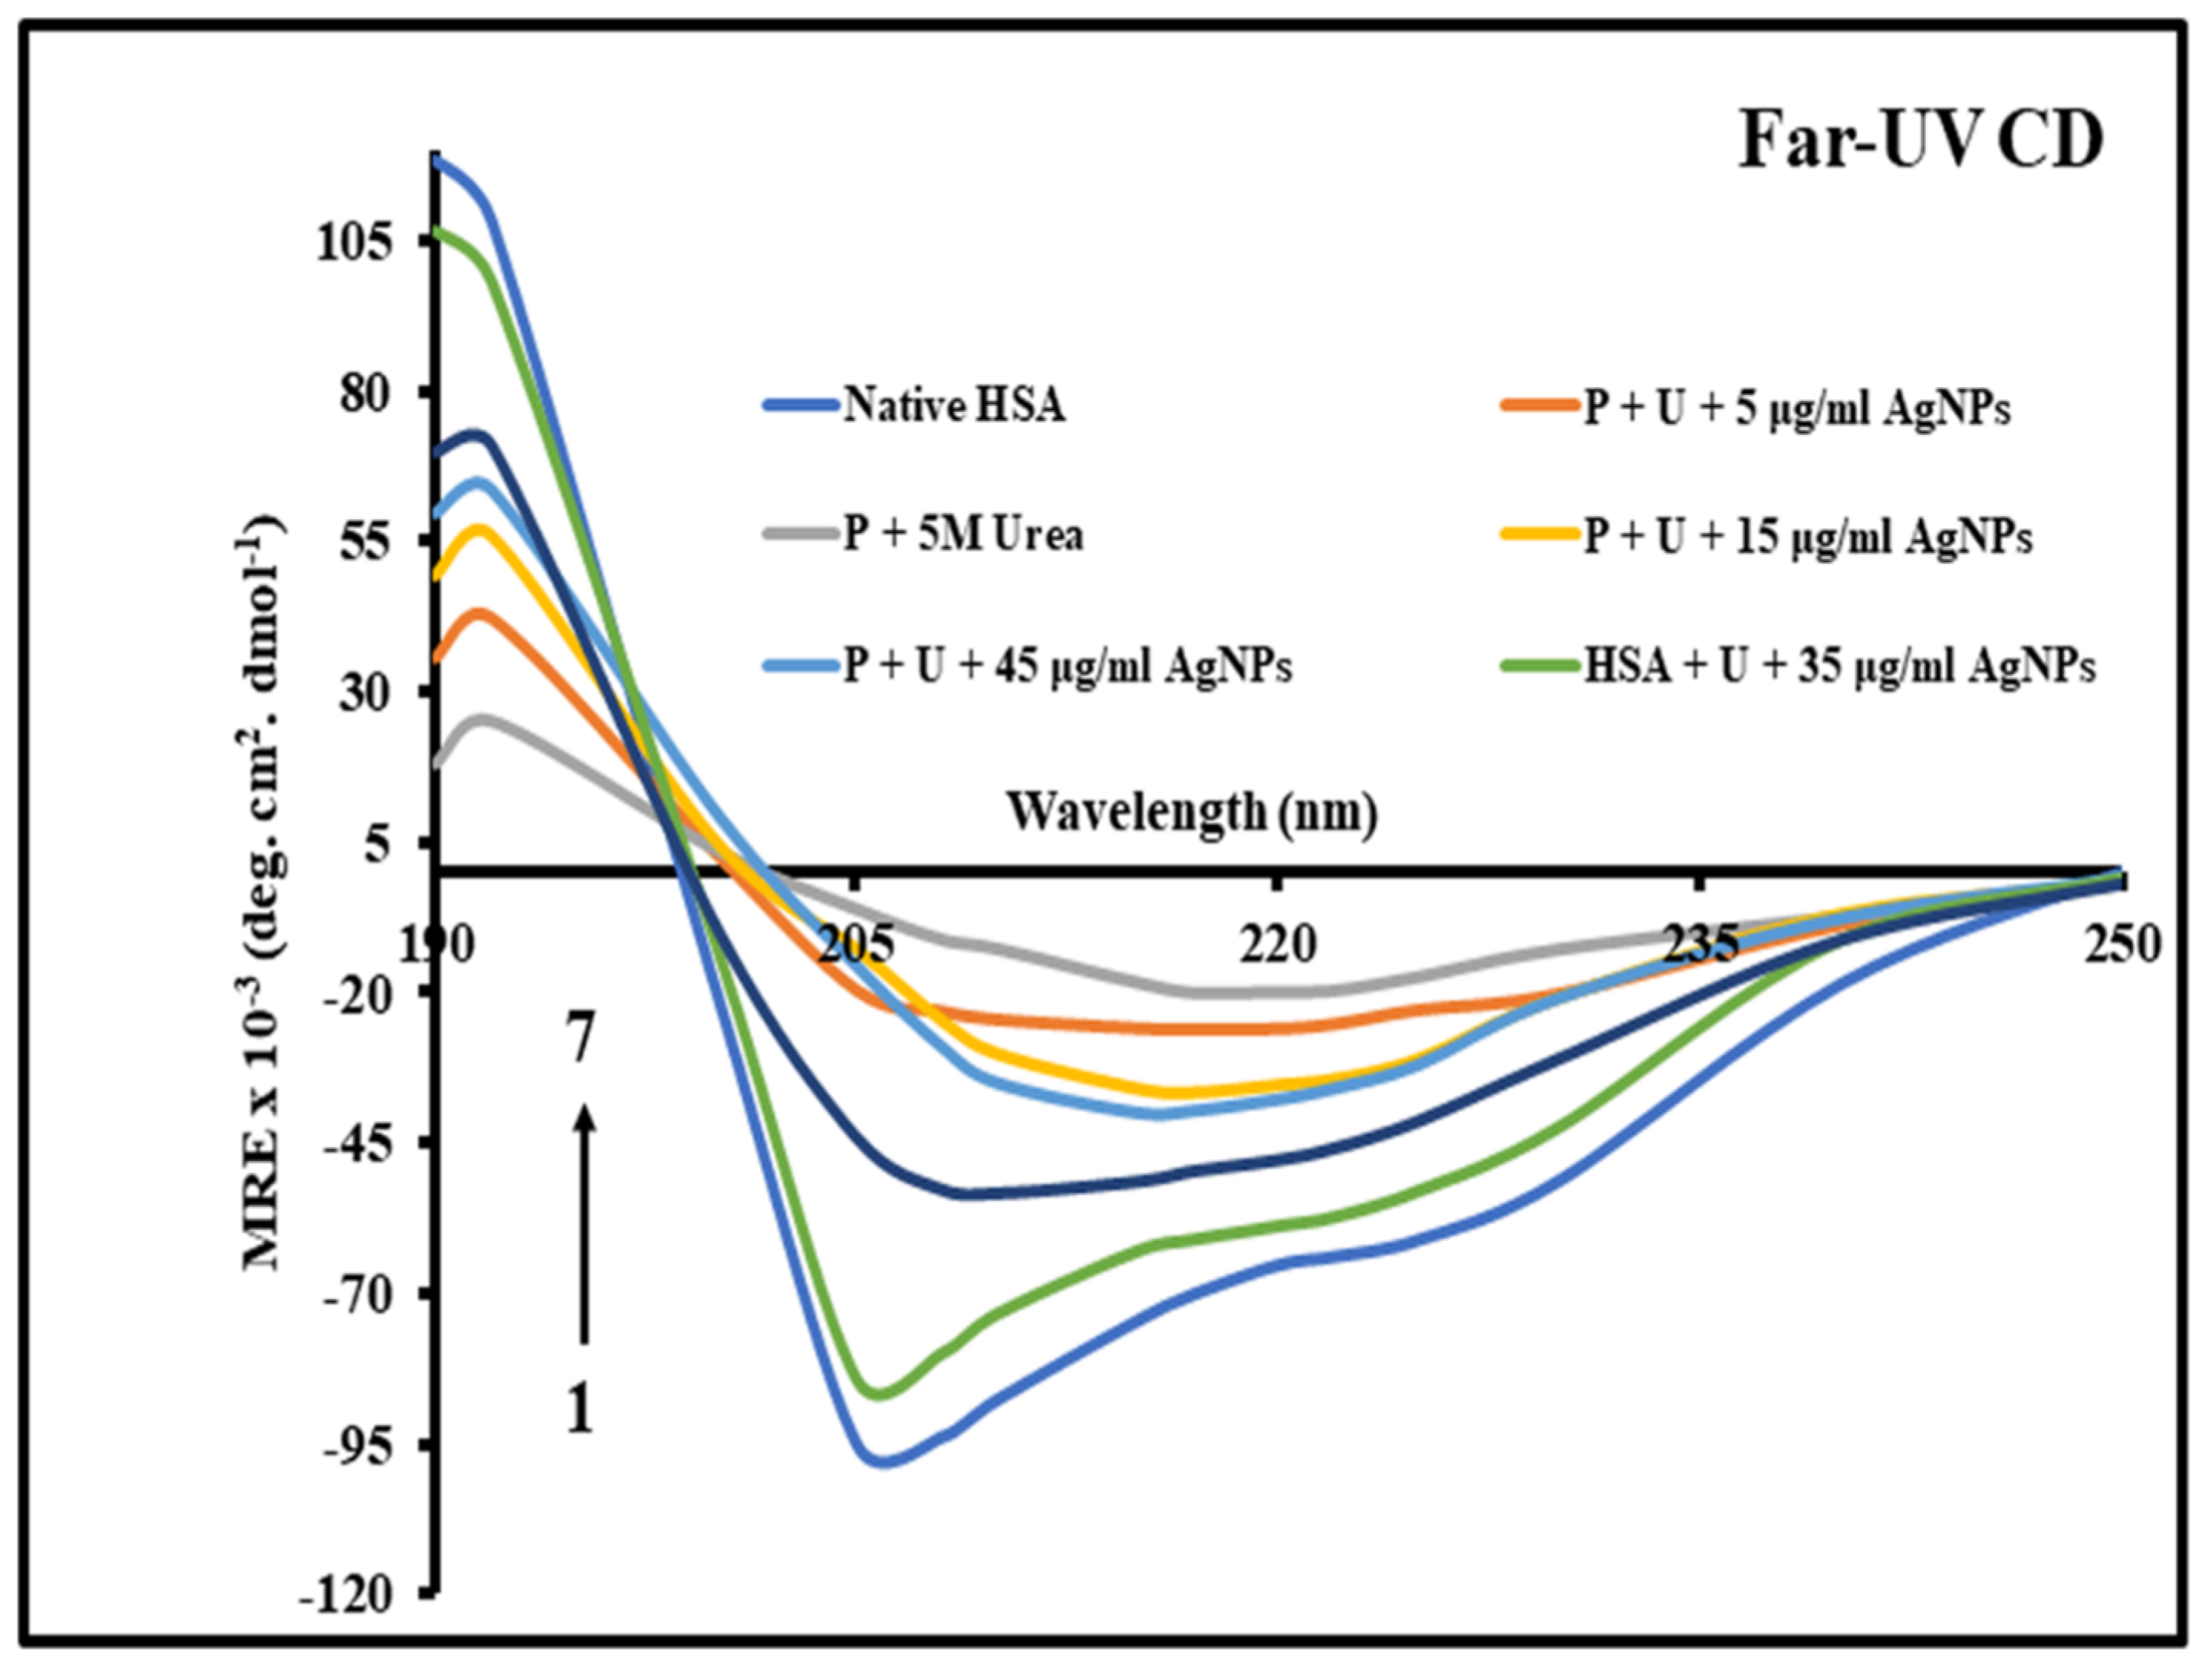
Far-UV Circular Dichroism Analysis
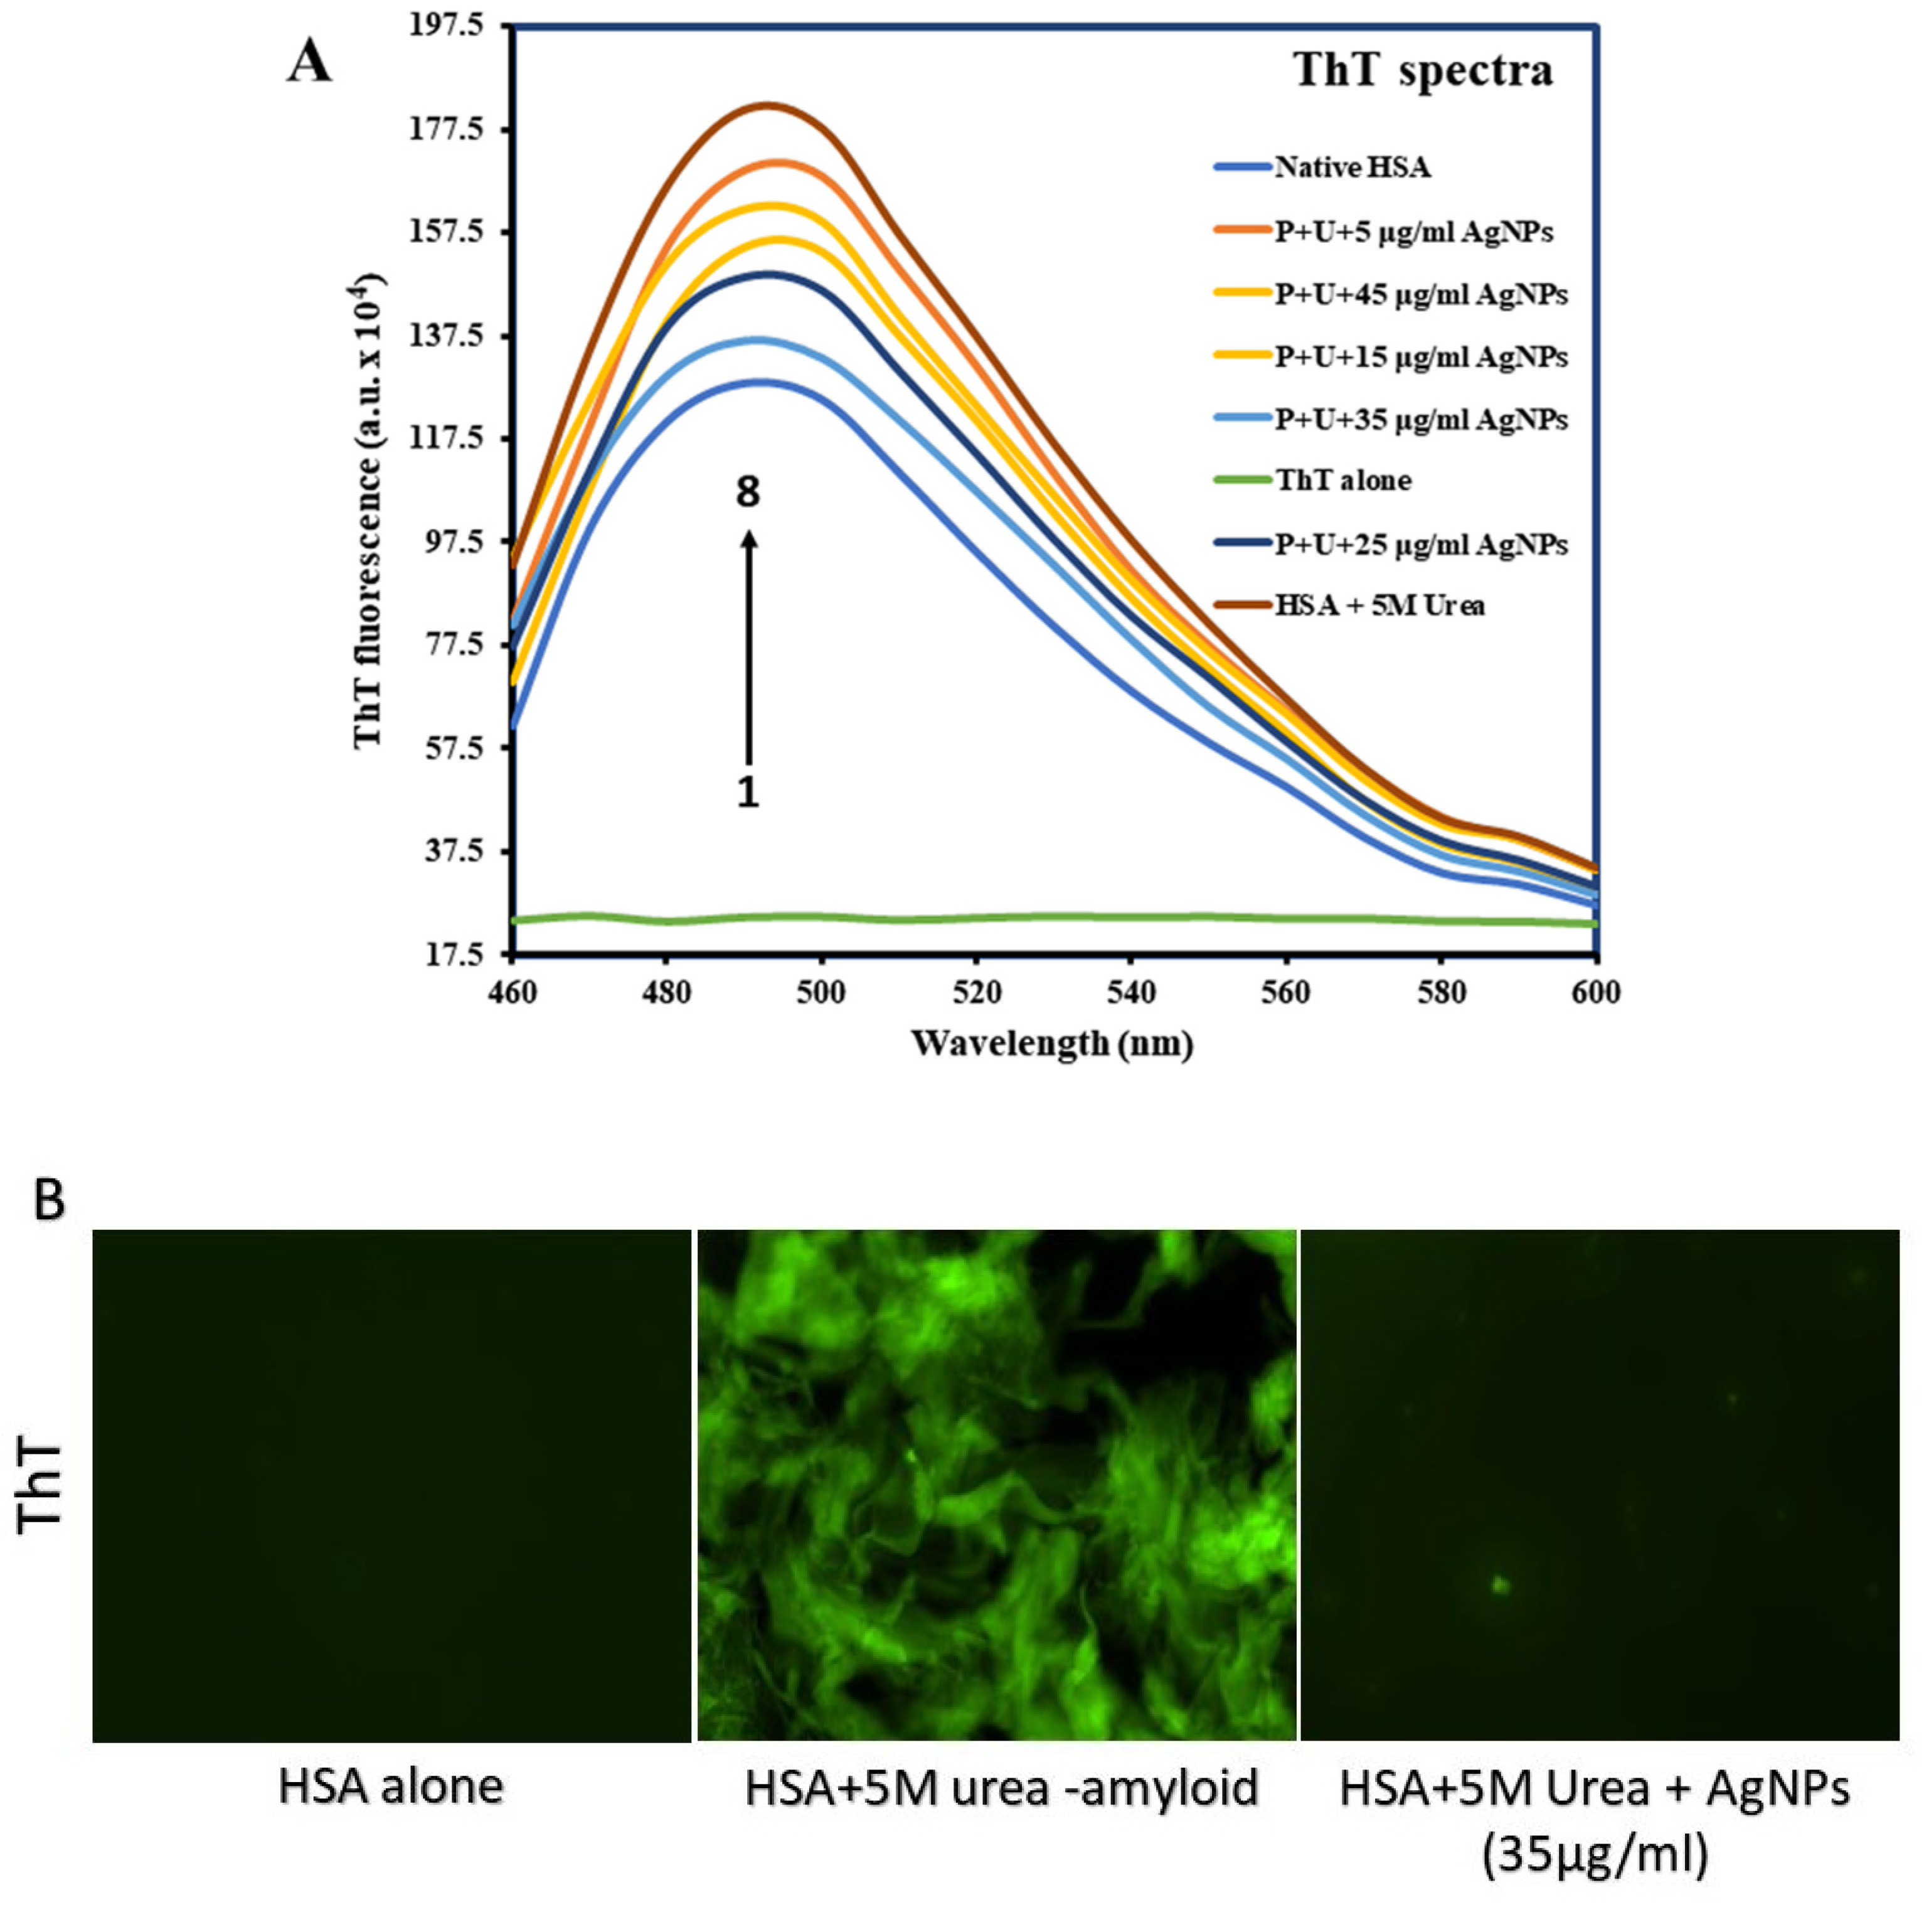
Thioflavin T Fluorescence Assay
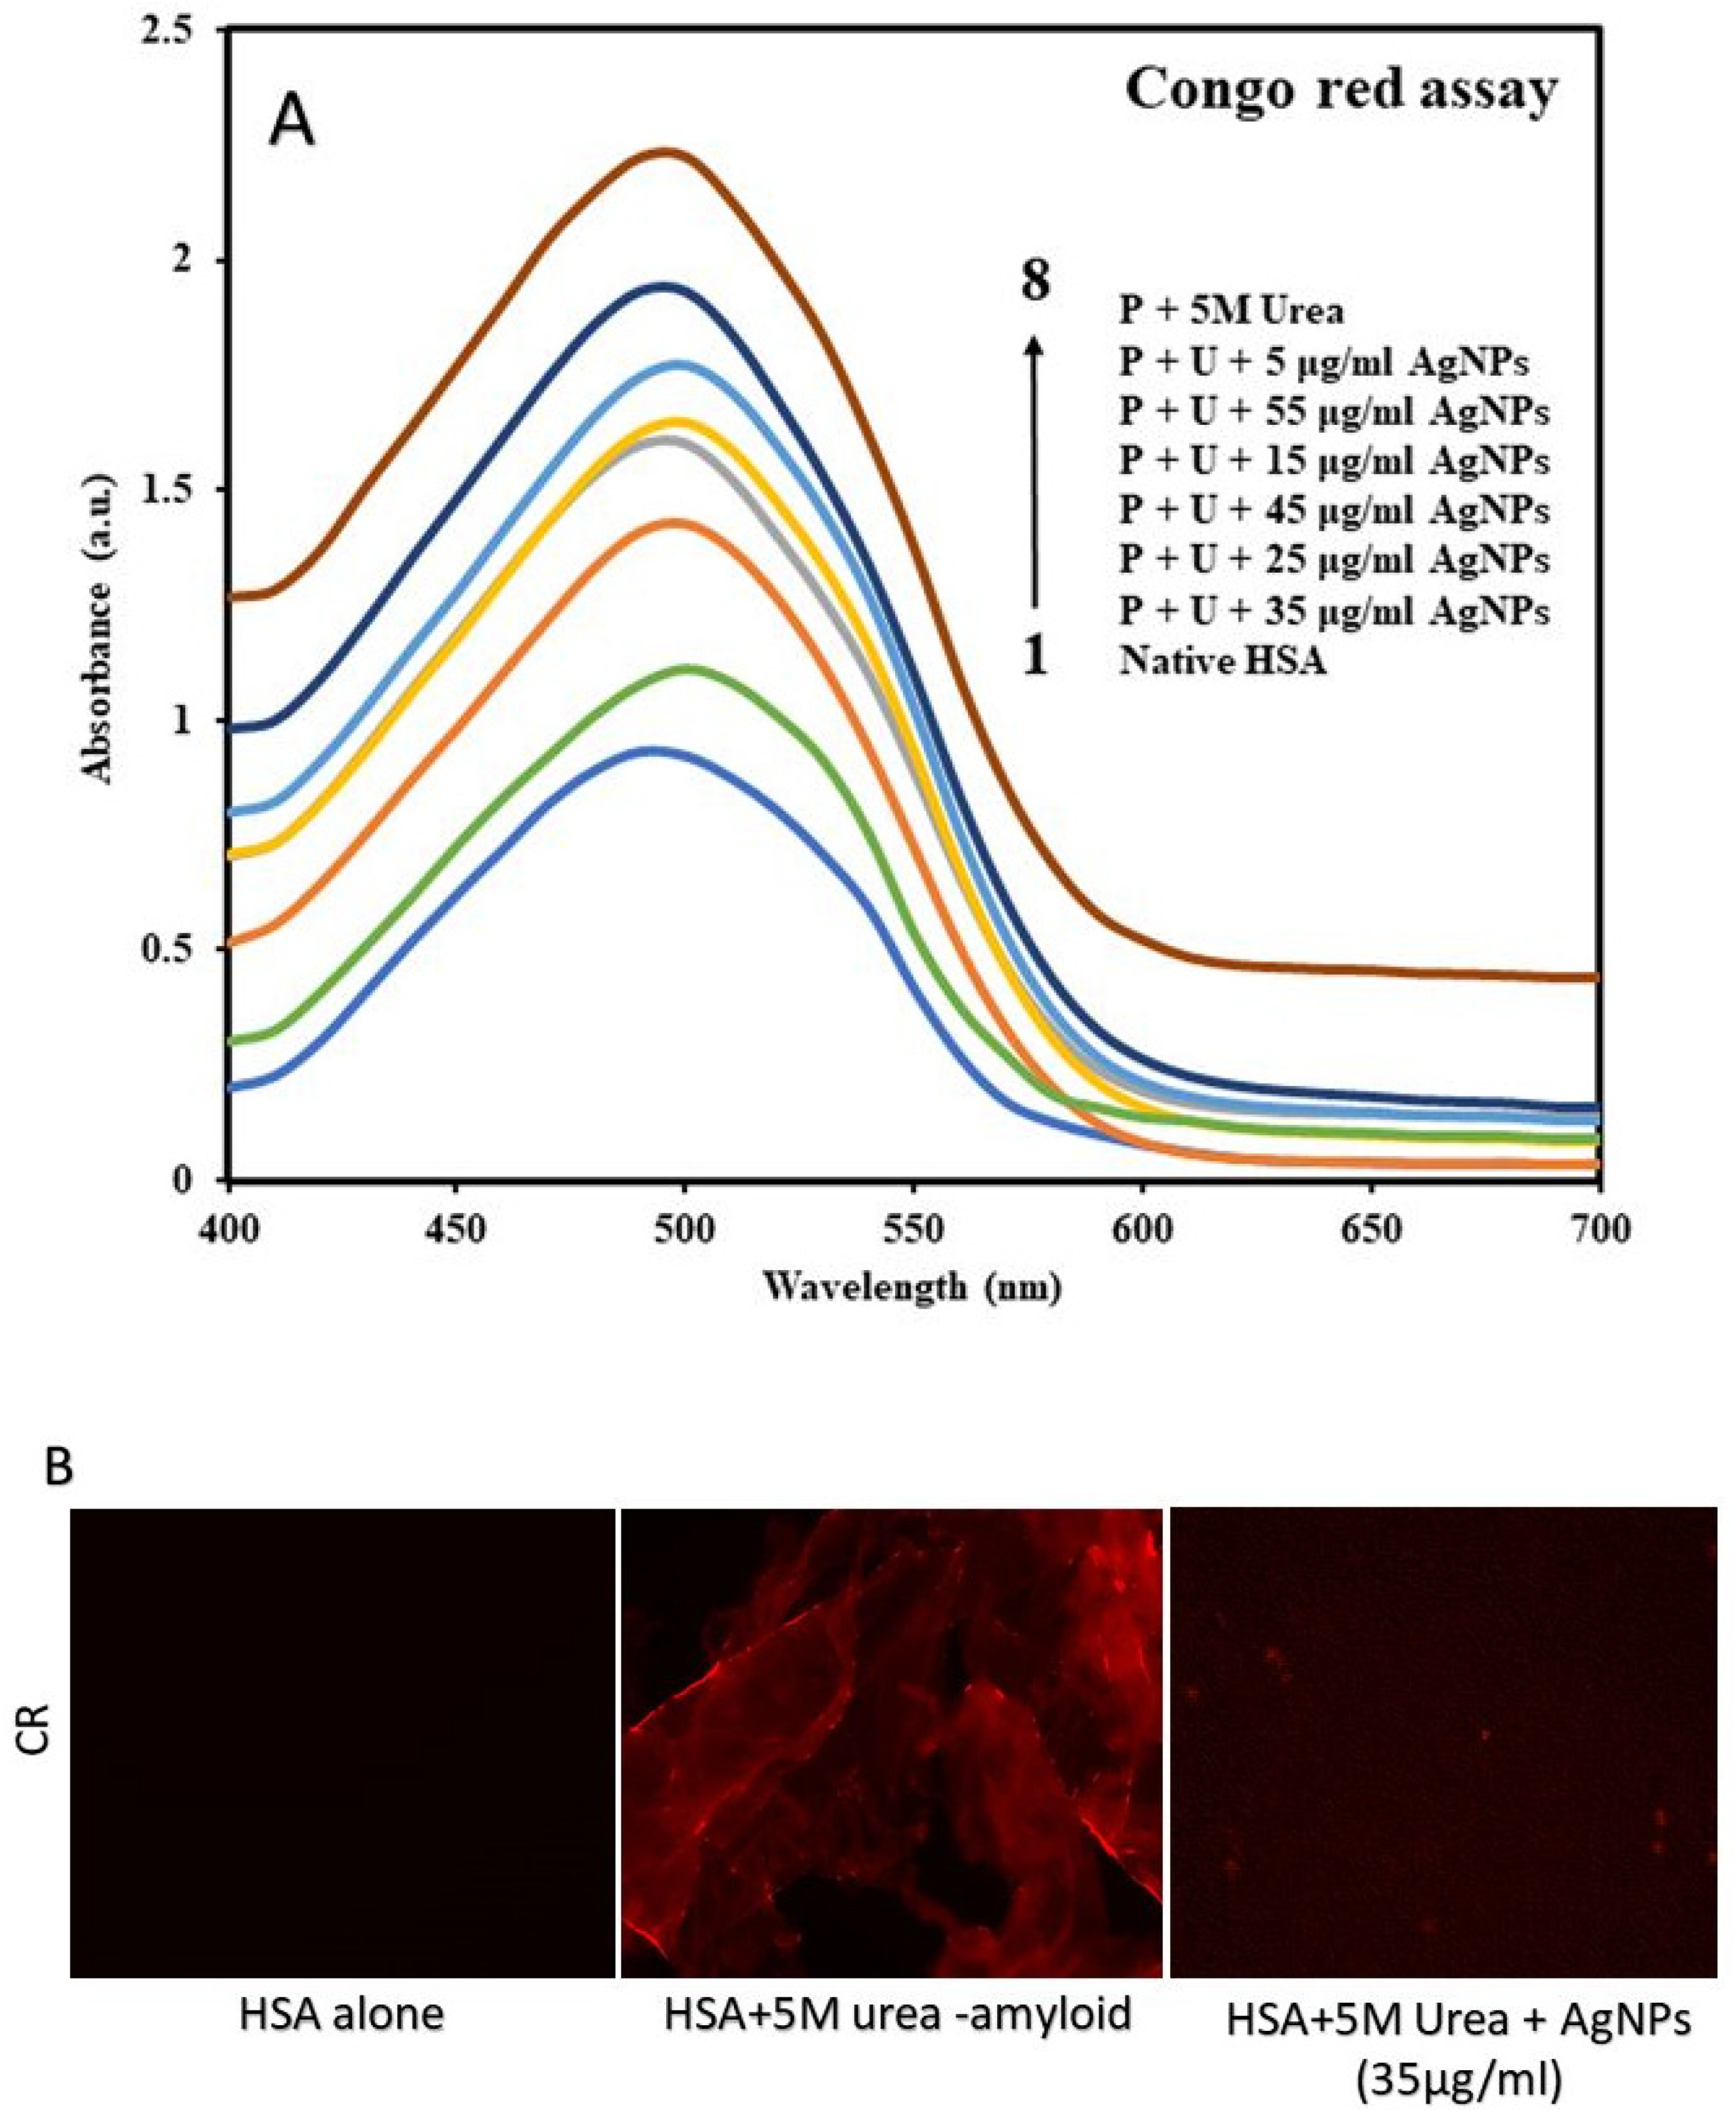
Congo Red Assay
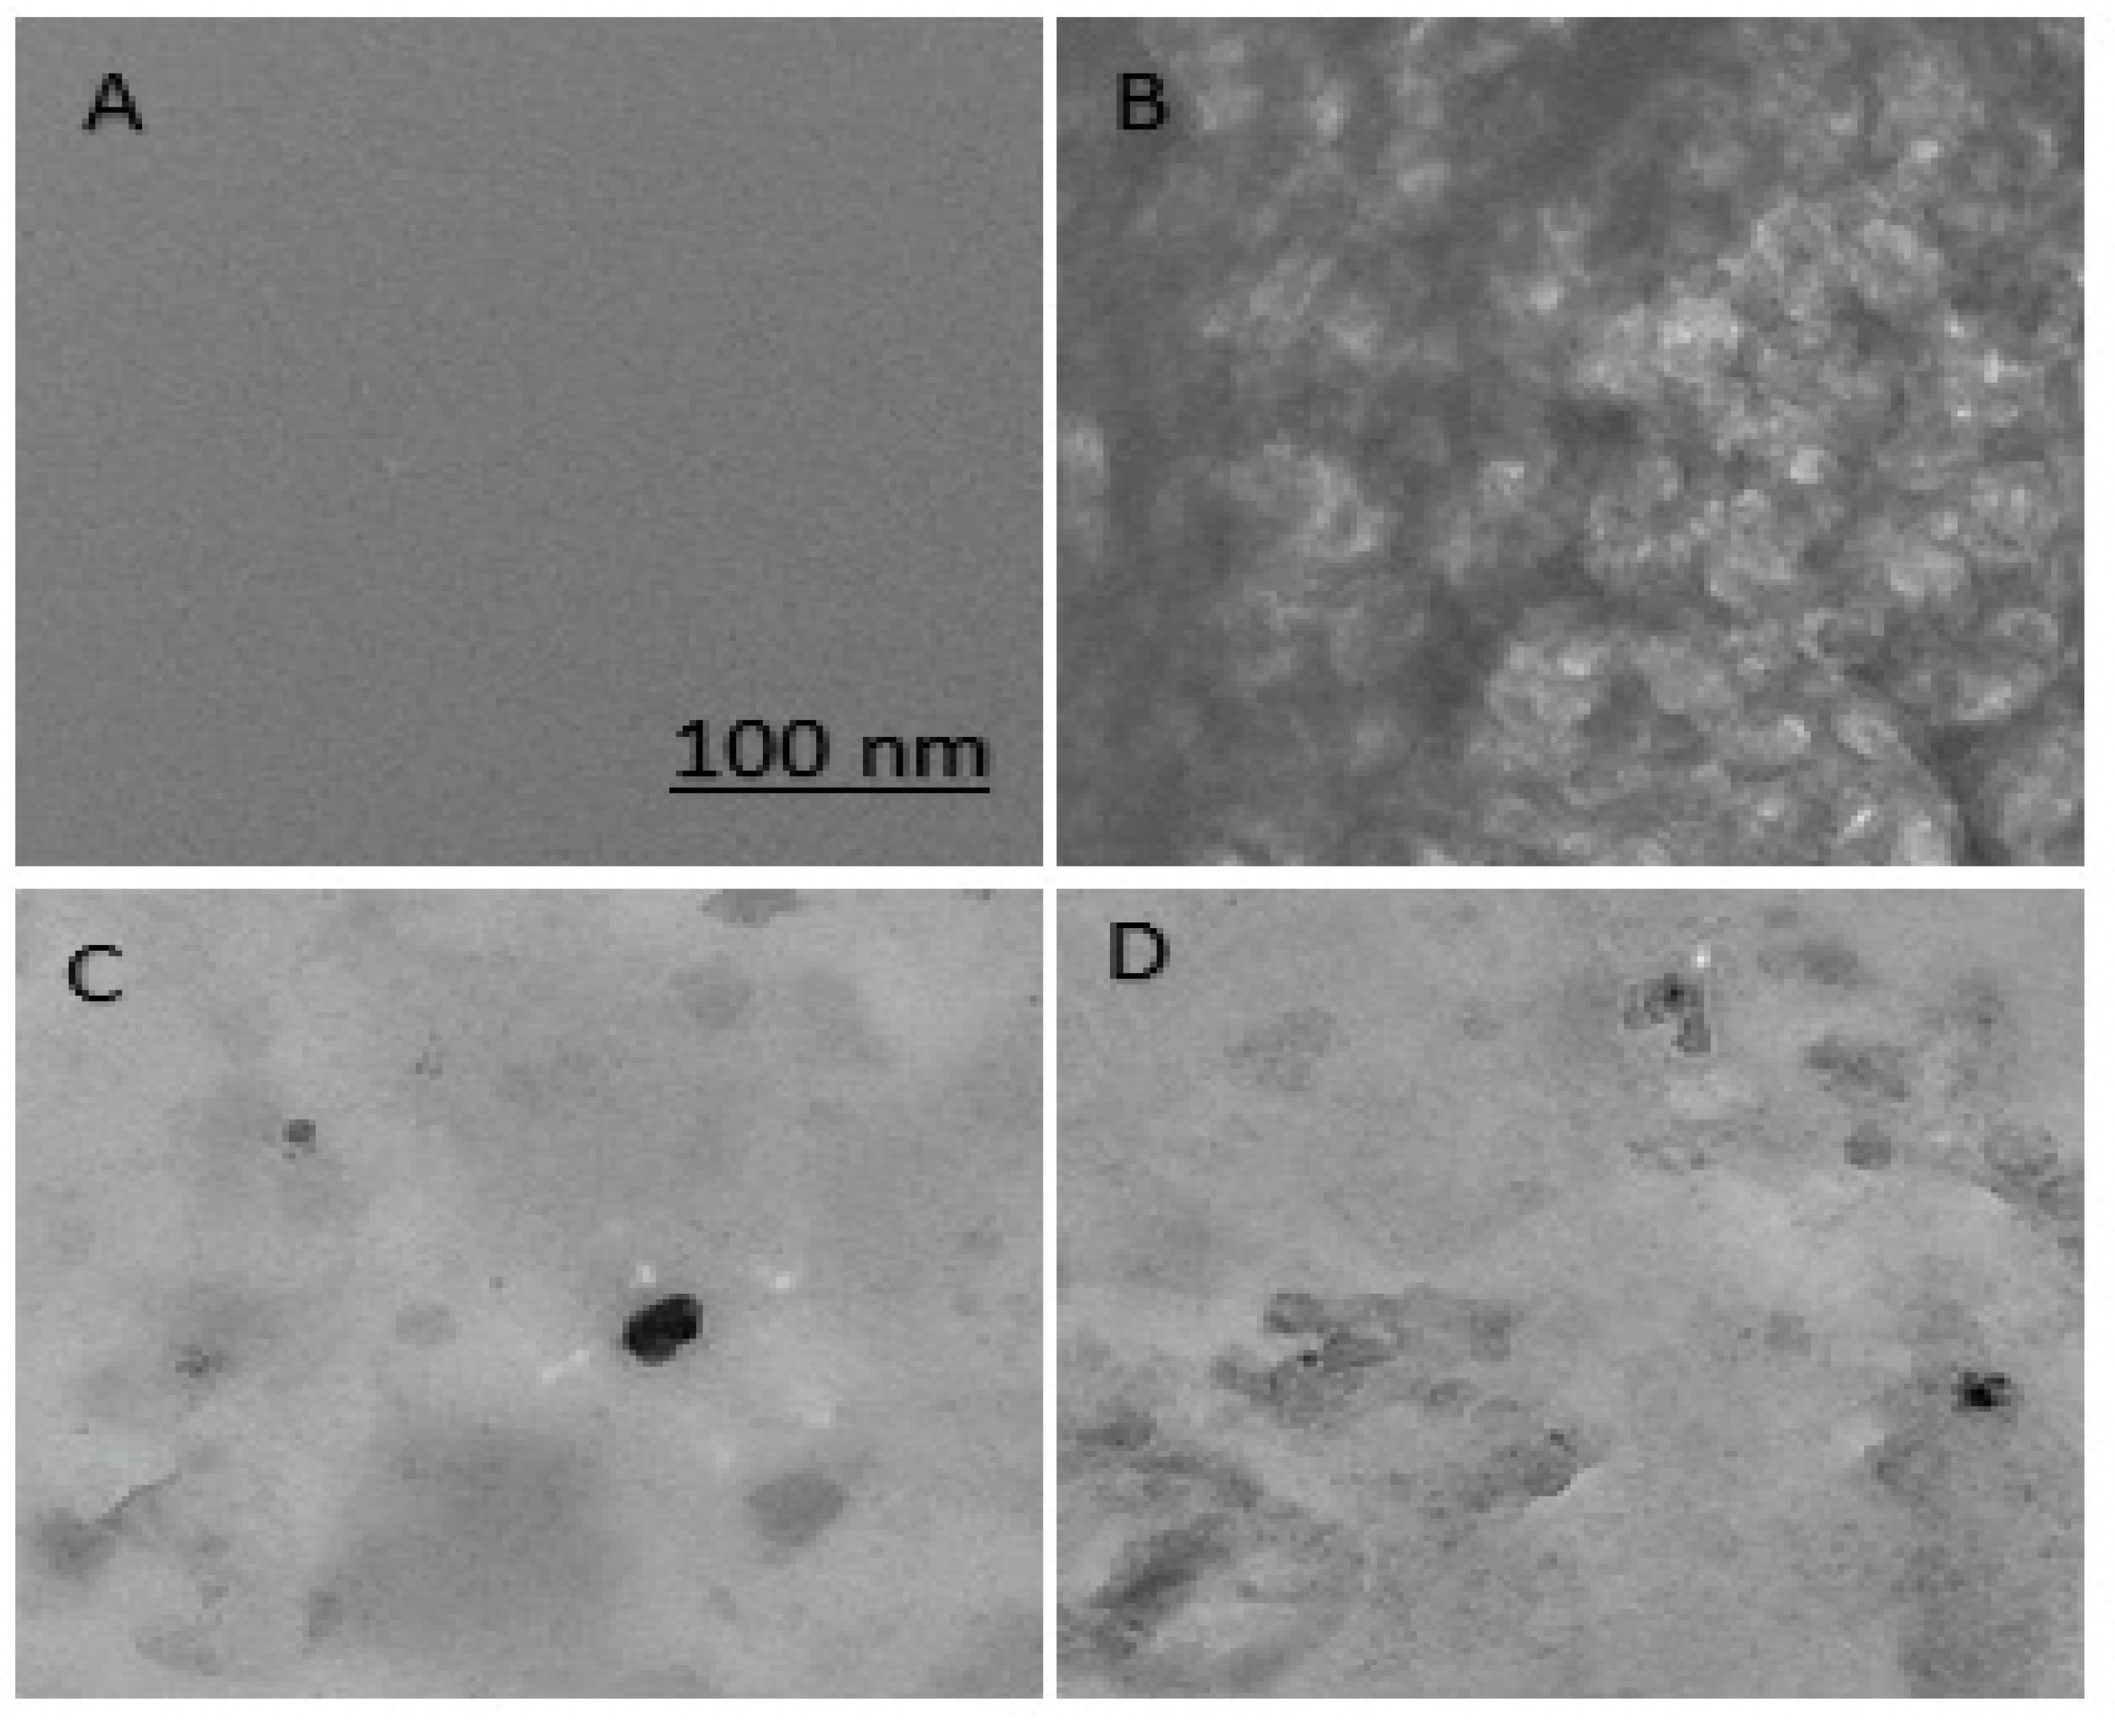
Transmission Electron Microscopy
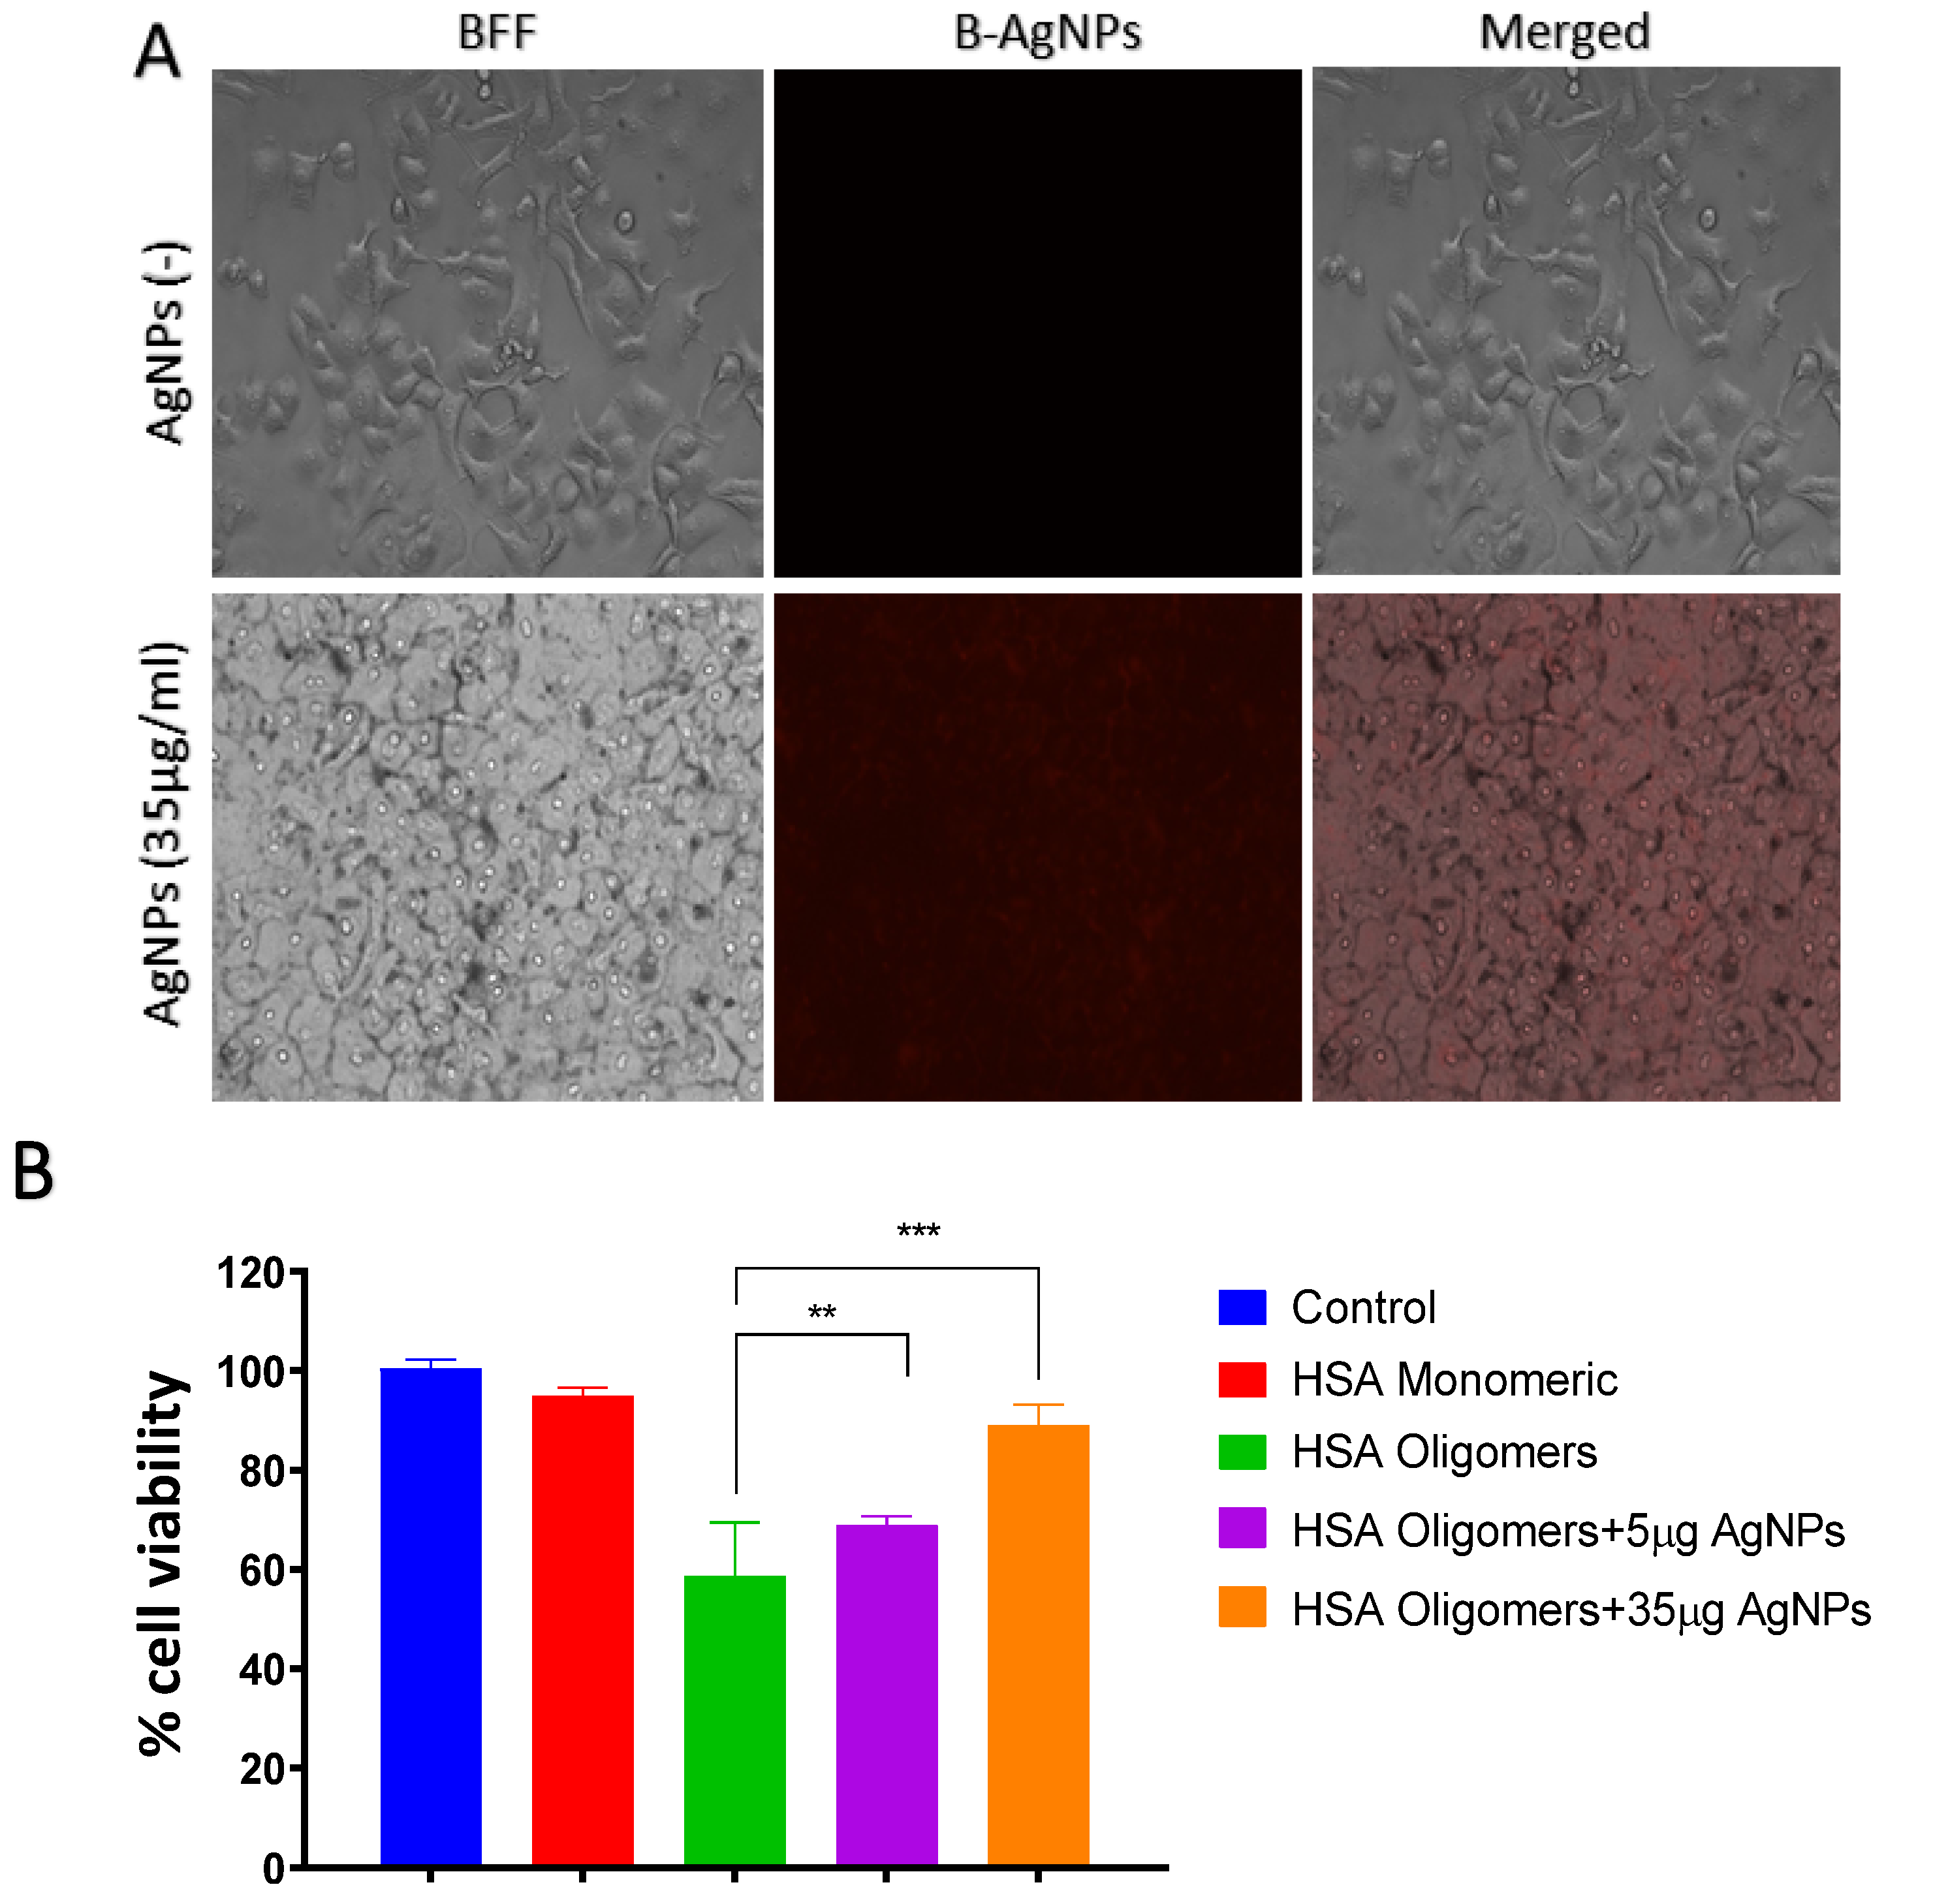
2.1.5. Uptake of B-AgNPs by Astrocyte
2.1.6. Assay for Cell Viability Using MTT Assay
2.1.7. Statistical Analysis
3. Results and Discussion
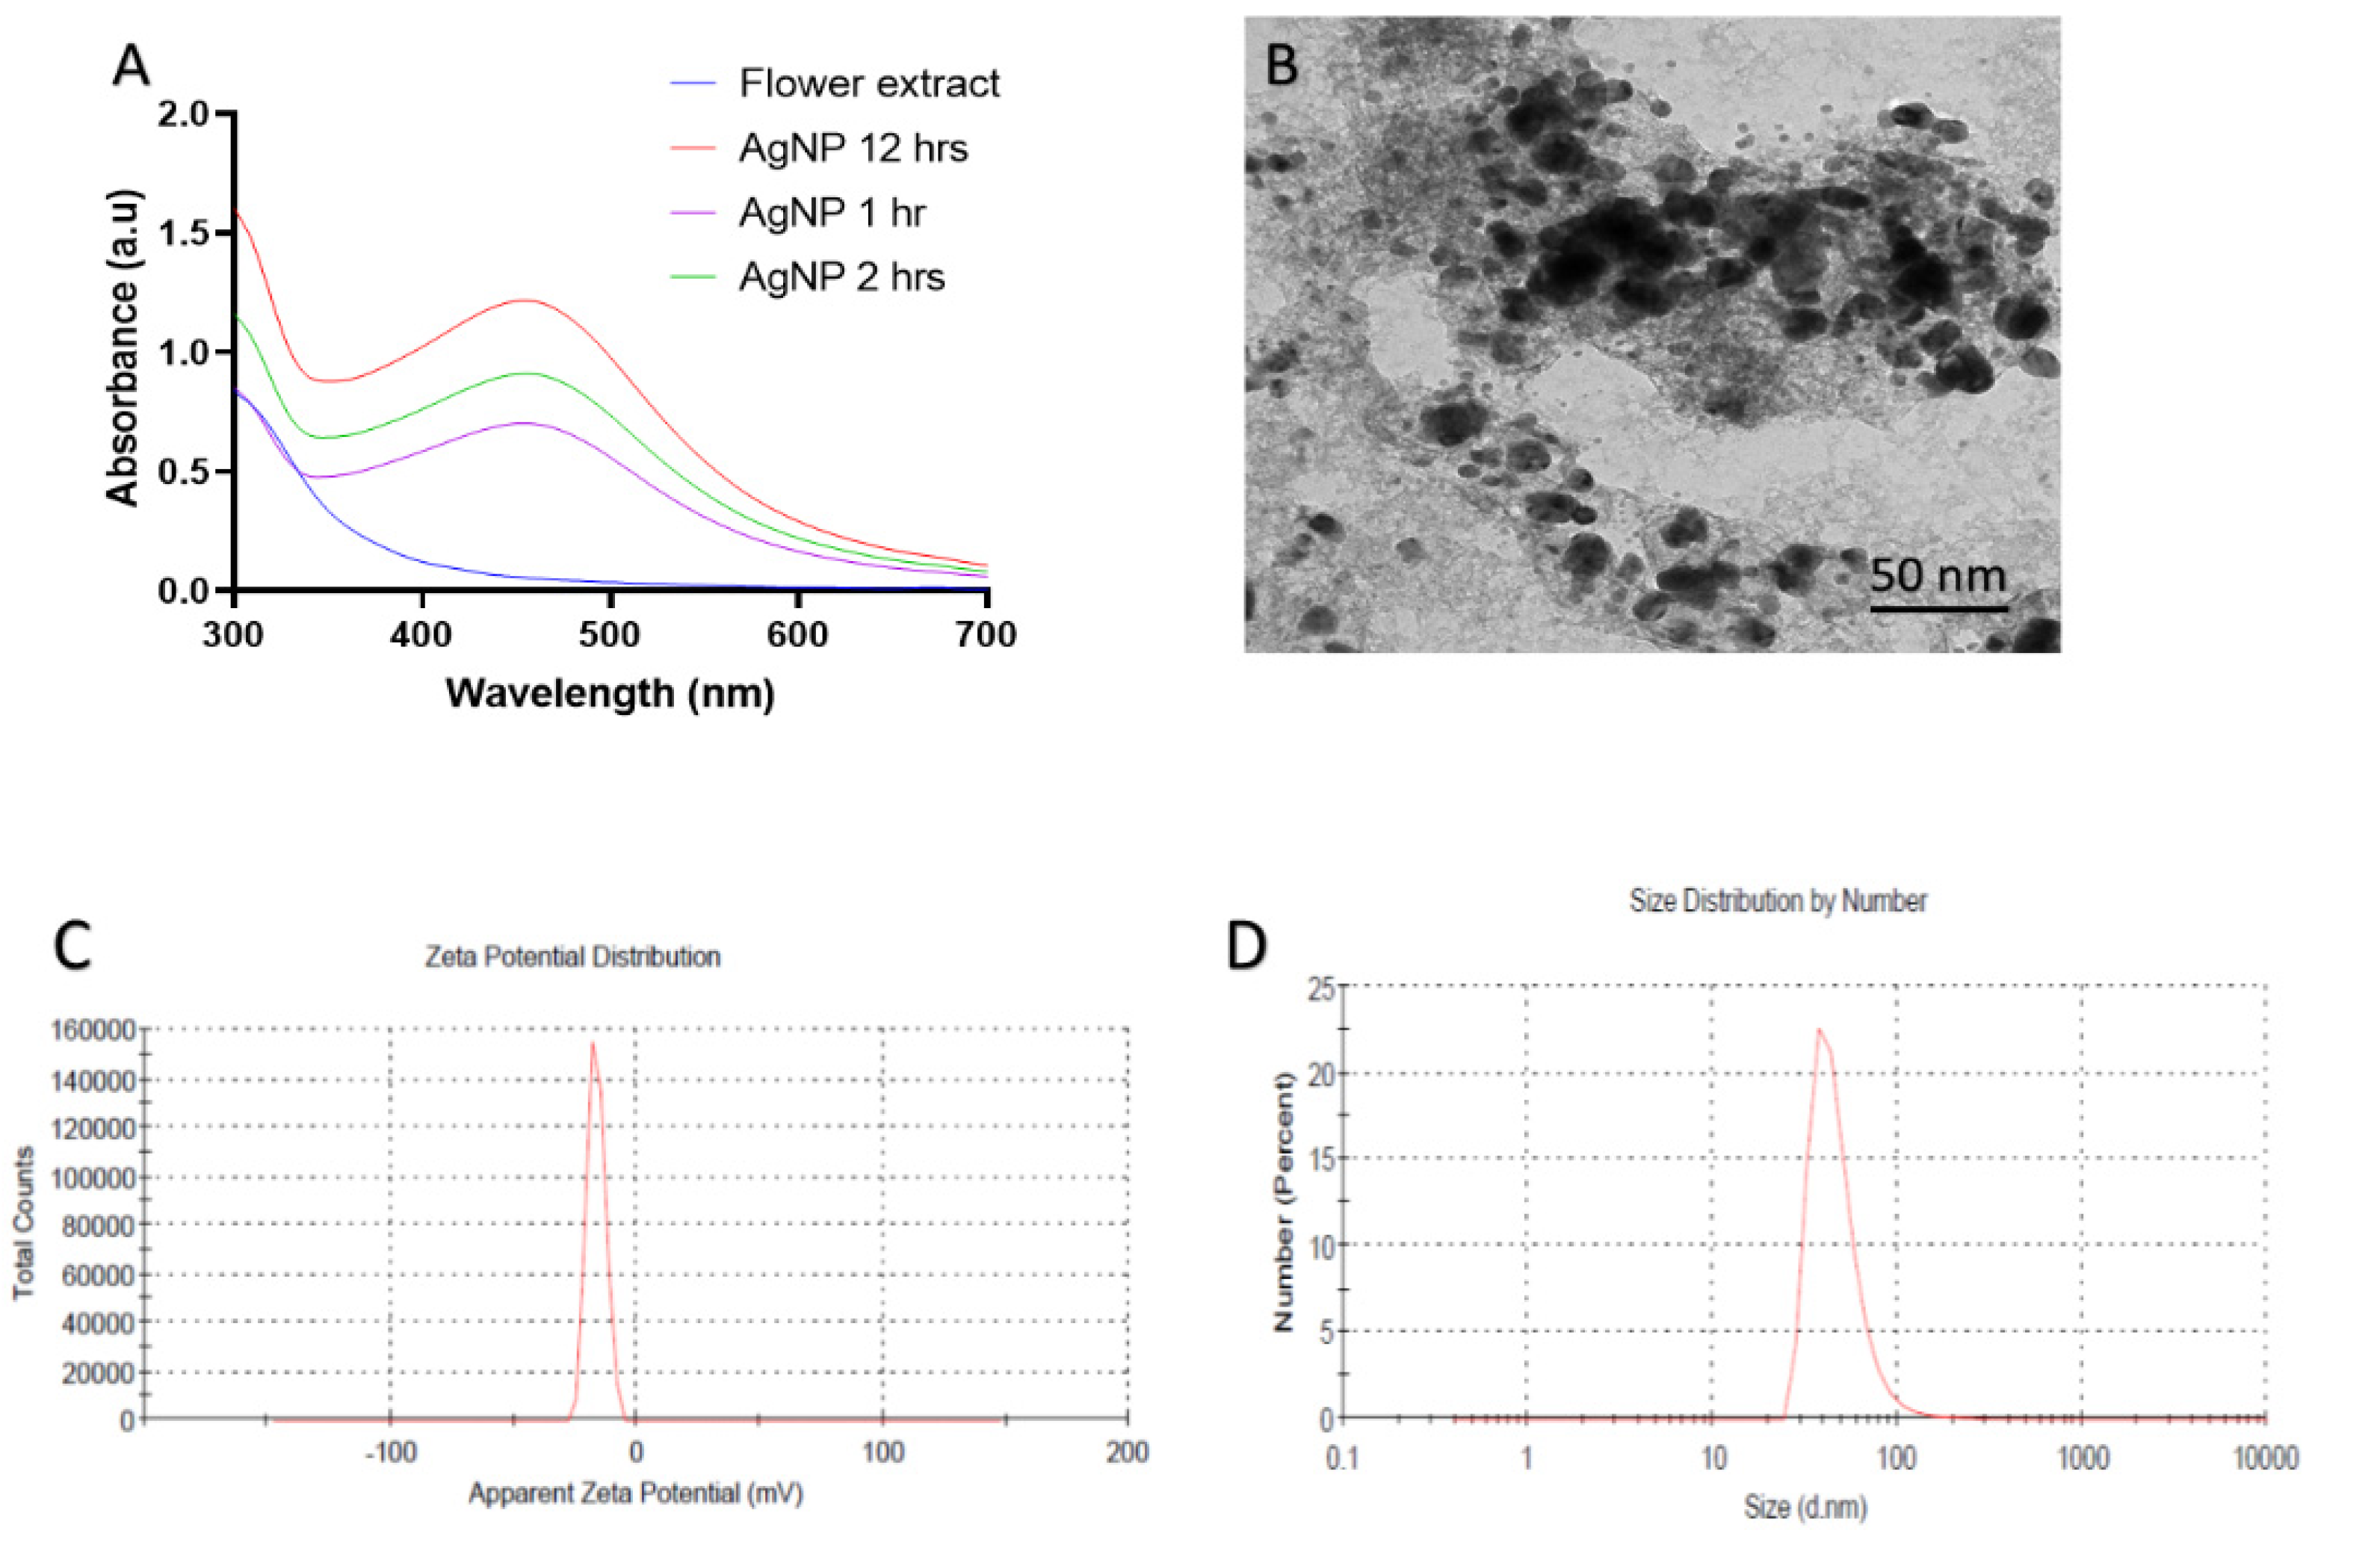
3.1. Biological Synthesis of B-AgNPs by Rosa (Rose) Petals (Characterization of B-AgNPs)
3.2. Analyzing Changes in the Native Conformation of HSA
3.3. Analyzing Changes in the Secondary Structure of HSA
3.4. Confirming Aggregate Formation and Aggregation Inhibition in HSA
3.5. Morphological Analysis of Aggregates
3.6. Uptake of B-AgNPs by Astrocytes
3.7. B-AgNPs Protects Astrocyte from HSA-Amyloidal Aggregates Mediated Cytotoxicity
4. Conclusions
Supplementary Materials
Author Contributions
Funding
Institutional Review Board Statement
Informed Consent Statement
Data Availability Statement
Acknowledgments
Conflicts of Interest
Abbreviations
| HSA | Human serum albumin |
| B-AgNPs | Biologically synthesized silver nanoparticles |
| ThT | Thioflavin T |
| CR | Congo red |
| CD | Circular dichroism |
| TEM | Transmission electron microscopy |
| FM | Fluorescence microscopy |
| MTT | (3-(4,5-dimethylthiazol-2-yl)-2,5-diphenyltetrazolium bromide) |
References
- Mukherjee, A.; Morales-Scheihing, D.; Peter, C.B.; Claudio, S. Type 2 diabetes as a protein misfolding disease. Trends Mol. Med. 2015, 21, 439–449. [Google Scholar] [CrossRef] [PubMed] [Green Version]
- Ghosh, P.; De, P. Modulation of Amyloid Protein Fibrillation by Synthetic Polymers: Recent Advances in the Context of Neurodegenerative Diseases. ACS Appl. Bio Mater. 2020, 3, 6598–6625. [Google Scholar] [CrossRef] [PubMed]
- Zhang, T.O.; Alperstein, A.M.; Zanni, M.T. Amyloid β-sheet secondary structure identified in UV-induced cataracts of porcine lenses using 2D IR spectroscopy. J. Mol. Biol. 2017, 429, 1705–1721. [Google Scholar] [CrossRef] [PubMed]
- Uversky, V.N. Dancing Protein Clouds: Intrinsically Disordered Proteins in Health and Disease, Part A; Academic Press: Cambridge, MA, USA, 2019. [Google Scholar]
- Lento, C.; Wilson, D.J. Subsecond Time-Resolved Mass Spectrometry in Dynamic Structural Biology. Chem. Rev. 2021. [Google Scholar] [CrossRef] [PubMed]
- Balchin, D.; Hayer-Hartl, M.; Hartl, F.U. In vivo aspects of protein folding and quality control. Science 2016, 353, 6294. [Google Scholar] [CrossRef] [PubMed]
- Ghosh, D.K.; Roy, A.; Ranjan, A. Disordered nanostructure in huntingtin interacting protein K acts as a stabilizing switch to prevent protein aggregation. Biochemistry 2018, 57, 2009–2023. [Google Scholar] [CrossRef]
- Tayeb-Fligelman, E.; Tabachnikov, O.; Goldshmidt-Tran, A.M.O.; Sawaya, M.R.; Coquelle, N.; Colletier, J.-P.; Landau, M. The cytotoxic Staphylococcus aureus PSMα3 reveals a cross-α amyloid-like fibril. Science 2017, 355, 831–833. [Google Scholar] [CrossRef]
- Donahue, N.D.; Acar, H.; Wilhelm, S. Concepts of nanoparticle cellular uptake, intracellular trafficking, and kinetics in nanomedicine. Adv. Drug Delivery Rev. 2019, 143, 68–96. [Google Scholar] [CrossRef]
- Wang, Y.; Cai, R.; Chen, C. The nano–bio interactions of nanomedicines: Understanding the biochemical driving forces and redox reactions. Acc. Chem. Res. 2019, 52, 1507–1518. [Google Scholar] [CrossRef]
- Naeem, A.; Alam, M.T.; Khan, T.A.; Husain, Q. A biophysical and computational study of concanavalin A immobilized zinc oxide nanoparticles. Protein Pept. Lett. 2017, 24, 1096–1104. [Google Scholar] [CrossRef]
- Sahu, D.K.; Sarkar, P.; Singha, D.; Sahu, K. Protein-activated transformation of silver nanoparticles into blue and red-emitting nanoclusters. RSC Adv. 2019, 9, 39405–39409. [Google Scholar] [CrossRef] [Green Version]
- Park, S.J. Protein–nanoparticle interaction: Corona formation and conformational changes in proteins on nanoparti-cles. Int. J. Nanomed. 2020, 15, 5783–5802. [Google Scholar] [CrossRef] [PubMed]
- Durán, N.; Silveira, C.P.; Durán, M.; Martinez, D.S.T. Silver nanoparticle protein corona and toxicity: A mini-review. J. Nanobiotechnol. 2015, 13, 1–17. [Google Scholar] [CrossRef] [PubMed] [Green Version]
- Forest, V.; Pourchez, J. Preferential binding of positive nanoparticles on cell membranes is due to electrostatic interactions: A too simplistic explanation that does not take into account the nanoparticle protein corona. Mater. Sci. Eng. 2017, 70, 889–896. [Google Scholar] [CrossRef] [Green Version]
- Feroze, N.; Arshad, B.; Younas, M.; Afridi, M.I.; Saqib, S.; Ayaz, A. Fungal mediated synthesis of silver nanoparticles and evaluation of antibacterial activity. Microsc. Res. Tech. 2020, 83, 72–80. [Google Scholar] [CrossRef]
- Alam, M.T.; Rauf, M.A.; Siddiqui, G.A.; Owais, M.; Naeem, A. Green synthesis of silver nanoparticles, its characterization, and chaperone-like activity in the aggregation inhibition of α-chymotrypsinogen A. Int. J. Biol. Macromol. 2018, 120, 2381–2389. [Google Scholar] [CrossRef]
- Korkmaz, N.; Ceylan, Y.; Hamid, A.; Karadağ, A.; Bülbül, A.S.; Aftab, M.N.; Özge, Ç.; Şen, F. Biogenic silver nanoparticles synthesized via Mimusops elengi fruit extract, a study on antibiofilm, antibacterial, and anticancer activities. J. Drug Delivery Sci. Technol. 2020, 59, 101864. [Google Scholar] [CrossRef]
- Chen, Z.Y.; Li, N.-J.; Cheng, F.-Y.; Hsueh, J.-F.; Huang, C.-C.; Lu, F.-I.; Fu, T.-F.; Yan, S.-J.; Lee, Y.-H.; Wang, Y.-J. The effect of the chorion on size-dependent acute toxicity and underlying mechanisms of amine-modified silver nanoparticles in zebrafish embryos. Int. J. Mol. Sci. 2020, 21, 2864. [Google Scholar] [CrossRef] [Green Version]
- Nath, D.; Singh, F.; Das, R. X-ray diffraction analysis by Williamson-Hall, Halder-Wagner and size-strain plot methods of CdSe nanoparticles-a comparative study. Mater. Chem. Phys. 2020, 239, 122021. [Google Scholar] [CrossRef]
- Goldring, J.P.D. Measuring protein concentration with absorbance, Lowry, Bradford coomassie blue, or the Smith bicin-choninic acid assay before electrophoresis. Electrophor. Sep. Proteins 2019, 1855, 31–39. [Google Scholar]
- Ford, M.M.; Smythers, A.L.; McConnell, E.W.; Lowery, S.C.; Kolling, D.R.J.; Hicks, L.M. Inhibition of TOR in Chlamydomonas reinhardtii leads to rapid cysteine oxidation reflecting sustained physiological changes. Cells 2019, 10, 1171. [Google Scholar] [CrossRef] [Green Version]
- Aitekenov, S.; Gaipov, A.; Bukasov, R. Detection and quantification of proteins in human urine. Talanta 2021, 223, 121718. [Google Scholar] [CrossRef] [PubMed]
- Zhang, T.-D.; Deng, X.; Wang, M.-Y.; Chen, L.-L.; Wang, X.-T.; Li, C.-Y.; Shi, W.-P.; Linet, W.-J.; Li, Q.; Pan, W.; et al. Formation of β-Lactoglobulin Self-Assemblies via Liquid–Liquid Phase Separation for Applications beyond the Biological Functions. ACS Appl. Mater. Interfaces 2021, 13, 46391–46405. [Google Scholar] [CrossRef] [PubMed]
- Alam, M.T.; Rizvi, A.; Rauf, M.A.; Owais, M.; Naeem, A. Thermal unfolding of human lysozyme induces aggregation: Recognition of the aggregates by antisera against the native protein. Int. J. Biol. Macromol. 2018, 113, 976–982. [Google Scholar] [CrossRef] [PubMed]
- Arakawa, T.; Tokunaga, M.; Kita, Y.; Niikura, T.; Baker, R.W.; Reimer, J.M.; Leschziner, A.E. Structure Analysis of Proteins and Peptides by Difference Circular Dichroism Spectroscopy. Protein J. 2021, 40, 867–875. [Google Scholar] [CrossRef]
- Almeida, Z.L.; Brito, R.M.M. Structure and aggregation mechanisms in amyloids. Molecules 2020, 25, 1195. [Google Scholar] [CrossRef] [PubMed] [Green Version]
- Balan, V.; Mihai, C.-T.; Cojocaru, F.-D.; Uritu, C.-M.; Dodi, G.; Botezat, D.; Gardikiotis, I. Vibrational spectroscopy fingerprinting in medicine: From molecular to clinical practice. Materials 2019, 12, 2884. [Google Scholar] [CrossRef] [Green Version]
- Sharma, P.K.; Wells, L.; Rizzo, G.; Elson, J.L.; Passchier, J.; Rabiner, E.A.; Gunn, R.N.; Dexter, D.T.; Pienaar, I.S. DREADD activation of pedunculopontine cholinergic neurons reverses motor deficits and restores striatal dopamine signaling in parkinsonian rats. Neurotherapeutics 2020, 17, 1120–1141. [Google Scholar] [CrossRef] [Green Version]
- Hossain, S.; Hashimoto, M.; Katakura, M.; Miwa, K.; Shimada, T.; Shido, O. Mechanism of docosahexaenoic acid-induced inhibition of in vitro Aβ1–42 fibrillation and Aβ1–42-induced toxicity in SH-S5Y5 cells. J. Neurochem. 2009, 111, 568–579. [Google Scholar] [CrossRef]
- Azzi, E.; Alberti, D.; Parisotto, S.; Oppedisano, A.; Protti, N.; Altieri, S.; Geninatti-Crich, S.; Deagostino, A. Design, synthesis and preliminary in-vitro studies of novel boronated monocarbonyl analogues of Curcumin (BMAC) for antitumor and β-amiloyd disaggregation activity. Bioorg. Chem. 2019, 93, 103324. [Google Scholar] [CrossRef]
- Rubel, M.S.; Fedotov, S.A.; Grizel, A.V.; Sopova, J.V.; Malikova, O.A.; Chernoff, Y.O.; Rubel, A.A. Functional mammalian amyloids and amyloid-like proteins. Life 2020, 10, 156. [Google Scholar] [CrossRef] [PubMed]
- Prasanna, G.; Jing, P. Polyphenol binding disassembles glycation-modified bovine serum albumin amyloid fibrils. Spectrochim. Acta Part A 2021, 246, 119001. [Google Scholar] [CrossRef] [PubMed]
- Jalilian, F.; Chahardoli, A.; Sadrjavadi, K.; Fattahi, A.; Shokoohinia, Y. Green synthesized silver na-noparticle from Allium ampeloprasum aqueous extract: Characterization, antioxidant activities, antibacterial and cytotoxicity effects. Adv. Powder Technol. 2020, 31, 1323–1332. [Google Scholar] [CrossRef]
- Zhao, L.; Chen, X.-J.; Zhu, J.; Xi, Y.-B.; Yang, X.; Hu, L.-D.; Ouyang, H.; Patel, S.H.; Jin, X.; Lin, D.; et al. Lanosterol reverses protein aggre-gation in cataracts. Nature 2015, 523, 607–611. [Google Scholar] [CrossRef] [PubMed]
- Jahan, I.; Isildak, I. Microwave-assisted green synthesis of non-cytotoxic silver nanoparticles using the aqueous extract of Rosa santana (rose) petals and their antimicrobial activity. Anal. Lett. 2019, 52, 1860–1873. [Google Scholar] [CrossRef]
- Lis, B.; Olas, B. Pro-health activity of dandelion (Taraxacum officinale L.) and its food products–history and present. J. Funct. Foods 2019, 59, 40–48. [Google Scholar] [CrossRef]
- Huang, H.; Shan, K.; Liu, J.; Tao, X.; Periyasamy, S.; Durairaj, S.; Jiang, Z.; Jacob, J.A. Synthesis, optimization and characterization of silver nanoparticles using the catkin extract of Piper longum for bac-tericidal effect against food-borne pathogens via conventional and mathematical approaches. Bioorg. Chem. 2020, 103, 104230. [Google Scholar] [CrossRef]
- Hileuskaya, K.; Ladutska, A.; Kulikouskaya, V.; Kraskouski, A.; Novik, G.; Kozerozhets, I.; Kozlovskiy, A.; Agabekov, V. ‘Green’ approach for obtaining stable pectin-capped silver nanoparticles: Physi-co-chemical characterization and antibacterial activity. Colloids Surf. A 2020, 585, 124141. [Google Scholar] [CrossRef]
- Singh, U.K.; Kumari, M.; Khan, S.H.; Bohidar, H.B.; Patel, R. Mechanism and dynamics of long-term stability of cytochrome c conferred by long-chain imidazolium ionic liquids at low concentration. ACS Sustainable Chem. Eng. 2018, 6, 803–815. [Google Scholar] [CrossRef]
- Drew, E.D.; Janes, R.W. PDBMD2CD: Providing predicted protein circular dichroism spectra from multiple molecular dynamics-generated protein structures. Nucleic Acids Res. 2020, 48, W17–W24. [Google Scholar] [CrossRef]
- Rogers, D.M.; Jasim, S.B.; Dyer, N.T.; Auvray, F.; Réfrégiers, M.; Hirst, J.D. Electronic circular dichroism spectroscopy of proteins. Chem 2019, 5, 2751–2774. [Google Scholar] [CrossRef]
- Zheng, W.; Jia, L.; Huang, F. Vacuum-ultraviolet photon detections. Iscience 2020, 23, 101145. [Google Scholar] [CrossRef] [PubMed]
- Zhang, H.; Deng, H.; Wang, Y. Comprehensive investigations about the binding interaction of acesulfame with human serum albumin. Spectrochim. Acta Part A 2020, 237, 118410. [Google Scholar] [CrossRef] [PubMed]
- Vazquez, M.G.Q.; Condado, D.M.; Hernandez, B.G.; Gonzalez-Horta, A. Avenanthramide-C prevents amyloid formation of bovine serum albumin. Biophys. Chem. 2020, 263, 106391. [Google Scholar] [CrossRef]
- Zhang, W.; Song, S.; Wang, H.; Wang, Q.; Li, D.; Zheng, S.; Xu, Z.; Zhang, H.; Wang, J.; Sun, J. In vivo irreversible albumin-binding near-infrared dye conjugate as a naked-eye and fluorescence dual-mode imaging agent for lymph node tumor metastasis diagnosis. Biomaterials 2019, 217, 119279. [Google Scholar] [CrossRef] [PubMed]
- Kumar, M.; Hong, Y.; Thorn, D.C.; Ecroyd, H.; Carver, J.A. Monitoring early-stage protein aggre-gation by an aggregation-induced emission fluorogen. Anal. Chem. 2017, 89, 9322–9329. [Google Scholar] [CrossRef] [PubMed] [Green Version]
- Manca, M.; Kraus, A. Defining the protein seeds of neurodegeneration using real-time quaking-induced con-version assays. Biomolecules 2020, 10, 1233. [Google Scholar] [CrossRef]
- Tefera, T.W.; Steyn, F.J.; Ngo, S.T.; Borges, K. CNS glucose metabolism in Amyotrophic Lateral Sclerosis: A therapeutic target? Cell Biosci. 2021, 11, 1–17. [Google Scholar] [CrossRef] [PubMed]
- Ban, D.K.; Paul, S. Functionalized gold and silver nanoparticles modulate amyloid fibrillation, defibrillation and cytotoxicity of lysozyme via altering protein surface character. Appl. Surf. Sci. 2019, 473, 373–385. [Google Scholar]
- Novitskaya, V.; Bocharova, O.V.; Bronstein, I.; Baskakov, I.V. Amyloid fibrils of mammalian prion protein are highly toxic to cultured cells and primary neurons. J. Biol. Chem. 2006, 281, 13828–13836. [Google Scholar] [CrossRef] [Green Version]
Publisher’s Note: MDPI stays neutral with regard to jurisdictional claims in published maps and institutional affiliations. |
© 2022 by the authors. Licensee MDPI, Basel, Switzerland. This article is an open access article distributed under the terms and conditions of the Creative Commons Attribution (CC BY) license (https://creativecommons.org/licenses/by/4.0/).
Share and Cite
Rauf, M.A.; Alam, M.T.; Ishtikhar, M.; Ali, N.; Alghamdi, A.; AlAsmari, A.F. Investigating Chaperone like Activity of Green Silver Nanoparticles: Possible Implications in Drug Development. Molecules 2022, 27, 944. https://doi.org/10.3390/molecules27030944
Rauf MA, Alam MT, Ishtikhar M, Ali N, Alghamdi A, AlAsmari AF. Investigating Chaperone like Activity of Green Silver Nanoparticles: Possible Implications in Drug Development. Molecules. 2022; 27(3):944. https://doi.org/10.3390/molecules27030944
Chicago/Turabian StyleRauf, Mohd Ahmar, Md Tauqir Alam, Mohd Ishtikhar, Nemat Ali, Adel Alghamdi, and Abdullah F. AlAsmari. 2022. "Investigating Chaperone like Activity of Green Silver Nanoparticles: Possible Implications in Drug Development" Molecules 27, no. 3: 944. https://doi.org/10.3390/molecules27030944
APA StyleRauf, M. A., Alam, M. T., Ishtikhar, M., Ali, N., Alghamdi, A., & AlAsmari, A. F. (2022). Investigating Chaperone like Activity of Green Silver Nanoparticles: Possible Implications in Drug Development. Molecules, 27(3), 944. https://doi.org/10.3390/molecules27030944