Article

Mintaimycins, a Group of Novel Peptide Metabolites from Micromonospora sp. C-3509

1
NHC Key Laboratory of Biotechnology of Antibiotics, Institute of Medicinal Biotechnology, Chinese Academy of Medical Sciences and Peking Union Medical College, Beijing 100050, China
2
CAMS Key Laboratory of Synthetic Biology for Drug Innovation, Institute of Medicinal Biotechnology, Chinese Academy of Medical Sciences and Peking Union Medical College, Beijing 100050, China
3
Beijing Key Laboratory of Antimicrobial Agents, Institute of Medicinal Biotechnology, Chinese Academy of Medical Sciences and Peking Union Medical College, Beijing 100050, China
*
Authors to whom correspondence should be addressed.
Molecules 2022, 27(4), 1150; https://doi.org/10.3390/molecules27041150
Submission received: 27 December 2021 / Revised: 27 January 2022 / Accepted: 1 February 2022 / Published: 9 February 2022
(This article belongs to the Section Natural Products Chemistry)

Abstract

:
A group of peptide metabolites (14), designated as mintaimycins, were isolated from Micromonospora sp. C-3509. The planar structures of mintaimycins were determined by combination of mass spectrometry, 1D and 2D NMR spectroscopy, and the stereochemistry of mintaimycins were partially resolved by Marfey’s or Mosher’s method. Mintaimycins featured a central β-methylphenylalanine or phenylalanine linked at its amino group with 5-methyl-2-hexenoic acid, and at its carboxyl group with 5-hydroxy-norleucine or leucine that combined a derivative of hexanoic acid or 4-methylpentanoic acid. Mintaimycin A1 (1), the principal component, was found to exhibit the biological activity of inducing pre-adipocyte differentiation of 3T3-L1 fibroblast cells at 10.0 μmol/L.

1. Introduction

Micromonospora, a genus of actinomycetes, is most famous for producing secondary metabolites of aminocyclitols with strong antibacterial activity and enediynes with severe antitumor activity. Micromonospora echinospora subsp. calichensis, for example, is the producer of the clinical antibiotic gentamicin and payload in antibody-drug conjugate calicheamicin [1]. Micromonospora is also known for producing secondary metabolites with diverse chemical structures and biological activities. Many bioactive polyene macrolactams, aromatic polyketides and peptides have been identified from the genus [2,3,4,5,6,7,8].
We are interested in new secondary metabolites from actinomycetes [9,10,11]. Micromonospora sp. C-3509 as a soil strain isolated from Sheshan in Wuhan of China was previously identified as a calicheamicin producer [12]. To explore whether the strain produced any other secondary metabolites, we performed a microbial chemistry investigation for it. Herein, the discovery of a group of novel peptide metabolites (mintaimycins) from the strain was described.

2. Results and Discussion

2.1. Discovery of New Secondary Metaboltes (Mintaimycins) from Micromonospora sp. C-3509

Two HPLC peaks with identical UV absorption profile (λmax at 208 nm) appeared in the ethyl acetate (EtOAc) extract of Micromonospora sp. C-3509 cultured on solid state fermentation medium. They displayed molecular mass of 500 and 486 amu, respectively, by mass spectrometry (Figures S1–S3). As calicheamicin, with a molecular mass of 1367 amu, was the only reported secondary metabolite of Micromonospora sp. C-3509, compounds in these peaks aroused our interest.
An enlarged culture of Micromonospora sp. C-3509 was prepared and extracted with EtOAc for isolation and purification of the interested compound(s) (Figure S4). The EtOAc extract was loaded on an ODS column for fractionation. Eluents containing the interested compound(s) were applied on reverse-phase HPLC column for the final isolation and refinement of the interested compound(s) (Figures S5–S8). In the end, four pure compounds 14 were obtained (Figures S9–S16).

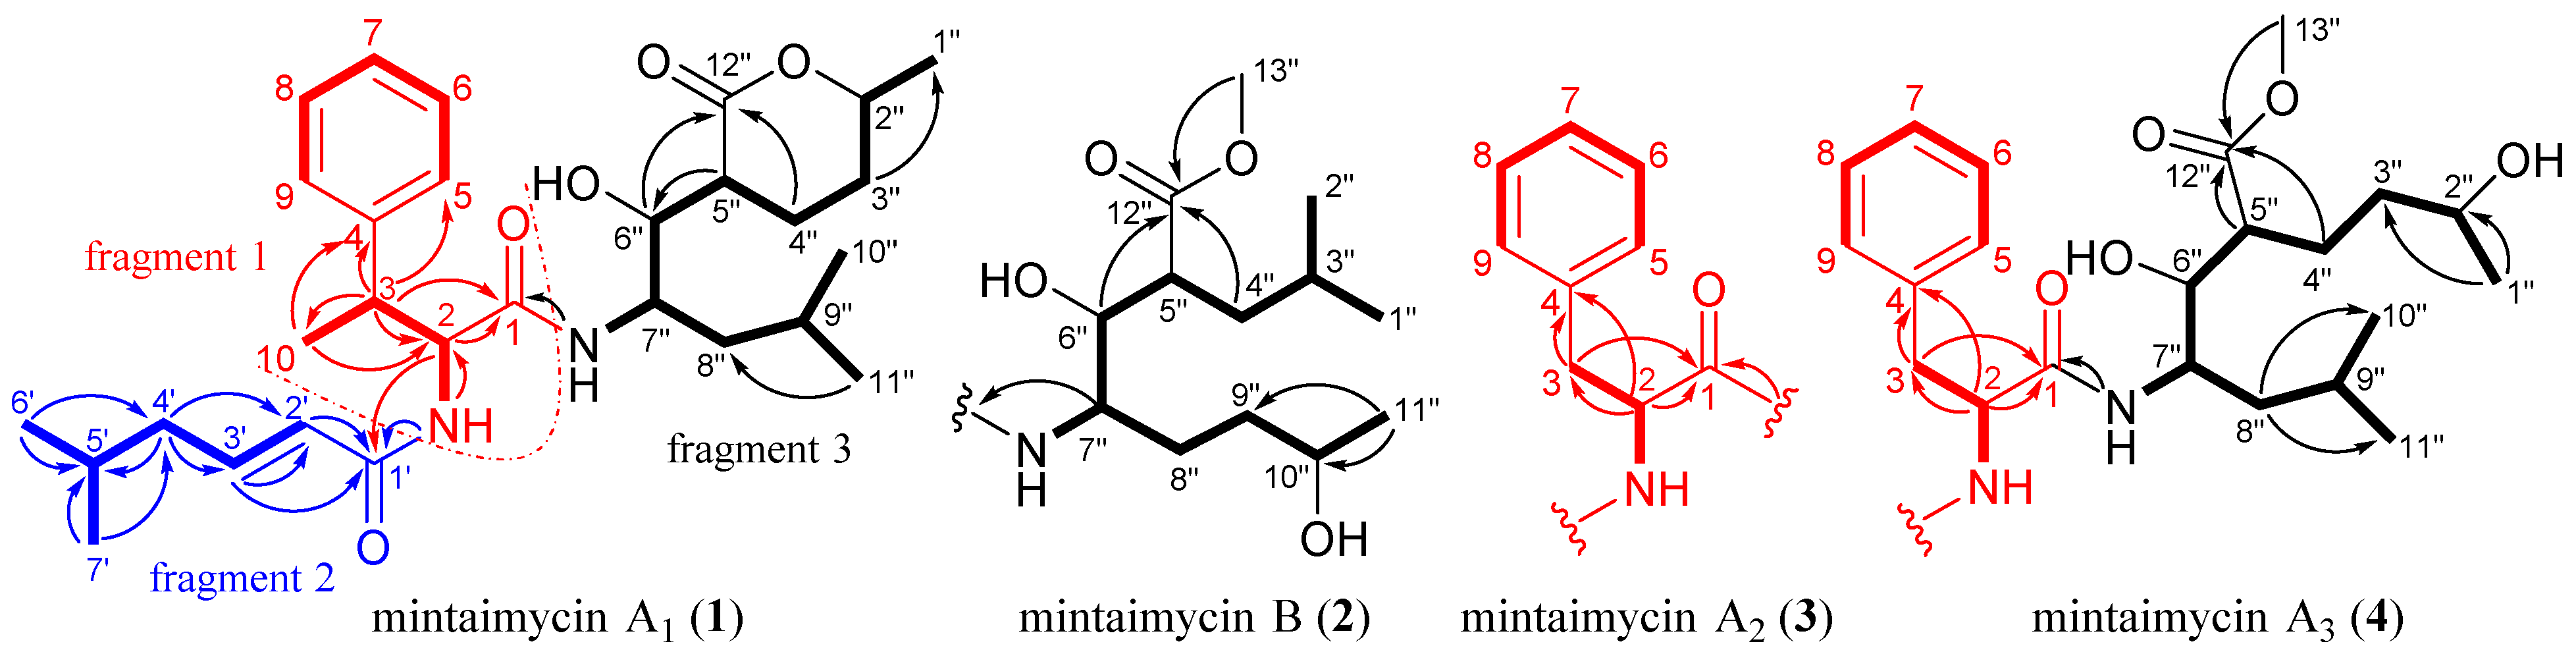
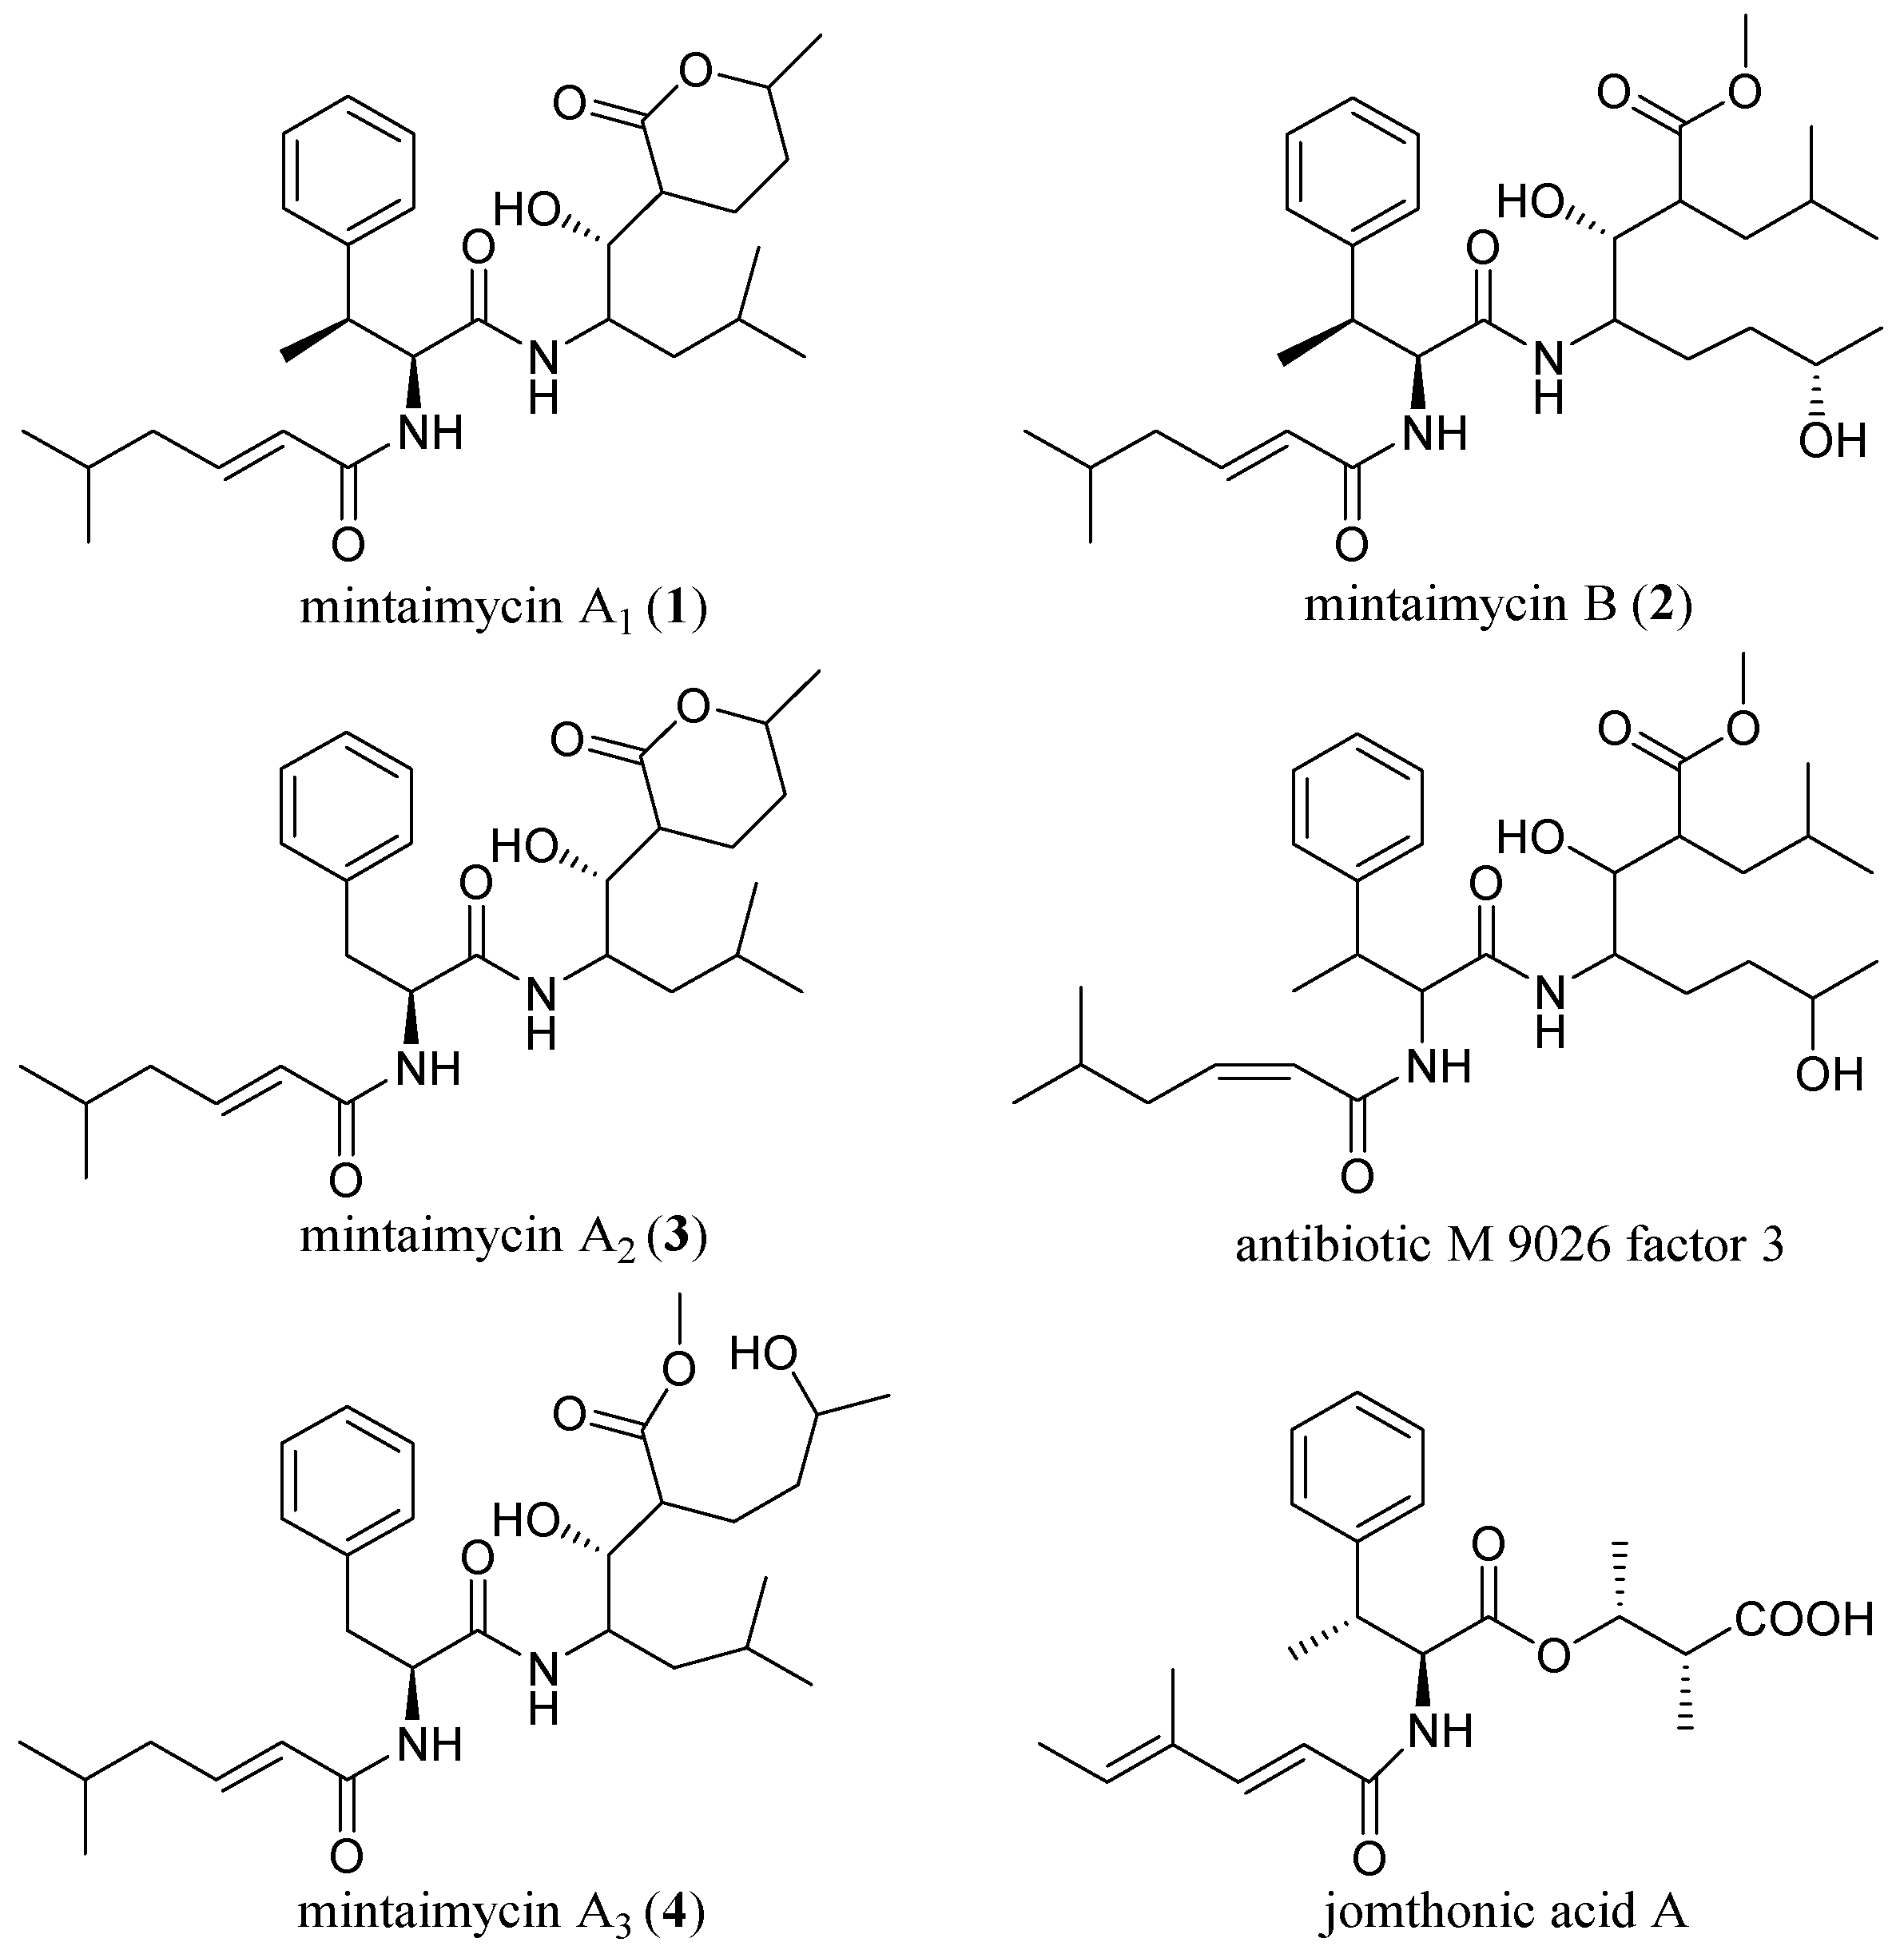
2.2. Structural Elucidation of Mintaimycins (14)

Compound 1 was a white amorphous powder. Its molecular formula was deduced as C29H44N2O5 by HRESIMS, implying 9 degrees of unsaturation. The 1H NMR spectrum of 1 displayed resonances attributable to: (a) a di-substituted trans-double bond attached to an aliphatic methylene unit (δH 5.76 (dt, J = 15.6, 1.2 Hz, H-2′), 6.62 (dt, J = 15.0, 7.8 Hz, H-3′)), (b) a monosubstituted benzene ring (δH 7.22 (1H, m, H-7), δH 7.27 (2H, m, H-6 and H-8), and δH 7.29 (2H, m, H-5 and H-9)), and (c) six secondary methyls (δH 0.86–1.29, doublets, H-10/H-6′/H-7′/H-1″/H-10″/H-11″). The 1H NMR spectrum (Figure S17) also displayed four sp3-hybridized methylenes, eight sp3-hybridized methines and three exchangeable resonances assignable to two amide protons at δH 7.09 (d, J = 8.4 Hz, NH-2) and 7.22 (d, J = 10.2 Hz, NH-1) and a secondary hydroxy proton at δH 4.16 (ddd, J = 8.4, 6.0, 1.8 Hz, H-6″). The 13C NMR and DEPT spectra (Figures S18 and S19) of 1 showed 29 carbon resonances, which corresponded to the above groups and three additional carbonyl carbons (δC 166.4 (C-1′), 172.5 (C-1) and 173.8 (C-12″)).
The planar structure of 1 was resolved by a comprehensive analysis of 2D NMR spectra (1H-1H COSY, HSQC, and HMBC, Figures S20–S22). In the 1H-1H COSY spectrum (Figure S20) of 1, the homonuclear coupling correlations of NH-2/H-2/H-3/H3-10 revealed the presence of structural units containing the vicinal coupled protons (Figure 1, thick lines). In the HMBC spectrum of 1, two- and three-bond correlations of H3-10/C-4 (δC 145.2) and C-2, H-3/C-5 (δC 129.2) and C-1 (δC 172.5) were observed. These correlations, in combination with the shifts of these proton and carbon resonances, demonstrated the presence of a β-methylphenylalanine (β-MePhe) unit in 1 (fragment 1 in Figure 1). The 1H-1H COSY correlations of H3-7′/H-5′, H3-6′/H-5′/H-4′/H-3′/H-2′, and HMBC correlations of H3-6′/C-5′ and H2-4′, H3-7′/C-5′ and C-4′, H2-4′/C-3′ and C-2′, and H-3′/C-1′, together with the chemical shift of these carbons, indicated the presence of a 5-methyl-2-hexenoic acid unit in 1 (fragment 2 in Figure 1). Meanwhile, the 1H-1H COSY correlations of NH-7″/H-7″, H3-1″/H-2″/H2-3″/H2-4″/H-5″/H-6″/H-7″/H2-8″/H-9″/H3-10″, H3-11″/H-9″, the HMBC correlations of H-6″ and H2-4″/C-12″, H3-11″ and H3-10″/C-8″ and together with molecular formula revealed the presence of 3(2-amino-1-hydroxy-4-methylpentyl)-6-methyltetrahydropyranone unit in 1 (fragment 3 in Figure 1, containing a δ-lactone ring).
The connectivity of fragments 1 and 2 via a nitrogen atom (N-2) was clearly demonstrated by the HMBC correlation from NH-2 to C-1′ (Figure 1). The association of fragments 1 and 3 via C-1-N (NH-7″) was suggested by the HMBC correlations from NH-7″ to C-1. Therefore, the planar structure of 1 was determined as in Figure 1, which was further supported by the molecular formula of 1. A SciFinder search confirmed that 1 was a new compound. Compound 1 as the principal component of 14 was designated as mintaimycin A1. Its NMR data were assigned in Table 1.
Compound 2 was a white amorphous powder. Its molecular formula was deduced by HRESIMS as C30H48N2O6, which is CH3OH more than 1. The 1H and 13C NMR data (Figures S24 and S25) indicated that 2 was a close homologue of 1. Analysis of the 2D-NMR data (Figures S26–S30) suggested that 2 should be the δ-lactone ring-open (hydrolyzed) and methyl esterified derivative of 1, and the isobutyl attached at C-7″ and the butyl attached at C-5″ in 1 were exchanged in 2, which was confirmed by 1H-1H COSY correlations of H3-1″/H-3″, and H3-2″/H-3″/H2-4″/H-5″/H-6″/H-7″/H2-8″/H2-9″/H-10″/H3-11″, HMBC correlations from H-7″ to C-1, H2-4″ and H-6″ to C-12″ and OCH3-13″ to C-12″. Thus, the planar structure of 2 was depicted as in Figure 1. A SciFinder search indicated that it was the isomer of antibiotic M 9026 factor 3 (Table S1) [13], and they differed only at the E/Z configuration of carbon-carbon double bond of fragment 1. Compound 2 was designated as mintaimycin B. Its NMR data were assigned in Table 1.
Compound 3 was a white amorphous powder. Its molecular formula C28H42N2O5 was determined from the HRESIMS data, which is CH2 less than 1. Compound 3 showed nearly identical NMR data to 1 except for the absence of a doublet methyl at δC 20.7 (δH 1.29, d, J = 7.2 Hz, C-10), and presence of an additional methene (δC (37.5, C-3), δH (2.80, dd, J = 15.8, 9.0 Hz; 2.88, dd, J = 15.8, 6.6 Hz, H-3)) to replace a methine (δC (42.4, C-3), δH (3.19, dq, J = 10.2, 6.6 Hz, H-3)) in 1. Detailed analysis of 1D and 2D NMR data (Figures S31–S37) revealed that 3 was the 3-demethyl derivative of 1, which was supported by the 1H-1H COSY correlations (Figure 1) of NH-2/H-2/H2-3 and the HMBC correlations from NH-1 and H2-3 to C-1, and from H-2 and H2-3 to C-4. Thus, the planar structure of 3 was depicted as in Figure 1. Compound 3 was designated as mintaimycin A2. Its NMR data were assigned in Table 1.
Compound 4 was obtained as a white amorphous powder. Its molecular formula was deduced as C29H46N2O6 by HRESIMS, which is CH3OH more than 3. Spectroscopic data showed that 4 was a close homologue of 3 except for the signals of a methoxy (δC 52.2, δH 3.63 s, OCH3-13″) in 4. Analysis of 2D-NMR data (Figures S38–S44) suggested that 4 should be the δ-lactone ring-open (hydrolyzed) and then methyl esterified derivative of 3, which was supported by the 1H-1H COSY correlations (Figure 1) of H2-4″/H-5″/H-6″ and the HMBC correlations from OCH3-13″ to C-12″. Thus, the planar structure of 4 was depicted as in Figure 1. Compound 4 was designated as mintaimycin A3. Its NMR data were assigned in Table 1.

2.3. Stereochemistry of Mintaimycins

Mintaimycins have five or six chiral carbons for determination of their configurations. The chiral carbon(s) in β-MePhe/Phe of mintaimycins was determined of configuration by Marfey’s method [14,15]. Specifically, the β-MePhe in 12 was determined as (2S, 3S)-β-MePhe (Figure S45), and the Phe in 34 was determined as (2S)-Phe (L-Phe, Figures S46 and S47). The chiral carbon C-6″ (with a secondary hydroxy group in 1 and 3) and C-10″ (with a secondary hydroxy group in 2) were deduced of their configurations by Mosher’s method [16]. Specifically, comprehensive analysis of 1H NMR resonances of R- and S-MTPA ester derivatives (Figures S48–S95) revealed systematic distribution of ΔδSR values (δSδR in ppm), thus establishing R configuration for chiral carbon C-6″ in 1 and 3 (Figure 2 and Table S2; Table S3 and Figure S96), and S configuration for chiral carbon C-10″ in 2 (Table S4 and Figure S97). According to the plausible pathway proposed for mintaimycins biosynthesis described below, chiral carbon C-6″ in 2 and 4 should take the same configuration as chiral carbon C-6″ in 1 and 3.
There are still chiral carbons C-2″, C-5″ and C-7″ in 1, 3 and 4, C-6″ in 4, and chiral carbons C-5″, C-6″, C-7″ in 2, undetermined of their configuration(s). So, mintaimycins with partially elucidated stereochemistry were depicted as in Figure 3.

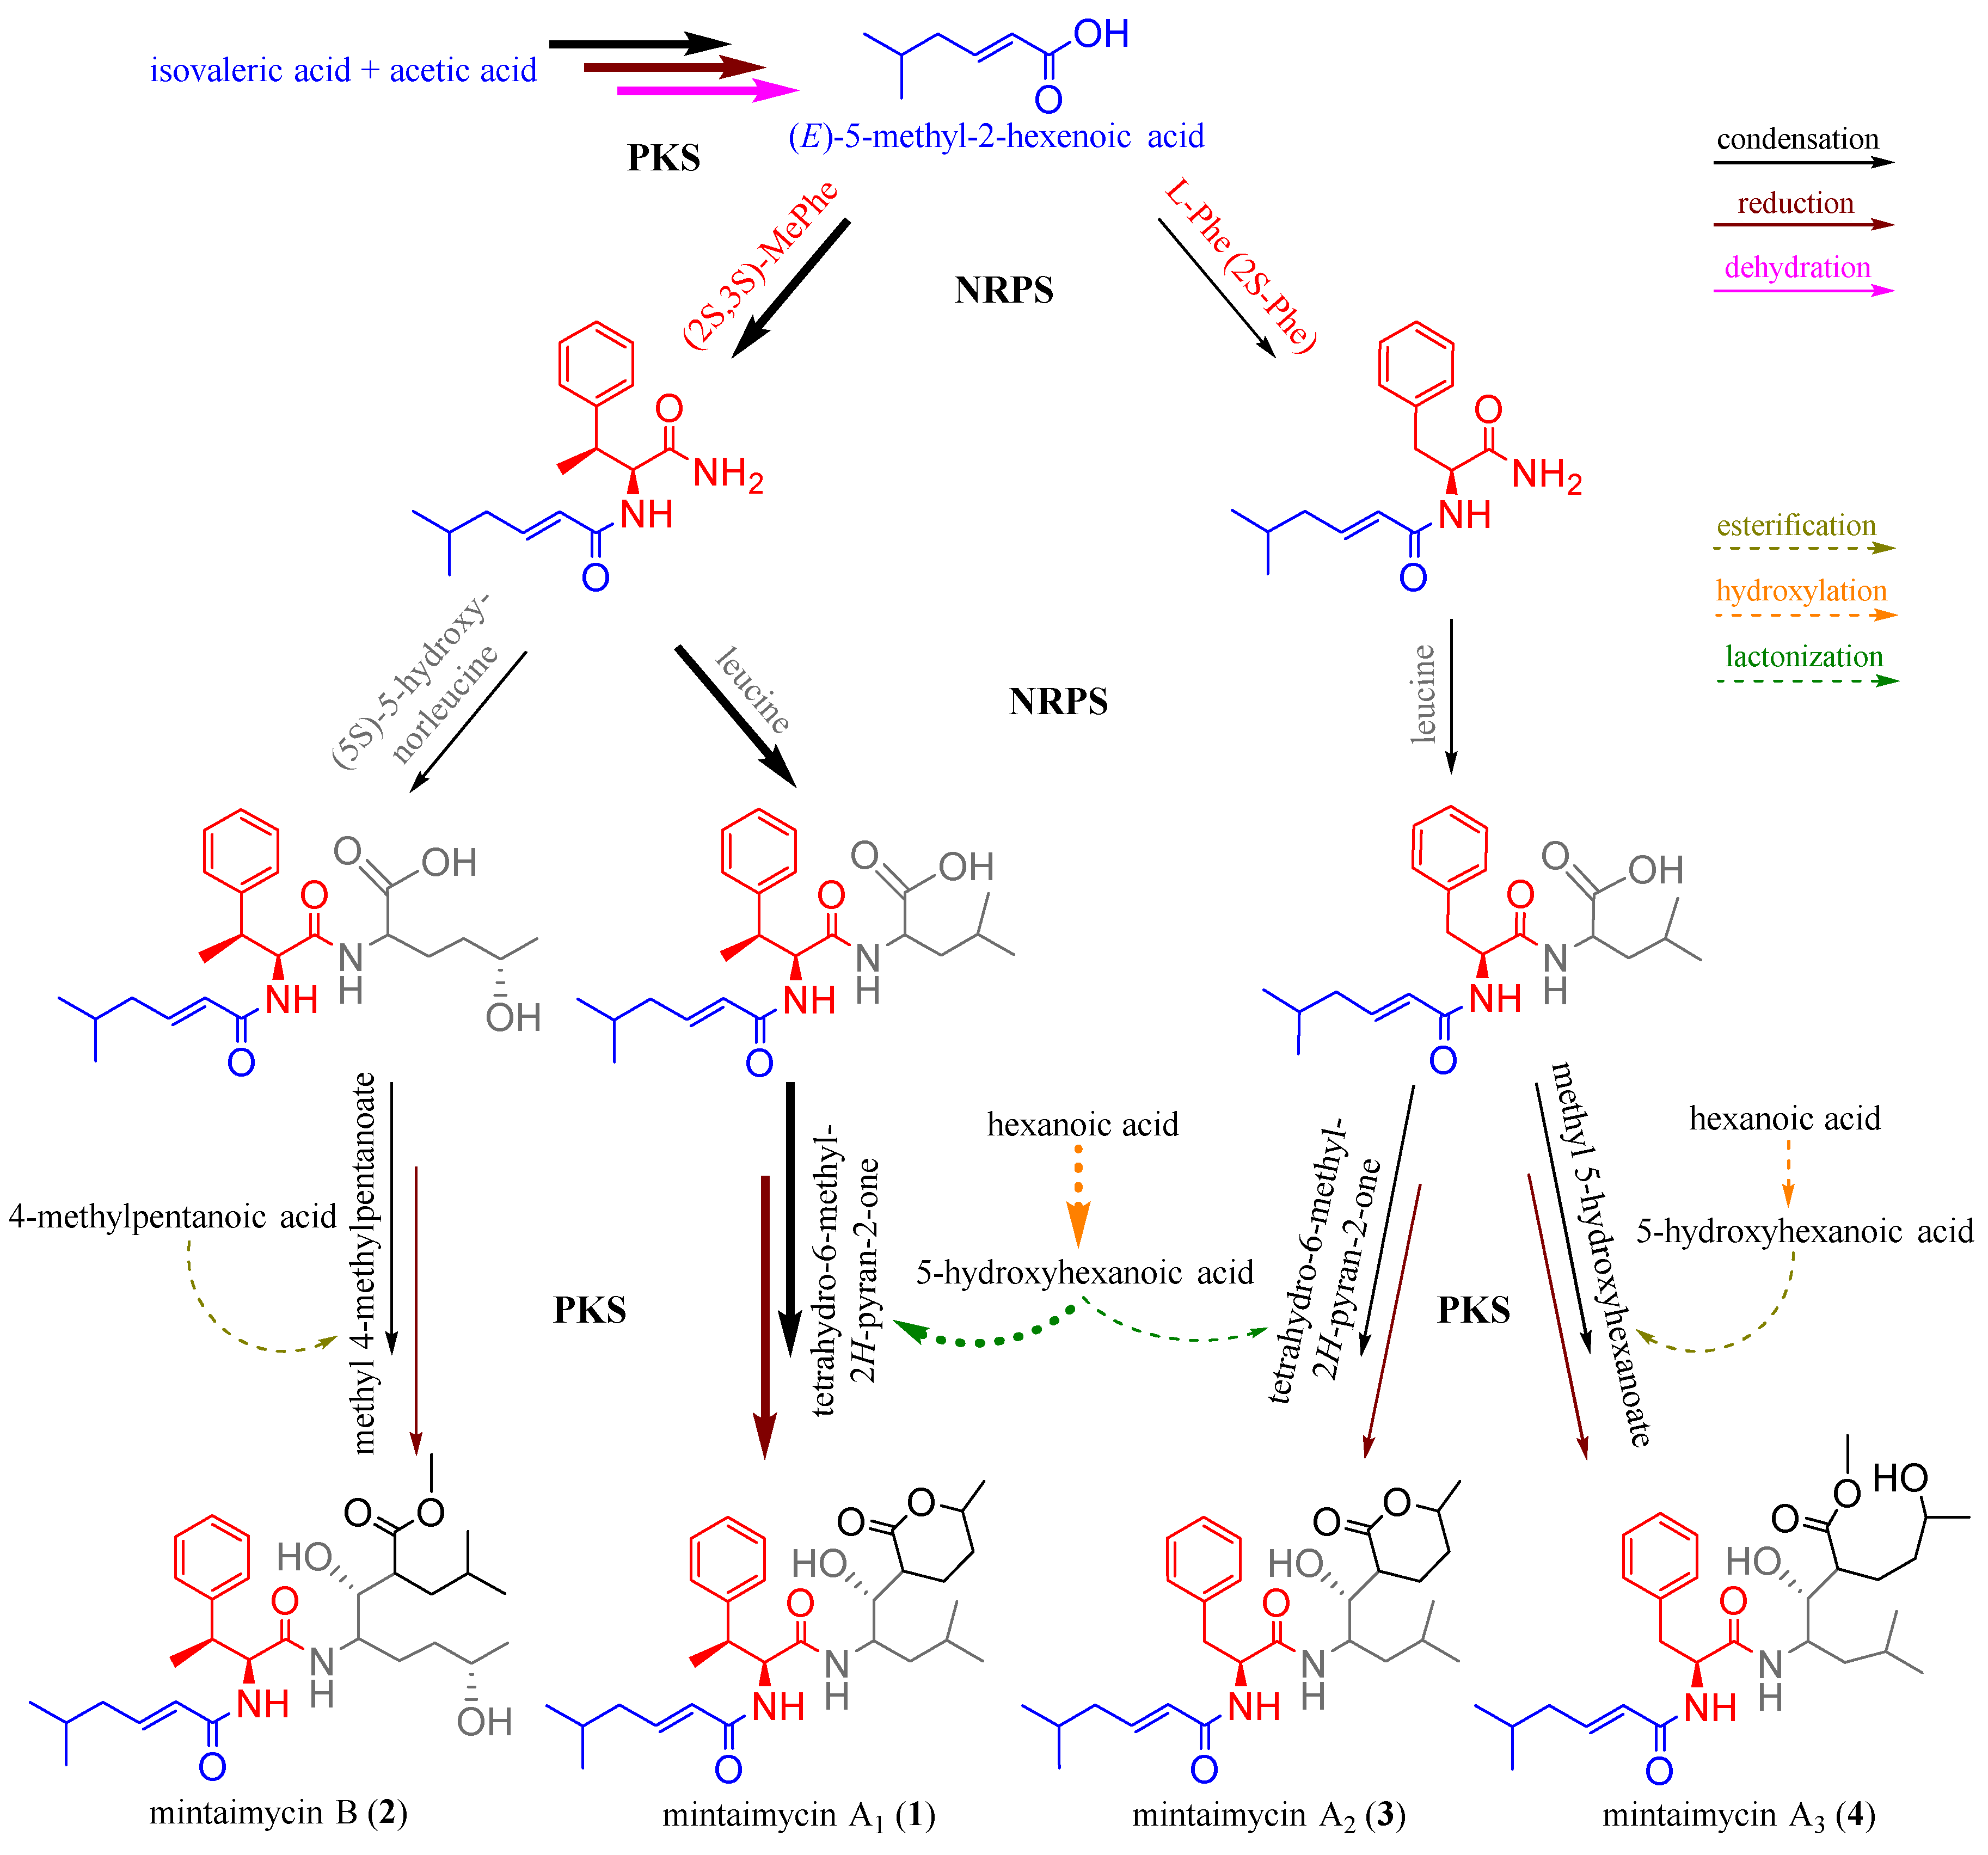
2.4. Speculation of Pathway for Mintaimycins (14) Biosynthesis

As a group of peptide metabolites with similar or same building/assembling blocks, mintaimycins must have shared the same biosynthetic mechanism. Based on the biosynthetic pathway of jomthonic acids [17], a group of secondary metabolites from Streptomyces with similar structure to mintaimycins, a plausible pathway for mintaimycins biosynthesis was proposed as in Figure 4. In the pathway, fragment 1 as the common start building block may come from condensation, keto-reduction, and dehydration of isovaleric acid and acetic acid (catalyzed by polyketide synthase, PKS). Catalyzed by another PKS, fragment 3 may come from condensation and keto-reduction of 5-hydroxy-norleucine or leucine with a derivative of hexanoic acid or 4-methylpentanoic acid (tetrahydro-6-methyl-2H-pyran-2-one, methyl 5-hydroxyhexanoate or methyl 4-methylpentanoate). Fragments 1 and 3 are joined with fragment 2 by two amide bonds catalyzed by non-ribosomal peptide synthase (NRPS). Therefore, mintaimycins belong to the biosynthetic products of NRPS-PKS.

2.5. Biological Activities of Mintaimycins

An antibiotic M 9026 complex from Micromonospora sp. NRRL 15118 with three antitumor and antimicrobial components was disclosed in the US Patent 4, 692, 333, and planar structure of antibiotic M 9026 factor 3 was provided in SciFinder. As mintaimycins displayed similar structure to antibiotic M 9026 factor 3, we assayed the antibacterial activity of mintaimycins A1 (1), B (2) and A2 (3), and cytotoxic activity of mintaimycin A1 (1). Mintaimycin A3 (4) was not assayed of its biological activity due to lack of material. Unfortunately, mintaimycins A1 (1), B (2) and A2 (3) showed no activity against Gram-positive and -negative bacteria (MIC ≥ 32 μg/mL, Table S5), and mintaimycin A1 (1) displayed almost no cytotoxicity against human cell lines HeLa, HGC-27 and PANC-1 (IC50 ≥ 172.98 μmol/L, Table S6).
Mintaimycins are also similar to jomthonic acids (a group of secondary metabolites from Streptomyces) that possess the biological activity of inducing pre-adipocyte differentiation [14,18]. We assayed mintaimycin A1 (1) of this activity. At a concentration of 10.0 μmol/L, mintaimycin A1 (1) exhibited a prominent activity of inducing pre-adipocytes to mature adipocytes for 3T3-L1 cells (Figure 5, Figure S98).

3. Materials and Methods

3.1. General Procedures

UV spectra were acquired with a Cary 300 spectrometer. IR spectra were obtained using a Nicolet 5700FTIR microscope spectrometer. Analytical HPLC was conducted on an Agilent system with a 1260 Quat-Pump and DAD detector. For semi-preparative HPLC, a reverse-phase C18 column (Spursil 5μm C18 column: 250 × 10.0 mm) was used with MeCN-H2O as a solvent system. LC-MS was performed on a 1100–6410 Triple Quad from Agilent or an Agilent 1100 LC/MSD with a G1946D single quadrupole mass spectrometer. High-resolution mass spectrometry was carried out on a XEVO G2-XS QTof from Waters. NMR data were collected using a Bruker-600 or an ADVANCE HD 800 MHz and a Bruker Avance Ⅲ HD 700 MHz spectrometer, where chemical shifts (δ) were reported in ppm and referenced to DMSO-d6 solvent signal (δH 2.49 and δC 39.5), CDCl3 solvent signal (δH 7.26 and δC 77.0) and acetone-d6 solvent signal (δH 2.04 and δC 206.0). 3T3-L1 fibroblast cell (pre-adipocyte) line was purchased from the Cell Center of the Institute of Basic Medicine, Chinese Academy of Medical Sciences.

3.2. Solid State Fermentation of Micromonospora sp. C-3509

Frozen stock spores of Micromonospora sp. C-3509 were thawed, inoculated on slant medium (tryptone 0.5%, yeast extract 0.3%, malt extract 1.0%, K2HPO4 0.1%, KH2PO4 0.1%, and agar 1.5%, pH 7.0–7.2) and incubated at 28 °C for 10–12 days for spore development. Fresh spores were collected and spread on solid state fermentation medium (sucrose 1.6%, dextrin 2.4%, peptone 0.2%, yeast extract 1.2%, trace element solution 2.0 mL (FeSO4·7H2O, MnCl2·4H2O and ZnSO4·7H2O, each at a concentration of 1.0 mg/mL), KI 0.02% and agar 1.5%, pH 7.0) plates, and incubated at 28 °C for 12 days.

3.3. Extraction and Isolation of Mintaimycins (14)

Solid state fermentation culture (45 L) of Micromonospora sp. C-3509 was extracted with an equal volume of EtOAc three times. The EtOAc extract was concentrated under reduced pressure at room temperature, which yielded a dark brown residue (25.7 g). The residue was loaded onto a preparative ODS column (Spherical C18, 40–60 μm, 61 × 219 mm) and fractionated with a stepwise gradient of MeOH-H2O at a constant flow rate of 18 mL/min, which yielded fractions F1-F55.
HPLC analysis indicated that a mixture of mintaimycins A1 (1), B (2) and A2 (3) appeared in F39-F42. These fractions were combined and dried (78.0 mg), then applied on a C18 column for repeated semi-preparative HPLC, which yielded pure preparation of mintaimycins A1 (1, 22.5 mg), B (2, 8.5 mg) and A2 (3, 7.5 mg).
HPLC analysis indicated that mintaimycins A3 (4) appeared in F37-F38. These fractions were combined and dried (48.0 mg), then applied on a C18 column for repeated semi-preparative HPLC, which yielded pure preparation of mintaimycins A3 (4, 0.4 mg).
Mintaimycin A1 (1): white amorphous powder; [α]20D −21.88 (c 0.32, MeOH); UV-visible (MeOH) λmax (log ε) 206 (4.51) nm; FTIR νmax 3297, 3064, 2958, 2872, 1708, 1652, 1544, 1455, 1384, 1332, 1268, 1215, 1136, 1090, 1036, 981, 942, 885, 761, 701 cm−1; 1H and 13C NMR data, see Table 1; HRESIMS m/z 501.3318 [M + H]+ (calcd for C29H45N2O5, 501.3328).
Mintaimycin B (2): white amorphous powder; [α]20D −5.26 (c 0.076, MeOH); UV-visible (MeOH) λmax (log ε) 207 (4.49) nm; FTIR νmax 3286, 3064, 2958, 2872, 1736, 1656, 1547, 1454, 1369, 1263, 1212, 1134, 1091, 1058, 981, 886, 761, 701 cm−1; 1H and 13C NMR data, see Table 1; HRESIMS m/z 533.3591 [M + H]+ (calcd for C30H49N2O6, 533.3590).
Mintaimycin A2 (3): white amorphous powder; [α]20D −23.75 (c 0.08, MeOH); UV-visible (MeOH) λmax (log ε) 208 (4.47) nm; FTIR νmax 3452, 3311, 3063, 2956, 2871, 1713, 1659, 1631, 1541, 1385, 1264, 1089, 981, 945, 887, 743, 698 cm−1; 1H and 13C NMR data, see Table 1; HRESIMS m/z 487.3175 [M + H]+ (calcd for C28H43N2O5, 487.3172).
Mintaimycin A3 (4): white amorphous powder; [α]20D −40 (c 0.01, MeOH); UV-visible (MeOH) λmax (log ε) 209 (4.27) nm; FTIR νmax 3282, 3065, 2958, 2871, 1734, 1656, 1553, 1498, 1455, 1367, 1263, 1210, 1124, 1069, 1030, 984, 917, 827, 746, 700 cm−1; 1H and 13C NMR data, see Table 1; HRESIMS m/z 519.3447 [M + H]+ (calcd for C29H47N2O6, 519.3434).

3.4. Stereochemistry of β-Methylphenylalanine (β-MePhe) and Phenylalanine (Phe) Residue in Mintaimycins by Marfey’s Method

Mintaimycins A1 (1, 50 μg), B (2, 50 μg), A2 (3, 120 μg) and A3 (4, 120 μg) were hydrolyzed in 6 N HCl (200 μL) at 100 °C for 12 h. Each hydrolysate was dried and dissolved in distilled water (60 μL), then 1 mol/L of NaHCO3 (20 μL) and 1% 1-fluoro-2, 4-dinitrophenyl-5-L-leucinamide (L-FDLA, 25 μL, in acetone) was added, followed by an incubation at 40 °C for 1.5 h. Each L-FDLA derivative solution was neutralized with 1 N of HCl (20 μL), then diluted with MeCN (600 μL) for HPLC analysis.
L-FDLA derivatives of commercial (2R,3R)-β-MePhe, (2R,3S)-β-MePhe, (2S,3S)-β-MePhe, (2S,3R)-β-MePhe, D-Phe and L-Phe were also prepared as described above. An HPLC comparison of L-FDLA derivatives from the hydrolysates of 12 with L-FDLA derivatives of commercial (2R,3R)-β-MePhe, (2R,3S)-β-MePhe, (2S,3S)-β-MePhe, (2S,3R)-β-MePhe was conducted to determine the stereochemistry of β-MePhe in mintaimycins A1 (1) and B (2). An HPLC comparison of L-FDLA derivatives from the hydrolysates of mintaimycins A2 (3) and A3 (4) with L-FDLA derivatives of commercial D-Phe and L-Phe was performed to determine the stereochemistry of Phe in mintaimycins A2 (3) and A3 (4).

3.5. Preparation of (R)- and (S)-MTPA Ester Derivatives of Mintaimycins A1 (1), B (2) and A2 (3) by Mosher’s Method

To the solutions of 1 (2.0 mg, 0.004 mmol), 2 (1.0 mg, 0.002 mmol) or 3 (1.0 mg, 0.002 mmol) in 200 μL of dry CH2Cl2 were added (S)- or (R)-MTPA-Cl (10 equiv) and DMAP (10 equiv). After stirring at 30 °C for 16 h, the solutions were analyzed by LC-MS for ester derivatives (1R and 1S, 2R and 2S, 3R and 3S). Then, the reaction solutions were evaporated to dryness, and the residues were applied on analytical HPLC column for purification of these ester derivatives. MTPA derivatives (1R and 1S, 2R and 2S, 3R and 3S) were dissolved in acetone-d6, CDCl3 and DMSO-d6, respectively, for NMR analysis.

3.6. Pre-Adipocyte Differentiation Assay

3T3-L1 fibroblast cells were maintained in high-glucose DMEM medium containing 10% FBS. The cells were cultured in the 12-well plate to reach a confluence state. Two days post-confluency, the assay was initiated by incubating cells with 10% FBS DMEM containing the inducer mixture (0.5 mmol/L of 3-isobutyl-1-methylxanthine, 10.0 μg/mL of insulin, and 1.0 μmol/L of dexamethasone). At the same time, 1.0 and 10.0 μmol/L of mintaimycin A1 (1) were added, and 2.0 μmol/L of rosiglitazone was used as a positive control. After 3 days, the medium with inducer mixture was replaced by DMEM containing insulin (10.0 μg/mL) and incubated for another 2 days, then the medium was changed with high-glucose DMEM in the presence of 10% FBS every 2 days. After 14 days, the cells were processed for oil red O staining according to standardized protocol [19].

Supplementary Materials

The Supplementary Materials are available online. Figure S1: HPLC and MS analysis of EtOAc extract of Micromonospora sp. C-3509. Figure S2: LC-MS analysis of mintaimycin A1 (1). Figure S3: A MS2 spectrum of mintaimycin A1 (1). Figure S4: Flow chart for isolation and purification of mintaimycins (14). Figures S5–S8: UV-visible spectra of mintaimycins (14). Figures S9–S12: IR spectra of mintaimycins (14). Figures S13–S16: HRESIMS spectra of mintaimycins (14). Figure S17: 1H NMR spectrum (600 MHz) of mintaimycin A1 (1) in acetone-d6. Figures S18–S19: 13C NMR spectrum (150 MHz), DEPT spectrum (150 MHz) of mintaimycin A1 (1) in acetone-d6. Figures S20–S22: 1H-1H COSY spectrum (600 MHz), HSQC spectrum (150 MHz), HMBC spectrum (150 MHz) of mintaimycin A1 (1) in acetone-d6. Figures S24–S25: 1H NMR spectrum (800 MHz), 13C NMR spectrum (200 MHz) of mintaimycin B (2) in CDCl3. Figures S26–S30: DEPT spectrum (150 MHz), 1H-1H COSY spectrum (800 MHz), HSQC spectrum (200 MHz), HMBC spectrum (200 MHz), ROESY spectrum (800 MHz) of mintaimycin B (2) in CDCl3. Figures S31–S37: 1H NMR spectrum (600 MHz), 13C NMR spectrum (150 MHz), DEPT spectrum (150 MHz), 1H-1H COSY spectrum (600 MHz), HSQC spectrum (150 MHz), HMBC spectrum (150 MHz), ROESY spectrum (600 MHz) of mintaimycin A2 (3) in DMSO-d6. Figures S38–S44: 1H NMR spectrum (800 MHz), 13C NMR spectrum (200 MHz), DEPT spectrum (175 MHz), 1H-1H COSY spectrum (800 MHz), HSQC spectrum (200 MHz), HMBC spectrum (200 MHz), ROESY spectrum (800 MHz) of mintaimycin A3 (4) in acetone-d6. Figure S45: SIM mode (m/z 474.1) of mintaimycin A1 (1) and mintaimycin B (2) by Marfey’s method. Figure S46: HPLC analysis of mintaimycin A3-4 (3-4) by Marfey’s method. Figure S47: LC-MS analysis of mintaimycin A3-4 (3-4) by Marfey’s method. Figures S48–S53: LC-MS spectra of (R)-MTPA and (S)-MTPA esters of mintaimycins (13). Figures S54–S95: NMR data of (R)-MTPA and (S)-MTPA esters of mintaimycins (1-3). Figure S96: ΔδSR values measured for the MTPA esters of mintaimycin A2 (3). Figure S97: ΔδSR values measured for the MTPA esters of mintaimycin B (2). Figure S98: Viability of 3T3-L1 fibroblast cells treated with various concentrations of mintaimycin A1 (1). Table S1: 1H NMR data of mintaimycin B (2) and the known antibiotic M 9026 factor 3. Table S2: 1H NMR data in Acetone-d6 for the key protons of mintaimycin A1 (1) and its (R)-MTPA and (S)-MTPA esters. Table S3: 1H NMR data in DMSO-d6 for the key protons of mintaimycin A2 (3) and its (R)-MTPA and (S)-MTPA esters. Table S4: 1H NMR data in CDCl3 for the key protons of mintaimycin B (2) and its (R)-MTPA and (S)-MTPA esters. Table S5: MIC of mintaimycin A1 (1), mintaimycin B (2) and mintaimycin A2 (3) against Gram- positive and negative bacterial strains. Table S6: IC50 of mintaimycin A1 (1) against human cell lines.

Author Contributions

L.W., Y.D. and B.J. conceived the study. X.H. (Xiaomin Hu), Y.W. and C.Z. performed culture and fermentation; X.H. (Xiaomin Hu) performed chemical analysis and compound isolation; B.J. and S.L. performed NMR structure determination. Y.D. and B.H. performed pre-adipocyte differentiation assay; J.S. and Z.W. performed cytotoxicity assay; X.H. (Xinxin Hu) and X.Y. performed antibacterial assay. X.H. (Xiaomin Hu), B.J. and L.W. wrote the manuscript. All authors have read and agreed to the published version of the manuscript.

Funding

This work was supported by National Key Research and Development Program of China (2018YFA0902000), the CAMS Innovation Fund for Medical Sciences (CIFMS, 2021-I2M-1-055) andNational Natural Science Foundation of China (81903530).

Institutional Review Board Statement

Not applicable.

Informed Consent Statement

Not applicable.

Data Availability Statement

Not applicable.

Acknowledgments

NMR and MS analyses were performed at Nuclear Magnetic Resonance Center of Institute of Materia Medica, CAMS & PUMC.

Conflicts of Interest

The authors declare no conflict of interest.

Sample Availability

Not available.

References

  1. Maiese, W.M.; Lechevalier, M.P.; Lechevalier, H.A.; Korshalla, J.; Kuck, N.; Fantini, A.; Wildey, M.J.; Thomas, J.; Greenstein, M. Calicheamicins, a novel family of antitumor antibiotics: Taxonomy, fermentation and biological properties. J. Antibiot. 1989, 42, 558–563. [Google Scholar] [CrossRef] [PubMed]
  2. Skellam, E.J.; Stewart, A.K.; Strangman, W.K.; Wright, J.L. Identification of micromonolactam, a new polyene macro cyclic lactam from two Marine Micromonospora strains using chemical and molecular methods: Clarification of the biosynthetic pathway from a glutamate starter unit. J. Antibiot. 2013, 66, 431–441. [Google Scholar] [CrossRef] [PubMed]
  3. Nie, Y.L.; Wu, Y.D.; Wang, C.X.; Lin, R.; Xie, Y.; Fang, D.S.; Jiang, H.; Lian, Y.Y. Structure elucidation and antitumour activity of a new macrolactam produced by marine-derived actinomycete Micromonospora sp. FIM05328. Nat. Prod. Res. 2018, 32, 2133–2138. [Google Scholar] [CrossRef] [PubMed]
  4. Antal, N.; Fiedler, H.P.; Stackebrandt, E.; Beil, W.; Stroch, K.; Zeeck, A. Retymicin, galtamycin B, saquayamycin Z and ribofuranosyllumichrome, novel secondary metabolites from Micromonospora sp. Tü 6368. I. Taxonomy, fermentation, isolation and biological activities. J. Antibiot. 2005, 58, 95–102. [Google Scholar] [CrossRef] [PubMed] [Green Version]
  5. Furumai, T.; Igarashi, Y.; Higuchi, H.; Saito, N.; Oki, T. Kosinostatin, a quinocycline antibiotic with antitumor activity from Micromonospora sp. TP-A0468. J. Antibiot. 2002, 55, 128–133. [Google Scholar] [CrossRef] [PubMed] [Green Version]
  6. Pang, X.; Zhao, J.; Fang, X.; Liu, H.; Zhang, Y.; Cen, S.; Yu, L. Surfactin derivatives from Micromonospora sp. CPCC 202787 and their anti-HIV activities. J. Antibiot. 2017, 70, 105–108. [Google Scholar] [CrossRef] [PubMed]
  7. McBrien, K.D.; Berry, R.L.; Lowe, S.E.; Neddermann, K.M.; Bursuker, I.; Huang, S.; Klohr, S.E.; Leet, J.E. Rakicidins, new cytotoxic lipopeptides from Micromonospora sp. fermentation, isolation and characterization. J. Antibiot. 1995, 48, 1446–1452. [Google Scholar] [CrossRef] [PubMed] [Green Version]
  8. Qi, S.; Gui, M.; Li, H.; Yu, C.; Li, H.; Zeng, Z.; Sun, P. Secondary Metabolites from Marine Micromonospora: Chemistry and Bioactivities. Chem. Biodivers. 2020, 17, e2000024. [Google Scholar] [CrossRef]
  9. Hu, X.; Hu, X.; Hu, X.; Li, S.; Li, L.; Yu, L.; Liu, H.; You, X.; Wang, Z.; Li, L.; et al. Cytotoxic and Antibacterial Cervinomycins B1-4 from a Streptomyces Species. J. Nat. Prod. 2019, 82, 2337–2342. [Google Scholar] [CrossRef]
  10. Li, L.; Li, S.; Jiang, B.; Zhang, M.; Zhang, J.; Yang, B.; Li, L.; Yu, L.; Liu, H.; You, X.; et al. Isarubrolones Containing a Pyridooxazinium Unit from Streptomyces as Autophagy Activators. J. Nat. Prod. 2019, 82, 1149–1154. [Google Scholar] [CrossRef] [PubMed]
  11. Wang, J.; Hu, X.; Sun, G.; Li, L.; Jiang, B.; Li, S.; Bai, L.; Liu, H.; Yu, L.; Wu, L. Genome-Guided Discovery of Pretilactam from Actinosynnema pretiosum ATCC 31565. Molecules 2019, 24, 2281. [Google Scholar] [CrossRef] [PubMed] [Green Version]
  12. Zhao, C.; Zhang, W.; Gao, R.; Jin, L.; Li, D.; Shao, R. Separation, purification and structure identification of the antitumor antibiotic component from fermentation broth of a new Micromonospora sp. C-3509. Chin. J. New Drugs 2010, 19, 564–568. [Google Scholar]
  13. Pirali, G.; Pagani, H.; Grandi, M.; Paternoster, M.; Tamoni, G.; Cassani, G. Antimicrobial and Antitumor Antibiotic M 9026 and Its Pure Individual Factors 1, 2 and 3, and Microbial Process for Production thereof. U.S. Patent 4692333, 8 September 1987. [Google Scholar]
  14. Igarashi, Y.; Yu, L.; Ikeda, M.; Oikawa, T.; Kitani, S.; Nihira, T.; Bayanmunkh, B.; Panbangred, W. Jomthonic acid, a modified amino acid from a soil-derived Streptomyces. J. Nat. Prod. 2012, 75, 986–990. [Google Scholar] [CrossRef] [PubMed]
  15. Jiao, W.H.; Khalil, Z.; Dewapriya, P.; Salim, A.A.; Lin, H.W.; Capon, R.J. Trichodermides A–E: New Peptaibols Isolated from the Australian Termite Nest-Derived Fungus Trichoderma virens CMB-TN16. J. Nat. Prod. 2018, 81, 976–984. [Google Scholar] [CrossRef] [PubMed]
  16. Annang, F.; Perez-Victoria, I.; Perez-Moreno, G.; Domingo, E.; Gonzalez, I.; Tormo, J.R.; Martin, J.; Ruiz-Perez, L.M.; Genilloud, O.; Gonzalez-Pacanowska, D.; et al. MDN-0185, an Antiplasmodial Polycyclic Xanthone Isolated from Micromonospora sp. CA-256353. J. Nat. Prod. 2018, 81, 1687–1691. [Google Scholar] [CrossRef] [PubMed]
  17. Garcia-Salcedo, R.; Alvarez-Alvarez, R.; Olano, C.; Canedo, L.; Brana, A.F.; Mendez, C.; de la Calle, F.; Salas, J.A. Characterization of the Jomthonic Acids Biosynthesis Pathway and Isolation of Novel Analogues in Streptomyces caniferus GUA-06-05-006A. Mar. Drugs 2018, 16, 259. [Google Scholar] [CrossRef] [PubMed] [Green Version]
  18. Yu, L.; Oikawa, T.; Kitani, S.; Nihira, T.; Bayanmunkh, B.; Panbangred, W.; Igarashi, Y. Jomthonic acids B and C, two new modified amino acids from Streptomyces sp. J. Antibiot. 2014, 67, 345–347. [Google Scholar] [CrossRef] [PubMed]
  19. Mehlem, A.; Hagberg, C.E.; Muhl, L.; Eriksson, U.; Falkevall, A. Imaging of neutral lipids by oil red O for analyzing the metabolic status in health and disease. Nat. Protoc. 2013, 8, 1149–1154. [Google Scholar] [CrossRef] [PubMed] [Green Version]
Figure 1. The 1H-1H COSY (thick lines) and main HMBC (arrows) correlations of mintaimycins A1–3 and B (14).
Molecules 27 01150 g001
Figure 2. ΔδSR values measured for the MTPA esters of mintaimycin A1 (1).
Molecules 27 01150 g002
Figure 3. Structures of mintaimycins (14), antibiotic M 9026 factor 3 and jomthonic acid A.
Molecules 27 01150 g003
Figure 4. The plausible pathway for mintaimycin biosynthesis.
Molecules 27 01150 g004
Figure 5. Mintaimycin A1 (1) induced differentiation of 3T3-L1 fibroblast cells to adipocytes. Compared to vehicle-treated 3T3-L1 fibroblast cells, cells treated with mintaimycin A1 (1) at 10.0 μmol/L produced prominent oil red O-stained lipid droplets after an incubation period of 14 days, suggesting that it promoted 3T3-L1 fibroblast cells to differentiate into lipid-accumulating adipocytes. Rosiglitazone (an anti-diabetic drug) at 2.0 μmol/L was used as positive control in the assay. A mixture of 10.0 μg/mL of insulin, 0.5 mmol/L of 3-isobutyl-1-methylxanthine and 1.0 μmol/L of dexamethasone was used as an inducer for cell adipogenesis. (A) Representative images of oil red O staining of 3T3-L1 cells at day 14, a: blank; b: vehicle (inducer); c: 1.0 μmol/L (1); d: 10.0 μmol/L (1); e: 2.0 μmol/L (rosiglitazone); (B) differentiation-inducing activity quantified by oil red O-stained images (100× magnification).
Molecules 27 01150 g005
Table 1. NMR data of mintaimycins A1 (1), B (2), A2 (3) and A3 (4).
Mintaimycin A1 (1)Mintaimycin B (2)Mintaimycin A2 (3)Mintaimycin A3 (4)
Position δC, TypeδH (J in Hz)δC, TypeδH (J in Hz)δC, TypeδH (J in Hz)δC, TypeδH (J in Hz)
1172.5, C 170.7, C 171.0, C 172.5, C
1-NH 7.22, d (10.2) 6.15, d (8.0) 7.88, d (9.6) 7.12, d (8.8)
260.8, CH4.50, dd (10.2,
8.4)
59.1, CH4.50, t (7.2)55.0, CH4.44, m56.6, CH4.67, m
342.4, CH3.19, dq (10.2,
6.6)
40.5, CH3.43, m37.5, CH22.88, dd (15.8, 6.6);
2.80, dd (15.8, 9.0)
39.6, CH22.93, dd (11.9, 7.2);
3.10, dd (11.9, 7.2)
4145.2, C 141.7, C 137.9, C 139.3, C
5129.2, CH7.29, overlap127.6, CH7.24, overlap128.2, CH7.25, overlap130.8, CH7.26, overlap
6129.9, CH7.27, overlap128.9, CH7.31, t (7.2)129.3, CH7.25, overlap129.7, CH7.26, overlap
7128.0, CH7.22, m 127.2, CH7.23, d (7.2)126.4, CH7.18, m 127.9, CH7.19, overlap
8129.9, CH7.27, overlap128.9, CH7.31, t (7.2)129.3, CH7.25, overlap129.7, CH7.26, overlap
9129.2, CH7.29, overlap127.6, CH7.24, overlap128.2, CH7.25, overlap130.8, CH7.26, overlap
1020.7, CH31.29, d (7.2)18.2, CH31.30, d (7.2)
1′166.4, C 165.8, C 164.9, C 166.5, C
1′-NH 7.09, d (8.4) 5.77, d (7.2) 8.21, d (8.4) 7.34, d (8.0)
2′126.5, CH5.76, dt (15.6,
1.2)
123.7, CH5.62, d (15.2);125.4, CH5.93, d (15.0)126.7, CH5.98, d (14.4)
3′143.9, CH6.62, td (15.0,
7.8)
145.1, CH6.70, td (15.2,
7.2)
141.6, CH6.53, td (15.0, 7.2)144.0, CH6.71, dt (14.4, 6.4)
4′42.4, CH21.97, m 41.3, CH22.00, m 40.6, CH22.00, m42.5, CH22.05, overlap
5′29.3, CH1.66, m27.8, CH1.88, m27.6, CH1.67, m29.3, CH1.72, m
6′23.3, CH30.86, d (6.6)22.3, CH30.87, d (6.4)21.6, CH30.87, d (6.6)23.3, CH30.90, d (6.4)
7′23.3, CH30.86, d (6.6)22.4, CH30.87, d (6.4)22.3, CH30.87, d (6.6)23.3, CH30.90, d (6.4)
1″22.5, CH31.22, d (6.6)21.4, CH30.94, d (6.4)22.0, CH31.89, d (6.0)24.7, CH31.06, d (6.4)
2″78.4, CH4.28, m23.9, CH30.93, d (6.4)76.9, CH4.27, m67.3, CH3.64, overlap
3″31.7, CH21.90, m; 1.38, m24.8, CH1.64, m29.8, CH21.76, m; 1.26, m38.5, CH21.37, m; 1.28, m
4″20.3, CH21.98, m; 1.89, m19.5, CH21.99, m; 1.87, m18.5, CH21.83, m; 1.68, m24.8, CH21.86, m; 1.72, m
5″45.3, CH2.77, ddd (9.0,
7.2, 2.4)
43.8, CH2.58, m43.5, CH2.65, m49.4, CH2.51, m
6″75.3, CH4.16, ddd (8.4,
6.0, 1.8)
73.8, CH4.11, overlap73.0, CH3.94, ddd (9.0, 6.6, 1.8)76.2, CH3.69, m
7″50.3, CH4.03, m49.3, CH4.10, overlap48.2, CH3.64, m51.3, CH3.90, m
8″43.3, CH21.79, m; 1.38, m40.8, CH21.55, m; 1.26, m41.0, CH21.46, m; 1.13, m39.8, CH21.38, m
9″26.2, CH1.79, m 30.3, CH21.89, m; 1.42, m24.1, CH1.14, m25.5, CH1.28, m
10″23.1, CH30.95, d (6.6)78.0, CH4.39, m22.4, CH30.74, d (6.6)22.3, CH30.78, d (6.4)
11″25.2, CH30.93, d (6.6)22.0, CH31.31, d (7.2)24.2, CH30.74, d (6.6)25.1, CH30.80, d (6.4)
12″173.8, C 173.8, C 172.9, C 176.2, C
13″-OCH3 50.9, CH33.49, s 52.2, CH33.63, s
Note: 1H and 13C NMR spectra were measured in acetone-d6 for mintaimycin A1 (1), CDCl3 for mintaimycin B (2), DMSO-d6 for mintaimycin A2 (3), and acetone-d6 for mintaimycin A3 (4).
Publisher’s Note: MDPI stays neutral with regard to jurisdictional claims in published maps and institutional affiliations.

