Article

Component Analysis and Anti-Colorectal Cancer Mechanism via AKT/mTOR Signalling Pathway of Sanghuangporus vaninii Extracts

1
Institute of Chinese Materia Medica, China Academy of Chinese Medical Sciences, Beijing 100700, China
2
School of Pharmaceutical Sciences, Zhengzhou University, Zhengzhou 450001, China
3
The TCM Clinic of China Academy, China Academy of Chinese Medical Sciences, Beijing 100700, China
*
Authors to whom correspondence should be addressed.
These authors contributed equally to this work.
Molecules 2022, 27(4), 1153; https://doi.org/10.3390/molecules27041153
Submission received: 6 January 2022 / Revised: 28 January 2022 / Accepted: 1 February 2022 / Published: 9 February 2022

Abstract

:
Sanghuangporus vaninii (Ljub.) L.W. Zhou & Y.C. Dai (SV) is a major cultivar of Sanghuang, which is well known as an excellent anti-tumour drug and reaches the mainstream market in China. Water, 60% ethanol and 95% ethanol were used to extract the drug, and three kinds of polar extracts were obtained separately. Compared with water extracts and 95% ethanol extracts, the 60% ethanol extract had the highest flavonoid content, and its polysaccharide content was greater than that in the 95% ethanol extract and lower than that in the water extract. Its essential components were phenolics whose majority were phenolic acids, flavonoids and phenylpropanoids. This extract has better inhibition effects on the proliferation of SW480 human colon cancer cells, inducing cell apoptosis and blocking G2/M period cells. It can significantly inhibit gene expression and reduce the activation of the AKT/mTOR signalling pathway. The anti-cancer activity of the 60% ethanol extract is satisfactory and may be a result of the combined effects of polysaccharides and flavonoids. The data suggest that the 60% ethanol extract can be used as an adjuvant for chemotherapy and as a potential anti-cancer agent with broad development prospects.

Graphical Abstract

1. Introduction

Colon cancer is the third most common cancer in the world and ranks fourth in cancer mortality [1,2]. The mammalian target of rapamycin (mTOR) is a 289 kDa serine/threonine kinase which belongs to the Akt phosphorylated downstream effector family. It can control cell growth and regulate cancer cell survival and proliferation [3,4]. The Akt/mTOR signalling pathway plays an important role in the survival and growth of cancer cells, such as colon cancer cells [5]. Phytomedicine has become the focus of colon cancer research due to its mild medicinal effect and few side effects [6].
Sanghuang is a large perennial medicinal fungus that parasitizes the woody substrate of Morus plants. Sanghuang has strong inhibitory effects on tumours, and it is widely used in Japan and South Korea [7]. It was first recorded in Shen Nong’s Materia Medica and was considered to be a high-grade herb. Sanghuang is stated to have an “elimination of toxicant” (“pai du qi” in Chinese) function in the New Compendium of Materia Medica (Xin Xiu Ben Cao) and Chinese Compendium of Materia Medica (Ben Cao Gang Mu) [8,9]. Pharmacological studies have revealed that Sanghuang possesses a variety of biological activities, including anti-cancer, immunoregulation, anti-diabetes, antioxidation and anti-inflammation activities. Many kinds of compounds, such as polysaccharides, flavones, triterpenes, aromatic acids and amino acids, have been reported in Sanghuang, and the largest proportion of compounds in the drug are polysaccharides [10]. According to the research of the Japanese scholar Tetsuro Ikekawa, the wild fruit body extract of Sanghuang has a 96.7% inhibitory rate on mouse sarcoma S180, with little toxicity towards normal cells [11]. Many studies have also shown that Sanghuang polysaccharides have significant anti-cancer activity [12,13]. Ge Li et al. reported that polysaccharides have an inhibitory effect on the proliferation and colony formation of SW480 human colon cancer cells, and the effect is associated with decreased Bcl-2 expression, increased release of cytochrome c and reduced cyclin B1 expression [14]. The study also showed that Sanghuang polyphenols have a significant anti-cancer effect, as the polyphenols had cytotoxic activities against various cancer cells [15]. In the treatment of medullary thyroid cancer, researchers found that citric acid did improve symptoms caused by cancer [16]. Takuji Tanaka et al. [17] reported that PA can protect against the development of epithelial malignancy in different tissues and cardiovascular diseases. The mechanism of action mostly involves antioxidant activity, such as inhibiting free radical generation and scavenging and upregulating antioxidant enzymes. By performing a caffeic acid-mediated facile synthesis of silver nanoparticles, the study demonstrated that PA could enhance anti-cancer activity [18].
Sanghuangporus vaninii is responsible for the largest amount of Sanghuang in markets. However, many studies have mainly focused on the extraction, isolation and component analysis of S. vaninii, and there are few studies regarding its bioactivity [7]. Qiong Guo et al. found that S. vaninii exhibits a strong capacity for free radical scavenging, can effectively alleviate cellular oxidative stress and provides therapeutic effects on gout [19]. Xilin Wan et al. reported that polysaccharide from S. vaninii have anti-tumour functions through the activation of the p53 signalling pathway in breast cancer MCF-7 cells. The anti-colon mechanism of S. vaninii has been reported scarcely. In this article, three kinds of extracts were extracted by different polar solvents (water, 60% ethanol and 95% ethanol). The effects on the proliferation, cell cycle and apoptosis of SW480 colon cancer cells in vitro were used as indicators. qRT-PCR and Western blotting were used to explore the effects of the extracts on the AKT/mTOR pathway and preliminarily explain their mechanism of inhibiting human colon cancer cells.

2. Results

2.1. Total Polysaccharide and Flavonoids Contents

The total polysaccharide and flavonoid contents of SVW (water extract of S. vaninii), SVE60 (60% ethanolic extract of S. vaninii) and SVE95 (95% ethanolic extract of S. vaninii) were 0.626, 0.342 and 0.337 mg/mg and 0.0481, 0.5574 and 0.4843 mg/mg, respectively. The polysaccharide content of SVW was the highest, and that of flavonoids was the lowest. The polysaccharide content of SVE60 was slightly higher than that of SVE95, and the total flavonoid content was the highest in SVE60, which was 11.58 times as high as that in SVW and 1.15 times as that in SVE95.

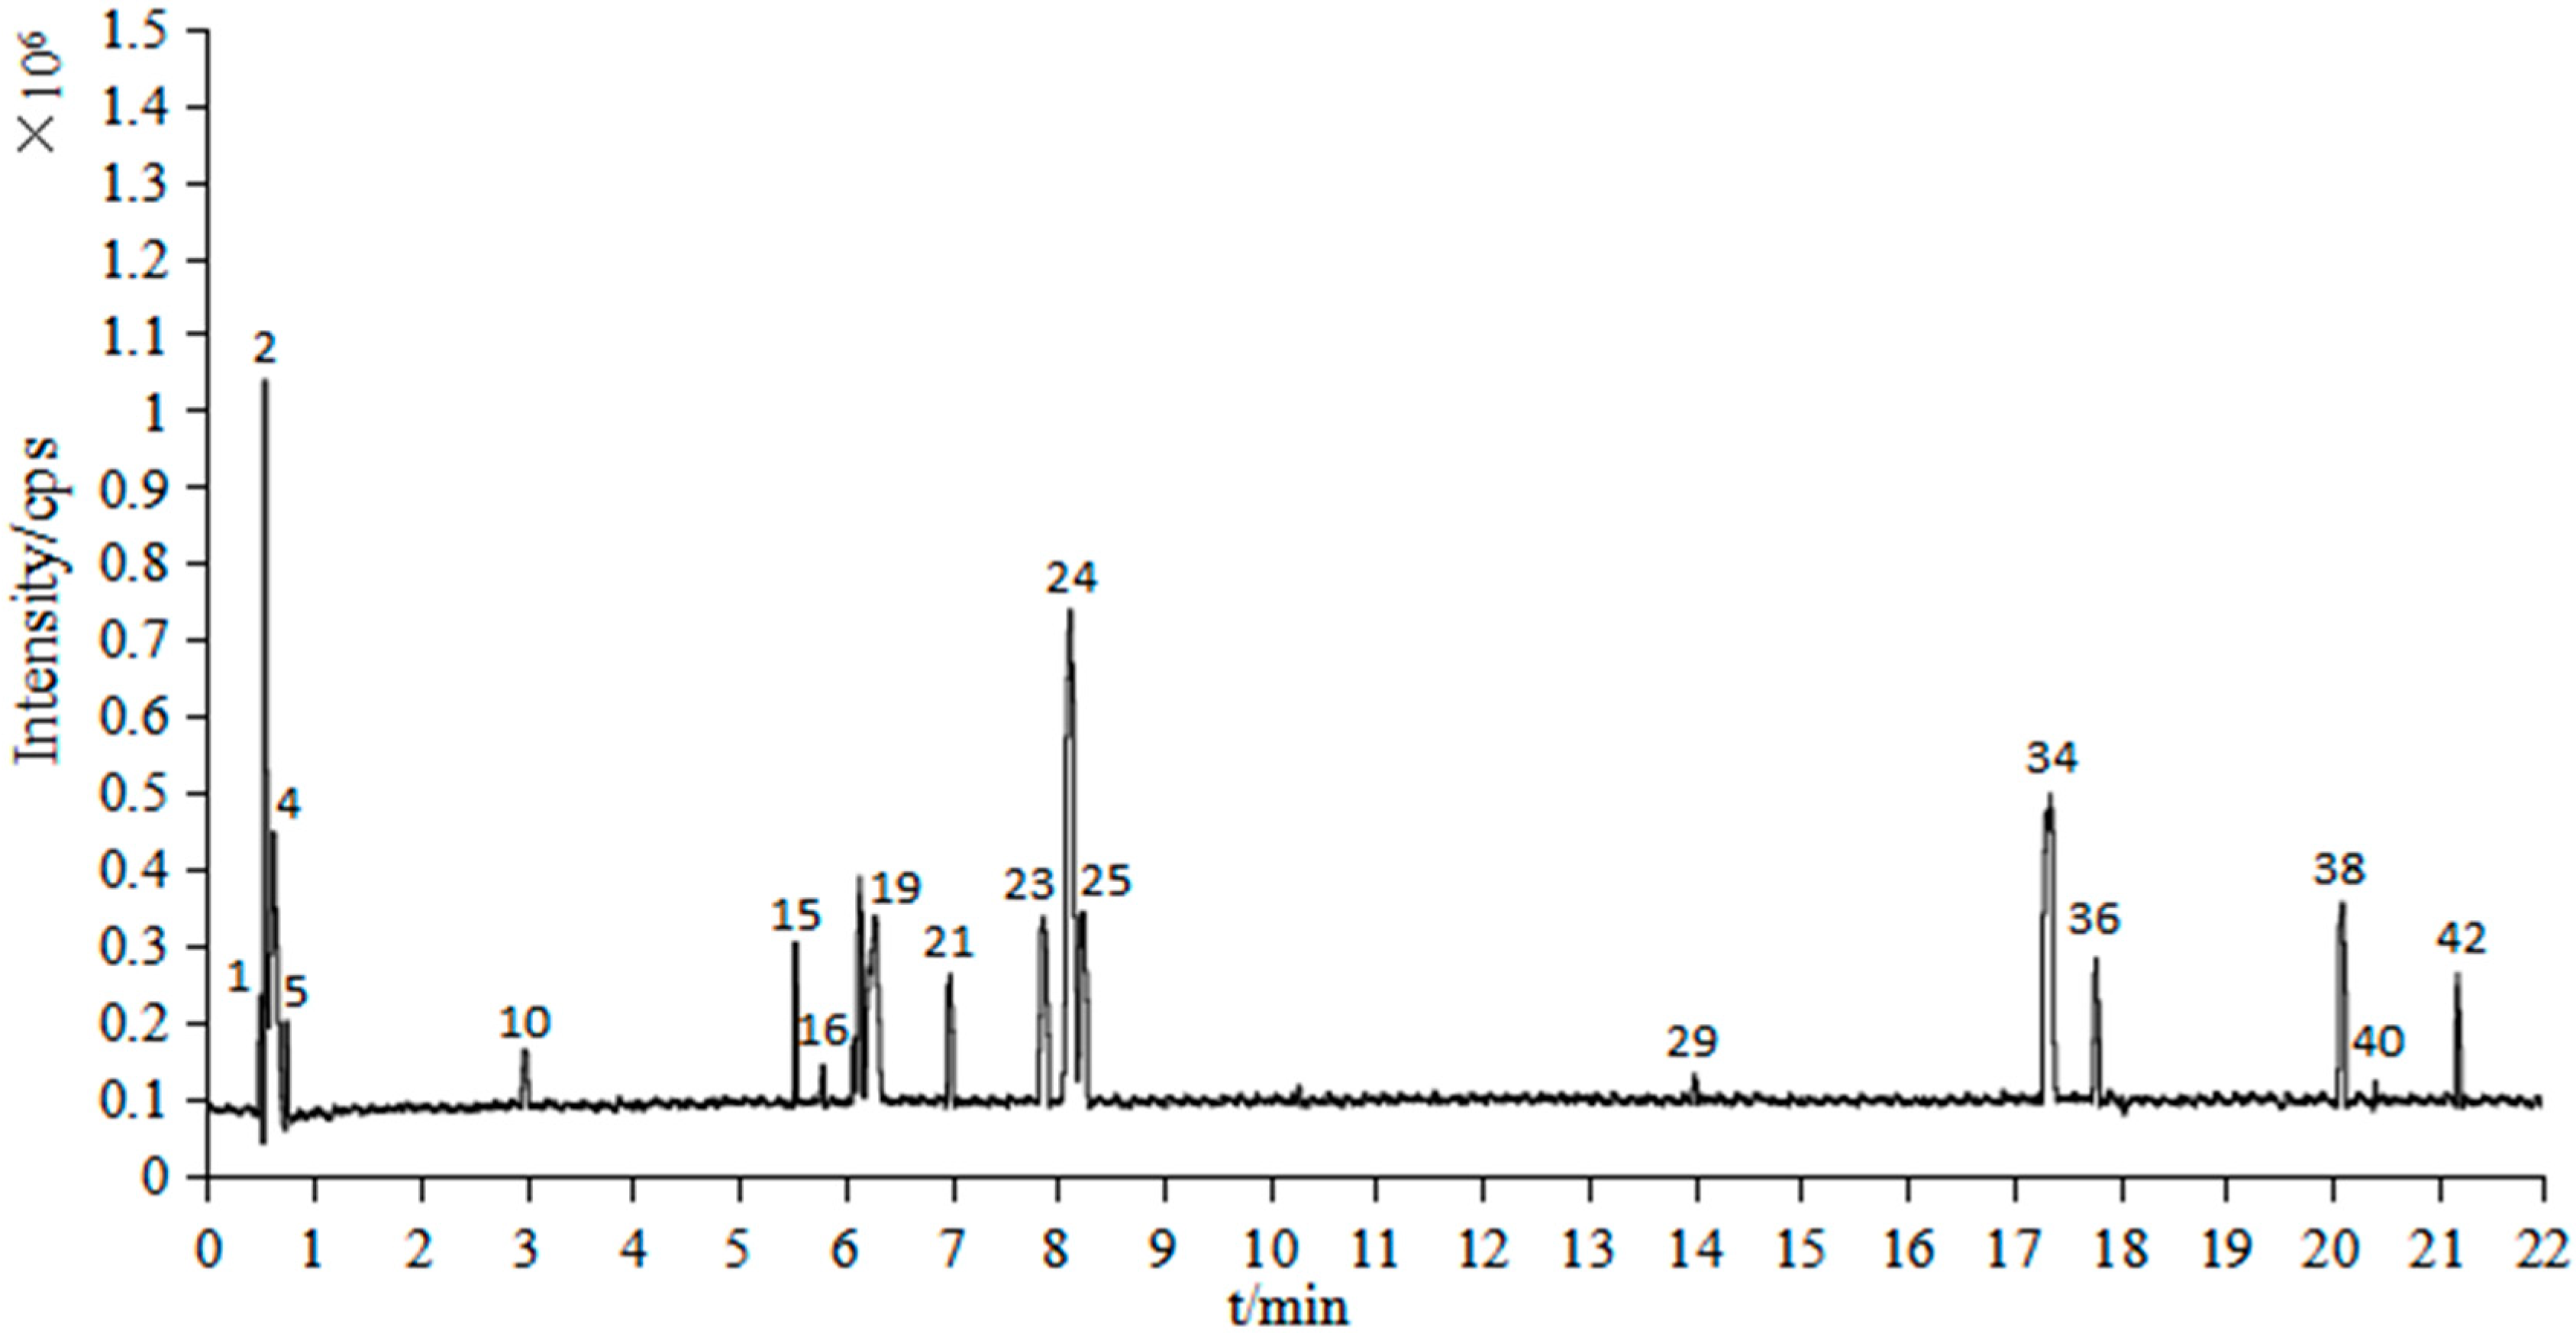
2.2. UPLC/Q-TOF-MS Analysis

In the 60% ethanol extract of S. vaninii, 43 compounds were obtained, including 35 compounds tentatively identified by comparison of absorption spectra with the online database ChemSpider, and reported values in the literature together with the remaining 8 were not identified by either absorption or mass spectra [20,21,22,23,24,25,26,27,28,29,30,31,32,33,34,35,36,37,38,39] (Table 1). The results showed that phenolics were the essential component of SVE60, including phenolic acids, flavonoids and phenylpropanoids (Figure 1 and Figure 2).

2.3. The Result of CCK8 Cell Proliferation

Cancer cells are unmanageable, chronic and have obvious characteristics, including a high proliferation ability and an ability to rapidly migrate [40,41]. To demonstrate whether the extracts of S. vaninii have an inhibitory effect on SW480 human colon cell proliferation in a dose-dependent manner, the experiments involved three groups. The SVW group (the control group, group 1), SVE60 (group 2) and SVE95 (group 3) were each treated with the same dosages (0, 1.2, 3.7, 11.1, 33.3, 100 and 300 μg/mL) and effective times (72 h).
Compared with that of the control group, the OD values of the three extracts gradually decreased with increasing dose levels after administration for 72 h. There were significant differences in the SVW group (300, 100, 33.3 μg/mL dose groups) (Figure 3a), SVE60 group (300, 100, 33.3, 11.1 and 3.7 μg/mL dose groups) (Figure 3b) and SVE95 group (300, 100 and 33.3 μg/mL dose groups) (Figure 3c). The three extracts could significantly reduce the cell survival rate with increased dosage, especially the 300, 100 and 33.3 μg/mL dose groups (p < 0.01).
Compared with the SVW and SVE95, SVE60 showed an inhibitory effect on the proliferation of colon cancer cells SW480 at a lower concentration (3.7 μg/mL), with a significant difference (p < 0.05). The IC50 values of SVW, SVE60 and SVE95 were 209.5, 7.91 and 27.14 μg/mL. The effect of two ethanol extracts was more obvious than that of the water extract, particularly the 60% ethanol extract of S. vaninii, whose IC50 was only one third of 95% ethanol extract and one twenty-sixth of water extract, approximately.

2.4. Induction of Apoptosis by the Ethanol Extracts of S. vaninii

Apoptosis is the key process in inhibiting the proliferation of cancer cells [42]. Annexin-V can specially bind with the early stage of apoptosis and provide FITC labels [43]. Propidine iodide (PI) is a nucleic acid dye that can penetrate the cell membrane in the middle and advanced stages of apoptosis to incarnadine nuclei. Therefore, Annexin-V and PI are used simultaneously in experiments to identify and differentiate early, middle and advanced apoptosis and necrotic cells [44]. This procedure was adopted in our research, and flow cytometry was applied to detect the apoptosis rates.
There were two groups in the experiment, the SVE60 (Figure 4a–d) and SVE95 group (Figure 4e–h), which were divided into four dose groups (the control group, 3, 30 and 300 μg/mL dose groups). Then, the cells were stained with Annexin V and PI.
Compared with the control group, the numbers of late apoptotic cells and early apoptotic cells were greater with multiplied dosages (10 times) of SVE60 and SVE95 (Figure 3). The results showed that the ethanol extracts of S. vaninii induced the SW480 apoptosis in a certain dose-dependent manner, and the effect of SVE60 was slightly superior to that of SVE95 (Table 2).

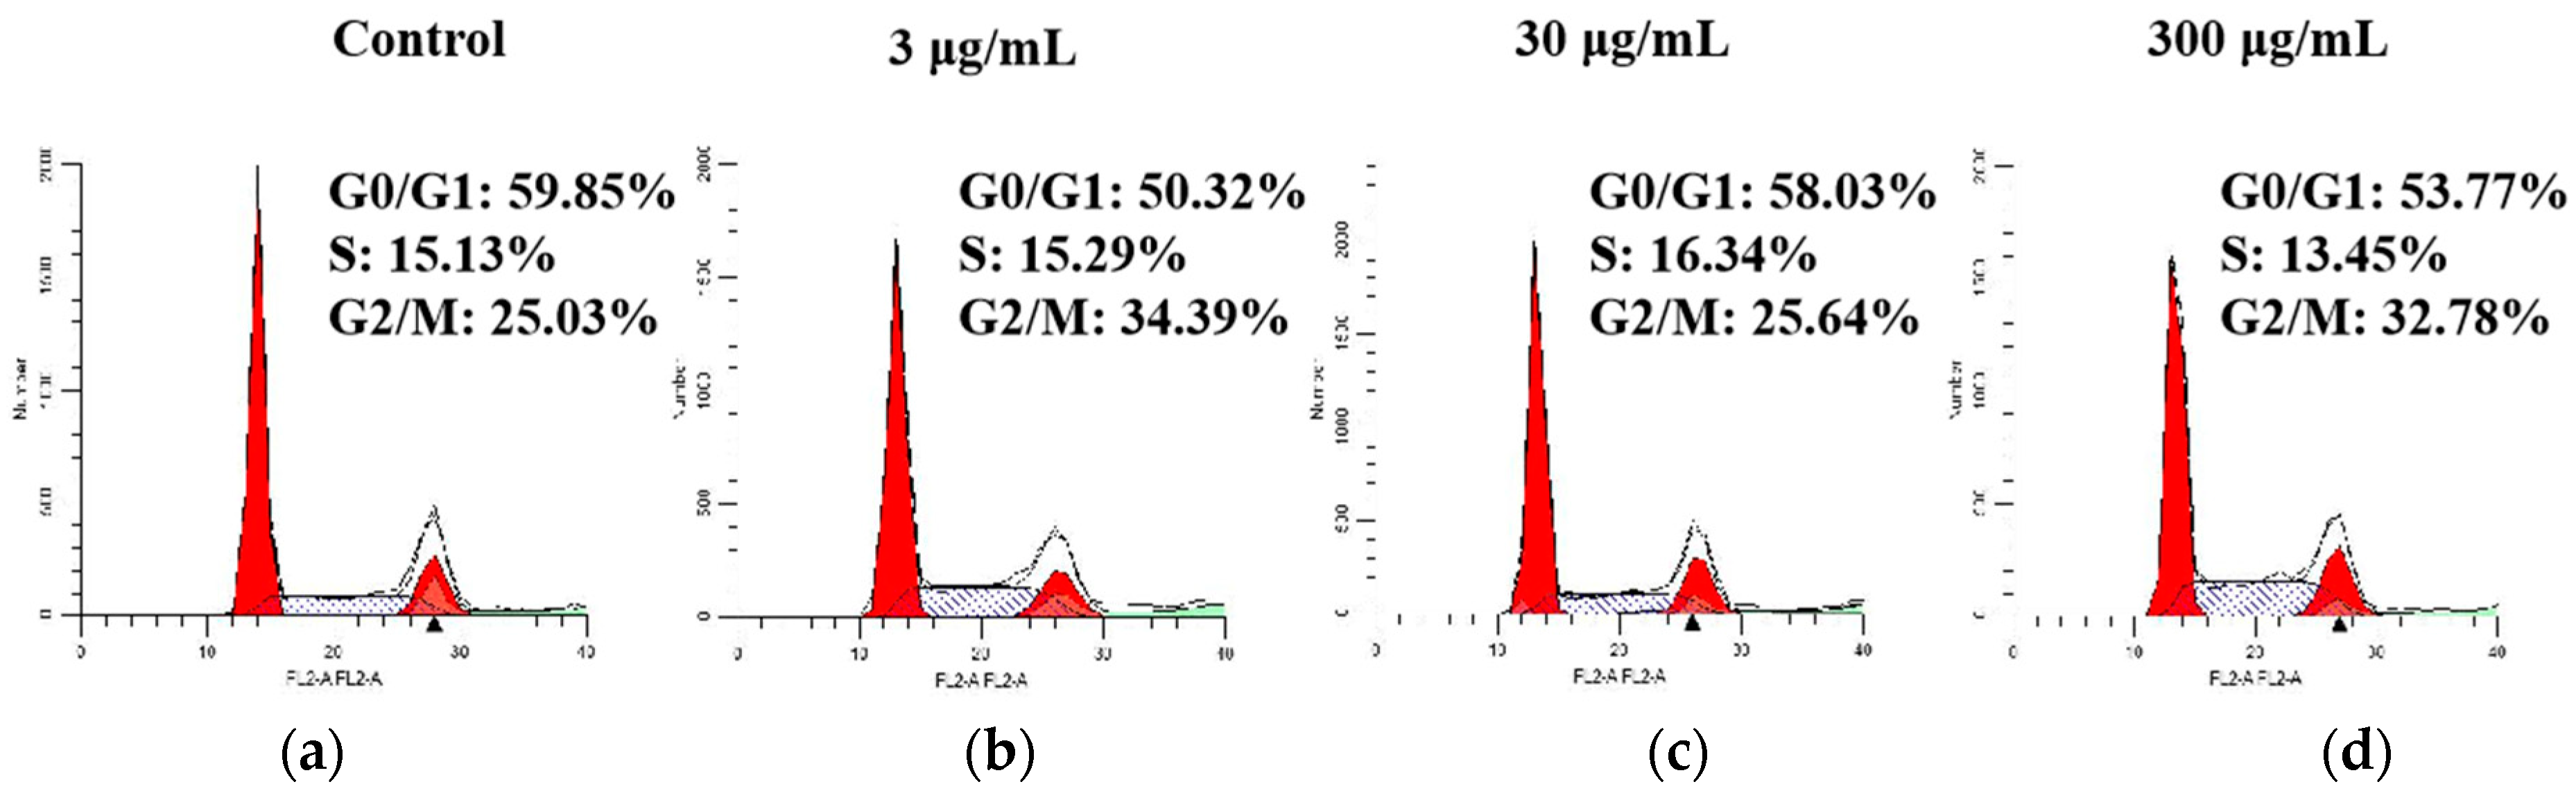
2.5. Effect of SVE60 on Cell Cycle Progression

The cell cycle is an important factor in cell proliferation, and its process begins with one cell division and ends when the next cell division is finished [45]. The cell cycle process was analysed via flow cytometry, and the study used SVE60 as the drug. The control group, and 3, 30 and 300 μg/mL dose groups were used. Compared with that of the control group, the proportion of cells in the G0/G1 phase was decreased by 6.08%, 1.82% and 9.53% at 3, 30 and 300 μg/mL, and those in G2/M phase increased by 7.75%, 0.61% and 9.36%, respectively. The proportion of cells in S phase was increased by 1.21% and 0.16% at 30 and 300 μg/mL, respectively, but decreased by 1.68% at 3 μg/mL.
The proportion of cells in the S or G2/M phase was influenced by different drug concentrations. The 3 μg/mL dose decreased the proportion of cells in the S phase and increased the proportion of cells in the G2/M phase. The 30 μg/mL dose group induced apoptosis of cells derived from the G0/G1 phase. The results (Figure 5) showed that SVE60 was able to inhibit cancer cell proliferation by causing cell arrest in different phases.

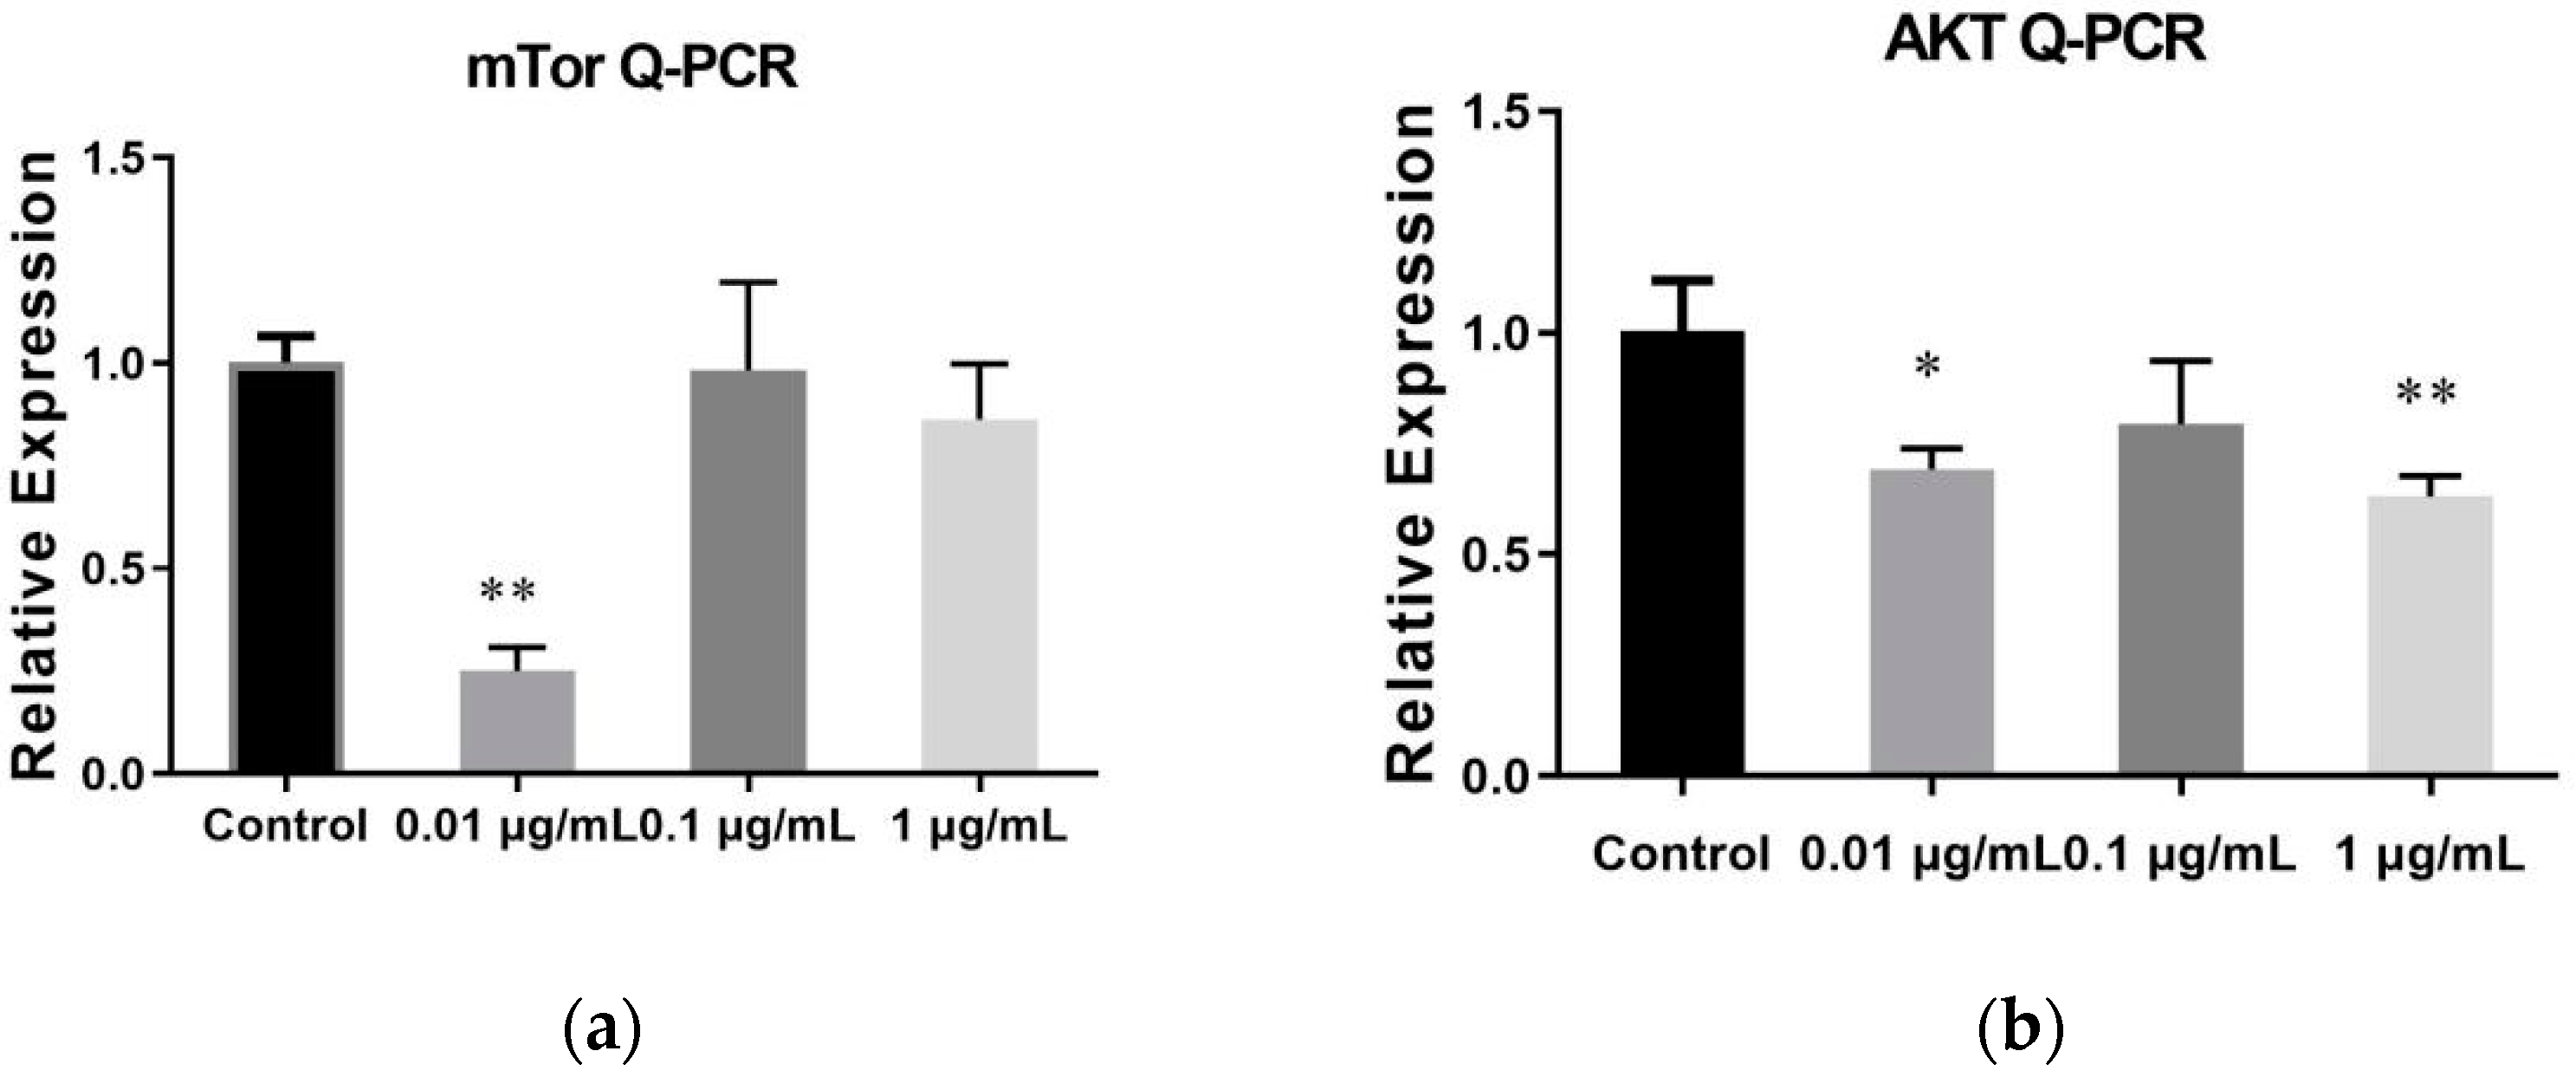
2.6. The Result of qRT-PCR

The study observed the influence of SVE on the mTOR and AKT gene expression in the mTOR signalling pathway (Figure 6). There were significant differences between the SVE60 0.01 μg/mL dose group, which had an obvious inhibitory effect on mTOR gene expression, and the control group. Three dose groups showed a decreasing trend in AKT gene expression. The data demonstrated that SVE60 had a significant inhibitory effect on the expression of key genes in the mTOR signalling pathway.

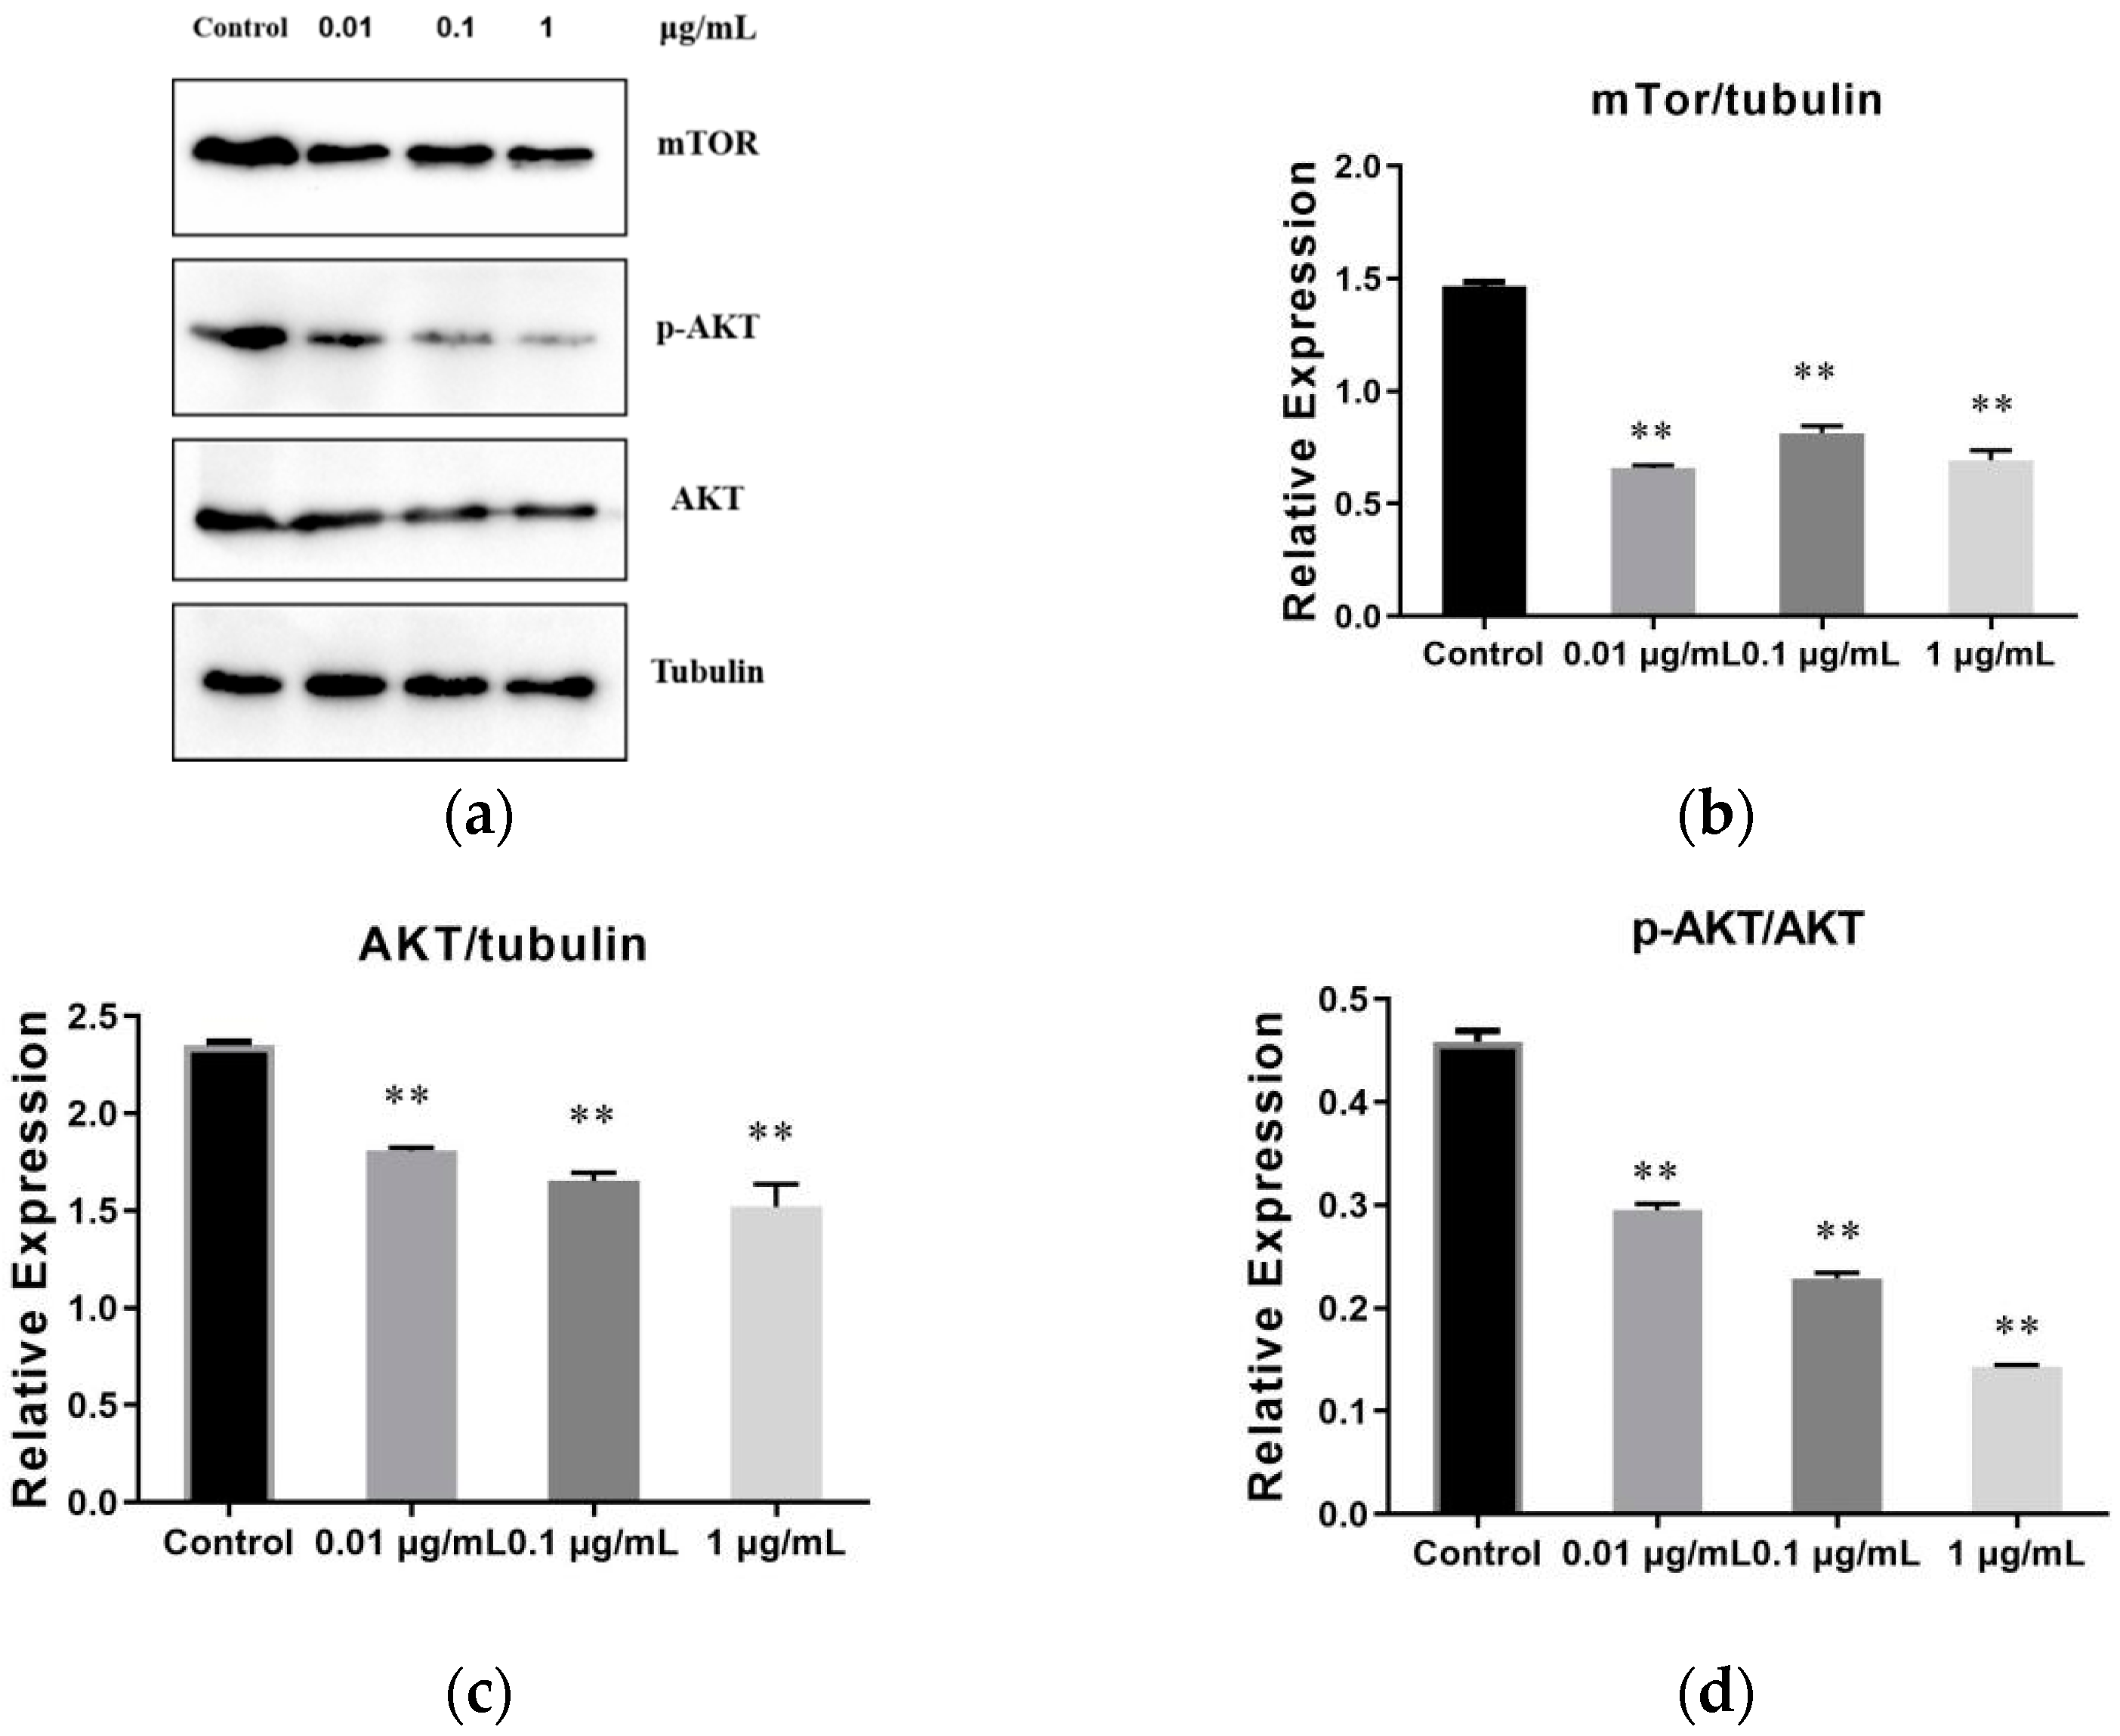
2.7. The Result of SVE60 on the Protein Expression via mTOR Signalling Pathway

Tubulin was used as an internal reference protein to observe the influence of SVE60 on the mTOR, AKT and p-AKT proteins in the mTOR signalling pathway (Figure 7). The results showed that the three dose groups significantly decreased the expression of mTOR, AKT and p-AKT proteins. SVE60 exhibited an obvious dose-dependent relationship with the expression of AKT and p-AKT proteins. This result indicated that the inhibitory effect of SVE60 on the proliferation of SW480 cells was related to the activation of mTOR signalling.

3. Materials and Methods

3.1. Materials

The samples used in this research were collected from Jilin Province and identified as Sanghuangporus vaninii (Liub.) L.W. Zhou & Y.C. Dai by Professor Dai Yucheng from Beijing Forestry University. The human colon cancer cell line SW480 was purchased from Sai Bai Kang (Shanghai, China). Primary antibodies including p-AKT (ab38449, 1 mg/mL), AKT (ab179643, 1 mg/mL) and mTOR (ab2732, 1 mg/mL) were purchased from Abcam (Cambridge, Britain). Foetal bovine serum (16000-044) was obtained from Gibco (Grand Island, NY, USA). RIPA Protein Lysis Buffer was purchased from Xin Sheng Yuan (Beijing, China). The BCA ELISA Kit (CW0014S) was purchased from Kang Wei Shi Ji (Shenzhen, China). A dual-beam UV–Vis spectrophotometer (CW0014S) was purchased from Agilent Technologies (Santa Clara, CA, USA). The flow cytometer (C6) was purchased from BD (East Rutherford, NJ, USA). The ELISA (Spectra Max M5) was purchased from Molecular Devices, (San Jose, CA, USA). The cell incubator (311) was purchased from Thermo (Waltham, MA, USA).

3.2. Preparation of the Phellinus Linteus Extracts

The powder (20 g, approximately) of S. vaninii was extracted with 400 mL of pure water for 1 h in a water bath. The extract was centrifuged at 5000 r/min for 5 min. The supernatant was concentrated under vacuum and then lyophilized using a vacuum freeze dryer. The water extract of S. vaninii (SVW) was stored for further use. The 60% and 95% ethanolic extracts (SVE60 and SVE95) were prepared with the same method as SVW, and the supernatants were evaporated in vacuum until dry.

3.3. Total Polysaccharide Content

The polysaccharide content was analysed by the glucose calibration, which was determined using the anthrone-sulfuric acid method [46]. SVW, SVE60 and SVE95 were diluted with distilled water (w/v, 1:5), and 1.0 mL of aqueous solution was used for measurement. The solution was added to 2.0 mL with distilled water, and 6.0 mL of 0.2% anthrone-sulfuric acid was added slowly and heated at 100 °C for 15 min, and absorbance measurements were recorded at 625 nm.

3.4. Total Flavonoids Content

The total flavonoid content was measured by sodium nitrite–aluminium nitrate colorimetry through UV spectroscopy using rutin as a reference substance at a concentration of 0.20 mg/mL [47]. The control solutions 1.0, 2.0, 3.0, 4.0, 5.0 and 6.0 mL were added, and distilled water was added to 6.0 mL. Then, 1.0 mL of 5% sodium nitrite was added to the solutions and incubated for 6 min separately. Next, 1.0 mL of 10% aluminium nitrate was added and reacted for 6 min. Finally, 10.0 mL of NaOH was added, distilled water was added to increase the liquid level, and the solution was shaken and developed for 15 min. The test solution and water were the blank controls, and a 500 nm wavelength was used. To formulate the standard curve, the concentration of rutin (C) was used as the X-axis and the Y-axis was the absorbance (A). The extracts were dissolved in methanol (w/v, 1:1), and the filtrates were measured in the same way.

3.5. UPLC-Q-TOF-MS Analytical Conditions

The UPLC-QTOF-MS/MS analysis was performed on a Waters Acquity UPLC/Xevo G2-S Q/TOF system (Waters Corporation, Milford, MA, USA) coupled with an electrospray ionization (ESI) source operating in both the positive and negative ionization modes. Chromatographic separation was performed on an Acquity UPLC BEH C18 column (2.1 × 100 mm, 1.7 μm) at 35 °C and 280 nm, and the flow rate was 0.4 mL/min. The mobile phases were a 0.1% formic acid aqueous solution (A) and acetonitrile (B) with a gradient elution program of 10–15% B at 0–2 min, 15–23% B at 2–4 min, 23% B at 4–8 min, 23–30% B at 8–11 min, 30% B at 11–14 min, 30–40% B at 14–20 min, 40–100% B at 20–23 min, 100–100% B at 23–25 min and 10% B at 25.01–28 min. The MS conditions were set as follows: a total ion scanning range of m/z 100–1200, nebulizer nitrogen gas flow rate 500 L/h, capillary voltage of 1.8 KV, cone voltage of 40 V, ionization temperature of 120 °C and desolvation temperature of 500 °C. The samples were collected by the MSE Centroid model, and the time taken was 25 min with a scan range of m/z 100–1500 Da and an interval time of 0.1 s. The ramp trap collision energy was set at 25–45 eV for the high-energy function and 6 eV for the low-energy function. Leucine-enkephalin was used as an external reference and was infused at a constant flow of 10 mL/min. All MS data were acquired by MassLynx 4.1 software. The SVE60 was dissolved in 1 mL of methanol with ultrasonication (53 kHz) for 30 min and then filtered through a 0.22 μm membrane filter for UPLC-MS analysis.

3.6. Cell Culture

The human colon cancer cell line SW480 was cultured in 1640 culture fluid with 10% foetal bovine serum. The cells displayed monolayer growth in a 37 °C atmosphere of 95% relative humidity and 5% CO2. Cells at logarithmic growth phase were used in the experiment.

3.7. CCK-8 Assay

The human colon cancer cell line SW480 was inoculated in 96-well culture plates at a density of 1 × 10⁵ per mL per well. The clear supernatant of SW480 cells that would be used for detection was poured out, and the cells were washed twice with PBS. A total of 100 μL of fresh L-15 complete medium and 10 μL of CCK-8 reagent was used per well. Then, the plates were placed in an incubator for 3 h, and the optical density (OD) was detected at 450 nm using a microplate reader.

3.8. Flow Cytometry Cell Apoptosis Analysis

The cells were pre-treated before the formal experiment. The colon cell SW480 was digested with trypsin. The adherent cells were washed with PBS three times and collected into centrifuge tubes. The supernatant was discarded after centrifugation at 2600 r/min for 5 min. The binding buffer was diluted 10 times with deionized water. The single-cell suspension was prepared by mixing the primed cells with 250 μL of diluted binding buffer. Then, the 50 μL single-cell suspension was removed from the 1.5 mL centrifuge tube, and the cells were stained with 2.5 μL of Annexin V-FITC and 5 μL of propidium iodide (PI) for 15 min at ambient temperature. Apoptosis was detected through flow cytometric analysis.

3.9. Cell Cycle Analysis

The colon cell line SW480 was prepared as a single-cell suspension through the same method as described in 2.8. The pre-treated cells were put into a tube, strained with 1 mL of DNA staining solution and 10 μL of permeabilization solution, and were mixed by vortex oscillation for 5–10 s. Then, the cells were incubated for 30 min at room temperature and were subjected to flow cytometry.

3.10. Quantitative RT-PCR

Total RNA was extracted from the cells with TRIzon reagent. The effect on the pathway mediated by mTOR and AKT was determined using the qRT-PCR method using a variety of extracts doses, such as blank, 0.01 μg/mL, 0.1 μg/mL and 1 μg/mL. A quantitative PCR instrument (Bio-Rad CFX96, Hercules, CA, USA) was used for the PCR, and the following primer sequences were used for the qRT-PCR (Table 3).

3.11. Western Blot

The expression of mTOR, p-AKT and AKT protein was detected after the extracts reacted with SW480 cells for 48 h and the antibodies, including mTOR, p-AKT and AKT, were diluted at a ratio of 1:1000. SW480 cells were washed with PBS three times, RIPA protein lysis buffer was added, the mixture rested for 30 min, and the cells were centrifuged at 12,000 rpm at 4 °C.
The supernatant liquid was obtained and the concentration of protein in the samples was detected using BCA test kits. Total protein was obtained and rinsed with TBST after sample filling, electrophoresis, transmembrane and closure was performed. Extracts with different concentrations, such as 0, 0.01, 0.1 and 1 μg/mL, were added, and then the mixture was stored overnight at 4 °C. Then, the mixture was rinsed with TBST again. After exposure and imaging, tubulin was used as a reference protein (at 1:1000 dilution) and Image Quant TL software was used to analyse the grey value of every belts.

3.12. Statistical Analysis

All quantitative data are presented as the means ± standard deviation (SD). The data were analysed by t-tests using GraphPad Prism 9.0 software. Differences were considered statistically significant when p < 0.05.

4. Conclusions and Discussion

Sanghuang has long been known to possess anti-cancer abilities. S. vaninii is its most widespread cultivar and provides rich resources for the application of this plant. To explore the medical usage of this drug, the relationship between the active compounds and anti-colon cancer was studied in this experiment.
Phenolic compounds and polysaccharides are the two main bioactive chemical groups with medicinal properties of Sanghuang [48]. In the study of Yang, the proximate compositions and microelements of Sanghuang were determined, including the contents of total phenolics, flavonoids and polysaccharides, SOD-like and nutrient compositions of water extracts. The content of total polysaccharides was obviously higher than flavonoids [49]. SVW, SVE60 and SVE95 were three extracts of S. vaninii which were separately extracted by water, 60% ethanol and 95% ethanol in this experiment. The SVW had the richest content in polysaccharides and lowest content in flavonoid compounds in those extracts. SVW60 had the highest flavonoid content, and its polysaccharide content was greater than that in SVE95. Therefore, the composition of SVE60 was analysed via UPLC-MS. The results suggested that the essential components were phenolics, and the majority were phenolic acids, flavonoids and phenylpropanoids. Many phenolic compounds have been shown to inhibit proliferation and angiogenesis of tumour cells in vitro [50].
The 95% ethanolic extract from the fruiting body of Sanghuang inhibited the proliferation of both cell lines in a dose-dependent manner, and the IC50 values at 48 h were 72 and 103 g/mL for SK-Hep-1 cells and RHE cells [51]. According to the CCK-8 cell proliferation results, the three extracts significantly reduced the cell survival rate with a good dose–effect relationship, and the effect of the two ethanol extracts was better than the water extract, especially SVE60, which had a much higher IC50 than SVW and SVW95. It is well known that apoptosis is an evolutionarily suicide program regulated by many genes that activates the cell death process, resulting in the removal of damaged tissue [52]. Furthermore, the two ethanol extracts induced SW480 apoptosis, particularly SVE60. SVE60 also had the ability to inhibit cancer cell proliferation by causing cell arrest in different phases.
Actually, while obvious inhibitory trends for cancer cells were observed in all dosages, there was very little apoptosis at high concentrations in this experiment, survival rates were low in all concentrations, and similar results were also found in cell cycle. They were probably caused by apoptosis or the death of cancer cells, due to the short detection time in these tests. SVE60 could significantly decrease the expression of mTOR, AKT and p-AKT proteins, which was related to the proliferation of SW480 cells and the activation of mTOR signalling. This study analysed the extract components of S. vaninii and explored its anti-colon cancer mechanism. These results showed that SVE60 had good potential for usage as an adjuvant chemotherapeutic and anti-colon cancer drug, in postoperative nutrition and in the prevention of recurrence.
The study demonstrated SVE60 had an obvious effect on anti-colon cancer. In a further study, we plan to prolong the determining time in apoptosis and cell cycle experiments so a clearer trend can be observed. Furthermore, we need to isolate and purify components from the 60% ethanol extract and observe the inhibition effect of the extract on human colon cancer in vivo via an orthotopic model of colon cancer in nude mice.

Author Contributions

Data Curation and Analysis: W.D., Y.W. and C.Y. Methodology: S.G., Z.Z. and R.L. Resources and Software: L.C., X.G. and Q.X. Roles/Writing—Original Draft: W.D., S.G., C.Y. Writing—Review and Editing: R.L., S.G. and Z.Z. All authors have read and agreed to the published version of the manuscript.

Funding

This research was funded by the Scientific and Technological Innovation Project of the China Academy of Chinese Medical Sciences (No. CI 2021A03707).

Institutional Review Board Statement

Not applicable.

Informed Consent Statement

Not applicable.

Data Availability Statement

The study did not report any data.

Acknowledgments

Thanks Yucheng Dai and Xuefeng Feng for their identification works in this research. And thanks Guicheng Yang for the sample collection of Sanghuangporus vaninii used in this research from Jilin Province.

Conflicts of Interest

The authors declare no conflict of interest.

References

  1. Bray, F.; Ferlay, J.; Soerjomataram, I.; Siegel, R.L.; Torre, L.A.; Jemal, A. Global cancer statistics 2018: GLOBOCAN estimates of incidence and mortality worldwide for 36 cancers in 185 countries. CA Cancer J. Clin. 2018, 68, 394–424. [Google Scholar] [CrossRef] [Green Version]
  2. De Rosa, M.; Pace, U.; Rega, D.; Costabile, V.; Duraturo, F.; Izzo, P.; Delrio, P. Genetics, diagnosis and management of colorectal cancer (Review). Oncol. Rep. 2015, 34, 1087–1096. [Google Scholar] [CrossRef] [PubMed] [Green Version]
  3. Han, Y.S.; Lee, J.H.; Lee, S.H. Fucoidan inhibits the migration and proliferation of HT-29 human colon cancer cells via the phosphoinositide-3 kinase/Akt/mechanistic target of rapamycin pathways. Mol. Med. Rep. 2015, 12, 3446–3452. [Google Scholar] [CrossRef] [PubMed] [Green Version]
  4. P´opulo, H.; Lopes, J.M.; Soares, P. The mTOR signalling pathway in human cancer. Int. J. Mol. Sci. 2012, 13, 1886–1918. [Google Scholar] [CrossRef]
  5. Moench, R.; Grimmig, T.; Kannen, V.; Tripathi, S.; Faber, M.N.; Moll, E.-M.; Chandraker, A.; Lissner, R.; Germer, C.-T.; Waaga-Gasser, A.M.; et al. Exclusive inhibition of PI3K/Akt/mTOR signaling is not sufficient to prevent PDGF-mediated effects on glycolysis and proliferation in colorectal cancer. Oncotarget 2016, 7, 68749–68767. [Google Scholar] [CrossRef] [PubMed] [Green Version]
  6. Demir, S.; Turan, I.; Aliyazicioglu, Y.; Kilinc, K.; Yaman, S.O.; Demir, E.A.; Arslan, A.; Mentese, A.; Deger, O. Morus RubraExtract Induces Cell Cycle Arrest and Apoptosis in Human Colon Cancer Cells through Endoplasmic Reticulum Stress and Telomerase. Nutr. Cancer 2017, 69, 74–83. [Google Scholar] [CrossRef]
  7. Chen, W.; Tan, H.; Liu, Q.; Zheng, X.; Zhang, H.; Liu, Y.; Xu, L. A Review: The Bioactivities and Pharmacological Applications of Phellinus linteus. Molecules 2019, 24, 1888. [Google Scholar] [CrossRef] [Green Version]
  8. Chen, H.; Tian, T.; Miao, H.; Zhao, Y.-Y. Traditional uses, fermentation, phytochemistry and pharmacology of Phellinus linteus: A review. Fitoterapia 2016, 113, 6–26. [Google Scholar] [CrossRef]
  9. Ikekawa, T.; Nakanishi, M.; Uehara, N.; Chihara, G.; Fukuoka, F. Antitum or action of some basidiomycetes, especially Phellinus linteus. GANN Jpn. J. Cancer Res. 1968, 59, 155–157. [Google Scholar] [CrossRef]
  10. Sun, J.; Zhang, G.; Yu, M.; Wang, X. Progress in the study of composition and mechanism of antitumor effect of Phellinus igniarius. China Med. Her. 2016, 13, 39–42. [Google Scholar]
  11. Yoshioka, Y.; Emori, M.; Ikekawa, T.; Fukuoka, F. Isolation, purification, and structure of components from acidic polysaccharides of pleurotus ostreatus (Fr.) Quél. Carbohydr. Res. 1975, 43, 305–320. [Google Scholar] [CrossRef]
  12. Nakamura, T.; Fukuda, M.; Matsugo, S.; Uzuka, Y. Analysis of mitochondrial DNA restriction fragment length polymorphisms for examining genetic variability among isolates of Phellinus linteus. Mycoscience 2002, 43, 443–445. [Google Scholar] [CrossRef]
  13. Meng, X.; Liang, H.; Luo, L. Antitumor polysaccharides from mushrooms: A review on the structural characteristics, antitumor mechanisms and immunomodulating activities. Carbohydr. Res. 2016, 424, 30–41. [Google Scholar] [CrossRef]
  14. Li, G.; Kim, D.-H.; Kim, T.-D.; Park, B.-J.; Park, H.-D.; Park, J.-I.; Na, M.-K.; Kim, H.-C.; Hong, N.-D.; Lim, K.; et al. Protein-bound polysaccharide from Phellinus linteus induces G2/M phase arrest and apoptosis in SW480 human colon cancer cells. Cancer Lett. 2004, 216, 175–181. [Google Scholar] [CrossRef]
  15. Gao, W.; Zhang, N.; Yu, S. Research progress on antitumor effects and mechanisms of Phellinus. China J. Chin. Mater. Medica 2014, 39, 4165–4168. [Google Scholar]
  16. Zhang, C. Hypothesis proved…citric acid (citrate) does improve cancer: A case of a patient suffering from medullary thyroid cancer. Med. Hypotheses 2009, 73, 268–272. [Google Scholar]
  17. Tanaka, T.; Tanaka, T.; Tanaka, M. Potential Cancer Chemopreventive Activity of Protocatechuic Acid. J. Exp. Clin. Med. 2011, 3, 27–33. [Google Scholar] [CrossRef]
  18. Guo, D.; Dou, D.; Ge, L.; Huang, Z.; Wang, L.; Gu, N. A caffeic acid mediated facile synthesis of silver nanoparticles with powerful anti-cancer activity. Colloids Surf. B Biointerfaces 2015, 134, 229–234. [Google Scholar] [CrossRef] [PubMed]
  19. Guo, Q.; Zhao, L.; Zhu, Y.; Wu, J.; Hao, C.; Song, S.; Shi, W. Optimization of culture medium for Sanghuangporus vaninii and a study on its therapeutic effects on gout. Biomed. Pharmacother. 2021, 135, 111194. [Google Scholar] [CrossRef]
  20. Liu, H.-K.; Tsai, T.-H.; Chang, T.-T.; Chou, C.-J.; Lin, L.-C. Lanostane-triterpenoids from the fungus Phellinus gilvus. Phytochemistry 2009, 70, 558–563. [Google Scholar] [CrossRef]
  21. Wang, G.J.; Tsai, T.-H.; Chang, T.-T.; Chou, C.-J.; Lin, L.-C. Lanostanes from Phellinus igniarius and Their iNOS Inhibitory Activities. Planta Med. 2009, 75, 1602–1607. [Google Scholar] [CrossRef] [PubMed]
  22. Nagatsu, A.; Itoh, S.; Tanaka, R.; Kato, S.; Haruna, M.; Kishimoto, K.; Hirayama, H.; Goda, Y.; Mizukami, H.; Ogihara, Y. Identification of novel substituted fused aromatic compounds, meshimakobnol A and B, from natural Phellinus linteus fruit body. Tetrahedron Lett. 2004, 30, 5931–5933. [Google Scholar] [CrossRef]
  23. Wang, Y.; Wang, S.-J.; Mo, S.-Y.; Li, S.; Yang, Y.C.; Shi, J.-G. Phelligridimer A, a Highly Oxygenated and Unsaturated 26-Membered Macrocyclic Metabolite with Antioxidant Activity from the Fungus Phellinus igniarius. Org. Lett. 2005, 21, 4733–4736. [Google Scholar] [CrossRef] [PubMed]
  24. Huang, S.-C.; Kuo, P.-C.; Hwang, T.-L.; Chan, Y.-Y.; Chen, C.-H.; Wu, T.-S. Three novel sesquiterpenes from the mycelium of Phellinus linteus. Tetrahedron Lett. 2013, 54, 3332–3335. [Google Scholar] [CrossRef]
  25. Min, B.-S.; Yun, B.-S.; Lee, H.-K.; Jung, H.-J.; Jung, H.-A.; Choi, J.-S. Two novel furan derivatives from Phellinus linteus with anti-complement activity. Bioorg. Med. Chem. Lett. 2006, 16, 3255–3257. [Google Scholar] [CrossRef] [PubMed]
  26. Wu, P.-F.; Ding, R.; Tan, R.; Liu, J.; Hu, E.-M.; Li, C.-Y.; Liang, G.-Y.; Yi, P. Sesquiterpenes from cultures of the fungus Phellinus igniarius and their Cytotoxicities. Fitoterapia 2020, 140, 104415. [Google Scholar] [CrossRef] [PubMed]
  27. Norkowska, M.; Myszka, H.; Cyman, M.; Grzywacz, D.; Trzybiński, D.; Sikorski, A.; Liberek, B. 2,3,4,6-tetra-O-Acetyl-D-Gluconic Acid: Crystal Structure and Application in the Synthesis of N-(D-gluconyl) Derivatives of D-Glucosamine. J. Carbohydr. Chem. 2014, 33, 33–47. [Google Scholar] [CrossRef]
  28. Lv, G.; Song, T.; Cai, W.; Zhang, Z. Comparative study of chemical components and antioxidant activities of wild Sanghuangporus sanghuang and Sanghuangporus vaninii. Mycosystema 2021, 40, 1–11. [Google Scholar]
  29. Zhao, T.; Wang, Z.; Zhang, N.; Su, X.; Liu, J.; Li, P.; Wang, C. Rapid Identification on Chemical Constituents of Phellinus igniarius by UPLC-Q-TOF-MSE Combined with UNIFI Platform. Spec. Wild Econ. Anim. Plant Res. 2018, 1, 20–25. [Google Scholar]
  30. Zhu, L.; Cui, B. Progress on the Studies of Medicinal Mushrooms“Sanghuang”Group. J. Fungal Res. 2016, 14, 201–209. [Google Scholar]
  31. Zan, L.; Bao, H.; Li, D. Review on Polyphenol Components from Medicinal Fungi Sanghuang and Their Biological Activity. Nat. Prod. Res. Dev. 2016, 28, 147–155. [Google Scholar]
  32. Kitagawa, I.; Baek, N.I.; Kawashima, K.; Yokokawa, Y.; Yoshikawa, M.; Ohashi, K.; Shibuya, H. Indonesian Medicinal Plants, XV.1) Chemical Structures of Five New Resin-Glycosides, Merremosides a, b, c, d and e, from the Tuber of Merrremia mammosa (Convolvulaceae). Chem. Pharm. Bull. 1996, 44, 1680–1692. [Google Scholar] [CrossRef] [PubMed] [Green Version]
  33. Zhang, X.; Tu, F.-J.; Yu, H.-Y.; Wang, N.-L.; Wang, Z.; Yao, X.-S. Copacamphane, Picrotoxane and Cyclocopacamphane Sesquiterpenes from Dendrobium nobile. Chem. Pharm. Bull. 2008, 56, 854–857. [Google Scholar] [CrossRef] [PubMed] [Green Version]
  34. Ohyama, N.; Cai, W.-H.; Kawakami, S.; Sugimoto, S.; Matsunami, K.; Otsuka, H. Symplocosins C-P: Fourteen Triterpene Saponins from the Leaves of Symplocos cochinchinensis var. Philippinensis. Chem. Pharm. Bull. 2020, 68, 1090–1099. [Google Scholar] [CrossRef]
  35. Vassallo, A.; Pesca, M.; Ambrosio, L.; Malafronte, N.; Melle, N.D.; Piaz, F.D.; Severino, L. Antiproliferative Oleanane Saponins from Dizygotheca Elegantissima. Nat. Prod. Commun. 2012, 7, 1427–1430. [Google Scholar] [CrossRef] [Green Version]
  36. Matsui, Y.; Kobayashi, K.; Masuda, H.; Kigoshi, H.; Akao, M.; Sakurai, H.; Kumagai, H. Quantitative Analysis of Saponins in a Tea-Leaf Extract and Their Antihypercholesterolemic Activity. Biosci. Biotechnol. Biochem. 2009, 73, 1513–1519. [Google Scholar] [CrossRef] [PubMed] [Green Version]
  37. Avula, B.; Bae, J.; Wang, Y.; Wang, M.; Osman, A.G.; Smith, K.; Yuk, J.; Ali, Z.; Plumb, R.; Isaac, G.; et al. Chemical profiling and characterization of phenolic acids, flavonoids, terpene glycosides from Vangueria agrestis using ultra-high-performance liquid chromatography/ion mobility quadrupole time-of-flight mass spectrometry and metabolomics approach. Biomed. Chromatogr. 2020, 34, e4840. [Google Scholar] [CrossRef] [PubMed]
  38. Rauf, A.; Uddin, G.; Siddiqui, B.; Khan, A.; Farooq, U.; Khan, F.A.; Bukhari, S.M.; Khan, S.B. Bioassay-guided isolation of novel and selective urease inhibitors from Diospyros lotus. Chin. J. Nat. Med. 2017, 15, 865–870. [Google Scholar] [CrossRef]
  39. Sun, H.; Zhang, X.-T.; Wang, L.; Zhang, X.-Q.; Wang, Y.; Chen, S.-B.; Xiao, P.-G.; Ye, W.-C. Four New Cycloartane (=9,19-Cyclolanostane) Saponins from the Aerial Parts ofThalictrum fortunei. Helv. Chim. Acta 2008, 91, 1961–1966. [Google Scholar] [CrossRef]
  40. Hanahan, D.; Weinberg, R.A. Hallmarks of Cancer: The Next Generation. Cell 2011, 144, 646–674. [Google Scholar] [CrossRef] [Green Version]
  41. Pavlova, N.N.; Thompson, C.B. The Emerging Hallmarks of Cancer Metabolism. Cell Metab. 2016, 23, 27–47. [Google Scholar] [CrossRef] [PubMed] [Green Version]
  42. Bourhia, M.; Laasri, F.E.; Aourik, H.; Boukhris, A.; Ullah, R.; Bari, A.; Ali, S.S.; El Mzibri, M.; Benbacer, L.; Gmouh, S. Antioxidant and Antiproliferative Activities of Bioactive Compounds Contained in Rosmarinus officinalis Used in the Mediterranean Diet. Evid.-Based Complement. Altern. Med. 2019, 2019, 1–7. [Google Scholar] [CrossRef] [PubMed] [Green Version]
  43. Chaudhry, F.; Kawai, H.; Johnson, K.W.; Narula, N.; Shekhar, A.; Chaudhry, F.; Nakahara, T.; Tanimoto, T.; Kim, D.; Adapoe, M.K.; et al. Molecular Imaging of Apoptosis in Atherosclerosis by Targeting Cell Membrane Phospholipid Asymmetry. J. Am. Coll. Cardiol. 2020, 76, 1862–1874. [Google Scholar] [CrossRef] [PubMed]
  44. Ali, S.; Khan, M.R.; Khan, A.; Khan, R. In vitro anticancer activity of extracted oil from Parrotiopsis jacquemontiana (Decne) Rehder. Phytomedicine 2021, 91, 153697. [Google Scholar] [CrossRef]
  45. Liu, J.; Peng, Y.; Wei, W. Cell cycle on the crossroad of tumorigenesis and cancer therapy. Trends Cell Biol. 2021, 32, 30–44. [Google Scholar] [CrossRef] [PubMed]
  46. Leyva, A.; Quintana, A.; Sánchez, M.; Rodríguez, E.N.; Cremata, J.; Sánchez, J.C. Rapid and sensitive anthroneesulfuric acid assay in microplate format to quantify carbohydrate in biopharmaceutical products: Method development and validation. Biologicals 2008, 36, 134–141. [Google Scholar] [CrossRef]
  47. Baba, S.A.; Malik, S.A. Determination of total phenolic and flavonoid content, antimicrobial and antioxidant activity of a root extract of Arisaema jacquemontii Blume. J. Taibah Univ. Sci. 2015, 9, 449–454. [Google Scholar] [CrossRef] [Green Version]
  48. Dai, Y.-C.; Zhou, L.-W.; Cui, B.-K.; Chen, Y.-Q.; Decock, C. Current advances in Phellinus sensu lato: Medicinal species, functions, metabolites and mechanisms. Appl. Microbiol. Biotechnol. 2010, 87, 1587–1593. [Google Scholar] [CrossRef]
  49. Yang, N.-C.; Wu, C.-C.; Liu, R.H.; Chai, Y.-C.; Tseng, C.Y. Comparing the functional components, SOD-like activities, antimutagenicity, and nutrient compositions of Phellinus igniarius and Phellinus linteus mushrooms. J. Food Drug Anal. 2016, 24, 343–349. [Google Scholar] [CrossRef] [Green Version]
  50. Fotsis, T.; Pepper, M.S.; Aktas, E.; Breit, S.; Rasku, S.; Adlercreutz, H.; Wähälä, K.; Montesano, R.; Schweigerer, L. Flavonoids, dietary inhibitors of cell proliferation and in vitro angiogenesis. Cancer Res. 1997, 57, 2916–2921. [Google Scholar]
  51. Song, T.-Y.; Lin, H.-C.; Yang, N.-C.; Hu, M.-L. Antiproliferative and antimetastatic effects of the ethanolic extract of Phellinus igniarius (Linnearus: Fries) Quelet. J. Ethnopharmacol. 2008, 115, 50–56. [Google Scholar] [CrossRef] [PubMed]
  52. Holme, J.A.; Gorria, M.; Arlt, V.M.; Øvrebø, S.; Solhaug, A.; Tekpli, X.; Landvik, N.E.; Huc, L.; Fardel, O.; Lagadic-Gossmann, D. Different mechanisms involved in apoptosis following exposure to benzo[a]pyrene in F258 and Hepa1c1c7 cells. Chem. Interact. 2007, 167, 41–55. [Google Scholar] [CrossRef] [PubMed]
Figure 1. Total ion chromatogram of UPLC-Q-TOF-MS (positive mode) of SVE60.
Molecules 27 01153 g001
Figure 2. Total ion chromatogram of UPLC-Q-TOF-MS (negative mode) of SVE60.
Molecules 27 01153 g002
Figure 3. Effect of S. vaninii extracts on the proliferation of SW480 cells (* p < 0.05, ** p < 0.01) (a) SVW, (b) SVE60 and (c) SVE95.
Molecules 27 01153 g003
Figure 4. Effect of S. vaninii extracts on the apoptotisis of SW480 cells. Scheme 60. Group: (a) control group, (b) 3 μg/mL dose group, (c) 30 μg/mL dose group and (d) 30 μg/mL dose group. Scheme 95. Group: (e) control group, (f) 3 μg/mL dose group, (g) 30 μg/mL dose group and (h) 30 μg/mL dose group.
Molecules 27 01153 g004
Figure 5. Effect of SVE60 on cell cycle progression: (a) control group, (b) 3 μg/mL dose group, (c) 30 μg/mL dose group and (d) 30 μg/mL dose group.
Molecules 27 01153 g005
Figure 6. Effect of SVE60 on mTOR and AKT gene expression (a) mTOR. (b) AKT (* p < 0.05, ** p < 0.01).
Molecules 27 01153 g006
Figure 7. Effect of SVE60 on the protein expression via mTOR, AKT and p-AKT (a) Western blotting, (b) mTOR, (c) AKT, (d) p-AKT. (** p < 0.01).
Molecules 27 01153 g007
Table 1. The MS data and the identification results of SVE60.
Peak No.tR (min)IdentificationFormulaMass (m/z)Cacl. Mass (m/z)mDaFragments
10.50 2-CarboxylbenzaldehydeC8H6O3151.0358151.0395−3.7151,128,110
20.55 8-hydroxyl-5-O-β-D-GlucopyranosylpsoralenC17H16O10381.0803381.0822−1.9381,365,353,258,104
30.55 7-(α-D-Glucopyranosyloxy)-2,3,4,5,6-pentahydroxyheptanoic acidC13H24O13387.1141387.11390.2387,341,245,181,129
40.62 2,3,4,5-Tetra-O-acetylhexonic acidC14H20O11365.1058365.1084−2.6365,229,205,175,124
50.75 AdenosineC10H13O4N5268.1047268.10460.1268,245,229,136,124
60.75 Citric acidC6H8O7191.0190191.0192−0.2191,173,128,111
71.34 Protocatechuic acidC7H6O4153.0183153.0188−0.5153,109
82.01 Protocatechuic aldehydeC7H6O3137.0235137.0239−0.4137,136
92.57 Caffeic acidC9H8O4179.0342179.0344−0.2179,151,135,113
102.99 Ethyl 6-hydroxy-1-cyclohexene-1-carboxylateC9H14O3171.0999171.1021−2.2229,171,158,138
113.78 2-(2-{2-[2-(2-Methoxyphenoxy) ethoxy]ethoxy} Ethoxy)ethanolC15H24O6299.1491299.1495−0.4299,249,207,147,113
124.18 OsmundacetoneC10H10O3177.0551177.0552−0.1177,161,133
134.89 HispidinC13H10O5245.0449245.045−0.1245,159,113
145.33 SternbinC16H14O6301.0706301.0712−0.6301,257,249,179,113
155.55 2,6-bis[3-(3-tert-butyl-2-hydroxy-5-methylphenyl)-3-tricyclo[5.2.1.02,6]decanyl]-4-methylphenolC49H64O3701.4937701.49340.3701,680,340,229,138
165.80 Phelligridimer A or isomerC52H32O20977.1552977.1565−1.3977,301,245,229,142
175.86 4,4′-[2,7-Naphthalenediylbis(oxy)] diphthalic acidC26H16O10487.0648487.0665−1.7487,463,259,181,113
186.22 DavallialactoneC25H20O9463.1021463.1029−0.8463,379,259,159,113
196.29 Phelligridimer A or isomerC52H32O20977.1552977.1565−1.3977,301,245,229,142
206.88 4-dimethyl methoxyphenylmethylene malonateC13H14O5249.0758249.0763−0.5249,219,159,113
217.00 UnknownC49H78O18955.5246955.5266−2.0 956,423,301,229,149
227.12 Hosenkoside CC48H82O20977.5359977.53213.8978,932,113
237.89 Hypholomine BC26H18O10491.0981491.09780.3491.301,183,142
8.01 Hypholomine BC26H18O10489.0830489.08220.8489,445,199,147,113
248.13 Acetyl-SSaC44H70O14823.4819823.4844−2.5823,423,203,147,138
258.24 12-O-Acetylpergularin3-O-[β-D-oleandropyranosyl-(1→4)-β-D-canaropyranosyl-(1→4)-β-D-cymaropyranosyl-(1→4)-β-D-cymaropyranoside]C50H80O18969.5384969.5423−3.9970,423,301,229,149
268.30 UnknownC36H78O21845.4923845.4957−3.4845,445,249,130,113
278.43 Muricatin IIC49H84O20991.5508991.54783.0 992,946,113
2810.43 Inoseavin AC25H18O9461.0863461.0873−1.0 461,377,159,135,113
2914.01 Acetyl-SSa C44H70O14823.4802823.4844−4.2823,801,301,229,142
3014.15 UnknownC36H78O21845.4937845.4957−2.0 845,799,113
3114.99 (3β,16β,24S)-cycloartane-3,16,24,25,30-pentol 3,25-di-β-D-glucopyranosideC42H72O15815.4830815.47933.7815,363,249,175,113
3216.37 UnknownC61H66O2829.4944829.4985−4.1829,786,385,147,113
3317.26 5′,8′-dihydroxy-5,8-dimethoxy-6,6′-dimethyl-7,3′-binaphthyl- 1,4,1′,4′-tetraoneC24H18O8433.0908433.0923−1.5433,385,179,147,113
3417.36 UnknownC56H90O231131.59331131.5951−1.81,131,407,229,138
3517.48 UnknownC48H98O301153.60391153.6065−2.61,154,599,489,113
3617.79 Chakasaponin VIC59H92O261217.59171217.5955−3.81,218,301,229,138
3718.14 UnknownC41H80O24955.4695955.49610.4955,500,334,207,113
3820.11 12-O-Acetyllineolon3-O-[β-D-oleandropyranosyl-(1→4)-β-D-digitoxopyranosyl-(1→4)-β-D-cymaropyranosyl-(1→4)-β-D-cymaropyranoside]C50H80O18969.5378969.5423−4.1970,767,425,229,149
3920.20 Muricatin IVC49H84O20991.5518991.54784.0 992,946,113
4020.42 Cladoloside A4C53H82O211055.53931055.5427−3.41,056,875,301,229
4120.50 UnknownC44H88O261031.54851031.5486−0.11,032,992,207,113
4221.20 3β-O-[β-D-glucopyranosyl-(1→2)-β-D-glucopyranosyl]-olean-12-en-28-O-[(3-O-acetyl)-α-L-rhamnopyranosyl] esterC50H80O18969.5368969.53640.4970,407,301,229,138
4321.29 Merremoside cC49H84O20991.5511991.54783.3992,946,179,113
Table 2. The result of apoptosis induced by the ethanol extracts of S. vaninii.
Apoptosis RateSVE60SVE95
Control3 μg/mL30 μg/mL300 μg/mLControl3 μg/mL30 μg/mL300 μg/mL
Total0.8%2.8%3.0%8.3%0.9%1.9%2.6%8.2%
Early0.7%2.3%2.7%7.7%0.8%2.3%2.7%7.7%
Late0.1%0.5%0.3%0.6%0.1%0.3%0.4%0.6%
Table 3. Primer sequences used for the qRT-PCR.
NameForward Primer (5′→3′)Reverse Primer (5′→3′)
AKTATGAACGACGTAGCCATTGTGTTGTAGCCAATAAAGGTGCCAT
mTORACCGGCACACATTTGAAGAAGCTCGTTGAGGATCAGCAAGG
Publisher’s Note: MDPI stays neutral with regard to jurisdictional claims in published maps and institutional affiliations.

