Author Contributions
Research idea: X.C., L.W., X.W. (Xiaojie Wei) and J.L.; literature search: Y.Q., X.W. (Xuejuan Wei) and W.N.; graph production: Y.Q. and X.W. (Xuejuan Wei); software: Y.Q.; study design: X.C., L.W., X.W. (Xiaojie Wei), J.L. and Y.Q.; data collection: Y.Q. and X.W. (Xuejuan Wei); data analysis: Y.Q. and J.L.; manuscript writing: Y.Q.; funding support: X.C., L.W., J.L. and W.N.; supervision and review: X.C., L.W., X.W. (Xiaojie Wei), W.N. and J.L.; resources: X.C., L.W., J.L. and X.W. (Xiaojie Wei). All authors have read and agreed to the published version of the manuscript.
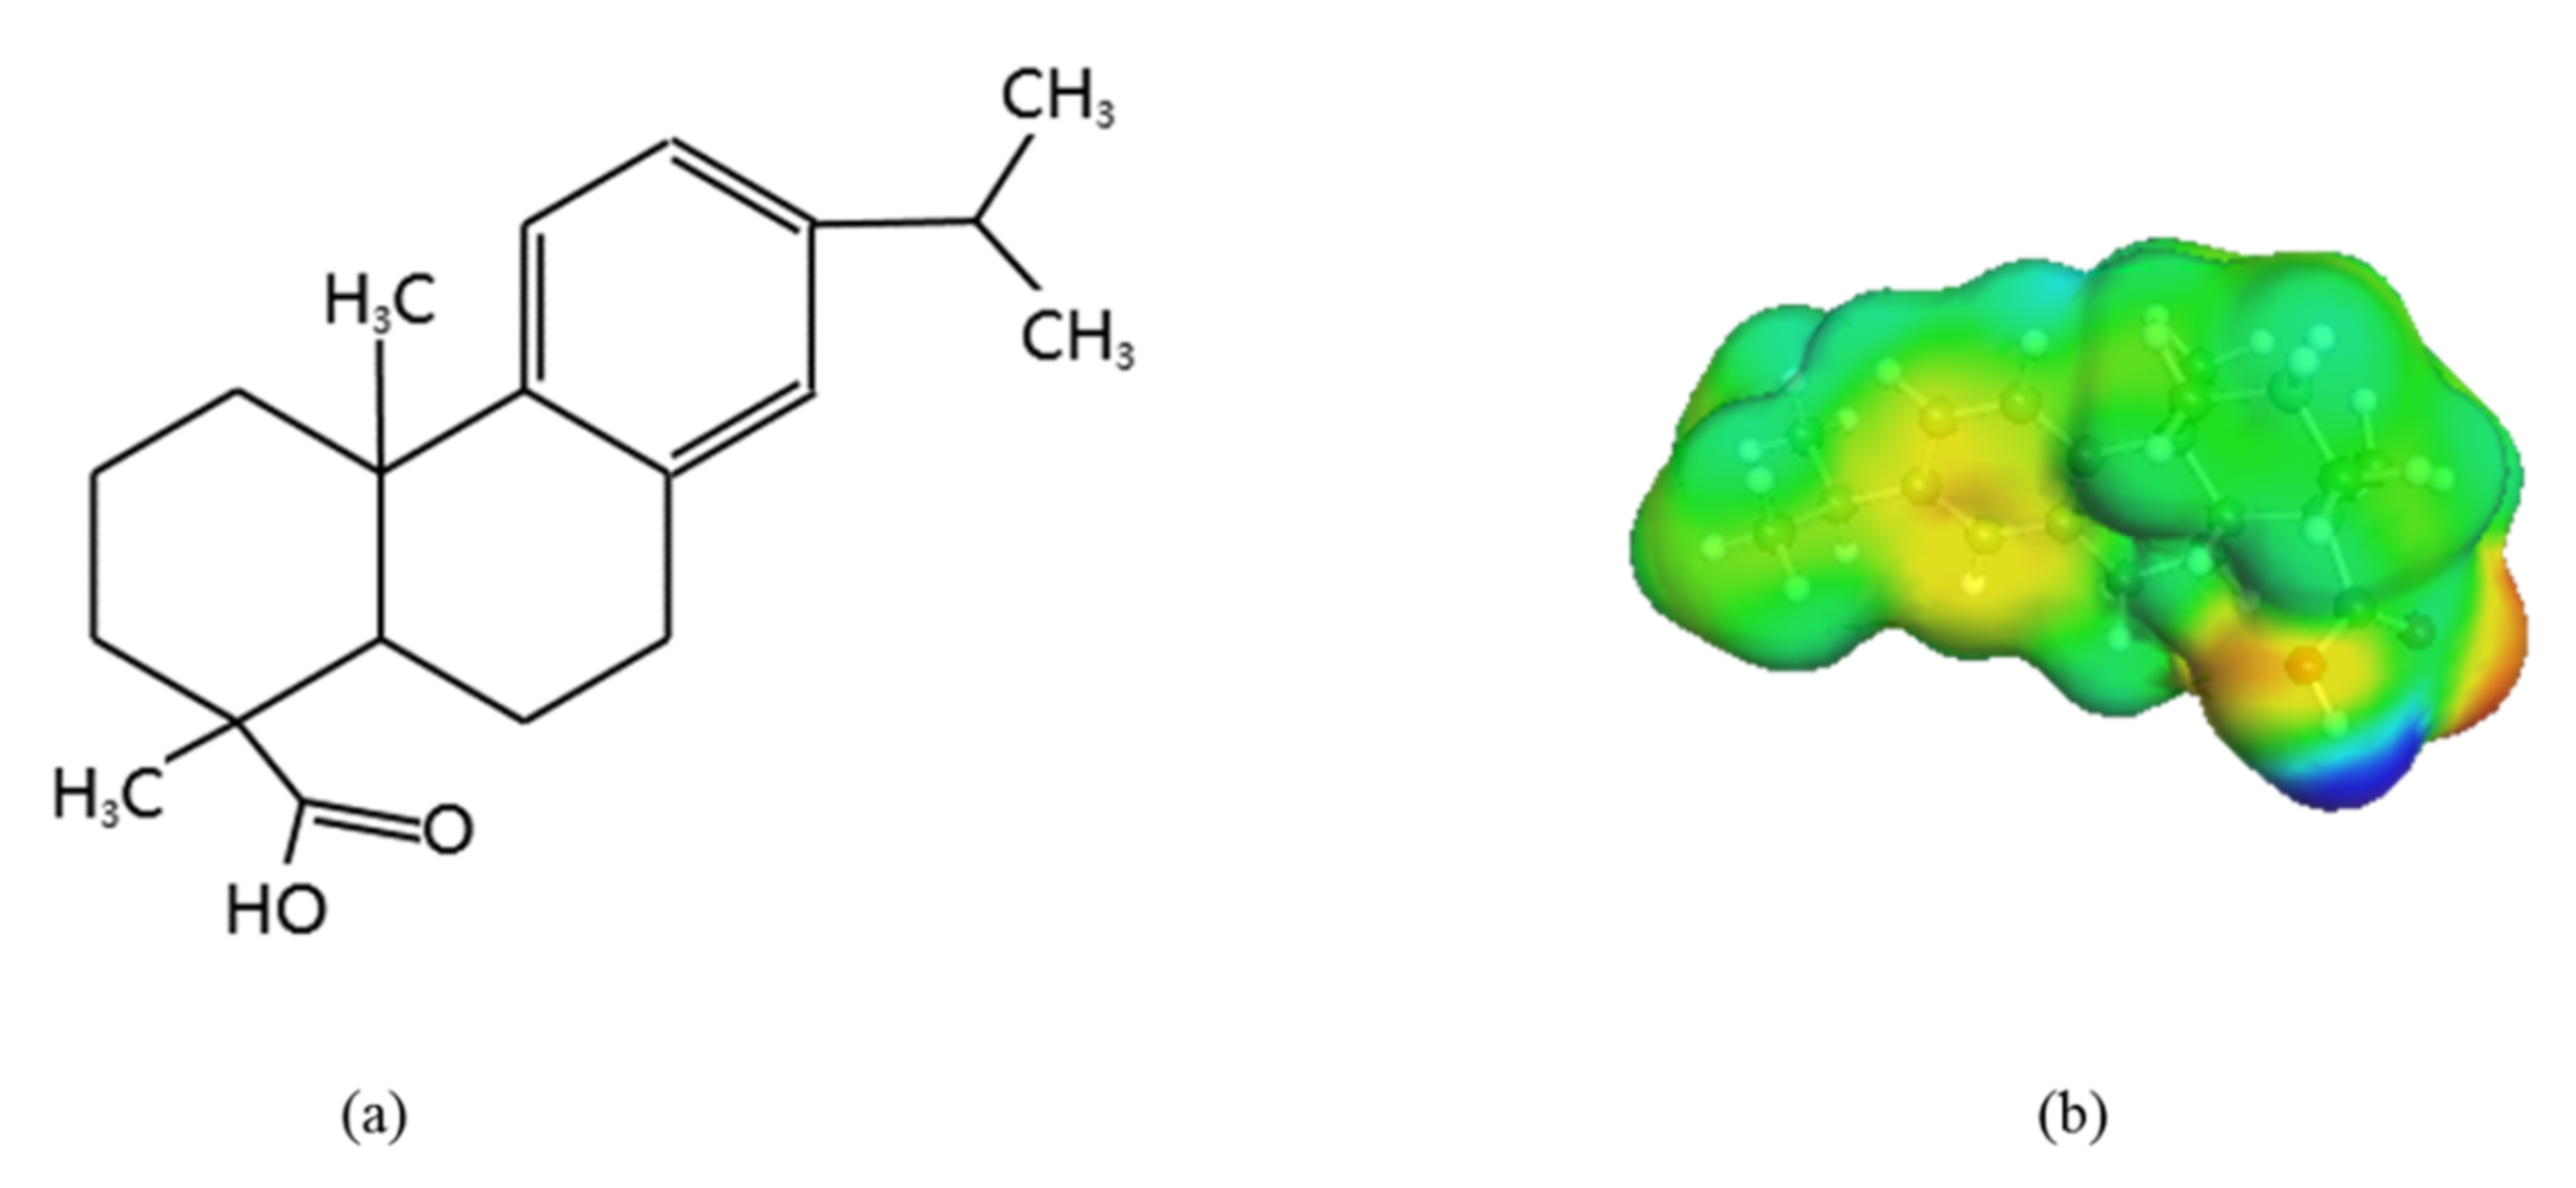
Figure 1.
The molecular structure (a) and sigma surface (b) of dehydroabietic acid. The different colors shown in the sigma surface of benorilate have the following meanings: the red part represents the hydrogen acceptor region; the blue part represents the hydrogen donor region; and the green part represents the nonpolar region.
Figure 2.
The differential scanning calorimetry (DSC) curve of dehydroabietic acid.
Figure 2.
The differential scanning calorimetry (DSC) curve of dehydroabietic acid.
Figure 3.
X-ray diffraction (XRD) patterns of raw dehydroabietic acid and recovered equilibrated dehydroabietic acid from three pure solvents and three binary mixed solvents.
Figure 3.
X-ray diffraction (XRD) patterns of raw dehydroabietic acid and recovered equilibrated dehydroabietic acid from three pure solvents and three binary mixed solvents.
Figure 4.
Mole fraction solubility of dehydroabietic acid in the three monosolvents.
Figure 4.
Mole fraction solubility of dehydroabietic acid in the three monosolvents.
Figure 5.
Mole fraction solubility of dehydroabietic acid in the three mixed solvents.
Figure 5.
Mole fraction solubility of dehydroabietic acid in the three mixed solvents.
Figure 6.
Plot of lnx1 against 1/T − 1/Thm for dehydroabietic acid in selected solvents: (a) indicates in monosolvents; (b) indicates in mixed solvents.
Figure 6.
Plot of lnx1 against 1/T − 1/Thm for dehydroabietic acid in selected solvents: (a) indicates in monosolvents; (b) indicates in mixed solvents.
Figure 7.
Comparison of COSMO-RS predicted and experimental solubility of dehydroabietic acid: (a) indicates the comparison in monosolvents; and (b) indicates the comparison in binary solvents.
Figure 7.
Comparison of COSMO-RS predicted and experimental solubility of dehydroabietic acid: (a) indicates the comparison in monosolvents; and (b) indicates the comparison in binary solvents.
Figure 8.
Comparison of COSMO-RS predicted and experimental solubility of dehydroabietic acid: (a) indicates the comparison in monosolvents; and (b) indicates the comparison in binary solvents.
Figure 8.
Comparison of COSMO-RS predicted and experimental solubility of dehydroabietic acid: (a) indicates the comparison in monosolvents; and (b) indicates the comparison in binary solvents.
Figure 9.
Solubility prediction data of dehydroabietic acid in the binary solvent of (−)-α-pinene (w1) + p-cymene with various mass fractions at different temperatures.
Figure 9.
Solubility prediction data of dehydroabietic acid in the binary solvent of (−)-α-pinene (w1) + p-cymene with various mass fractions at different temperatures.
Figure 10.
Solubility prediction data of dehydroabietic acid in the binary solvent of p-cymene (w1) + (−)-β-caryophyllene with various mass fractions at different temperatures.
Figure 10.
Solubility prediction data of dehydroabietic acid in the binary solvent of p-cymene (w1) + (−)-β-caryophyllene with various mass fractions at different temperatures.
Figure 11.
Solubility prediction data of dehydroabietic acid in the binary solvent of (−)-α-pinene (w1) + (−)-β-caryophyllene with various mass fractions at different temperatures.
Figure 11.
Solubility prediction data of dehydroabietic acid in the binary solvent of (−)-α-pinene (w1) + (−)-β-caryophyllene with various mass fractions at different temperatures.
Figure 12.
Sigma profiles of dehydroabietic acid and solvents.
Figure 12.
Sigma profiles of dehydroabietic acid and solvents.
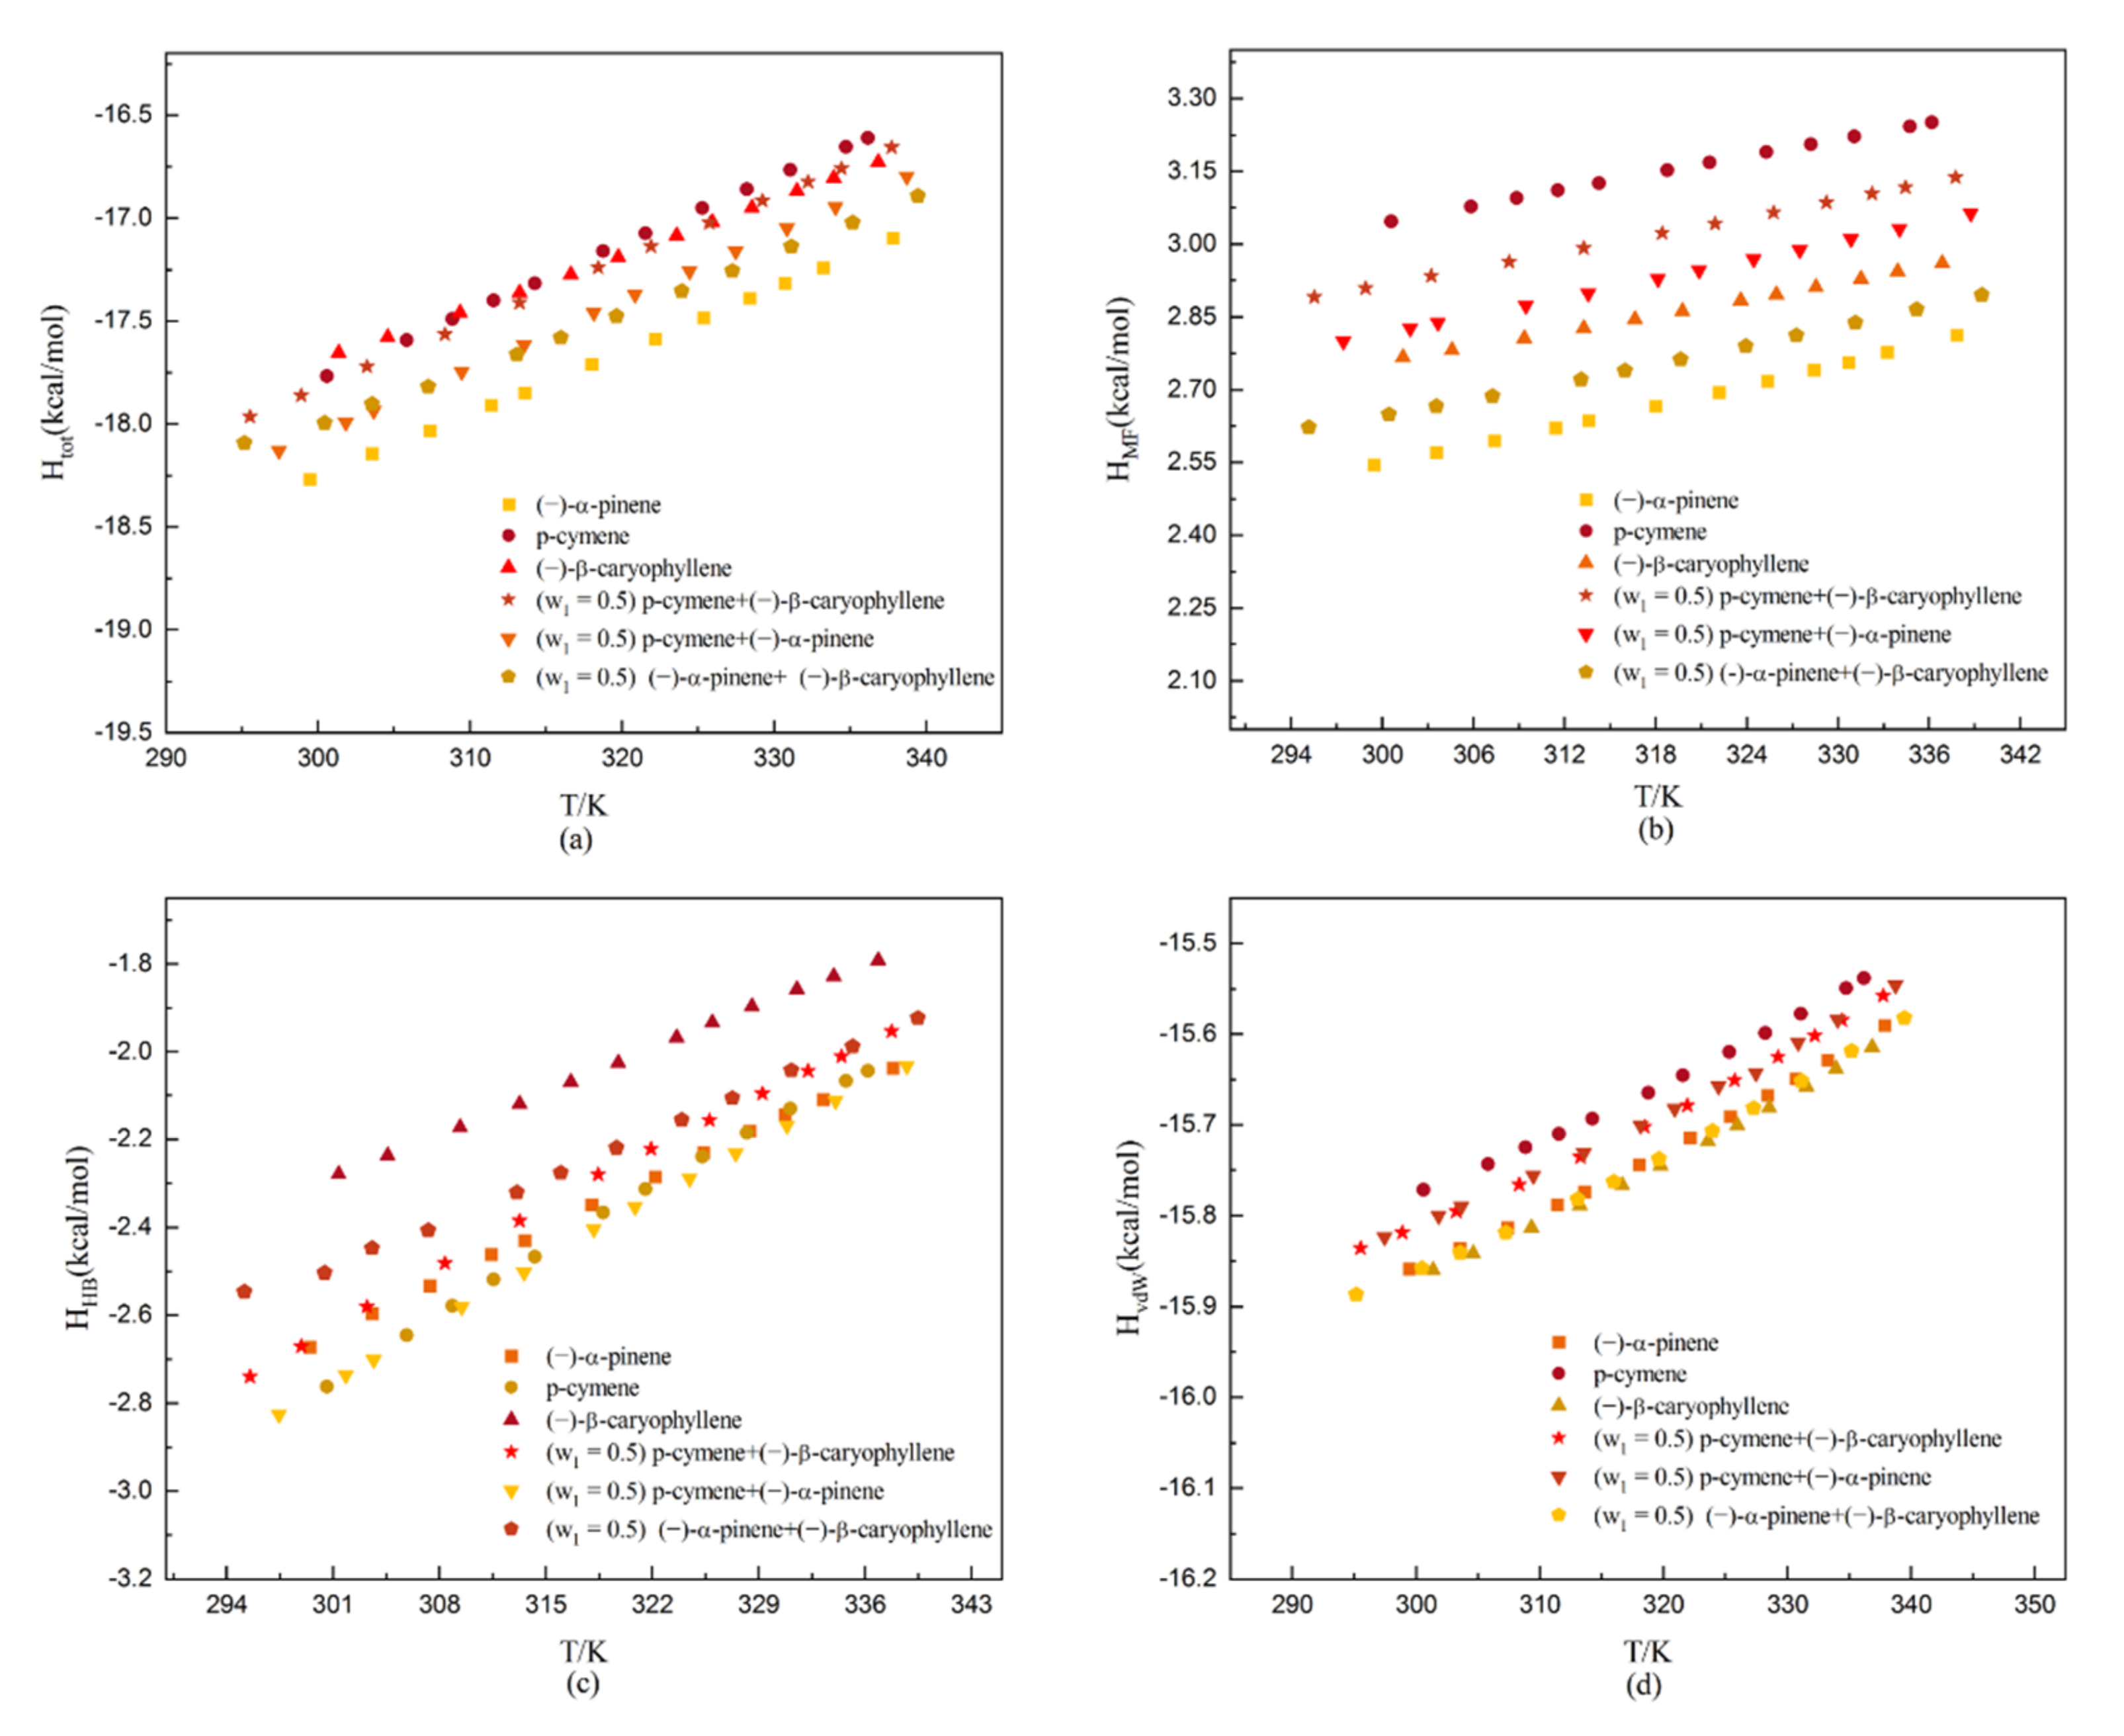
Figure 13.
The molecular interaction energies of dehydroabietic acid in the studied solvents: (a) total mean interaction energy (Htot); (b) misfit interaction energy (HMF); (c) hydrogen-bond interaction energy (HHB); and (d) van der Waals interaction energy (HvdW).
Figure 13.
The molecular interaction energies of dehydroabietic acid in the studied solvents: (a) total mean interaction energy (Htot); (b) misfit interaction energy (HMF); (c) hydrogen-bond interaction energy (HHB); and (d) van der Waals interaction energy (HvdW).
Figure 14.
The solubility of potassium chloride in water (a) and the solubility of benzoic acid in water (b).
Figure 14.
The solubility of potassium chloride in water (a) and the solubility of benzoic acid in water (b).
Table 1.
Values of experimental mole-fraction solubility (x1exp) and calculated solubility data (x1cal) of dehydroabietic acid in monosolvents ((−)-α-pinene, p-cymene, and (−)-β-caryophyllene) at different temperature T and pressure P = 101.3 kPa a.
Table 1.
Values of experimental mole-fraction solubility (x1exp) and calculated solubility data (x1cal) of dehydroabietic acid in monosolvents ((−)-α-pinene, p-cymene, and (−)-β-caryophyllene) at different temperature T and pressure P = 101.3 kPa a.
| T | x1exp | x1cal | x1cal | x1cal | x1cal |
|---|
| | | Modified Apelblat | λh | NRTL | UNIQUAC |
|---|
| (−)-α-pinene |
| 299.45 | 0.09417 | 0.09402 | 0.09367 | 0.09319 | 0.09447 |
| 303.55 | 0.10171 | 0.10209 | 0.10205 | 0.10167 | 0.10239 |
| 307.38 | 0.11025 | 0.11017 | 0.11036 | 0.11007 | 0.11027 |
| 311.40 | 0.11894 | 0.11926 | 0.11961 | 0.11944 | 0.11920 |
| 313.58 | 0.12536 | 0.12445 | 0.12486 | 0.12474 | 0.12425 |
| 318.00 | 0.13501 | 0.13560 | 0.13604 | 0.13606 | 0.13532 |
| 322.16 | 0.14751 | 0.14690 | 0.14722 | 0.14736 | 0.14652 |
| 325.37 | 0.15607 | 0.15617 | 0.15631 | 0.15656 | 0.15582 |
| 328.40 | 0.16499 | 0.16538 | 0.16526 | 0.16564 | 0.16513 |
| 330.70 | 0.17197 | 0.17270 | 0.17232 | 0.17278 | 0.17257 |
| 333.24 | 0.18171 | 0.18111 | 0.18037 | 0.18094 | 0.18121 |
| 337.83 | 0.19733 | 0.19721 | 0.19565 | 0.19643 | 0.19792 |
| p-cymene |
| 300.60 | 0.17951 | 0.17973 | 0.17807 | 0.15809 | 0.17732 |
| 305.84 | 0.18870 | 0.18845 | 0.18831 | 0.17306 | 0.18767 |
| 308.85 | 0.19381 | 0.19394 | 0.19444 | 0.18217 | 0.19415 |
| 311.54 | 0.19877 | 0.19915 | 0.20008 | 0.19055 | 0.20001 |
| 314.24 | 0.20598 | 0.20468 | 0.20589 | 0.19894 | 0.20510 |
| 318.77 | 0.21406 | 0.21468 | 0.21600 | 0.21427 | 0.21628 |
| 321.54 | 0.22128 | 0.22125 | 0.22243 | 0.22373 | 0.22248 |
| 325.29 | 0.23048 | 0.23072 | 0.23142 | 0.23714 | 0.23175 |
| 328.20 | 0.23874 | 0.23856 | 0.23866 | 0.24780 | 0.23896 |
| 331.08 | 0.24592 | 0.24676 | 0.24604 | 0.25886 | 0.24696 |
| 334.75 | 0.25801 | 0.25786 | 0.25579 | 0.27305 | 0.25670 |
| 336.16 | 0.26287 | 0.26233 | 0.25965 | 0.27863 | 0.26059 |
| (−)-β-caryophyllene |
| 301.35 | 0.09789 | 0.09837 | 0.09858 | 0.09881 | 0.09980 |
| 304.60 | 0.10524 | 0.10511 | 0.10514 | 0.10534 | 0.10591 |
| 309.34 | 0.11578 | 0.11547 | 0.11529 | 0.11546 | 0.11551 |
| 313.25 | 0.12512 | 0.12450 | 0.12420 | 0.12432 | 0.12402 |
| 316.65 | 0.13314 | 0.13271 | 0.13237 | 0.13244 | 0.13193 |
| 319.75 | 0.14076 | 0.14049 | 0.14016 | 0.14018 | 0.13956 |
| 323.60 | 0.15004 | 0.15054 | 0.15031 | 0.15026 | 0.14966 |
| 325.96 | 0.15626 | 0.15692 | 0.15681 | 0.15669 | 0.15618 |
| 328.53 | 0.16307 | 0.16405 | 0.16413 | 0.16393 | 0.16360 |
| 331.53 | 0.17201 | 0.17263 | 0.17300 | 0.17267 | 0.17266 |
| 333.93 | 0.17997 | 0.17968 | 0.18037 | 0.17990 | 0.18027 |
| 336.86 | 0.18976 | 0.18853 | 0.18969 | 0.18905 | 0.19004 |
Table 2.
Hansen solubility parameter (HSP) values for selected solvents a.
Table 2.
Hansen solubility parameter (HSP) values for selected solvents a.
| Solvents |
(MPa)0.5 | |
|---|
| (−)-α-pinene | 17.6069 | 3.1075 |
| p-cymene | 18.0516 | 2.6628 |
| (−)-β-caryophyllene | 17.7463 | 2.9681 |
| p-cymene + (−)-β-caryophyllene | 17.8990 | 2.8154 |
| p-cymene + (−)-α-pinene | 17.8293 | 2.8851 |
| (−)-α-pinene + (−)-β-caryophyllene | 17.6766 | 3.0378 |
Table 3.
Values of experimental mole-fraction solubility (x1exp) and calculated solubility data (x1cal) of dehydroabietic acid in three binary solvents (p-cymene + (−)-β-caryophyllene, p-cymene + (−)-α-pinene, and (−)-α-pinene + (−)-β-caryophyllene) at different temperature T and pressure P = 101.3 kPa a.
| T | x1exp | x1cal | x1cal | x1cal |
|---|
| | | Modified Wilson | Modified Wilson with Van’t Hoff | λh |
|---|
| p-cymene (w1 = 0.5) + (−)-β-caryophyllene |
| 295.54 | 0.14409 | 0.14906 | 0.14021 | 0.14321 |
| 298.90 | 0.15020 | 0.15332 | 0.14817 | 0.14971 |
| 303.24 | 0.15784 | 0.15909 | 0.15768 | 0.15844 |
| 308.34 | 0.16867 | 0.16799 | 0.16926 | 0.16923 |
| 313.28 | 0.17961 | 0.17714 | 0.18089 | 0.18024 |
| 318.45 | 0.18941 | 0.18636 | 0.19349 | 0.19241 |
| 321.90 | 0.19954 | 0.19588 | 0.20214 | 0.20092 |
| 325.75 | 0.21104 | 0.20800 | 0.21202 | 0.21080 |
| 329.26 | 0.22113 | 0.21914 | 0.22123 | 0.22018 |
| 332.24 | 0.22944 | 0.22907 | 0.22920 | 0.22843 |
| 334.43 | 0.23727 | 0.23889 | 0.23515 | 0.23468 |
| 337.75 | 0.24663 | 0.25136 | 0.24431 | 0.24444 |
| p-cymene (w1 = 0.5) + (−)-α-pinene |
| 297.45 | 0.14197 | 0.14562 | 0.14041 | 0.14199 |
| 301.84 | 0.15089 | 0.15577 | 0.14998 | 0.15086 |
| 303.67 | 0.15530 | 0.15588 | 0.15407 | 0.15468 |
| 309.45 | 0.16693 | 0.17006 | 0.16738 | 0.16726 |
| 313.55 | 0.17713 | 0.17577 | 0.17719 | 0.17667 |
| 318.15 | 0.18642 | 0.17897 | 0.18855 | 0.18774 |
| 320.87 | 0.19347 | 0.18762 | 0.19544 | 0.19455 |
| 324.46 | 0.20403 | 0.20123 | 0.20474 | 0.20386 |
| 327.47 | 0.21218 | 0.21115 | 0.21271 | 0.21195 |
| 330.85 | 0.22095 | 0.21567 | 0.22184 | 0.22137 |
| 334.05 | 0.23113 | 0.23967 | 0.23067 | 0.23062 |
| 338.75 | 0.24673 | 0.25128 | 0.24395 | 0.24483 |
| (−)-α-pinene (w1 = 0.5) + (−)-β-caryophyllene |
| 295.15 | 0.08338 | 0.09389 | 0.08668 | 0.08479 |
| 300.45 | 0.09577 | 0.10151 | 0.09772 | 0.09612 |
| 303.57 | 0.10417 | 0.10704 | 0.10467 | 0.10328 |
| 307.25 | 0.11507 | 0.11477 | 0.11329 | 0.11221 |
| 313.07 | 0.12970 | 0.12619 | 0.12791 | 0.12744 |
| 315.99 | 0.13747 | 0.13280 | 0.13572 | 0.13562 |
| 319.63 | 0.14686 | 0.14134 | 0.14589 | 0.14634 |
| 323.93 | 0.15967 | 0.15405 | 0.15857 | 0.15976 |
| 327.27 | 0.16973 | 0.16499 | 0.16892 | 0.17077 |
| 331.14 | 0.18024 | 0.17739 | 0.18147 | 0.18419 |
| 335.17 | 0.19484 | 0.19648 | 0.19518 | 0.19895 |
| 339.46 | 0.20909 | 0.21751 | 0.21052 | 0.21555 |
Table 4.
Regression results and model parameters of the modified Apelblat model of dehydroabietic acid in solvents.
Table 4.
Regression results and model parameters of the modified Apelblat model of dehydroabietic acid in solvents.
| Solvent | A | B | C | 103RMSD | 100ARD |
|---|
| (−)-α-pinene | −48.47524 | 521.07863 | 7.78171 | 0.49179 | 0.29696 |
| p-cymene | −111.46958 | 4249.61692 | 16.75777 | 0.53532 | 0.18554 |
| (−)-β-caryophyllene | 9.43067 | −2122.40205 | −0.82455 | 0.61823 | 0.36719 |
Table 5.
Regression results and model parameters of the λh model of dehydroabietic acid in solvents.
Table 5.
Regression results and model parameters of the λh model of dehydroabietic acid in solvents.
| Solvent | λ | h | 103RMSD | 100ARD |
|---|
| (−)-α-pinene | 0.63102 | 2847.00662 | 0.76833 | 0.41582 |
| p-cymene | 0.13981 | 3301.66787 | 1.46170 | 0.50337 |
| (−)-β-caryophyllene | 0.55282 | 3043.30450 | 0.65581 | 0.41461 |
| (w1 = 0.5) p-cymene + (−)-β-caryophyllene | 0.25625 | 3193.67354 | 1.48598 | 0.60355 |
| (w1 = 0.5) p-cymene + (−)-α-pinene | 0.29405 | 3117.90536 | 0.80205 | 0.29386 |
| (w1 = 0.5) (−)-α-pinene + (−)-β-caryophyllene | 0.89487 | 2319.29702 | 2.81877 | 1.40869 |
Table 6.
Regression results and model parameters of the NRTL model of dehydroabietic acid in solvents.
Table 6.
Regression results and model parameters of the NRTL model of dehydroabietic acid in solvents.
| Solvent | Δg12 | Δg21 | 103RMSD | 100ARD |
|---|
| (−)-α-pinene | 4616.96557 | −2402.45933 | 0.67424 | 0.42365 |
| p-cymene | −4165.94631 | 5604.35736 | 12.00745 | 4.89582 |
| (−)-β-caryophyllene | 6012.56622 | −2772.68602 | 0.59964 | 0.38518 |
Table 7.
Regression results and model parameters of the UNIQUAC model of dehydroabietic acid in solvents.
Table 7.
Regression results and model parameters of the UNIQUAC model of dehydroabietic acid in solvents.
| Solvent | Δu12 | Δu21 | 103RMSD | 100ARD |
|---|
| (−)-α-pinene | 2789.63759 | −1207.90976 | 0.57663 | 0.34881 |
| p-cymene | 3988.26141 | −1829.74505 | 1.42346 | 0.58455 |
| (−)-β-caryophyllene | 3475.77031 | −1200.32787 | 0.88057 | 0.56537 |
Table 8.
Regression results and model parameters of the modified Wilson model of dehydroabietic acid in solvents.
Table 8.
Regression results and model parameters of the modified Wilson model of dehydroabietic acid in solvents.
| Solvent | λ12 | λ21 | 103RMSD | 100ARD |
|---|
| (w1 = 0.5) p-cymene + β-caryophyllene | −1.34019 | −1.86192 | 2.93829 | 1.37903 |
| (w1 = 0.5) p-cymene + α-pinene | −0.94156 | −1.04704 | 4.73645 | 2.13388 |
| (w1 = 0.5) α-pinene + β-caryophyllene | −1.29291 | −1.43891 | 5.41597 | 3.56843 |
Table 9.
Regression results and model parameters of the van’t Hoff model of dehydroabietic acid in solvents.
Table 9.
Regression results and model parameters of the van’t Hoff model of dehydroabietic acid in solvents.
| Solvent | A | B | 103RMSD | 100ARD |
|---|
| (−)-α-pinene | 4.14712 | −1952.44054 | 0.87934 | 0.47957 |
| p-cymene | 1.88763 | −1088.87019 | 2.10495 | 0.79972 |
| (−)-β-caryophyllene | 3.85311 | −1859.74233 | 0.60195 | 0.36824 |
Table 10.
Regression results and model parameters of the modified Wilson–van’t Hoff model of dehydroabietic acid in solvents.
Table 10.
Regression results and model parameters of the modified Wilson–van’t Hoff model of dehydroabietic acid in solvents.
| Solvent | λ12 | λ21 | 103RMSD | 100ARD |
|---|
| (w1 = 0.5) p-cymene + (−)-β-caryophyllene | −0.15307 | 133.51780 | 2.15187 | 0.93010 |
| (w1 = 0.5) p-cymene + (−)-α-pinene | 1.88763 | −1088.87019 | 1.38301 | 0.60838 |
| (w1 = 0.5) (−)-α-pinene + (−)-β-caryophyllene | 3.8531 | −1859.7423 | 1.60410 | 1.15952 |
Table 11.
Value of the Akaike Information Criterion (AIC) of the fitting model for dehydroabietic acid in the different solvents.
Table 11.
Value of the Akaike Information Criterion (AIC) of the fitting model for dehydroabietic acid in the different solvents.
| Models | 104RSS a | Parameters | AIC b | e((AICmin-AICi)/2) c | Akaike Weight d (ωi) |
|---|
| (−)-α-pinene |
| modified Apelblat | 0.02902 | 3 | −176.8191 | 1 | 0.92964 |
| λh | 0.07084 | 2 | −168.1110 | 0.01285 | 0.01195 |
| NRTL | 0.05455 | 2 | −167.2461 | 0.00834 | 0.00775 |
| UNIQUAC | 0.03990 | 2 | −170.9995 | 0.05448 | 0.05065 |
| p-cymene |
| modified Apelblat | 0.03439 | 3 | −174.7835 | 1 | 0.99998 |
| λh | 0.25639 | 2 | −152.6758 | 1.58256 × 10⁻⁵ | 1.58253 × 10⁻⁵ |
| NRTL | 17.30147 | 2 | −98.1335 | 2.26804 × 10⁻¹⁷ | 2.26799 × 10⁻¹⁷ |
| UNIQUAC | 0.24315 | 2 | −149.3119 | 2.94382 × 10⁻⁶ | 2.94377 × 10⁻⁶ |
| (−)-β-caryophyllene |
| modified Apelblat | 0.04586 | 3 | −171.3277 | 0.74685 | 0.34783 |
| λh | 0.05161 | 2 | −171.9114 | 1 | 0.46574 |
| NRTL | 0.04315 | 2 | −170.0605 | 0.39635 | 0.18459 |
| UNIQUAC | 0.09305 | 2 | −160.8386 | 0.00394 | 0.00184 |
| p-cymene + (−)-β-caryophyllene |
| Modified Wilson | 1.03603 | 2 | −135.9183 | 0.00028 | 0.00028 |
| Modified Wilson with van’t Hoff | 0.55567 | 2 | −143.3940 | 0.01176 | 0.01162 |
| λh | 0.26498 | 2 | −152.2803 | 1 | 0.98810 |
| p-cymene + (−)-α-pinene |
| Modified Wilson | 2.69207 | 2 | −124.4592 | 5.55893 × 10⁻¹⁰ | 5.55090 × 10⁻¹⁰ |
| Modified Wilson with van’t Hoff | 0.22952 | 2 | −154.0039 | 0.00145 | 0.00145 |
| λh | 0.07719 | 2 | −167.0801 | 1 | 0.99855 |
| (−)-α-pinene + (−)-β-caryophyllene |
| Modified Wilson | 3.51993 | 2 | −121.2417 | 1.54771 × 10⁻⁵ | 1.48933 × 10⁻⁵ |
| Modified Wilson with van’t Hoff | 0.55567 | 2 | −143.3940 | 1 | 0.96228 |
| λh | 0.95346 | 2 | −136.9149 | 0.03918 | 0.03770 |
Table 12.
Values of apparent thermodynamic properties of solutions (ΔsolG0, ΔsolH0, ΔsolS0) of dehydroabietic acid in solvents (P = 101.3 KPa) a.
Table 12.
Values of apparent thermodynamic properties of solutions (ΔsolG0, ΔsolH0, ΔsolS0) of dehydroabietic acid in solvents (P = 101.3 KPa) a.
| Solvents | Intercept | Slope | ΔsolG0/kJ mol−1 | ΔsolH0/kJ mol−1 | ΔsolS0/J·mol−1K−1 | δH | δTS |
|---|
| (−)-α-pinene | −1.9770 | −1952.4405 | 5.2401 | 16.2326 | 34.4791 | 0.5962 | 0.4038 |
| p-cymene | −1.5221 | −1088.8702 | 4.0412 | 9.05287 | 15.6937 | 0.6437 | 0.3563 |
| (−)-β-caryophyllene | −1.9576 | −1859.7423 | 5.2090 | 15.4619 | 32.0347 | 0.6013 | 0.3987 |
| (w1 = 0.5) p-cymene + (−)-β-caryophyllene | −1.6522 | −1277.2243 | 4.3636 | 10.6188 | 19.6920 | 0.6293 | 0.3707 |
| (w1 = 0.5) p-cymene + (−)-α-pinene | −1.6744 | −1328.6663 | 4.4249 | 11.0465 | 20.8319 | 0.6252 | 0.3748 |
| (w1 = 0.5) (−)-α-pinene + (−)-β-caryophyllene | −1.9661 | −2060.5766 | 5.1924 | 17.1316 | 37.5853 | 0.5893 | 0.4107 |
Table 13.
Values of experimental mole-fraction solubility (x1) of dehydroabietic acid in the binary solvent at temperature T and pressure P = 101.3 kPa a.
Table 13.
Values of experimental mole-fraction solubility (x1) of dehydroabietic acid in the binary solvent at temperature T and pressure P = 101.3 kPa a.
| Mass Fraction (w1) | T/K | x1 |
|---|
| (−)-α-pinene(w1) + p-cymene |
| 0.1 | 304.65 | 0.18572 |
| 0.2 | 309.45 | 0.18739 |
| 0.3 | 311.40 | 0.18672 |
| 0.4 | 313.45 | 0.18583 |
| 0.5 | 313.55 | 0.17713 |
| 0.6 | 314.25 | 0.17325 |
| 0.7 | 313.55 | 0.15997 |
| 0.8 | 314.95 | 0.15047 |
| 0.9 | 318.15 | 0.14841 |
| p-cymene(w1) + (−)-β-caryophyllene |
| 0.1 | 323.50 | 0.16368 |
| 0.2 | 316.64 | 0.15576 |
| 0.3 | 317.95 | 0.17055 |
| 0.4 | 314.70 | 0.17427 |
| 0.5 | 313.28 | 0.17961 |
| 0.6 | 312.05 | 0.18090 |
| 0.7 | 311.20 | 0.18503 |
| 0.8 | 312.53 | 0.19505 |
| 0.9 | 313.30 | 0.20398 |
| (−)-α-pinene(w1) + (−)-β-caryophyllene |
| 0.1 | 311.40 | 0.12665 |
| 0.2 | 312.40 | 0.12751 |
| 0.3 | 313.30 | 0.12837 |
| 0.4 | 315.55 | 0.13447 |
| 0.5 | 319.43 | 0.14686 |
| 0.6 | 319.75 | 0.14597 |
| 0.7 | 322.35 | 0.15191 |
| 0.8 | 324.05 | 0.15619 |
| 0.9 | 325.85 | 0.16078 |
Table 14.
Descriptions of the materials used in the experiments.
Table 14.
Descriptions of the materials used in the experiments.
| Chemical Name | CASRN | Mass Fraction Purity | Source | Analysis Method |
|---|
| dehydroabietic acid | 1740-19-8 | 0.99 a | Laboratory self-made | gas chromatography (GC) |
| (−)-α-pinene | 7785-26-4 | 0.98 b | Aladdin Biochemical Co., Ltd. | GC |
| p-cymene | 99-87-6 | 0.99 b | Adamas Pharmaceuticals, Inc. | GC |
| (−)-β-caryophyllene | 87-44-5 | 0.99 b | TCI(Shanghai)Development Co., Ltd. | GC |
Table 15.
The Hansen solubility parameter (HSP) for dehydroabietic acid was calculated using the group contribution method a.
Table 15.
The Hansen solubility parameter (HSP) for dehydroabietic acid was calculated using the group contribution method a.
| Group | Number | E (J·mol−1) | V (cm3·mol−1) |
|---|
| CH3 | 4 | 4707 | 33.5 |
| CH2 | 5 | 4937.12 | 16.1 |
| CH | 2 | 3430.88 | −1.0 |
| C | 2 | 1464.4 | −19.2 |
| COOH | 1 | 27,614.4 | 28.5 |
| Benzene ring | 1 | 31,923.92 | 33.4 |
| Ring | 2 | 1046 | 16.0 |
| = 20.7144 MPa0.5 | | | |


