Abstract
Astringency is an important sensory characteristic of food and beverages containing polyphenols. However, astringency perception in elderly people has not been previously documented. The aim of the present work was to evaluate sensitivity to astringency as a function of age, salivary flow and protein amount. Fifty-four panellists, including 30 elderly people (age = 75 ± 4.2 years) and 24 young people (age = 29.4 ± 3.8 years), participated in this study. Astringency sensitivity was evaluated by the 2-alternative forced choice (2-AFC) procedure using tannic acid solutions. Whole saliva was collected for 5 min before and after the sensory tests. The results showed that the astringency threshold was significantly higher in the elderly group than the young group. No correlation was observed between the salivary protein amount and threshold value. However, a negative correlation between salivary flow and threshold was observed in the young group only. These results showed a difference in oral astringency perception as a function of age. This difference can be linked to salivary properties that differ as a function of age.
1. Introduction
Dietary polyphenols are a class of compounds present in foods and beverages, such as vegetables, nuts, unripe fruits and berries, wine, tea, etc. [1,2,3], and they are of great interest for the food industry because of their potential beneficial effects on health, particularly for the ageing population [4,5,6]. In food and beverages, polyphenols, especially tannins, can elicit astringency, which is perceived as a quality parameter and desired at balanced levels depending on the food products [7,8,9,10]. In contrast, above a certain intensity, astringency is usually described as an unpleasant oral sensation [11,12], which limits the use and promotion of polyphenols at moderate levels in food despite their health benefits [9,13].
In 2004, the American Society for Testing and Materials (ASTM) defined astringency as “the complex of sensations due to shrinking, drawing or puckering of the epithelium as a result of exposure to substances such as alums or tannins” ([14] cited by [12]). Astringency is not confined to a particular region of the mouth but is a diffuse sensation [15]. Astringency is generally considered to be a tactile sensation detected through the activation of mechanoreceptors rather than a taste [16]. Indeed, astringency takes 20 to 30 s to develop fully, often being the last oral sensation detected [15]. Although the mechanism of astringency is not yet well understood, several hypotheses have been proposed in the literature to explain astringency onset [12,16,17]. It is most probably detected at the level of the oral mucosa [9], either by mechanoreceptors after the increase of the friction forces at the surface of the epithelial cells [18] or by the detection of the aggregation of the mucosal pellicle by the transmembrane mucin MUC1 as recently proposed by Canon et al. [16]. Salivary proteins are thought to play an important role in these two hypotheses by protecting the mucosal pellicle from aggregation by tannins. Indeed, their presence, and especially those of tannin-binding proteins, such as proline-rich proteins, decrease the perception of astringency [19,20].
Regarding the effect of ageing on astringency perception, the literature is quite scarce, although the influence of ageing on the perception of other taste modalities has been largely documented. Longitudinal and cross-sectional studies have found that taste and smell losses tend to become noticeable after 60 years of age, with greater severity after 70 years of age [21,22]. In 2012, a systematic review and meta-analysis showed that most of the primary studies included in the review (n = 69) observed an increase in taste detection and identification thresholds and a decrease in taste intensity at the supra-threshold levels for the five basic taste modalities (bitter, salt, sour, sweet, umami) [23]. However, the authors highlighted the lack of concordance among the primary studies regarding the extent of taste loss. This discrepancy between studies is probably due to significant differences in the sensory procedures used to evaluate taste acuity [23,24]. More recently, Doty et al. (2018) [25] evaluated a decline in the five basic taste perceptions in 1020 Caucasian European subjects (age 18–80 y/o). The study confirmed taste losses with ageing regardless of the modality. The authors also highlighted the complexity of the association between the ability to perceive a taste and the preference for the same. Moreover, beyond this overall effect of age on taste abilities, ageing is also accompanied by large interindividual variability in olfactory performance scores and, to a lesser degree, in taste performance scores [26].
Several factors can influence the extent of sensory decline during ageing (nutritional status, general health and diseases) [27]. The reasons for these sensory modifications can also be linked to changes in oral physiology with age. Indeed, in the elderly population, the cumulative effects of physiological ageing, diseases and drugs frequently impact the different aspects of oral physiology that are of great importance in taste and aroma sensitivity and thus eating behaviour [27,28,29]. In particular, ageing may often be accompanied by a decrease in salivary flow or changes in salivary composition [30], which can lead to a dry mouth or xerostomia. Hyposalivation is common among older adults due to an age-related decline in salivary gland function, and other causes include medications and systemic diseases [31]. Recently, Descamps et al. [32] found an average 38.5% reduction in resting salivary flow and a 38% reduction in stimulated salivary flow in healthy elderly people compared to young adults. This salivary hypofunction in elderly individuals can lead to changes in aroma, taste and textural perception, and consequently, food intake and consumption [29,30,33,34,35].
In the context of the world population becoming older and ageing well, the main objective of this study was to investigate the sensitivity to astringency as a function of age and salivary characteristics (flow and protein amount). For this purpose, a 2-alternative forced choice (2-AFC) methodology was applied to estimate astringency sensitivity in young and elderly panels while evaluating salivary flow and protein amount. Relationships between salivary flow, protein amount and sensitivity to astringency as a function of age are discussed.
2. Results
2.1. Astringency Threshold
No significant differences were observed between the three sessions regarding astringency thresholds for either Group Y (young panel) (Friedman chi2 = 1.13, p = 0.56) or Group O (elderly panel) (Friedman chi2 = 1.14, p = 0.56). Therefore, we decided to merge threshold values into a unique variable.
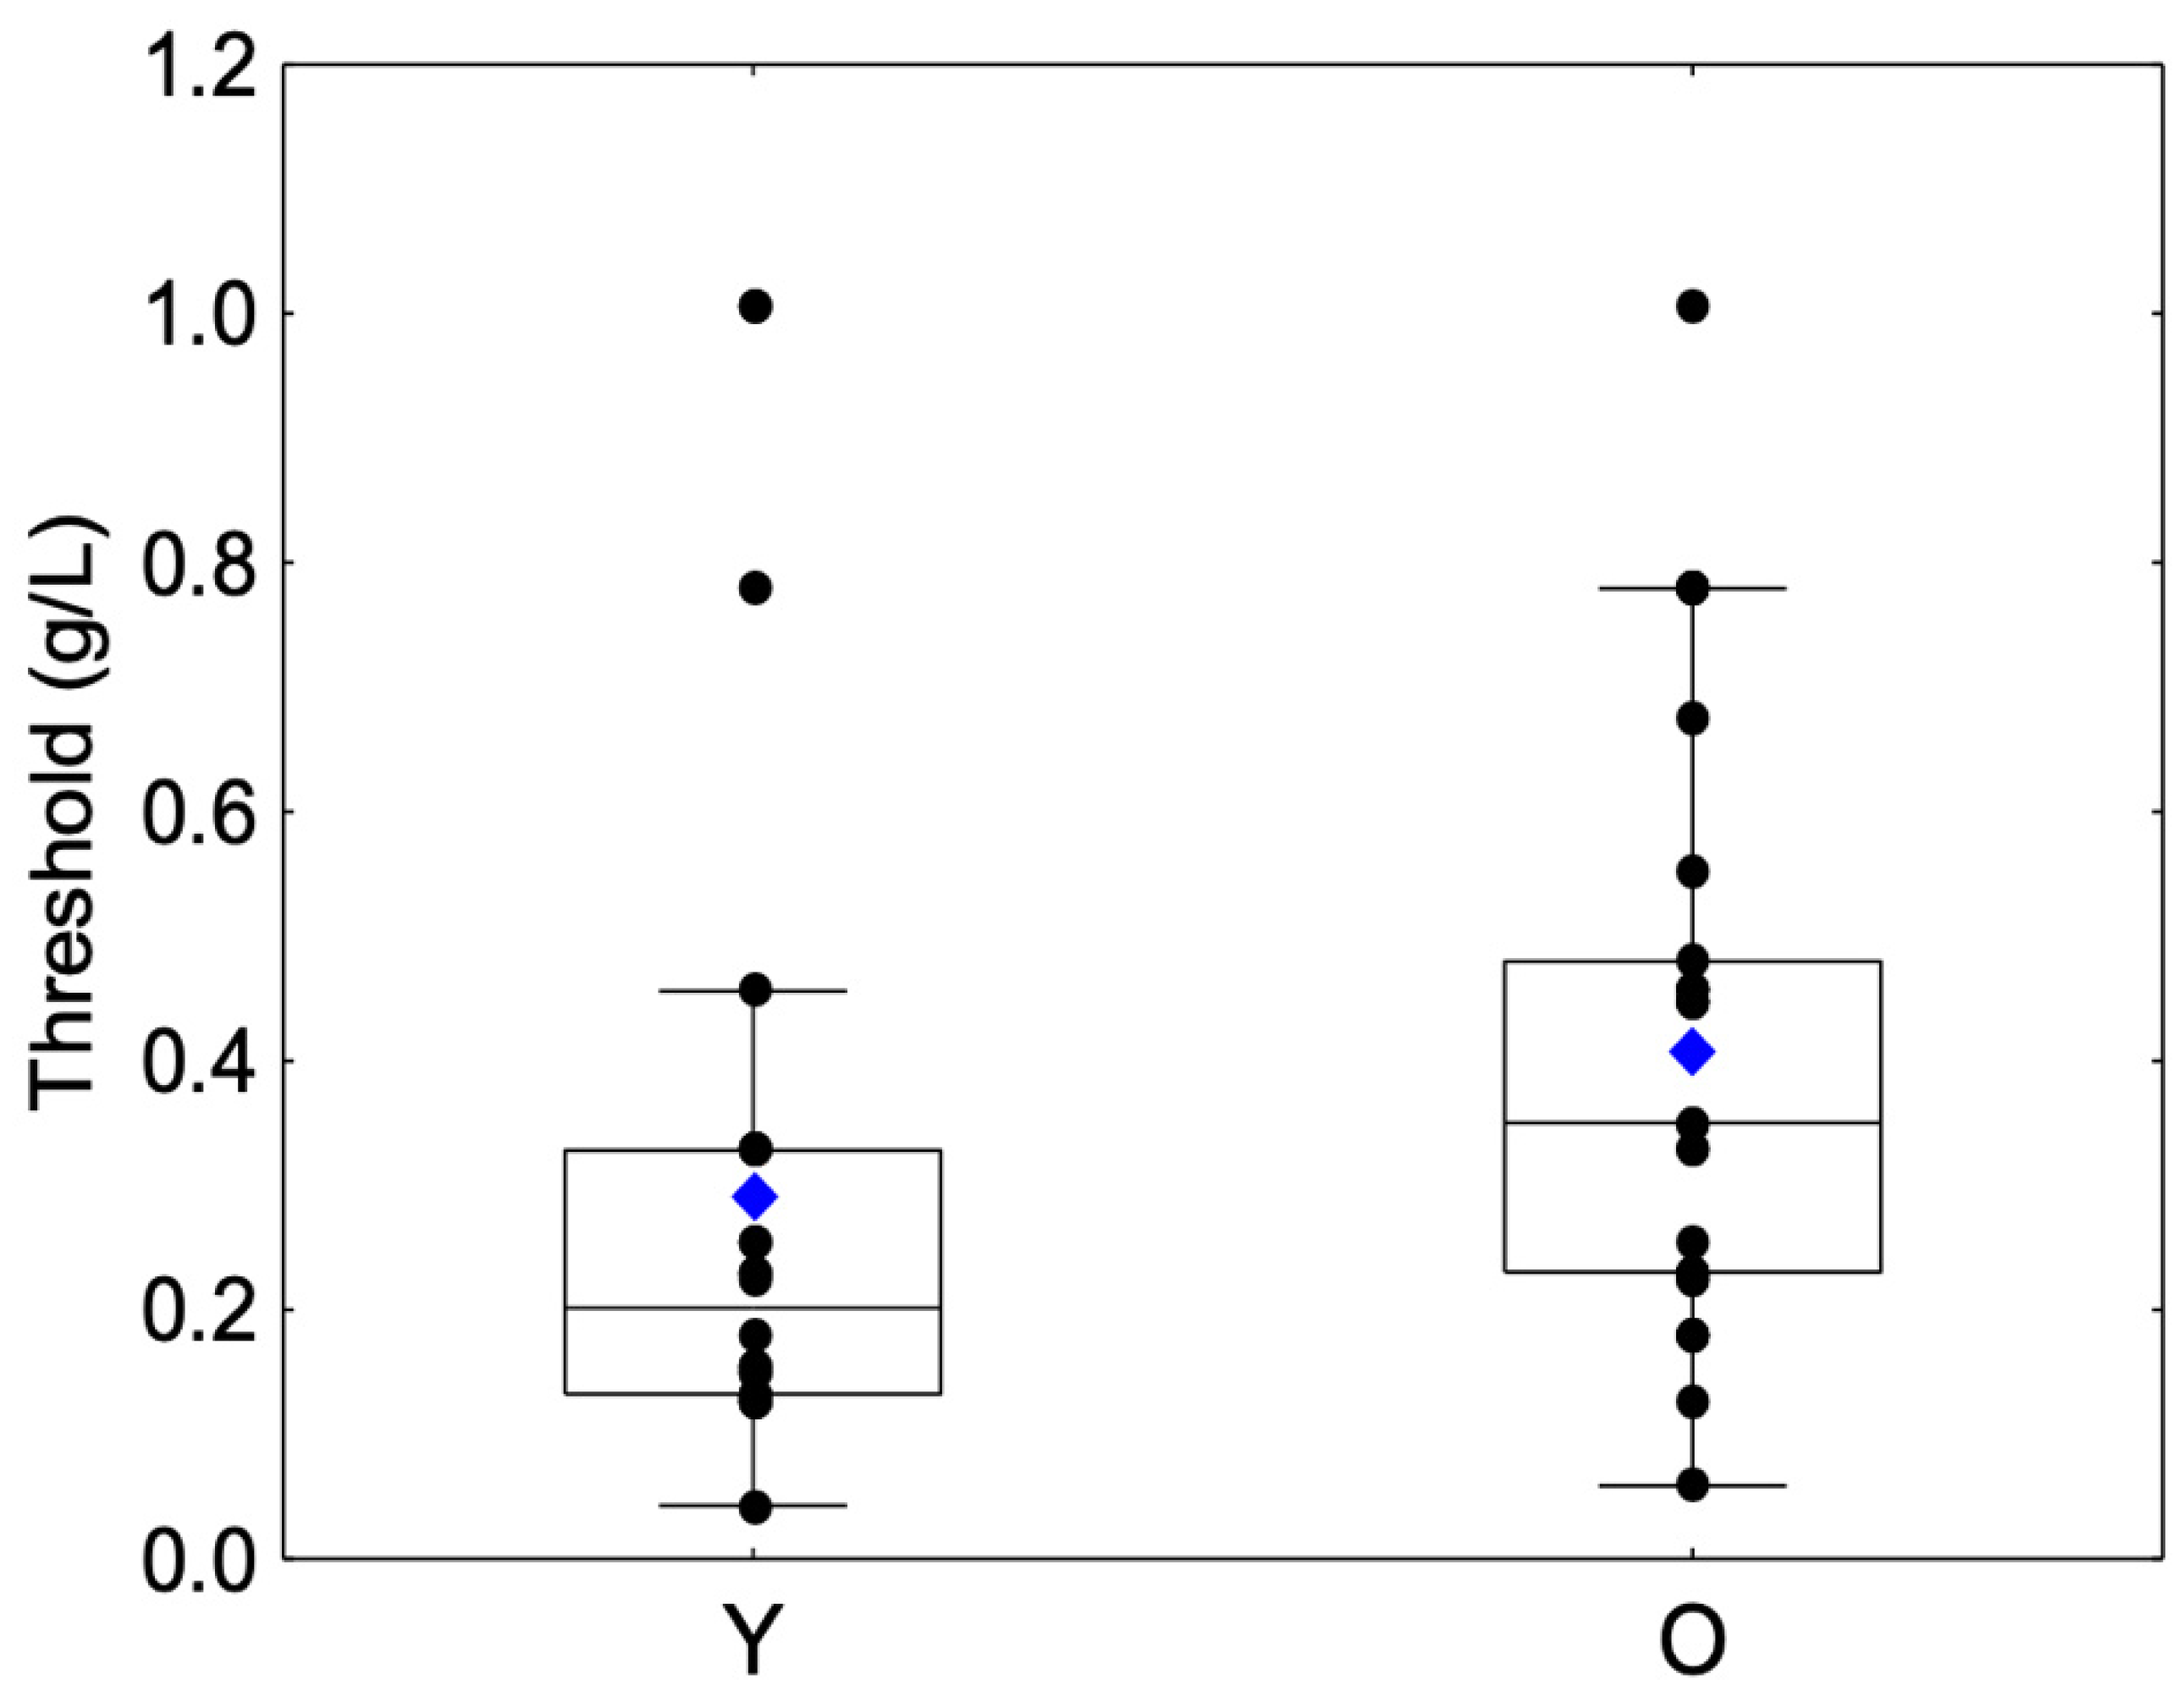
A significant difference was observed between the Y and O groups (Z = −2.5, p = 0.0110). The O group showed a higher mean astringency threshold than the Y group (Table 1, Figure 1).

Table 1.
Characteristics of the young (Y) and elderly (O) panels.

Figure 1.
Box-plot distributions of threshold values as a function of the age category (young (Y) and elderly (O)) are shown. The bottom and top of the box correspond to the 25th and 75th percentiles, respectively. The horizontal band and the blue diamond correspond to the median and the mean, respectively. The ends of the whiskers represent nonoutlier ranges. The black dot symbols correspond to individual data points.
2.2. Salivary Flow Rate and Protein Amount
No significant differences were observed between sessions regarding SFStart and SFEnd for Group Y (SFStart: Friedman chi2 = 0.75, p = 0.68; SFEnd: Friedman chi2 = 0.75, p = 0.68) or Group O (SFStart: Friedman chi2 = 5.2, p = 0.07; SFEnd: Friedman chi2 = 1.3, p = 0.53) or between the mean SFStart and mean SFEnd for Group Y (Friedman chi2 = 0.68, p = 0.492) or Group O (Friedman chi2 = 1.49, p = 0.135). For this reason, we decided to merge both variables into a unique variable, i.e., mean salivary flow (SF). SF values are presented in Figure 2. With regard to the comparison of salivary flow rate, the SF in the O group was lower than that in the Y group but with a modest degree of evidence (Z =1.66, p = 0.09) (Table 1). Moreover, a larger variability was observed in the O group compared to the Y group, with the presence of outliers with a higher SF. This large interindividual variability was previously observed in a large panel of elderly subjects and can be explained by life-style and aging factors such as diet, smoking habits, hydration status or structural changes in the salivary glands [32].
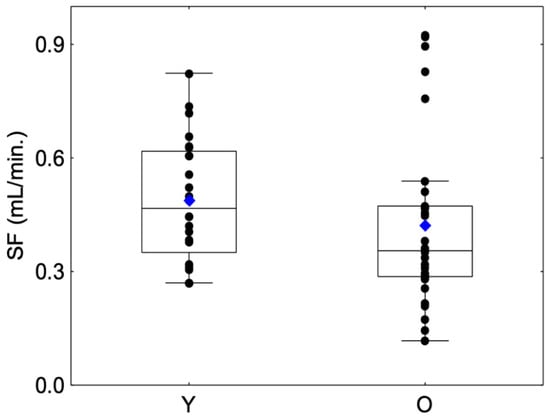
Figure 2.
Box-plot distributions of whole salivary flow (SF) as a function of the age category (young (Y) and elderly (O)) are shown. The bottom and top of the box correspond to the 25th and 75th percentiles, respectively. The horizontal band and the blue diamond correspond to the median and the mean, respectively. The ends of the whiskers represent the nonoutlier range. The black dot symbols correspond to individual data points.
No significant differences were observed between sessions regarding protein amount for Group Y (Friedman chi2 = 1.08, p = 0.58) or Group O (Friedman chi2 = 2.55, p = 0.28) or between the beginning and the end of the session for Group Y (Friedman chi2 = 1.5, p = 0.91) or Group O (Friedman chi2 = 1.70, p = 0.19). For this reason, we decided to merge the protein amount into a unique variable (Table 1). Protein amounts are presented in Figure 3, and no significant differences were observed between the Y and O groups (Z = −0.32, p = 0.74), which confirms previous results [36].
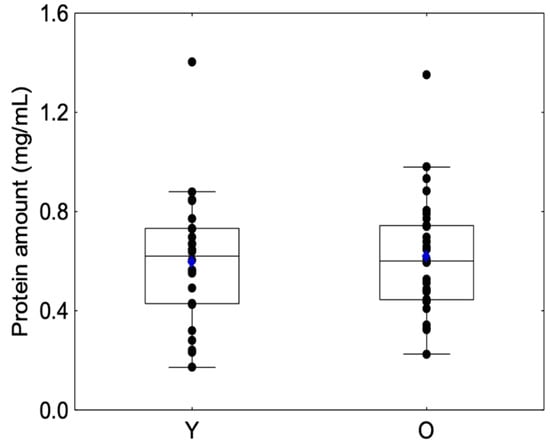
Figure 3.
Box-plot distributions of salivary protein amount as a function of the age category (young (Y) and elderly (O)) are shown. The bottom and top of the box correspond to the 25th and 75th percentiles, respectively. The horizontal band and the blue diamond correspond to the median and the mean, respectively. The ends of the whiskers represent the nonoutlier range. The black dot symbols correspond to individual data points.
2.3. Correlation between the Astringency Threshold and the Flow Rate and Protein Amount
The Spearman correlation between threshold and SF was not significant in the whole panel or the O group (Table 2). However, a significant and negative correlation was observed in the young (Y) group (r = −0.44, p = 0.03), where a higher salivary flow was associated with a lower threshold (Figure 4).
Table 2.
Spearman correlation coefficient (r) and p value of the astringency threshold and salivary characteristics for the whole (W), young (Y) and elderly (O) panellists. SF: salivary flow.
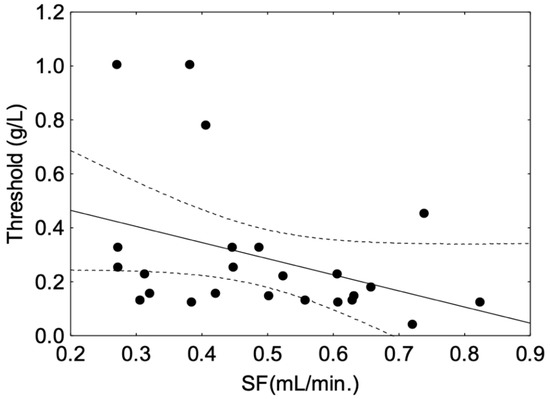
Figure 4.
Spearman correlation between astringency threshold and whole salivary flow (SF) observed in the group of young panellists. The plain line corresponds to fitted data. The dotted line corresponds to the confidence interval at 95%. The black dot symbols correspond to individual data points.
The Spearman correlation between the threshold and protein amount was not significant in the whole panel, the Y group or the O group (Table 2).
3. Discussion
In the current study, the astringency threshold was higher in elderly participants than in young participants. In other words, young adults were more sensitive to astringency than elderly adults, which confirms the findings of previous studies for other taste modalities [23,24,25,27,37]. To the best of our knowledge, this is the first study evaluating sensitivity to astringency as a function of age. In 2017, Linne and Simmons [10] investigated the impact of age on individual sensitivities to lingual tactile roughness in relation to sensitivity to astringent stimuli. The authors did not find a correlation between age and roughness sensitivity. However, their group was younger (21 to 60 y/o, n = 30) compared with that in our study as well as most other studies reporting taste differences as a function of age.
We found average detection thresholds of 0.2 g/L and 0.41 g/L for the Y and O groups, respectively. Using similar sensory procedures and stimuli, Linne et al., 2017 [10], obtained a detection threshold of 0.212 mM (0.36 g/L), which is close to our results. The increase in the detection threshold between Y and O was 1.6-fold. Similar increases on average were described for other taste modalities, such as saltiness (1.5), sourness (1.5), sweetness (1.4), umami (2.2) and bitterness (1.2 to 4.1) [23], suggesting that astringency sensitivity loss with age is not unusual compared to these modalities.
Differences in salivary properties can explain differences in taste sensitivity. Indeed, saliva allows the transport of taste substances to the taste receptor and protects the receptors by providing growth factors for the renewal of taste buds [38,39]. Some salivary components can modulate taste sensitivity [40]. For instance, sodium and amino acid salivary concentrations can modulate the detection threshold. Salivary flow can also influence fat intensity perception and preference, and larger amounts of saliva contribute to a higher in-mouth washing of lipid emulsion when tasted [41,42].
Regarding astringency, modulation of its perception as a function of the salivary flow rate led to contradictory results. Indeed, it has been reported that subjects with low salivary flow rated astringency higher than subjects with high salivary flow [43]. Conversely, Fisher et al. (1994) and Smith and Noble (1996) did not observe a difference in intensity rating as a function of salivary flow using temporal perception experiments [44,45]. Finally, Linne et al. (2017) [10] reported a higher sensory threshold for tannic acid in subjects with low salivary flow than in subjects with high flow.
In the present study, a positive relationship between astringency sensitivity and salivary flow was observed in the young panel only, i.e., a higher salivary flow corresponds to a higher sensitivity, which is in accordance with the results of Linne et al. (2017) [10]. This relationship of flow rate to astringency sensitivity, as shown in Figure 4, might suggest protection through an interaction mechanism with salivary proteins rather than a simple dilution effect, as suggested in other studies [46]. However, the amount of proteins measured in saliva from the Y group was not correlated with astringency sensitivity, which is consistent with previous studies that did not observe relationships between salivary total protein content and intensity or time-intensity evaluation of astringency [43,47]. However, strong positive correlations of astringency time-intensity parameters with some salivary protein fractions suggested that differences regarding astringency sensitivity and salivary properties were linked to salivary protein composition rather than global protein amount [15]. Indeed, histatins, mucins and salivary basic proline-rich proteins (bPRPs) have been identified as potential contributors to astringency perception in humans, while their role in the underlying mechanism of this perception is still under debate [17,48]. In particular, PRPs and histatins are described as tannin binding-proteins with a high affinity for tannins [49,50]. PRPs are secreted by the parotid glands, bind and scavenge tannins [51], giving them the ability to protect the mucosal pellicle against tannin aggregation [18]. Thus, bPRPs are proteins thought to play a role in astringency perception in humans [12,18]. In rodents, their role is much clearer as their presence in saliva increases the linking of astringent solution [19]. Indeed, the secretion of PRP in the saliva of rodents is not constitutive and is induced by the diet. Moreover, rodents do not secrete histatins [52] and thus PRPs are the main tannin-binding proteins in their saliva.
We did not observe such a relationship between salivary flow and astringency sensitivity in the elderly group or a difference in protein amount between the Y and O groups, which should explain the difference in sensitivity between the two groups. However, lower salivary flow was observed in the O group than in the Y group, which is in accordance with previous studies [32,53] and should partly explain the sensitivity differences between the two groups. Our observations suggest that the role of saliva in astringency sensitivity as a function of age should also be linked to salivary composition and, in particular, peptides and proteins. Studies on changes in salivary composition in healthy elderly individuals are relatively scarce and present poor consistency among results [30]. Moreover, the direction of change (increase or decrease) depends on the proteins. For instance, amylase, lysozyme and IgA increase with age, while lactoferrin, glutathione, peroxidase activity and mucin levels decrease, with a large consensus for the latter [30]. Similarly, histatin levels were also observed to decline with age [54], which is an interesting finding based on the possible involvement of mucins and histatins in astringency sensitivity [12,16]. We suggest that a lower level of these classes of proteins in the saliva of the elderly population should impact astringency perception. With regard to PRP and bPRP, there is a paucity of information describing their salivary amounts during the human lifespan. Exploring salivary exocrine protein secretion in 220 adults, Baum et al. [55] did not find a change in PRP secretion during ageing, although this study considered only acidic PRP.
In conclusion, we found that the astringency threshold was higher in the elderly group than in the young group, and our results suggest that salivary properties differently influence astringency sensitivity as a function of age. A deeper characterisation of salivary composition, particularly regarding PRP, mucin and histatin levels in both populations, should be performed.
4. Limitations
This study presents some limitations.
Although a preliminary session was provided to the training subjects on the astringency modality, bias due to other attributes, such as bitterness or olfactory cues, cannot be ignored. Regarding the latter, a nose clip was not worn during the sensory test to avoid excessive fatigue for elderly participants. The same concern guided the choice to limit the number of tannic acid concentrations to 4 to avoid excessive presentation of samples to this population.
The number of subjects was defined to be at least 23 participants in each group following a power test based on the results from a preliminary study. It is likely that this number of subjects will not permit us to capture all the variability commonly observed in the elderly population. Thus, an astringency evaluation in a larger population should be performed before generalising our findings. Moreover, we observed in both groups (Y and O) a large variability regarding the salivary flow with the presence of outliers in the O group which led to non-normally distributed data. We cannot rule out the potential effect of these outliers on the statistical results despite the use of non-parametric statistics more robust to their presence [56,57]. However, it is important to note that sensory evaluation and salivary sampling were repeated 3 times in 3 different sessions during a short period, which ensured the good reliability of our results.
Some of the participants in the elderly group took drugs despite the low mean number (2) compared to what was commonly observed in this population (ranging from 2.9 to 3.7 medications [58]). Drug intake is known to cause sensory impairment, particularly in the aged population [22,58]. In our study, we chose subjects who were significantly older (mean age 75 y/o) than those in the literature and thus more likely to take medication, which increased the difficulty of limiting the inclusion of drug-taking participants.
Finally, we principally included participants with good oral health based on dental observations. However, we did not check for oral microbiota impairment, a factor that is commonly observed in the elderly population and that should also affect taste sensitivity [59].
5. Materials and Methods
This study was approved on 31 October 2019 by the Ethical Committee CCP Ile de France IV under the number 2019-A02434-53.
5.1. Materials
Solutions for rinsing consisted of 0.1% pectin (Sigma–Aldrich, Saint-Quentin-Fallavier, France) and 1% bicarbonate (Gilbert, France) dissolved in Evian water at room temperature.
Solutions for the sensory training session consisted of six taste solutions (salty, sour, sweet, bitter, umami, and astringent), and their compositions are detailed in Table S1 (Supplementary Material). Each solution was coded with random three-digit codes.
Solutions for astringency sensitivity evaluation consisted of four solutions with increasing tannic acid (Sigma–Aldrich, Saint-Quentin-Fallavier, France) concentrations (in g/L) with a multiple of 3.05, i.e., 0.02, 0.062, 0.188, and 0.574. These concentrations were chosen on the basis of preliminary experiments performed with a small internal panel of subjects (see Section 2.2 below). All samples were prepared in Evian water at room temperature 1 h before testing. Since potassium alum has not been allowed in sensory studies, tannic acid was used as a component to evaluate astringency because it has been described as less bitter than other polyphenols, such as gallic acid and catechin [60], and thus limits the confusion between astringency and bitter taste. This was confirmed during preliminary tests.
5.2. Sensory Analysis
Fifty-four panellists, including 30 elderly (O) people (age ≥ 65 y/o) and 24 young (Y) people (age ≤ 35 y/o), were recruited to participate in the sensory sessions. The panel is described in Table 1. The number of subjects that needed to be included to find a difference between the two groups regarding astringency perception was determined by a power test (power = 0.9, significance level = 0.05, alternative = “two-sided”). The power test was based on preliminary results obtained on an internal panel (mean threshold = 0.19 ± 0.17 g/L of tannic acid, n = 9). At least 23 subjects per group (Y or O) were necessary to observe a difference equal to one standard deviation between the groups. More subjects were recruited in case of defection, particularly for the O group. These size groups are in line with previous studies aiming at evaluating the effect of ageing on taste perception regardless of the modalities [23,24]. Elderly and young subjects had good oral health, with a number of functional posterior units above 7 [32]. Moreover, elderly subjects were autonomous persons living at home, had no cognitive disorders (Mini Mental State Examination (MMSE > 25 [61])), did not have complete or half-complete dental appliances and took an average of 2 drugs per day (median = 1).
5.3. Preliminary Session
The objective of this session was to be sure that subjects were able to (i) clearly identify and differentiate astringency from other sensory sensations, in particular sourness, bitterness and olfactory cues, and (ii) perfectly understand the procedure of the sensory test, i.e., the 2-AFC to be used later.
The session was divided into two parts. During the first part, subjects received 20 mL of tasting sample in a fixed order at room temperature in plastic cups coded with random numbers. They were instructed to put the samples into their mouths, swirl the sample gently in the mouth for 30 s, spit it out and judge which taste it was. Between samples, subjects rinsed their mouth with Evian water and then waited for 1 min before the next sample. The tasting sensations were saltiness, sweetness, sourness, bitterness and umami. Additionally, panellists were presented with tannic acid solution as an example of astringency.
In the second part, subjects were trained and familiarised for the 2-AFC procedure as described below.
During both parts of the preliminary session, there was a discussion between subjects and experimenters after each test. At the end of the session, all the panellists indicated that they were able (i) to clearly identify astringency from other sensory sensations and (ii) to perform the 2-AFC test properly.
5.4. Testing Session
All sessions were performed for 3 months between the middle of November and the end of January and between 2 and 6 p.m. to minimise seasonal and circadian rhythms as much as possible. Moreover, panellists were asked to not drink, eat or smoke 1 h before the session.
The whole session was conducted under red light at room temperature in a sensory room equipped with individual boxes.
At the beginning of each session, panellists were asked to taste a model tannic acid solution of 1.76 g/L so that they could identify astringency. Then, they rinsed their mouths with pectin, bicarbonate and Evian water and waited for a 3 min break before threshold evaluation. The objective of this rinsing procedure is to perfectly clean the mouth to have the most similar oral conditions when starting each test, and thus minimise carry-over effects between sample evaluations. Sodium bicarbonate recovers pH homeostasis, and pectin removes tannic acid from the oral mucosa due to its capacity to form complexes with polyphenols [12]. This rinsing procedure was found to be efficient in wine studies for in-mouth aroma release experiments [62,63] and, more recently, for the time sensory evaluation of astringency and aroma [64]. This procedure was chosen instead of other procedures, such as the milk rinsing procedure [65], because of the necessity to avoid any contamination of saliva samples by food proteins.
The astringency threshold was evaluated by a 2-AFC procedure with ascending concentrations of tannic acid. In each 2-AFC presentation, two samples were presented: a target sample and a control sample. Each 2-AFC test was performed 3 times, and the evaluation was performed 3 times in 3 different sessions. Paired samples (5 mL) were presented in balanced order following a Latin square design (Williams design) at room temperature in a white plastic cup coded with the letter A or B. The testing procedure started from the lowest concentration. Panellists were given the reference or stimulus sample. They were asked to put the samples into their mouth, swirl them gently around the mouth for 30 s and then spit them out. They rinsed their mouths with pectin and waited for 1 min before evaluating the second sample. After 30 additional seconds, the panellists were asked to indicate which sample was perceived as astringent. Then, the panellists rinsed their mouth as described previously.
The sensitivity level was reached when three correct answers from the same concentration were achieved. The best estimate threshold for each subject was evaluated as the geometric mean of the three correctly answered concentrations and the previous lower concentration. When the subjects correctly identified the lowest concentration (0.02 g/L), the geometric means were calculated between this concentration and the theoretical concentration below, i.e., 0.02/3.05 = 0.0065 g/L. In contrast, when subjects did not correctly identify the highest concentration (0.574 g/L), the geometric mean was calculated between this concentration and the theoretical concentration above, i.e., 0.574 × 3.05 = 1.75 g/L.
5.5. Saliva Collection
Whole saliva was collected after the panellists had rinsed their mouths with 0.1% pectin, 1% bicarbonate and water at the start (SFStart) and at the end (SFEnd) of the session. Saliva was collected by expectorating into a preweighed tube with a cap for 5 min as described previously [41]. After collection, the tubes were weighed and then stored at −80 °C. Flow rates were determined gravimetrically and expressed as grams per minute (g/min).
5.6. Protein Amount
Saliva samples were centrifuged at g for 15 min at 4 °C before analysis. The protein concentration was determined in the supernatant using the Bradford protein assay, with bovine serum albumin (BSA) used as the standard for calibration [41].
5.7. Statistical Analysis
Data showed the presence of outliers for all the variables. Moreover, normality assumptions were not met for the raw data and residues. We decided to keep all the data and to not violate normality assumption. We thus performed nonparametric analyses because they are adapted to non-normally distributed data and are more robust to the presence of outliers [56,57,66,67,68]. Mann–Whitney U tests were performed to evaluate differences between the Y and O subjects regarding sensory and salivary parameters. Wilcoxon tests were performed on the salivary parameters (flow and protein amounts) to evaluate differences between the start and the end of each session. Friedman ANOVA was conducted on the threshold and salivary parameter measurements to evaluate the differences between the three sessions. Spearman rank order correlations were performed for the whole group and in each group (Y and O) to evaluate the relationships between salivary and sensory parameters. The significancy was set at p < 0.05. These tests were performed using Statistica® version 13.5.0.17 (1984-2018 TIBCO Software Inc, Palo Alto, California, USA).
Supplementary Materials
The following supporting information can be downloaded online, Table S1: Description of the tasting solutions used for the preliminary session.
Author Contributions
Conceptualization: M.W., C.S., H.B., C.M., F.C. and G.F.; methodology: M.W., C.S., C.M., F.C. and G.F.; formal analysis: M.W. and G.F.; resources: G.F. and F.C.; data curation: M.W. and G.F.; writing—original draft preparation: M.W., F.C. and G.F.; and supervision: F.C. and G.F. All authors have read and agreed to the published version of the manuscript.
Funding
Mei Wang received scholarship funding from the China Scholarship Council (China) (CSC NO. 201808330410). This work was supported by grants from the GIRACT foundation (Switzerland), the Conseil Régional Bourgogne, Franche-Comte (PARI grant) and the FEDER (European Funding for Regional Economic Development).
Institutional Review Board Statement
This study was approved on 31 October 2019 by the Ethical Committee CCP Ile de France IV under number 2019-A02434-53.
Informed Consent Statement
Informed consent was obtained from all subjects involved in the study.
Data Availability Statement
The original data presented in this study are available upon request. However, because of ethical or privacy issues, they will be provided in aggregated form.
Acknowledgments
The authors thank the Chemosens platform for providing all facilities for performing the sensory studies.
Conflicts of Interest
The authors declare no conflict of interest. The funders had no role in the design of the study; the collection, analysis, or interpretation of data; the writing of the manuscript; or the decision to publish the results.
Sample Availability
Samples of the compounds are available from the authors.
References
- Kiokias, S.; Proestos, C.; Oreopoulou, V. Phenolic Acids of Plant Origin—A Review on Their Antioxidant Activity In Vitro (O/W Emulsion Systems) Along with Their in Vivo Health Biochemical Properties. Foods 2020, 9, 534. [Google Scholar] [CrossRef] [PubMed]
- Troilo, M.; Difonzo, G.; Paradiso, V.M.; Summo, C.; Caponio, F. Bioactive Compounds from Vine Shoots, Grape Stalks, and Wine Lees: Their Potential Use in Agro-Food Chains. Foods 2021, 10, 342. [Google Scholar] [CrossRef] [PubMed]
- Dilucia, F.; Lacivita, V.; Conte, A.; Del Nobile, M.A. Sustainable Use of Fruit and Vegetable By-Products to Enhance Food Packaging Performance. Foods 2020, 9, 857. [Google Scholar] [CrossRef] [PubMed]
- Mak, T.N.; Caldeira, S. The role of nutrition in active and healthy ageing. Luxemb. Publ. Off. Eur. Union EUR 2014. Available online: https://data.europa.eu/doi/10.2788/83625 (accessed on 10 January 2022).
- Chen, S.-Q.; Wang, Z.-S.; Ma, Y.-X.; Zhang, W.; Lu, J.-L.; Liang, Y.-R.; Zheng, X.-Q. Neuroprotective Effects and Mechanisms of Tea Bioactive Components in Neurodegenerative Diseases. Molecules 2018, 23, 512. [Google Scholar] [CrossRef] [Green Version]
- Rahman, M.M.; Rahaman, M.S.; Islam, M.R.; Rahman, F.; Mithi, F.M.; Alqahtani, T.; Almikhlafi, M.A.; Alghamdi, S.Q.; Alruwaili, A.S.; Hossain, M.S.; et al. Role of Phenolic Compounds in Human Disease: Current Knowledge and Future Prospects. Molecules 2022, 27, 233. [Google Scholar] [CrossRef]
- Soares, S.; Garcia-Estevez, I.; Ferrer-Galego, R.; Bras, N.F.; Brandao, E.; Silva, M.; Teixeira, N.; Fonseca, F.; Sousa, S.F.; Ferreira-da-Silva, F.; et al. Study of human salivary proline-rich proteins interaction with food tannins. Food Chem. 2018, 243, 175–185. [Google Scholar] [CrossRef]
- He, M.; Tian, H.; Luo, X.; Qi, X.; Chen, X. Molecular Progress in Research on Fruit Astringency. Molecules 2015, 20, 1434. [Google Scholar] [CrossRef] [Green Version]
- Soares, S.; Brandão, E.; Guerreiro, C.; Soares, S.; Mateus, N.; de Freitas, V. Tannins in Food: Insights into the Molecular Perception of Astringency and Bitter Taste. Molecules 2020, 25, 2590. [Google Scholar] [CrossRef]
- Linne, B.; Simons, C.T. Quantification of Oral Roughness Perception and Comparison with Mechanism of Astringency Perception. Chem. Senses 2017, 42, 525–535. [Google Scholar] [CrossRef]
- Lamy, E.; Mosca, A.C.; Castelo, P.M. Editorial on the Research Topic Editorial: Food Oral Processing and Nutrition Through the Lifespan. Front. Nutr. 2021, 8, 376. [Google Scholar] [CrossRef]
- Huang, R.; Xu, C. An overview of the perception and mitigation of astringency associated with phenolic compounds. Compr. Rev. Food Sci. Food Saf. 2021, 20, 1036–1074. [Google Scholar] [CrossRef] [PubMed]
- Pires, M.A.; Pastrana, L.M.; Fuciños, P.; Abreu, C.S.; Oliveira, S.M. Sensorial Perception of Astringency: Oral Mechanisms and Current Analysis Methods. Foods 2020, 9, 1124. [Google Scholar] [CrossRef]
- ASTM. Standard Definitions of Terms Relating to Sensory Evaluation of Materials and Products; ASTM: Philadelphia, PA, USA, 1978. [Google Scholar]
- Kallithraka, S.; Bakker, J.; Clifford, M.; Vallis, L. Correlations between saliva protein composition and some T–I parameters of astringency. Food. Qual. Prefer. 2001, 12, 145–152. [Google Scholar] [CrossRef]
- Canon, F.; Belloir, C.; Bourillot, E.; Brignot, H.; Briand, L.; Feron, G.; Lesniewska, E.; Nivet, C.; Septier, C.; Schwartz, M.; et al. Perspectives on Astringency Sensation: An Alternative Hypothesis on the Molecular Origin of Astringency. J. Agric. Food Chem. 2021, 69, 3822–3826. [Google Scholar] [CrossRef]
- Carpenter, G. Role of saliva in the oral processing of food. In Food Oral Processing; Chen, J., Engelen, L., Eds.; Wiley-Blackwell: Hoboken, NJ, USA, 2012; pp. 45–60. [Google Scholar] [CrossRef]
- Ployon, S.; Morzel, M.; Belloir, C.; Bonnotte, A.; Bourillot, E.; Briand, L.; Lesniewska, E.; Lherminier, J.; Aybeke, E.; Canon, F. Mechanisms of astringency: Structural alteration of the oral mucosal pellicle by dietary tannins and protective effect of bPRPs. Food Chem. 2018, 253, 79–87. [Google Scholar] [CrossRef] [PubMed]
- Glendinning, J.I. Effect of salivary proline-rich proteins on ingestive responses to tannic acid in mice. Chem. Senses 1992, 17, 1–12. [Google Scholar] [CrossRef]
- Nayak, A.; Carpenter, G.H. A physiological model of tea-induced astringency. Physiol. Behav. 2008, 95, 290–294. [Google Scholar] [CrossRef]
- Doty Richard, L.; Shaman, P.; Applebaum Steven, L.; Giberson, R.; Siksorski, L.; Rosenberg, L. Smell Identification Ability: Changes with Age. Science 1984, 226, 1441–1443. [Google Scholar] [CrossRef]
- Schiffman, S.S. Influence of medications on taste and smell. World J. Otorhinolaryngol. Head Neck Surg. 2018, 4, 84–91. [Google Scholar] [CrossRef]
- Methven, L.; Allen, V.J.; Withers, C.A.; Gosney, M.A. Ageing and taste. Proc. Nutr. Soc. 2012, 71, 556–565. [Google Scholar] [CrossRef] [PubMed] [Green Version]
- Mojet, J.; Christ-Hazelhof, E.; Heidema, J. Taste perception with age: Generic or specific losses in threshold sensitivity to the five basic tastes? Chem. Senses 2001, 26, 845–860. [Google Scholar] [CrossRef] [PubMed] [Green Version]
- Barragán, R.; Coltell, O.; Portolés, O.; Asensio, E.M.; Sorlí, J.V.; Ortega-Azorín, C.; González, J.I.; Sáiz, C.; Fernández-Carrión, R.; Ordovas, J.M.; et al. Bitter, Sweet, Salty, Sour and Umami Taste Perception Decreases with Age: Sex-Specific Analysis, Modulation by Genetic Variants and Taste-Preference Associations in 18 to 80 Year-Old Subjects. Nutrients 2018, 10, 1539. [Google Scholar] [CrossRef] [Green Version]
- Sulmont-Rossé, C.; Maître, I.; Amand, M.; Symoneaux, R.; Van Wymelbeke, V.; Caumon, E.; Tavarès, J.; Issanchou, S. Evidence for different patterns of chemosensory alterations in the elderly population: Impact of age versus dependency. Chem. Senses 2015, 40, 153–164. [Google Scholar] [CrossRef] [Green Version]
- Sergi, G.; Bano, G.; Pizzato, S.; Veronese, N.; Manzato, E. Taste loss in the elderly: Possible implications for dietary habits. Crit. Rev. Food Sci. Nutr. 2017, 57, 3684–3689. [Google Scholar] [CrossRef]
- Schwartz, C.; Vandenberghe-Descamps, M.; Sulmont-Rossé, C.; Tournier, C.; Feron, G. Behavioral and physiological determinants of food choice and consumption at sensitive periods of the life span, a focus on infants and elderly. Innov. Food Sci. Emerg. Technol. 2018, 46, 91–106. [Google Scholar] [CrossRef]
- Muñoz-González, C.; Vandenberghe-Descamps, M.; Feron, G.; Canon, F.; Labouré, H.; Sulmont-Rossé, C. Association between salivary hypofunction and food consumption in the elderlies. A systematic literature review. J. Nutr. Health Aging 2018, 22, 407–419. [Google Scholar] [CrossRef]
- Xu, F.; Laguna, L.; Sarkar, A. Aging-related changes in quantity and quality of saliva: Where do we stand in our understanding? J. Texture Stud. 2019, 50, 27–35. [Google Scholar] [CrossRef] [Green Version]
- Iwasaki, M.; Yoshihara, A.; Ito, K.; Sato, M.; Minagawa, K.; Muramatsu, K.; Watanabe, R.; Manz, M.C.; Ansai, T.; Miyazaki, H. Hyposalivation and dietary nutrient intake among community-based older Japanese. Geriatr. Gerontol. Int. 2016, 16, 500–507. [Google Scholar] [CrossRef]
- Vandenberghe-Descamps, M.; Labouré, H.; Prot, A.; Septier, C.; Tournier, C.; Feron, G.; Sulmont-Rossé, C. Salivary flow decreases in healthy elderly people independently of dental status and drug intake. J. Texture Stud. 2016, 47, 353–360. [Google Scholar] [CrossRef]
- Muñoz-González, C.; Brulé, M.; Feron, G.; Canon, F. Does interindividual variability of saliva affect the release and metabolization of aroma compounds ex vivo? The particular case of elderly suffering or not from hyposalivation. J. Texture Stud. 2019, 50, 36–44. [Google Scholar] [CrossRef]
- Criado, C.; Muñoz-González, C.; Pozo-Bayón, M.Á. Differences in salivary flow and composition between age groups are correlated to dynamic retronasal aroma perception during wine consumption. Food. Qual. Prefer. 2021, 87, 104046. [Google Scholar] [CrossRef]
- Spence, C.; Youssef, J. Aging and the (Chemical) Senses: Implications for Food Behaviour Amongst Elderly Consumers. Foods 2021, 10, 168. [Google Scholar] [CrossRef] [PubMed]
- Nagler, R.M.; Hershkovich, O. Relationships between age, drugs, oral sensorial complaints and salivary profile. Arch. Oral Biol. 2005, 50, 7–16. [Google Scholar] [CrossRef] [PubMed]
- Bartoshuk, L.M.; Rifkin, B.; Marks, L.E.; Bars, P. Taste and Aging12. J. Gerontol. 1986, 41, 51–57. [Google Scholar] [CrossRef] [PubMed]
- Matsuo, R. Role of saliva in the maintenance of taste sensitivity. Crit. Rev. Oral Biol. Med. 2000, 11, 216–229. [Google Scholar] [CrossRef]
- Mese, H.; Matsuo, R. Salivary secretion, taste and hyposalivation. J. Oral Rehabil. 2007, 34, 711–723. [Google Scholar] [CrossRef]
- Feron, G. Unstimulated saliva: Background noise in taste molecules. J. Texture Stud. 2018, 50, 6–18. [Google Scholar] [CrossRef] [PubMed] [Green Version]
- Neyraud, E.; Palicki, O.; Schwartz, C.; Nicklaus, S.; Feron, G. Variability of human saliva composition: Possible relationships with fat perception and liking. Arch. Oral Biol. 2012, 57, 556–566. [Google Scholar] [CrossRef] [PubMed]
- Feron, G.; Poette, J. In-mouth mechanism leading to the perception of fat in humans: From detection to preferences. The particular role of saliva. OCL 2013, 20, 102–107. [Google Scholar] [CrossRef]
- Condelli, N.; Dinnella, C.; Cerone, A.; Monteleone, E.; Bertuccioli, M. Prediction of perceived astringency induced by phenolic compounds II: Criteria for panel selection and preliminary application on wine samples. Food Qual. Prefer. 2006, 17, 96–107. [Google Scholar] [CrossRef]
- Smith, A.K.; June, H.; Noble, A.C. Effects of viscosity on the bitterness and astringency of grape seed tannin. Food Qual. Prefer. 1996, 7, 161–166. [Google Scholar] [CrossRef]
- Fischer, U.; Boulton, R.B.; Noble, A.C. Physiological factors contributing to the variability of sensory assessments: Relationship between salivary flow rate and temporal perception of gustatory stimuli. Food Qual. Prefer. 1994, 5, 55–64. [Google Scholar] [CrossRef]
- Horne, J.; Hayes, J.; Lawless, H.T. Turbidity as a measure of salivary protein reactions with astringent substances. Chem. Senses 2002, 27, 653–659. [Google Scholar] [CrossRef] [PubMed] [Green Version]
- Guinard, J.-X.; Zoumas-Morse, C.; Walchak, C. Relation Between Parotid Saliva Flow and Composition and the Perception of Gustatory and Trigeminal Stimuli in Foods. Physiol. Behav. 1997, 63, 109–118. [Google Scholar] [CrossRef]
- Gibbins, H.L.; Carpenter, G.H. Alternative Mechanisms of Astringency—What Is the Role of Saliva? J. Texture Stud. 2013, 44, 364–375. [Google Scholar] [CrossRef]
- Shimada, T. Salivary proteins as a defense against dietary tannins. J. Chem. Ecol. 2006, 32, 1149–1163. [Google Scholar] [CrossRef]
- Soares, S.; Vitorino, R.; Osorio, H.; Fernandes, A.; Venancio, A.; Mateus, N.; Amado, F.; de Freitas, V. Reactivity of Human Salivary Proteins Families Toward Food Polyphenols. J. Agric. Food Chem. 2011, 59, 5535–5547. [Google Scholar] [CrossRef]
- Canon, F.; Ployon, S.; Mazauric, J.-P.; Sarni-Manchado, P.; Réfrégiers, M.; Giuliani, A.; Cheynier, V. Binding site of different tannins on a human salivary proline-rich protein evidenced by dissociative photoionization tandem mass spectrometry. Tetrahedron 2015, 71, 3039–3044. [Google Scholar] [CrossRef]
- De Sousa-Pereira, P.; Amado, F.; Abrantes, J.; Ferreira, R.; Esteves, P.J.; Vitorino, R. An evolutionary perspective of mammal salivary peptide families: Cystatins, histatins, statherin and PRPs. Arch. Oral Biol. 2013, 58, 451–458. [Google Scholar] [CrossRef]
- Smith, C.H.; Boland, B.; Daureeawoo, Y.; Donaldson, E.; Small, K.; Tuomainen, J. Effect of Aging on Stimulated Salivary Flow in Adults. J. Am. Geriatr. Soc. 2013, 61, 805–808. [Google Scholar] [CrossRef]
- Johnson, D.A.; Yeh, C.K.; Dodds, M.W.J. Effect of donor age on the concentrations of histatins in human parotid and submandibular/sublingual saliva. Arch. Oral Biol. 2000, 45, 731–740. [Google Scholar] [CrossRef]
- Baum, B.J.; Kousvelari, E.E.; Oppenheim, F.G. Exocrine Protein Secretion from Human Parotid Glands during Aging: Stable Release of the Acidic Proline-Rich Proteins. J. Gerontol. 1982, 37, 392–395. [Google Scholar] [CrossRef] [PubMed]
- Hettmansperger, T.P.; McKean, J.W. Robust Nonparametric Statistical Methods; CRC Press: Boca Raton, FL, USA, 2010. [Google Scholar]
- Abdullah, M.B. On a robust correlation coefficient. J. R. Stat. Soc. Ser. D (Stat.) 1990, 39, 455–460. [Google Scholar] [CrossRef]
- Schiffman, S.S.; Graham, B.G.; Suggs, M.S.; Sattely-Miller, E.A. Effect of psychotropic drugs on taste responses in young and elderly persons. Ann. N. Y. Acad. Sci. 1998, 855, 732–737. [Google Scholar] [CrossRef] [PubMed]
- Fluitman, K.S.; van den Broek, T.J.; Nieuwdorp, M.; Visser, M.; Ijzerman, R.G.; Keijser, B.J.F. Associations of the oral microbiota and Candida with taste, smell, appetite and undernutrition in older adults. Sci. Rep. 2021, 11, 23254. [Google Scholar] [CrossRef]
- Robichaud, J.L.; Noble, A.C. Astringency and bitterness of selected phenolics in wine. J. Sci. Food Agric. 1990, 53, 343–353. [Google Scholar] [CrossRef]
- Folstein, M.F.; Folstein, S.E.; McHugh, P.R. “Mini-mental state”: A practical method for grading the cognitive state of patients for the clinician. J. Psychiatr. Res. 1975, 12, 189–198. [Google Scholar] [CrossRef]
- Muñoz-González, C.; Canon, F.; Feron, G.; Guichard, E.; Pozo-Bayón, M.A. Assessment Wine Aroma Persistence by Using an in Vivo PTR-ToF-MS Approach and Its Relationship with Salivary Parameters. Molecules 2019, 24, 1277. [Google Scholar] [CrossRef] [Green Version]
- Esteban-Fernández, A.; Rocha-Alcubilla, N.; Muñoz-González, C.; Moreno-Arribas, M.V.; Pozo-Bayón, M.Á. Intra-oral adsorption and release of aroma compounds following in-mouth wine exposure. Food Chem. 2016, 205, 280–288. [Google Scholar] [CrossRef]
- Pittari, E.; Piombino, P.; Andriot, I.; Cheynier, V.; Cordelle, S.; Feron, G.; Gourrat, K.; Le Quéré, J.-L.; Meudec, E.; Moio, L.; et al. Effects of oenological tannins on aroma release and perception of oxidized and non-oxidized red wine: A dynamic real-time in-vivo study coupling sensory evaluation and analytical chemistry. Food Chem. 2022, 372, 131229. [Google Scholar] [CrossRef] [PubMed]
- Taladrid, D.; Lorente, L.; Bartolomé, B.; Moreno-Arribas, M.V.; Laguna, L. An integrative salivary approach regarding palate cleansers in wine tasting. J. Texture Stud. 2019, 50, 75–82. [Google Scholar] [CrossRef] [PubMed] [Green Version]
- Potvin, C.; Roff, D.A. Distribution-free and robust statistical methods: Viable alternatives to parametric statistics. Ecology 1993, 74, 1617–1628. [Google Scholar] [CrossRef]
- Croux, C.; Dehon, C. Influence functions of the Spearman and Kendall correlation measures. Stat. Methods Appl. 2010, 19, 497–515. [Google Scholar] [CrossRef] [Green Version]
- De Winter, J.C.; Gosling, S.D.; Potter, J. Comparing the Pearson and Spearman correlation coefficients across distributions and sample sizes: A tutorial using simulations and empirical data. Psychol. Methods 2016, 21, 273. [Google Scholar] [CrossRef]


Publisher’s Note: MDPI stays neutral with regard to jurisdictional claims in published maps and institutional affiliations. |
© 2022 by the authors. Licensee MDPI, Basel, Switzerland. This article is an open access article distributed under the terms and conditions of the Creative Commons Attribution (CC BY) license (https://creativecommons.org/licenses/by/4.0/).