
Newly Synthesized Thymol Derivative and Its Effect on Colorectal Cancer Cells


Abstract
:1. Introduction
2. Results
2.1. Proliferation Activity
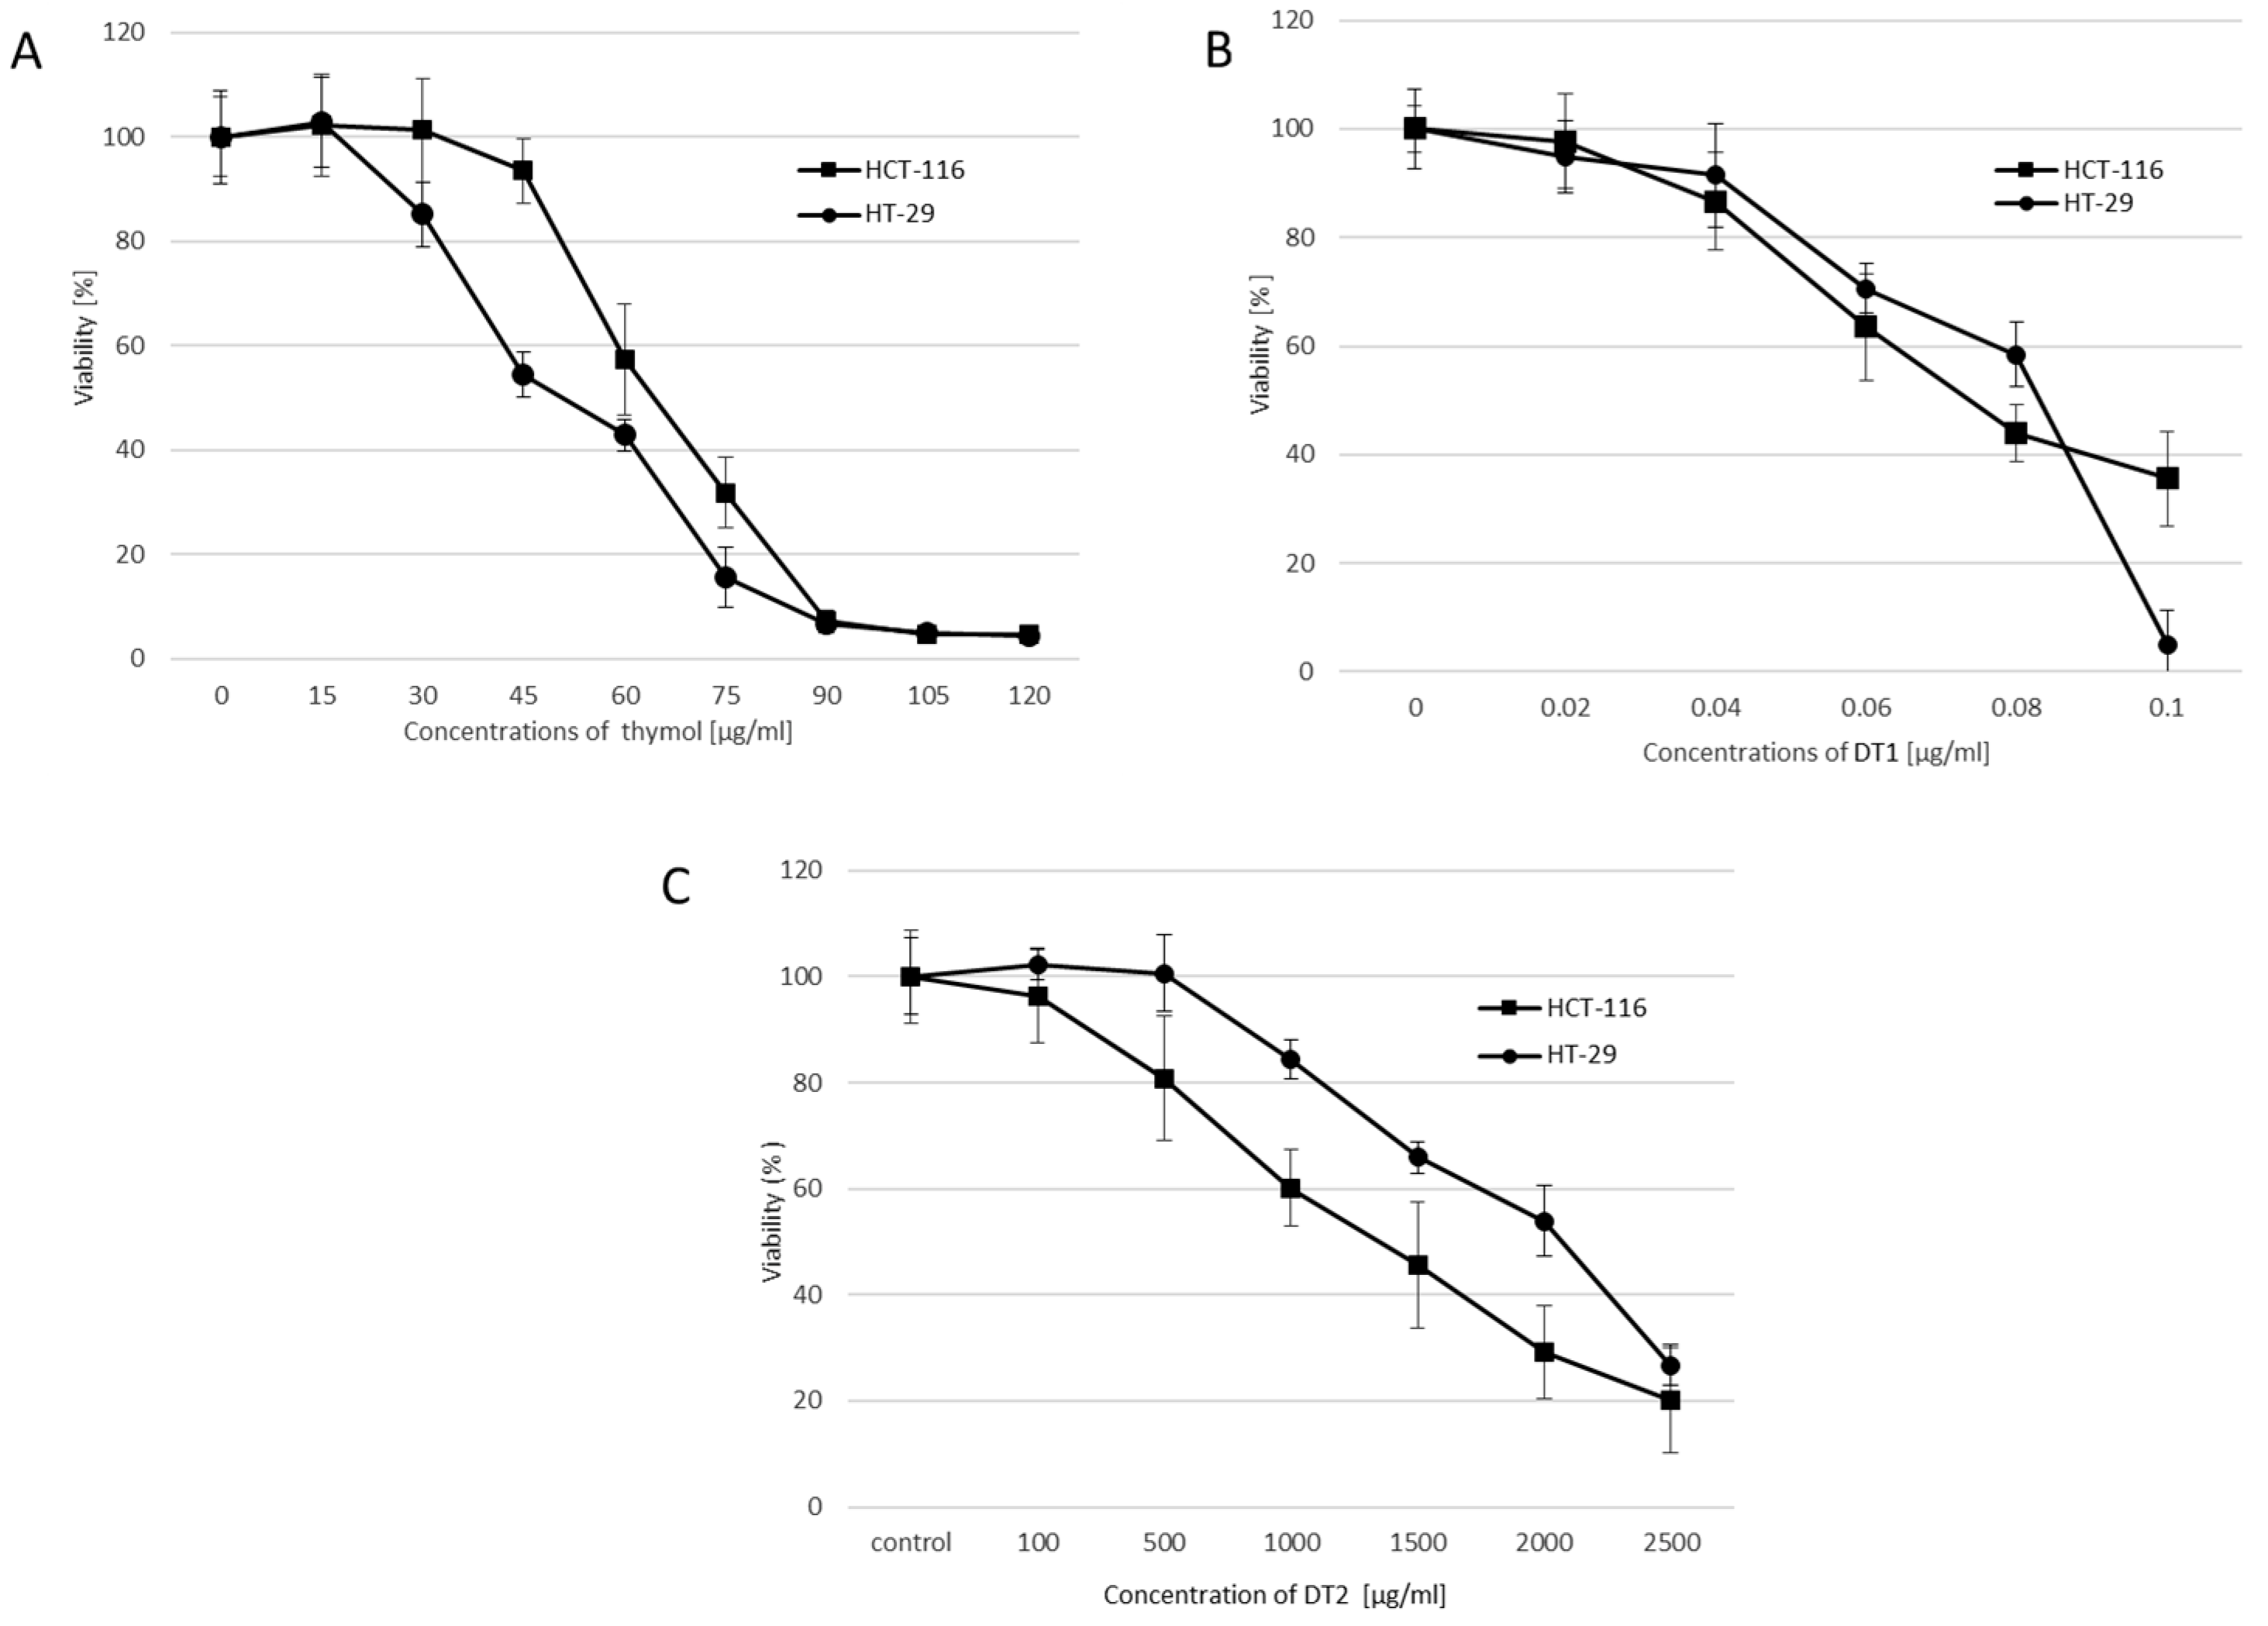
2.2. Cytotoxicity Effects
2.3. DNA-Damaging Effects
2.4. Formation of Micronuclei
2.5. ROS Production
3. Discussion
4. Materials and Methods
4.1. Cell Culture
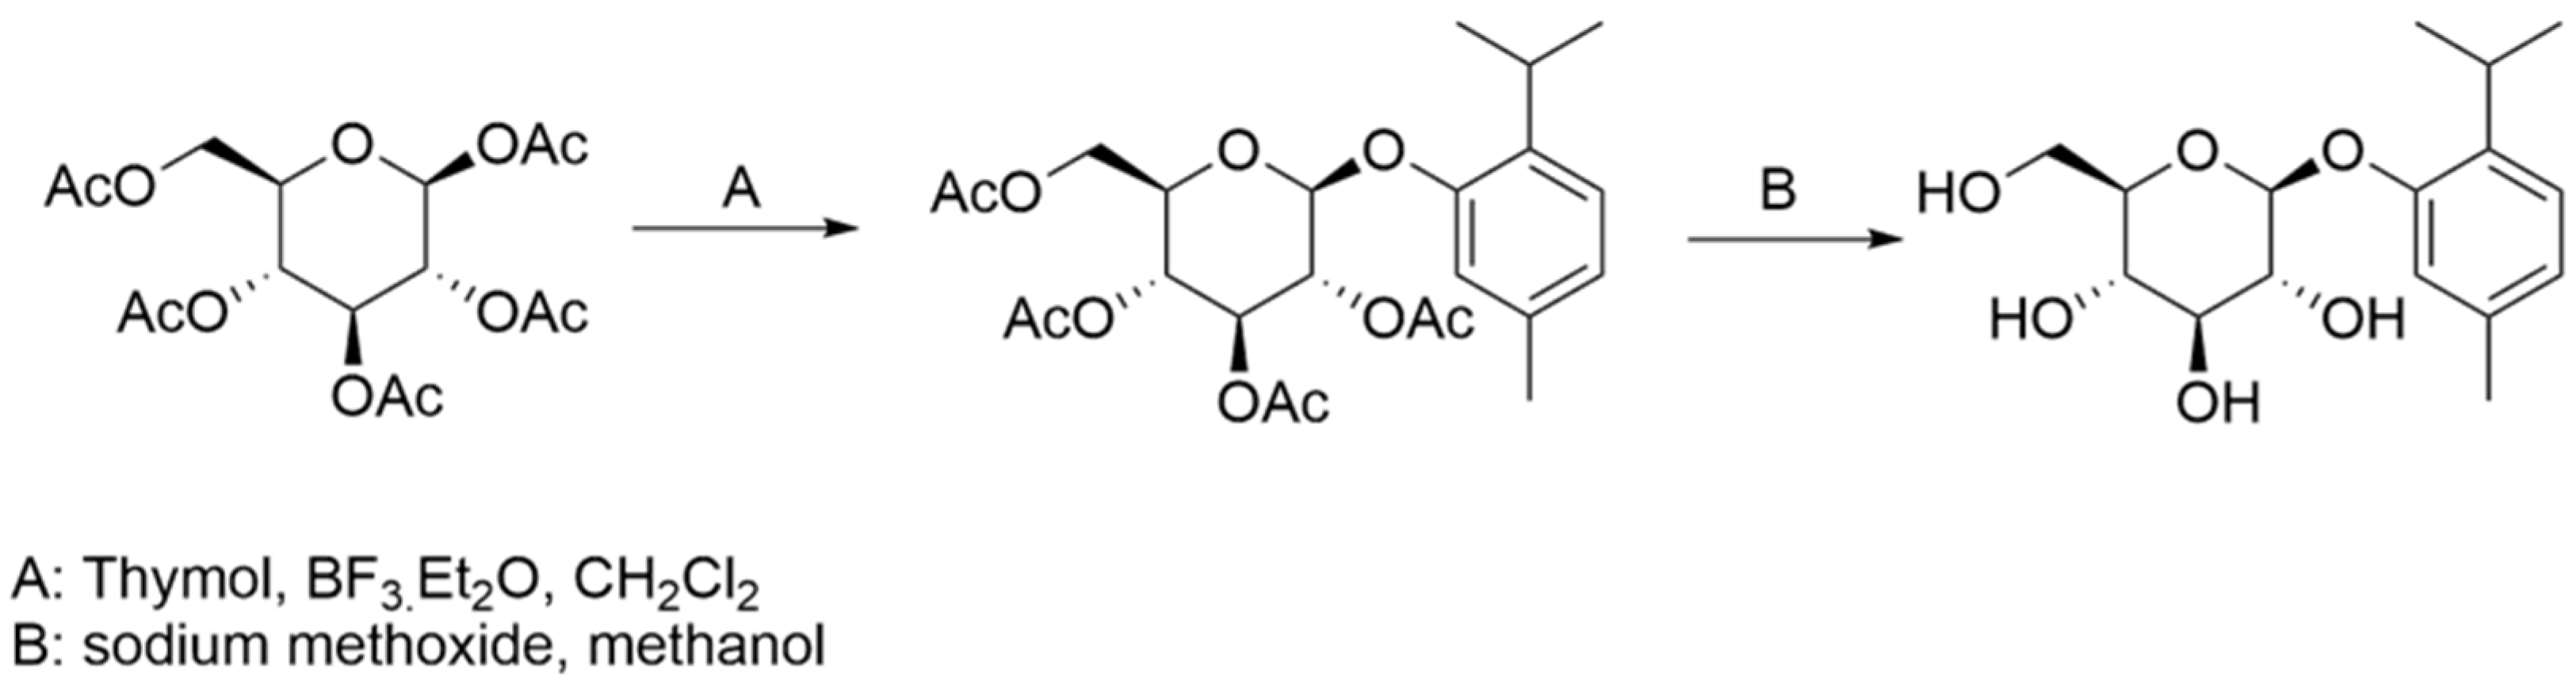
4.2. Chemicals
4.3. Determination of Cell Proliferation
4.4. Determination of Cytotoxicity (MTT Assay)
4.5. Determination of Genotoxicity (Comet Assay, SCGE)
4.6. Determination of Genotoxicity (Micronucleus Assay)
4.7. Determination of ROS Production
4.8. Statistical Analysis
5. Conclusions
Supplementary Materials
Author Contributions
Funding
Institutional Review Board Statement
Informed Consent Statement
Data Availability Statement
Conflicts of Interest
References
- Bray, F.; Ferlay, J.; Soerjomataram, I.; Siegel, R.L.; Torre, L.A.; Jemal, A. Global cancer statistics 2018: GLOBOCAN estimates of incidence and mortality worldwide for 36 cancers in 185 countries. CA Cancer J. Clin. 2018, 68, 394–424. [Google Scholar] [CrossRef] [PubMed] [Green Version]
- Nobili, S.; Lippi, D.; Witort, E.; Donnini, M.; Bausi, L.; Mini, E.; Capaccioli, S. Natural compounds for cancer treatment and prevention. Pharmacol. Res. 2009, 59, 365–378. [Google Scholar] [CrossRef] [PubMed]
- Salehi, B.; Prakash Mishra, A.; Shukla, I.; Sharifi-Rad, M.; del Mar Contreras, M.; Segura-Carretero, A.; Fathi, H.; Nasri Nasrabadi, N.; Kobarfard, F.; Sharifi-Rad, J. Thymol, thyme, and other plant sources: Health and potential uses. Phytother. Res. 2018, 32, 1688–1706. [Google Scholar] [CrossRef] [PubMed]
- Cañigueral, S.; Goyal, S.; Patel, R.C.; García, F.P.; Ojha, S.K.; Fizur, M.; Meeran, N.; Javed, H.; Al Taee, H. Pharmacological properties and molecular mechanisms of thymol: Prospects for its therapeutic potential and pharmaceutical development. Front. Pharmacol. 2017, 8, 380. [Google Scholar] [CrossRef] [Green Version]
- Thompson, J.D.; Chalchat, J.-C.; Andr’, A.; Michet, A.; Linhart, Y.B.; Ehlers, B. Qualitative and quantitative variation in monoterpene co-occurrence and composition in the essential oil of Thymus vulgaris chemotypes. J. Chem. Ecol. 2003, 29, 859–880. [Google Scholar] [CrossRef]
- Borugă, O.; Jianu, C.; Mişcă, C.; Goleţ, I.; Gruia, A.T.; Horhat, F.G. Thymus vulgaris essential oil: Chemical composition and antimicrobial activity. J. Med. Life 2014, 7, 56. [Google Scholar]
- Cohen, S. US Environmental Protection Agency, office of pesticide programs. I. Pomerantz (Environ. Prot. Agency Off.) 1984, 1172, 5–13. [Google Scholar]
- Marchese, A.; Orhan, I.E.; Daglia, M.; Barbieri, R.; Di Lorenzo, A.; Nabavi, S.F.; Gortzi, O.; Izadi, M.; Nabavi, S.M. Antibacterial and antifungal activities of thymol: A brief review of the literature. Food Chem. 2016, 210, 402–414. [Google Scholar] [CrossRef]
- Lv, R.; Chen, Z. Thymol inhibits cell migration and invasion by downregulating the activation of PI3K/AKT and ERK pathways in human colon cancer cells. Trop. J. Pharm. Res. 2018, 16, 2895–2901. [Google Scholar] [CrossRef] [Green Version]
- Chauhan, A.K.; Bahuguna, A.; Paul, S.; Kang, S.C. Thymol elicits HCT-116 colorectal carcinoma cell death through induction of oxidative stress. Anticancer. Agents Med. Chem. 2018, 17, 1942–1950. [Google Scholar] [CrossRef]
- Zeng, Q.; Che, Y.; Zhang, Y.; Chen, M.; Guo, Q.; Zhang, W. Thymol isolated from Thymus vulgaris L. inhibits colorectal cancer cell growth and metastasis by suppressing the Wnt/β-catenin pathway. Drug Des. Dev. Ther. 2020, 14, 2535–2547. [Google Scholar] [CrossRef] [PubMed]
- Sancheti, J.; Farooq Shaikh, M.; Chaudhari, R.; Somani, G.; Patil, S.; Jain, P.; Sathaye, S. Characterization of anticonvulsant and antiepileptogenic potential of thymol in various experimental models. Naunyn-Schmiedeberg’s Arch. Pharmacol. 2014, 387, 59–66. [Google Scholar] [CrossRef] [PubMed]
- Trombetta, D.; Castelli, F.; Sarpietro, M.G.; Venuti, V.; Cristani, M.; Daniele, C.; Saija, A.; Mazzanti, G.; Bisignano, G. Mechanisms of antibacterial action of three monoterpenes. Antimicrob. Agents Chemother. 2005, 49, 2474–2478. [Google Scholar] [CrossRef] [PubMed] [Green Version]
- Kang, M.; Loverde, S.M. Molecular simulation of the concentration-dependent interaction of hydrophobic drugs with model cellular membranes. J. Phys. Chem. B 2014, 118, 11965–11972. [Google Scholar] [CrossRef]
- Melo, J.; Fachin, A.; Rizo, W.; Jesus, H.; Arrigoni-Blank, M.; Alves, P.; Marins, M.; França, S.; Blank, A. Cytotoxic effects of essential oils from three Lippia gracilis Schauer genotypes on HeLa, B16, and MCF-7 cells and normal human fibroblasts. Genet. Mol. Res. 2014, 13, 2691–2697. [Google Scholar] [CrossRef]
- Khadir, A.; Sobeh, M.; Gad, H.A.; Benbelaid, F.; Bendahou, M.; Peixoto, H.; Sporer, F.; Ashour, M.L.; Wink, M. Chemical composition and biological activity of the essential oil from Thymus lanceolatus. Z. Naturforsch. C 2016, 71, 155–163. [Google Scholar] [CrossRef]
- Sertel, S.; Eichhorn, T.; Plinkert, P.K.; Efferth, T. Cytotoxicity of Thymus vulgaris essential oil towards human oral cavity squamous cell carcinoma. Anticancer Res. 2011, 31, 81–87. [Google Scholar]
- Aydın, E.; Turkez, H.; Tasdemir, S.; Hacımuftuoglu, F. Anticancer, antioxidant and cytotoxic potential of thymol in vitro brain tumor cell model. Cent. Nerv. Syst. Agents Med. Chem. 2017, 17, 116–122. [Google Scholar] [CrossRef]
- Al-Khayal, K.; Alafeefy, A.; Vaali-Mohammed, M.-A.; Mahmood, A.; Zubaidi, A.; Al-Obeed, O.; Khan, Z.; Abdulla, M.; Ahmad, R. Novel derivative of aminobenzenesulfonamide (3c) induces apoptosis in colorectal cancer cells through ROS generation and inhibits cell migration. BMC Cancer 2017, 17, 4. [Google Scholar] [CrossRef] [Green Version]
- Dimić, D.S.; Kaluđerović, G.N.; Avdović, E.H.; Milenković, D.A.; Živanović, M.N.; Potočňák, I.; Samoľová, E.; Dimitrijević, M.S.; Saso, L.; Marković, Z.S.; et al. Synthesis, Crystallographic, quantum chemical, antitumor, and molecular docking/dynamic studies of 4-hydroxycoumarin-neurotransmitter derivatives. Int. J. Mol. Sci. 2022, 23, 1001. [Google Scholar] [CrossRef]
- Al-Menhali, A.; Al-Rumaihi, A.; Al-Mohammed, H.; Al-Mazrooey, H.; Al-Shamlan, M.; Aljassim, M.; Al-Korbi, N.; Eid, A.H. Thymus vulgaris (thyme) inhibits proliferation, adhesion, migration, and invasion of human colorectal cancer cells. J. Med. Food 2015, 18, 54–59. [Google Scholar] [CrossRef] [PubMed]
- Thapa, D.; Richardson, A.J.; Zweifel, B.; Wallace, R.J.; Gratz, S.W. Genoprotective effects of essential oil compounds against oxidative and methylated DNA damage in human colon cancer cells. J. Food Sci. 2019, 84, 1979–1985. [Google Scholar] [CrossRef] [PubMed]
- Horváthová, E.; Sramková, M.; Lábaj, J.; Slamenová, D. Study of cytotoxic, genotoxic and DNA-protective effects of selected plant essential oils on human cells cultured in vitro. Neuro Endocrinol. Lett. 2006, 27 (Suppl 2), 44–47. [Google Scholar] [PubMed]
- Kozics, K.; Klusová, V.; Srančíková, A.; Mučaji, P.; Slameňová, D.; Hunáková, Ľ.; Kusznierewicz, B.; Horváthová, E. Effects of Salvia officinalis and Thymus vulgaris on oxidant-induced DNA damage and antioxidant status in HepG2 cells. Food Chem. 2013, 141, 2198–2206. [Google Scholar] [CrossRef]
- Ramos, A.A.; Pedro, D.; Collins, A.R.; Pereira-Wilson, C. Protection by Salvia extracts against oxidative and alkylation damage to DNA in human HCT15 and CO115 cells. J. Toxicol. Environ. Health. A 2012, 75, 765–775. [Google Scholar] [CrossRef]
- Aherne, S.A.; Kerry, J.P.; O’brien, N.M. Effects of plant extracts on antioxidant status and oxidant-induced stress in Caco-2 cells. Br. J. Nutr. 2007, 97, 321–328. [Google Scholar] [CrossRef] [Green Version]
- Llana-Ruiz-Cabello, M.; Maisanaba, S.; Puerto, M.; Prieto, A.I.; Pichardo, S.; Moyano, R.; González-Pérez, J.A.; Cameán, A.M. Genotoxicity evaluation of carvacrol in rats using a combined micronucleus and comet assay. Food Chem. Toxicol. 2016, 98, 240–250. [Google Scholar] [CrossRef]
- Schieber, M.; Chandel, N.S. ROS function in redox signaling and oxidative stress. Curr. Biol. 2014, 24, 453–462. [Google Scholar] [CrossRef] [Green Version]
- Lu, J.; Holmgren, A. The thioredoxin antioxidant system. Free Radic. Biol. Med. 2014, 66, 75–87. [Google Scholar] [CrossRef]
- Li, C.; Thompson, M.A.; Tamayo, A.T.; Zuo, Z.; Lee, J.; Vega, F.; Ford, R.J.; Pham, L. V Over-expression of Thioredoxin-1 mediates growth, survival, and chemoresistance and is a druggable target in diffuse large B-cell lymphoma. Oncotarget 2012, 3, 314. [Google Scholar] [CrossRef] [Green Version]
- Kang, S.H.; Kim, Y.S.; Kim, E.K.; Hwang, J.W.; Jeong, J.H.; Dong, X.; Lee, J.W.; Moon, S.H.; Jeon, B.T.; Park, P.J. Anticancer effect of thymol on AGS human gastric carcinoma cells. J. Microbiol. Biotechnol. 2016, 26, 28–37. [Google Scholar] [CrossRef] [PubMed]
- Jaya Balan, D.; Rajavel, T.; Das, M.; Sathya, S.; Jeyakumar, M.; Pandima Devi, K. Thymol induces mitochondrial pathway-mediated apoptosis via ROS generation, macromolecular damage and SOD diminution in A549 cells. Pharmacol. Rep. 1234, 73, 240–254. [Google Scholar] [CrossRef] [PubMed]
- Satooka, H.; Kubo, I. Effects of thymol on B16-F10 melanoma cells. J. Agric. Food Chem. 2012, 60, 2746–2752. [Google Scholar] [CrossRef] [PubMed]
- Artymovich, K.; Appledorn, D.M. A multiplexed method for kinetic measurements of apoptosis and proliferation using live-content imaging. Methods Mol. Biol. 2015, 1219, 35–42. [Google Scholar] [CrossRef] [PubMed]
- Liu, Y.; Peterson, D.A.; Kimura, H.; Schubert, D. Mechanism of cellular 3-(4,5-dimethylthiazol-2-yl)-2,5-diphenyltetrazolium bromide (MTT) reduction. J. Neurochem. 1997, 69, 581–593. [Google Scholar] [CrossRef]
- Collins, A.R. The comet assay for DNA damage and repair: Principles, applications, and limitations. Mol. Biotechnol. 2004, 26, 249–261. [Google Scholar] [CrossRef]
- Slameňová, D.; Horváthová, E.; Robichová, S.; Hrušovská, L.U.; Gábelová, A.; Kleibl, K.; Jakubíková, J.; Sedlák, J. Molecular and cellular influences of butylated hydroxyanisole on chinese hamster V79 cells treated with N-Methyl-N-nitro-N-nitrosoguanidine: Antimutagenicity of butylated hydroxyanisole. Environ. Mol. Mutagenesis 2003, 41, 28–36. [Google Scholar] [CrossRef]
- Ujhazy, E.; Chalupa, I.; Blasko, M.; Siracky, J.; Zeljenkova, D.; Nosar, R.; Benes, L. Genotoxicological study of the local anaesthetic pentacaine in vitro micronucleus test. Pharmazie 1988, 43, 560. [Google Scholar]


| Concentrations (μg/mL)/Cell Lines | HT-29 | HCT-116 |
|---|---|---|
| Negative control | 1,52 × 10⁴ ± 3845.1 | 4.1 × 10⁴ ± 4619.5 |
| Positive control | 2.9 × 10⁵ ± 17975.3 *** | 1.5 × 10⁶ ± 19035.1 *** |
| T 10 | 9.2 × 10³ ± 105.3 | 3.7 × 10⁴ ± 5288.5 |
| T 25 | 9.8 × 10³ ± 504.5 | 3.3 × 10⁴ ± 6778.1 |
| T 50 | 9.6 × 10³ ± 2076.1 | 3.1 × 10⁴ ± 2256.6 |
| T 60 | 8.7 × 10³ ± 1039.4 | 3.0 × 10⁴ ± 7231.1 |
| DT1 0.01 | 1.3 × 10⁴ ± 1406.6 | 4.2 × 10⁴ ± 195.8 |
| DT1 0.02 | 1.5 × 10⁴ ± 1162.2 | 5.2 × 10⁴ ± 478.0 |
| DT1 0.04 | 2.3 × 10⁴ ± 6162.2 | 4.9 × 10⁴ ± 4555.1 |
| DT1 0.08 | 5.8 × 10⁴ ± 7748.5 ** | 6.2 × 10⁴ ± 7018.2 * |
| DT2 500 | 1.2 × 10⁴ ± 2164.7 | 3.9 × 10⁴ ± 1952.8 |
| DT2 1000 | 1.6 × 10⁴ ± 1037.7 | 7.3 × 10⁴ ± 6570.4 ** |
| DT2 1500 | 3.2 × 10⁴ ± 5494.4 * | 9.4 × 10⁴ ± 4602.8 *** |
| DT3 2000 | 5.3 × 10⁴ ± 5360.1 ** | 7.9 × 10⁴ ± 3002.5 *** |
Publisher’s Note: MDPI stays neutral with regard to jurisdictional claims in published maps and institutional affiliations. |
© 2022 by the authors. Licensee MDPI, Basel, Switzerland. This article is an open access article distributed under the terms and conditions of the Creative Commons Attribution (CC BY) license (https://creativecommons.org/licenses/by/4.0/).
Share and Cite
Blažíčková, M.; Blaško, J.; Kubinec, R.; Kozics, K. Newly Synthesized Thymol Derivative and Its Effect on Colorectal Cancer Cells. Molecules 2022, 27, 2622. https://doi.org/10.3390/molecules27092622
Blažíčková M, Blaško J, Kubinec R, Kozics K. Newly Synthesized Thymol Derivative and Its Effect on Colorectal Cancer Cells. Molecules. 2022; 27(9):2622. https://doi.org/10.3390/molecules27092622
Chicago/Turabian StyleBlažíčková, Michaela, Jaroslav Blaško, Róbert Kubinec, and Katarína Kozics. 2022. "Newly Synthesized Thymol Derivative and Its Effect on Colorectal Cancer Cells" Molecules 27, no. 9: 2622. https://doi.org/10.3390/molecules27092622
APA StyleBlažíčková, M., Blaško, J., Kubinec, R., & Kozics, K. (2022). Newly Synthesized Thymol Derivative and Its Effect on Colorectal Cancer Cells. Molecules, 27(9), 2622. https://doi.org/10.3390/molecules27092622