
The Effect of Precipitation pH on Protein Recovery Yield and Emulsifying Properties in the Extraction of Protein from Cold-Pressed Rapeseed Press Cake

 ,
,  ,
,  , and
, and
Abstract
:1. Introduction
2. Materials and Methods
2.1. Raw Materials and Chemicals
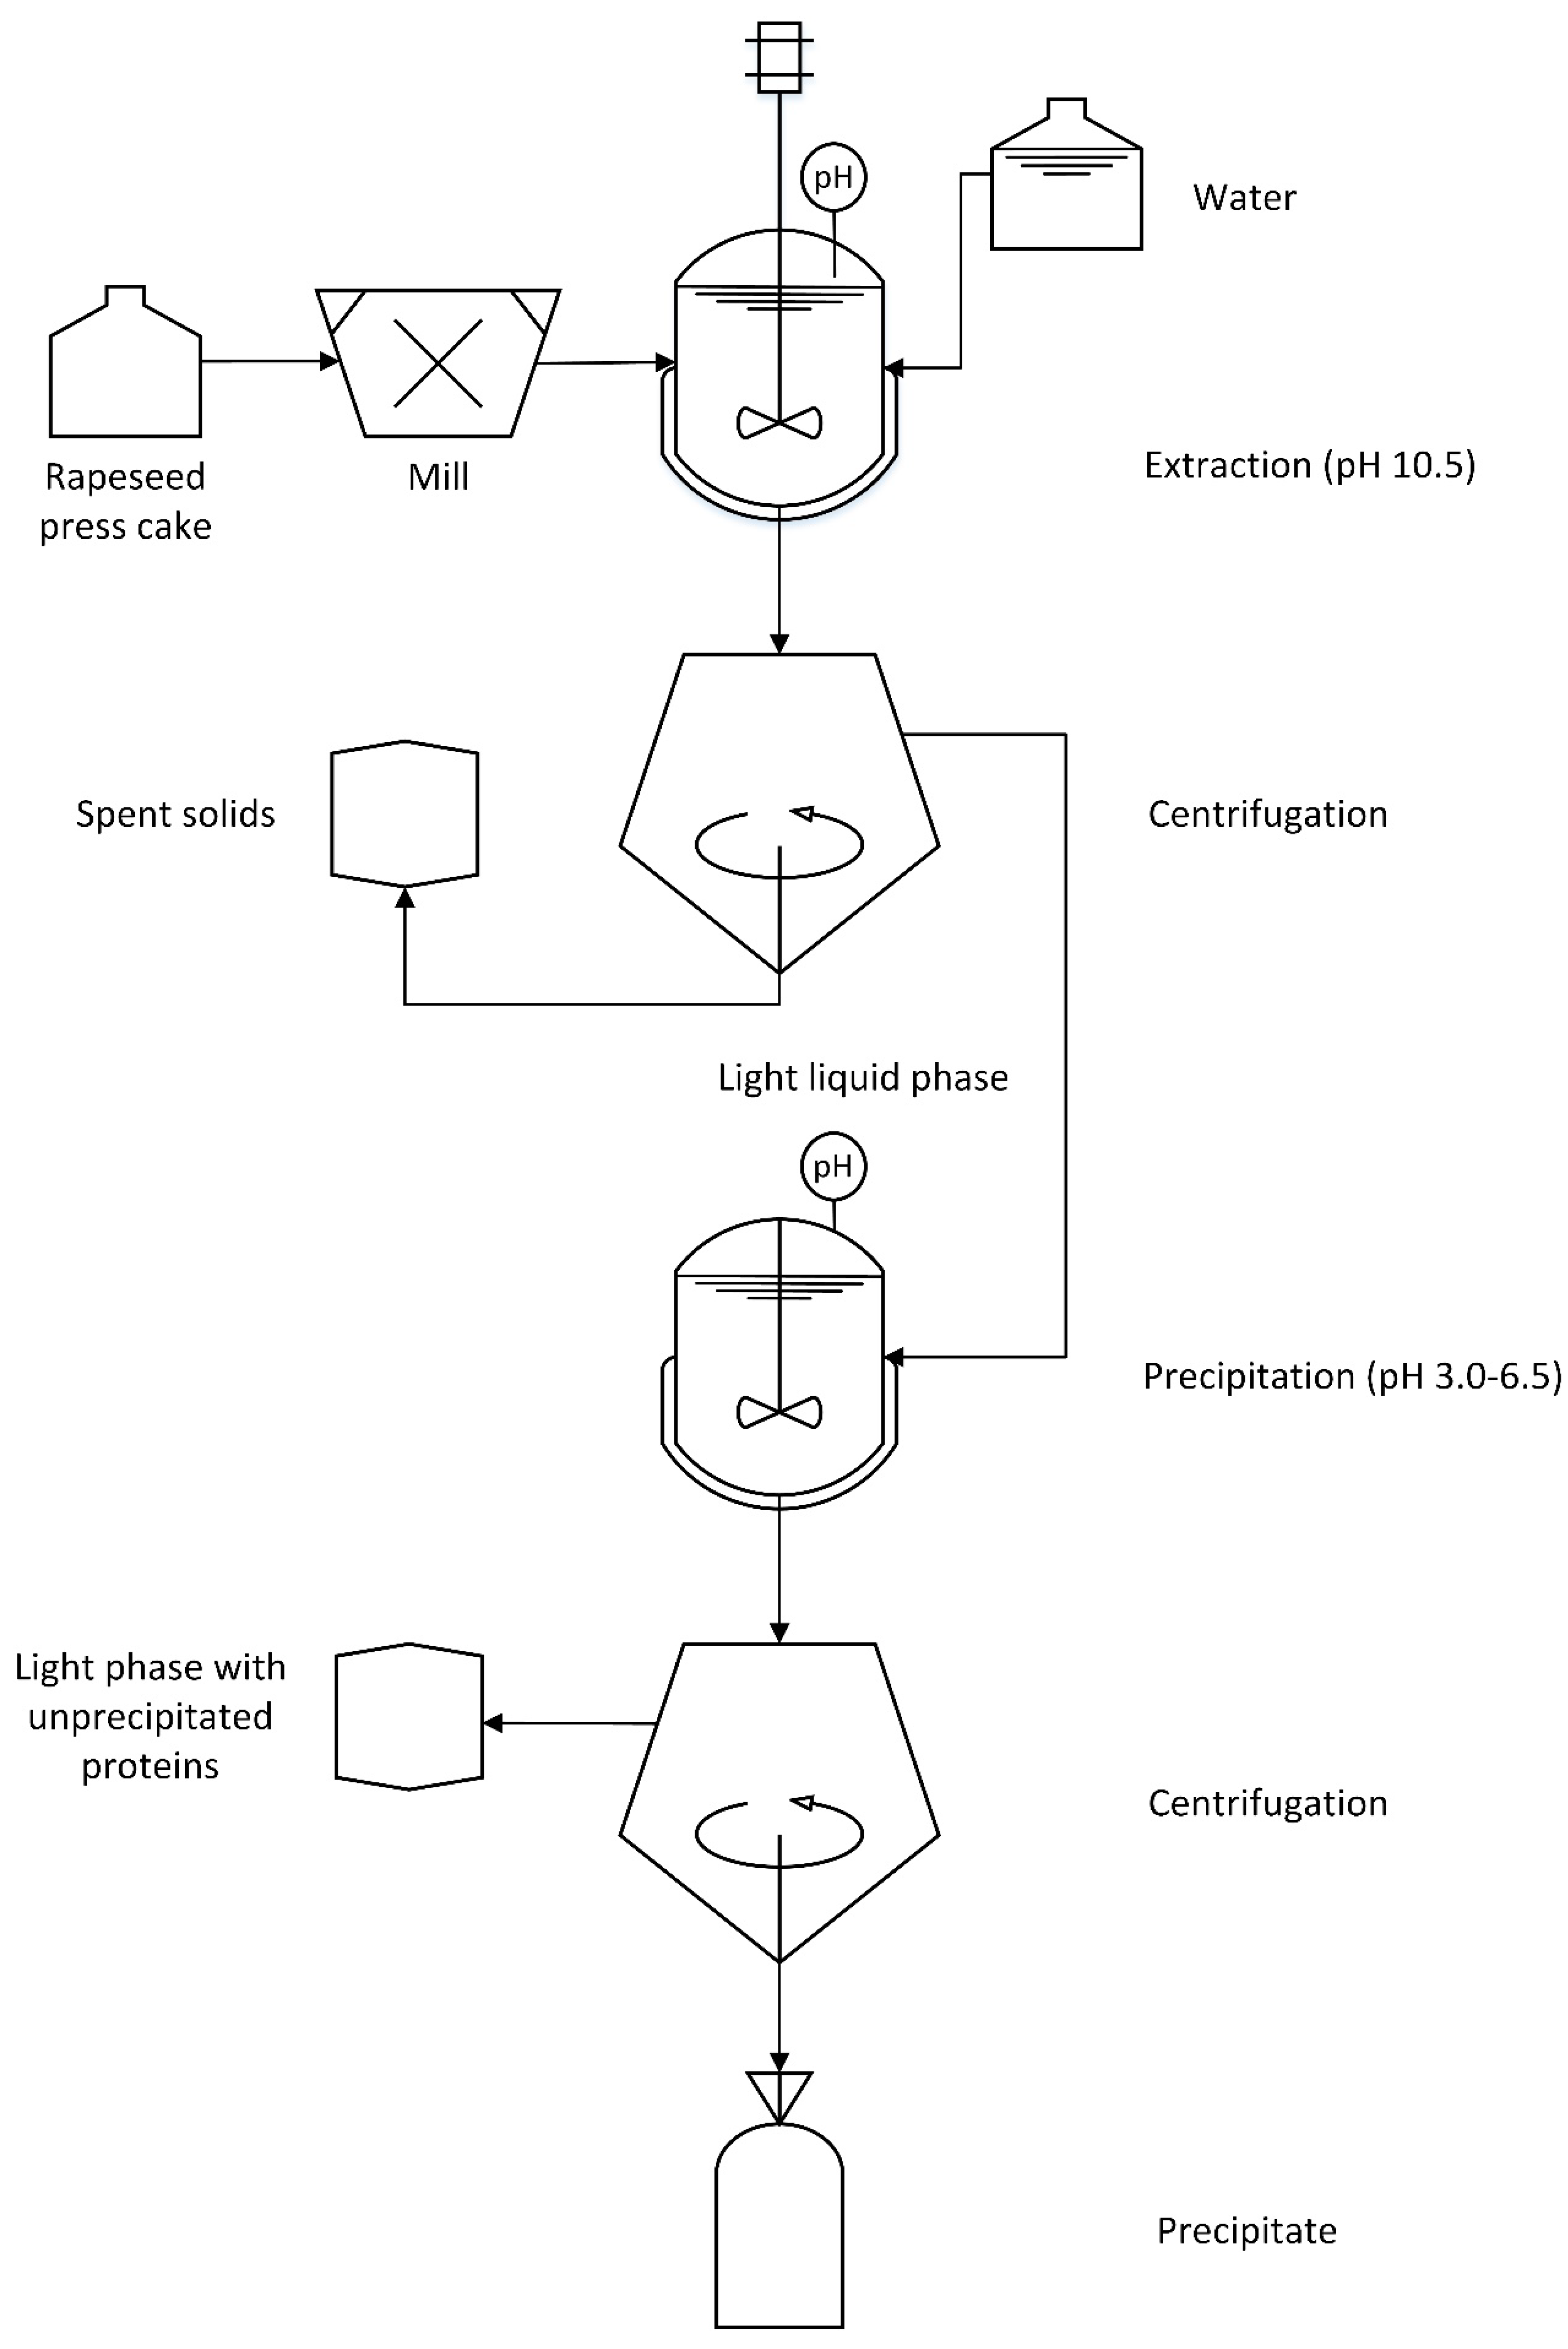
2.2. Protein Extraction and Recovery
2.3. Proximate Analysis
2.3.1. Dry Matter Content
2.3.2. Protein Concentration
2.4. Zeta Potential
2.5. Protein Profile Analysis
2.6. Emulsion Formulation and Particle Size Analysis
2.7. Emulsion Stability
2.8. Statistical Analysis
3. Result and Discussion
3.1. Extraction
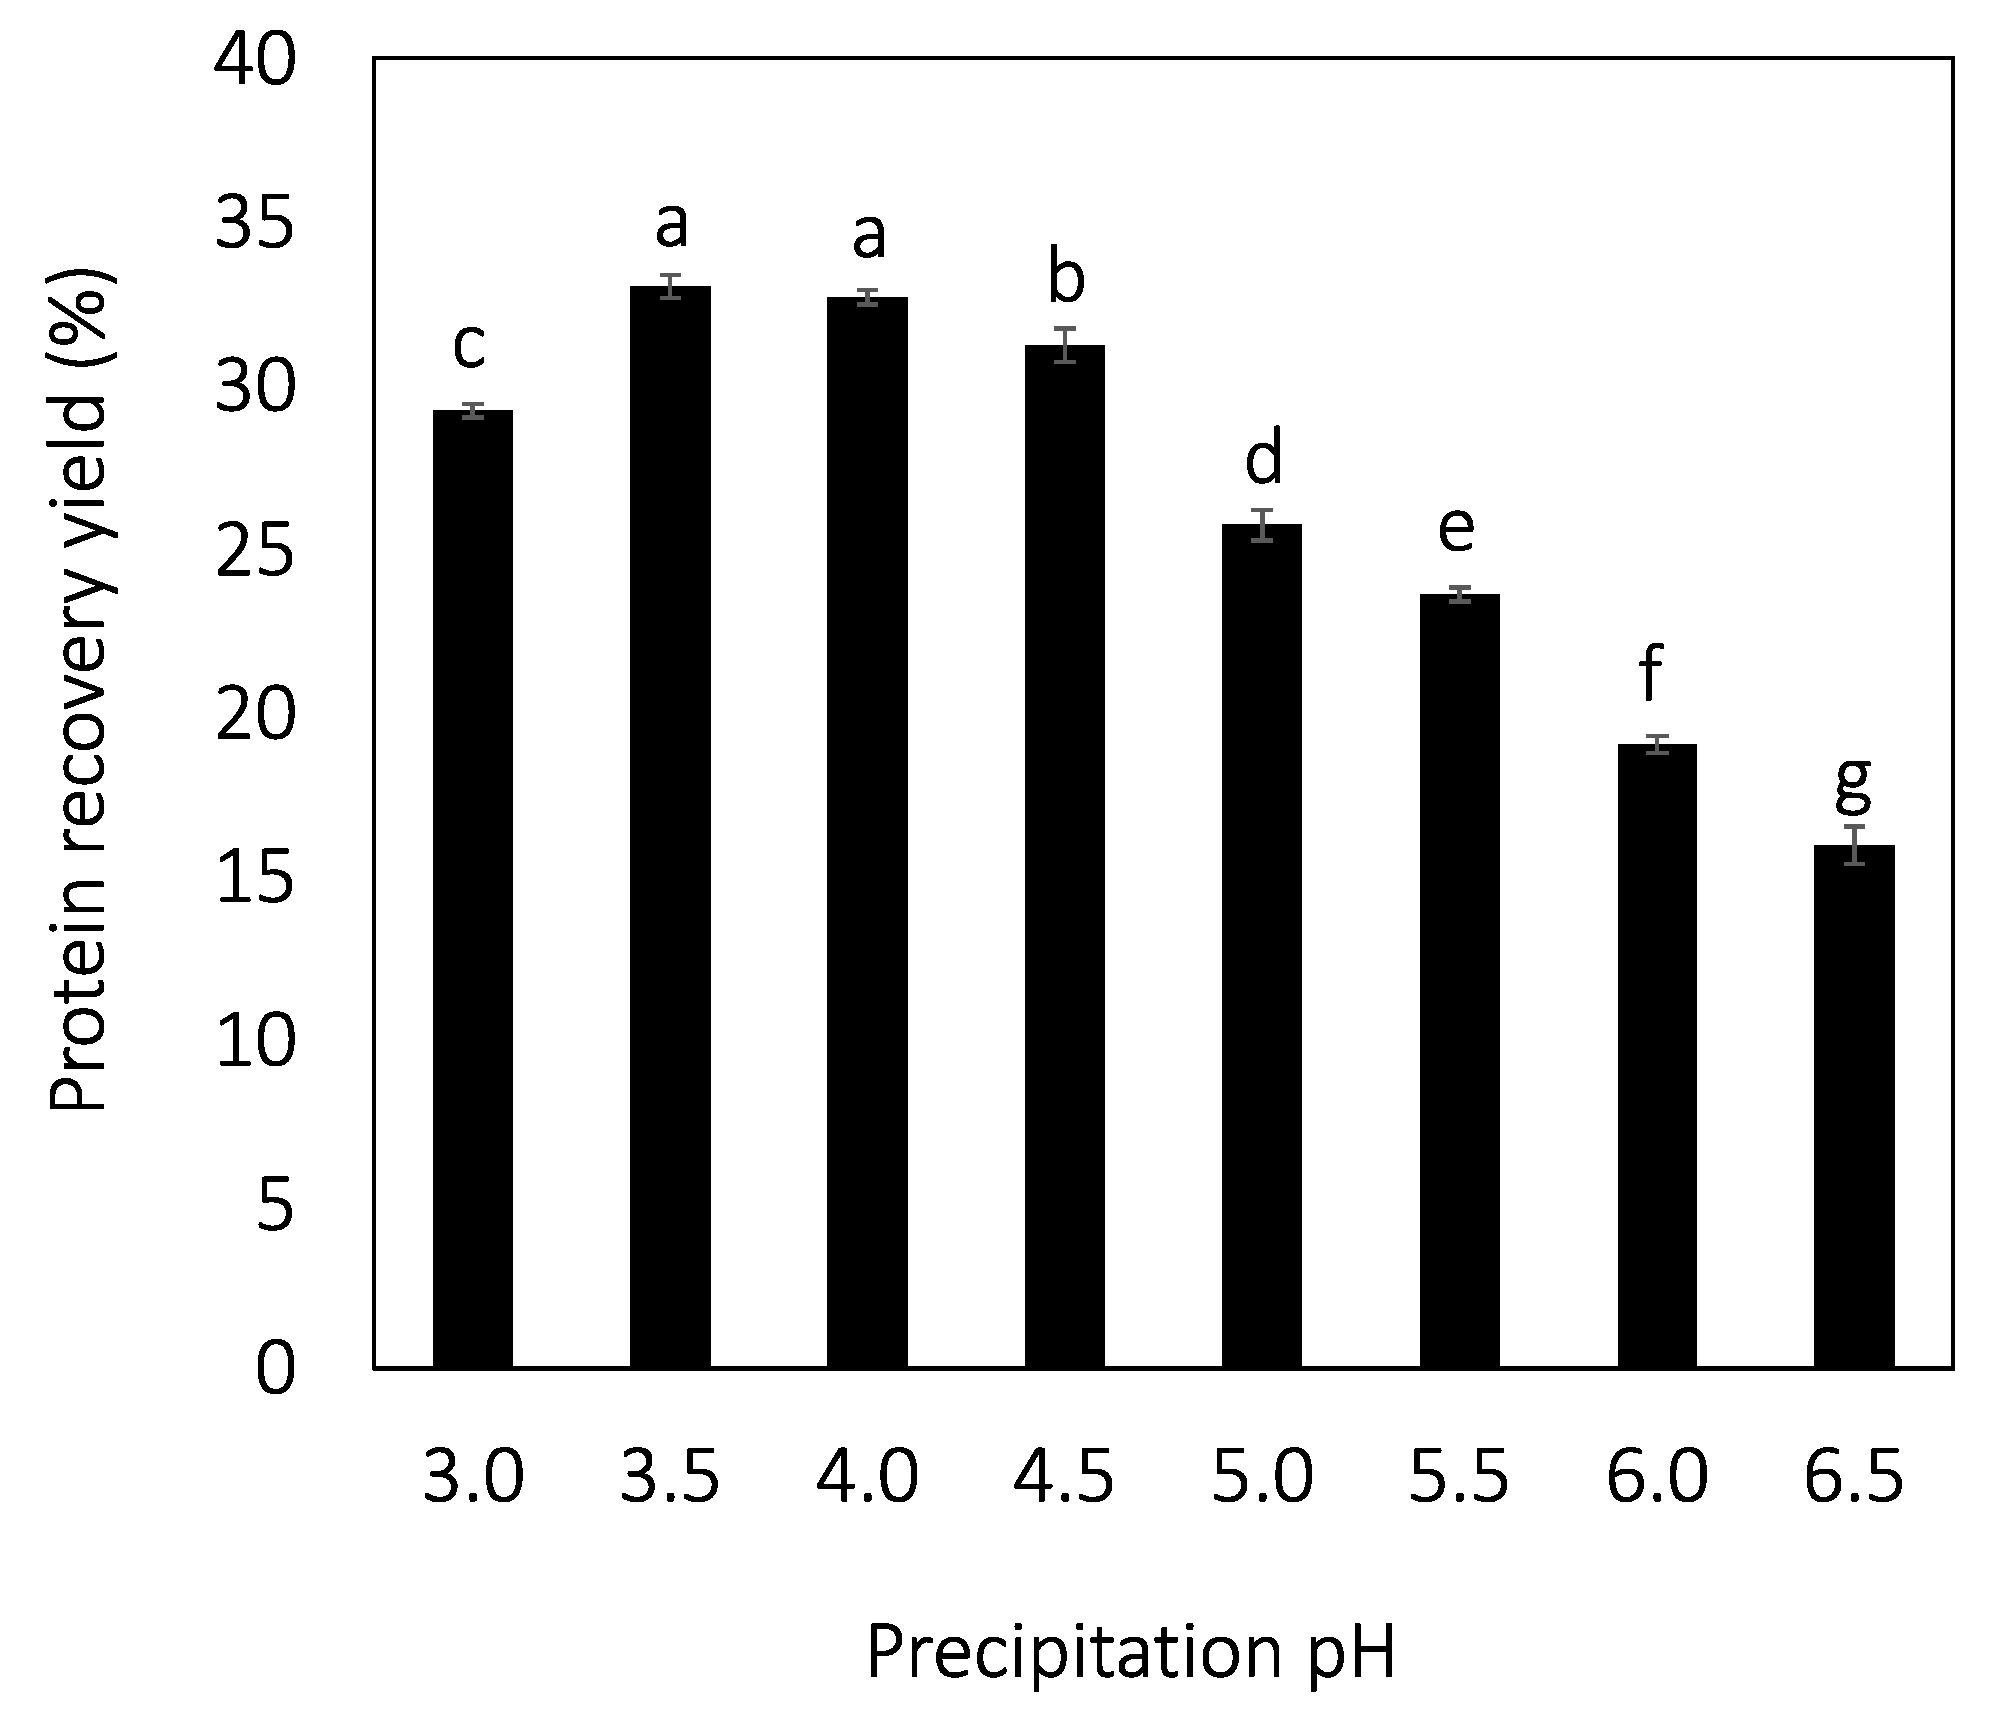
3.2. Precipitation
3.3. Zeta Potential
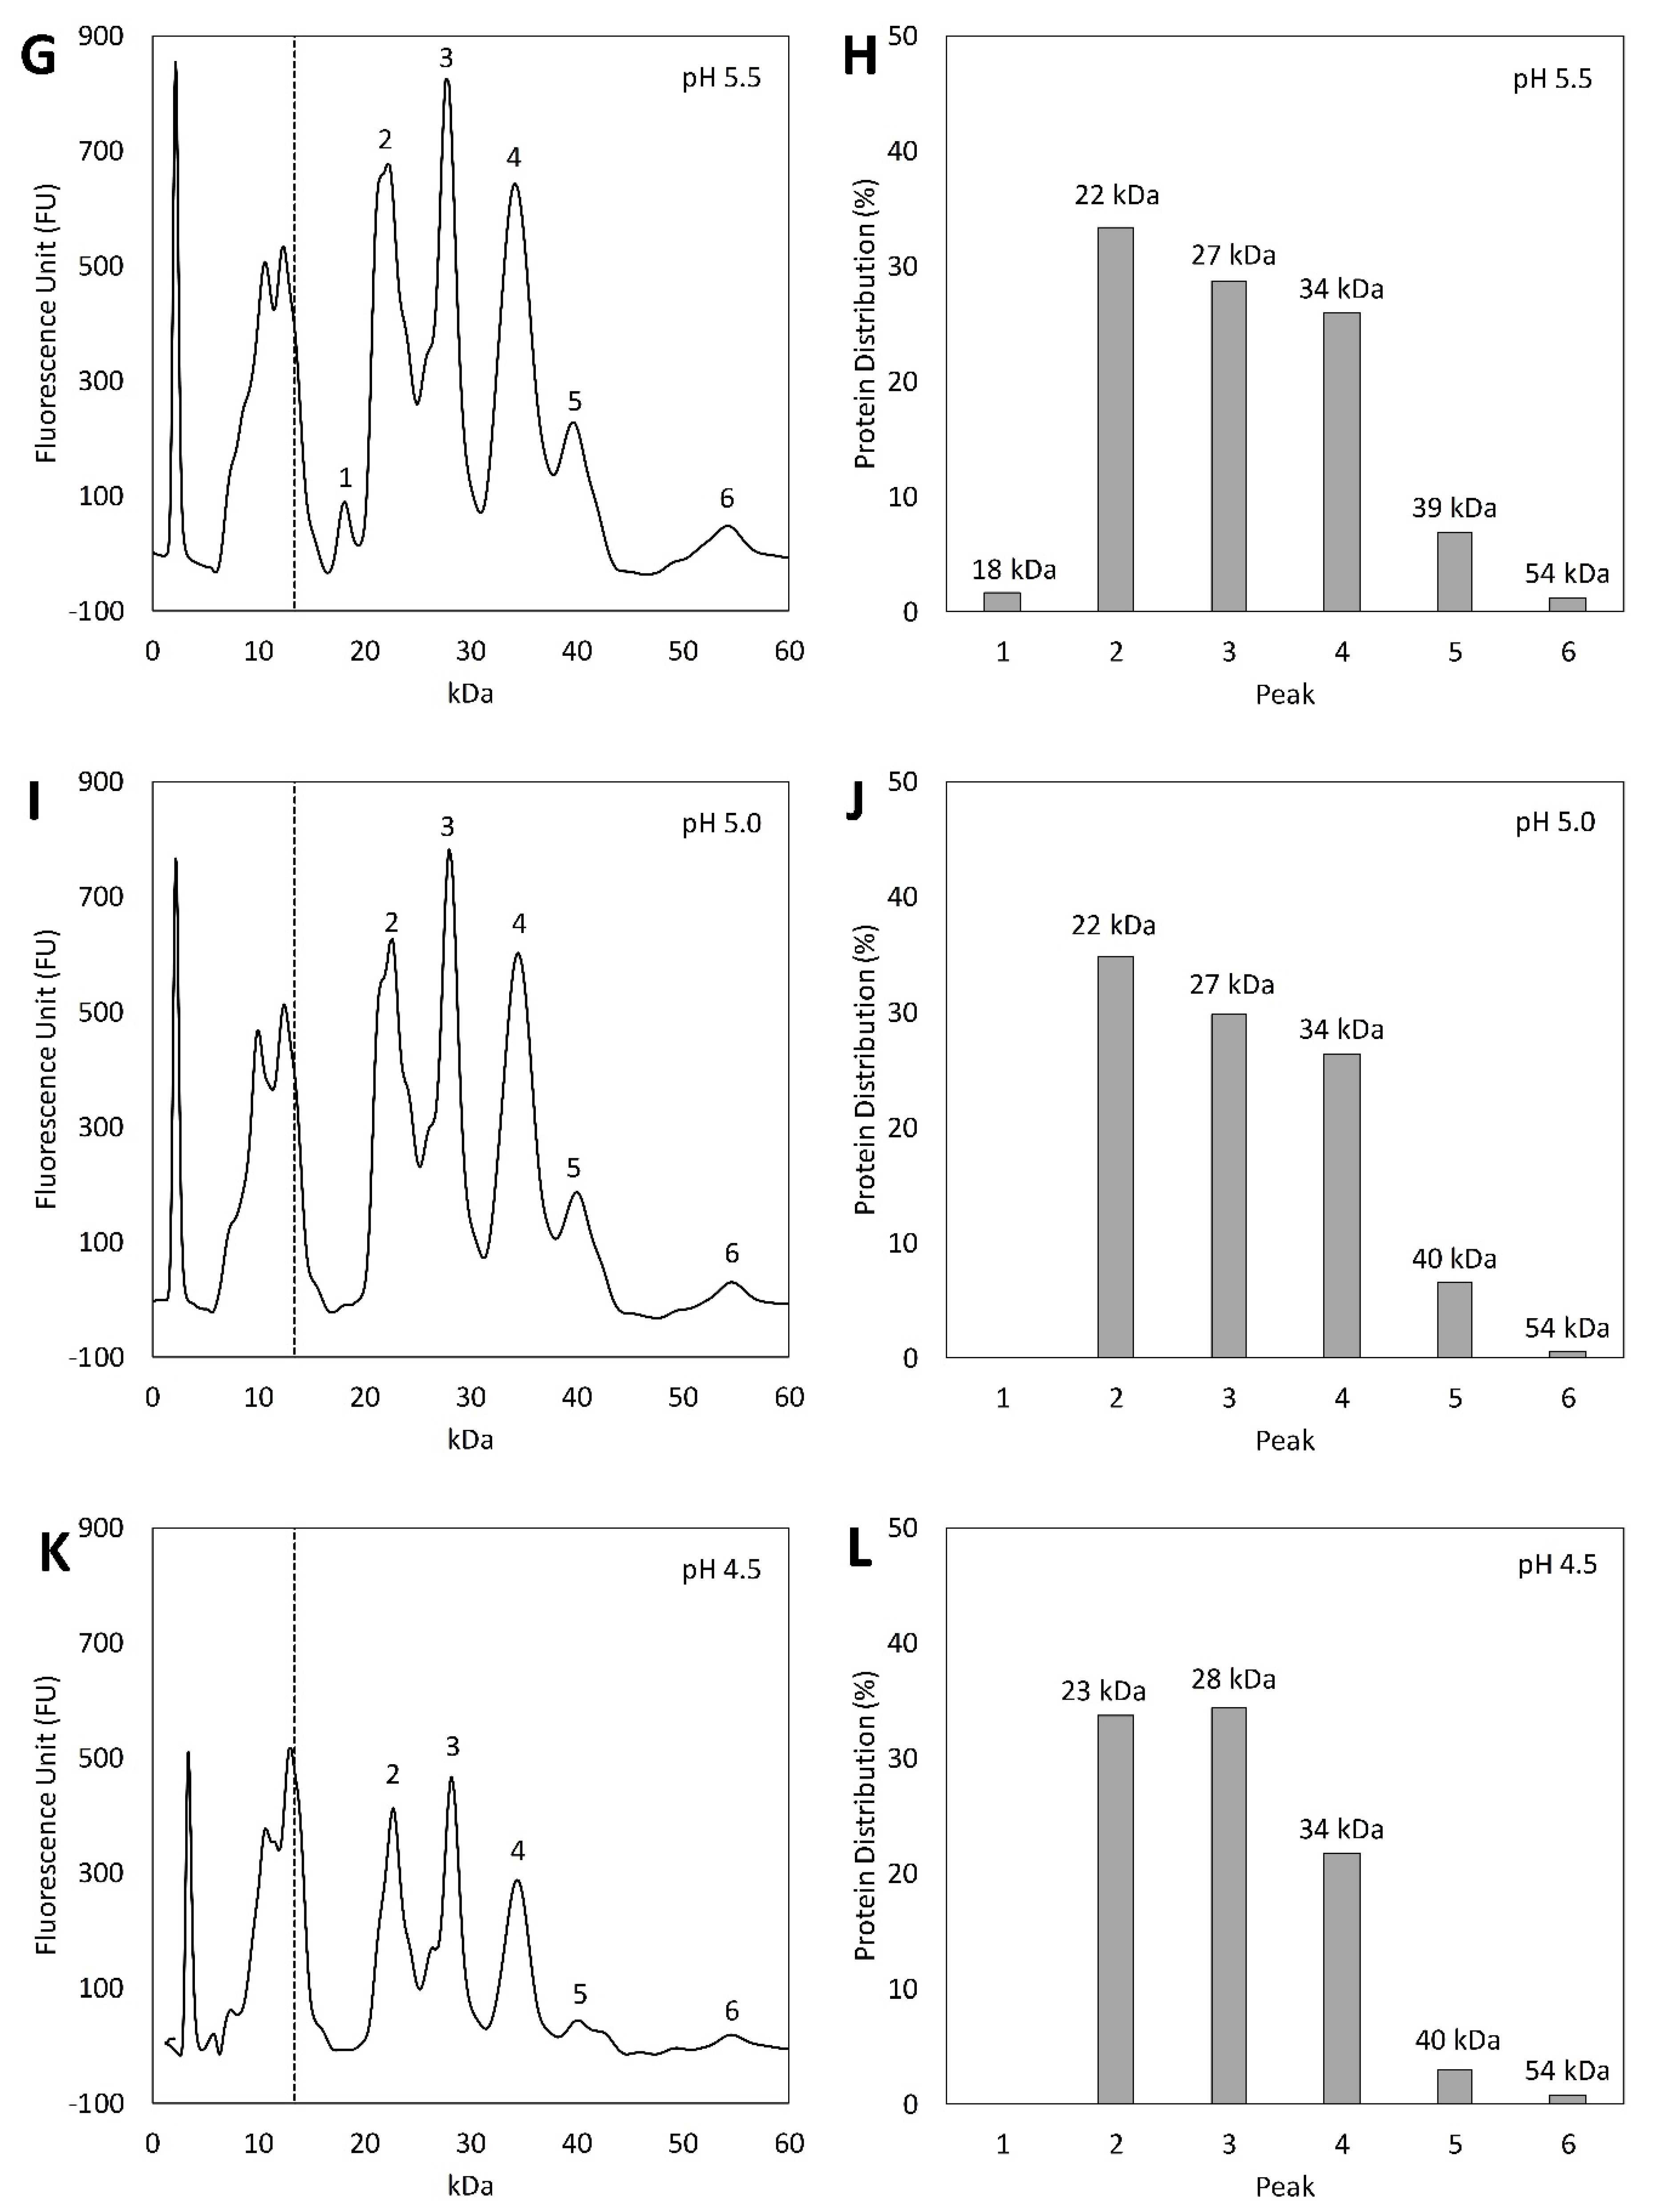
3.4. Protein Profile Analysis
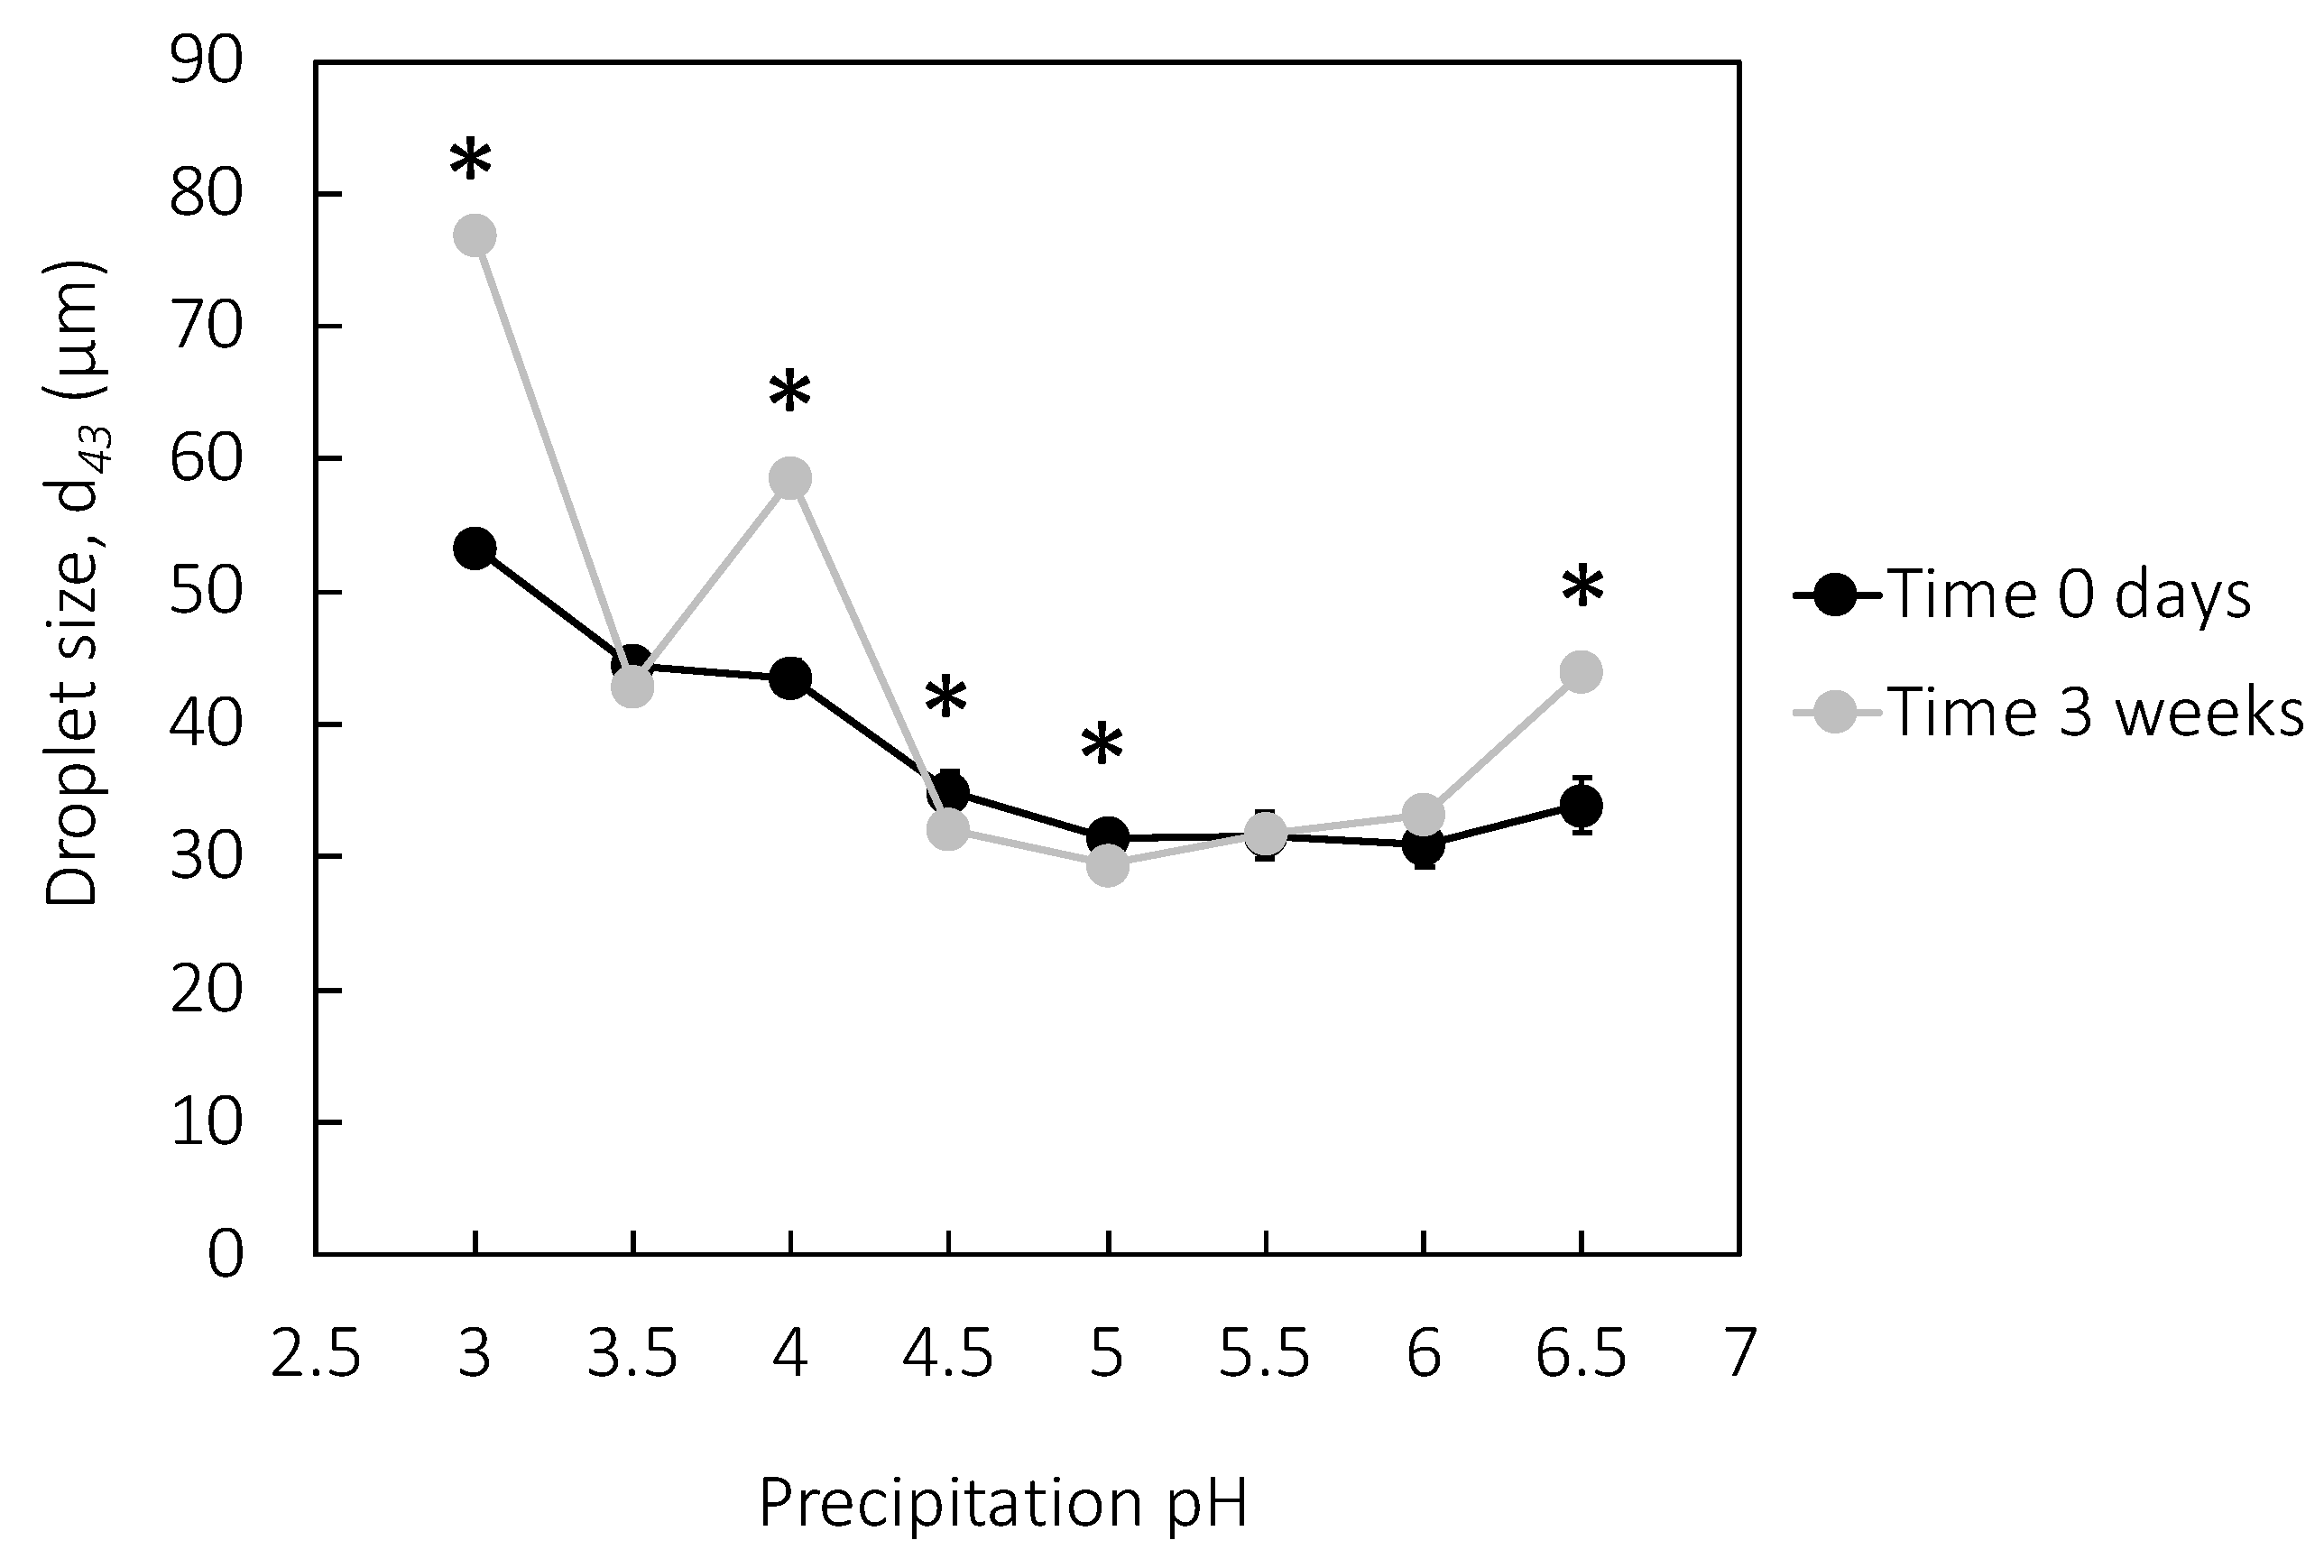
3.5. Emulsion Properties
3.6. Emulsion Stability
4. Conclusions
Supplementary Materials
Author Contributions
Funding
Data Availability Statement
Conflicts of Interest
References
- Jeske, S.; Zannini, E.; Arendt, E.K. Past, present and future: The strength of plant-based dairy substitutes based on gluten-free raw materials. Food Res. Int. 2018, 110, 42–51. [Google Scholar] [CrossRef] [PubMed]
- Willett, W.; Rockström, J.; Loken, B.; Springmann, M.; Lang, T.; Vermeulen, S.; Garnett, T.; Tilman, D.; DeClerck, F.; Wood, A.; et al. Food in the Anthropocene: The EAT–Lancet Commission on healthy diets from sustainable food systems. Lancet 2019, 393, 447–492. [Google Scholar] [CrossRef]
- Natural Resources Management and Environment Dept. Mitigation of Food Wastage. Societal Costs and Benefits; FAO: Rome, Italy, 2014. [Google Scholar]
- Du, M.; Sun, Z.; Liu, Z.; Yang, Y.; Liu, Z.; Wang, Y.; Jiang, B.; Feng, Z.; Liu, C. High efficiency desalination of wasted salted duck egg white and processing into food-grade pickering emulsion stabilizer. LWT 2022, 161, 113337. [Google Scholar] [CrossRef]
- Beisl, S.; Quehenberger, J.; Kamravamanesh, D.; Spadiut, O.; Friedl, A. Exploitation of Wheat Straw Biorefinery Side Streams as Sustainable Substrates for Microorganisms: A Feasibility Study. Processes 2019, 7, 956. [Google Scholar] [CrossRef] [Green Version]
- Prade, T.; Muneer, F.; Berndtsson, E.; Nynäs, A.-L.; Svensson, S.-E.; Newson, W.; Johansson, E. Protein fractionation of broccoli (Brassica oleracea, var. Italica) and kale (Brassica oleracea, var. Sabellica) residual leaves—A pre-feasibility assessment and evaluation of fraction phenol and fibre content. Food Bioprod. Process. 2021, 130, 229–243. [Google Scholar] [CrossRef]
- Wang, Q.; Liu, W.; Tian, B.; Li, D.; Liu, C.; Jiang, B.; Feng, Z. Preparation and Characterization of Coating Based on Protein Nanofibers and Polyphenol and Application for Salted Duck Egg Yolks. Foods 2020, 9, 449. [Google Scholar] [CrossRef] [Green Version]
- Ahlborn, J.; Stephan, A.; Meckel, T.; Maheshwari, G.; Rühl, M.; Zorn, H. Upcycling of food industry side streams by basidiomycetes for production of a vegan protein source. Int. J. Recycl. Org. Waste Agric. 2019, 8, 447–455. [Google Scholar] [CrossRef] [Green Version]
- Cacciotti, I.; Mori, S.; Cherubini, V.; Nanni, F. Eco-sustainable systems based on poly(lactic acid), diatomite and coffee grounds extract for food packaging. Int. J. Biol. Macromol. 2018, 112, 567–575. [Google Scholar] [CrossRef] [Green Version]
- Wanasundara, J.; Tan, S.; Alashi, A.; Pudel, F.; Blanchard, C. Proteins from canola/rapeseed: Current status. In Sustainable Protein Sources; Elsevier: Amsterdam, The Netherlands, 2017; pp. 285–304. [Google Scholar]
- Food and Agriculture Organization of the United Nations, F. FAOSTAT. 2016. Available online: http://www.fao.org/faostat/en/#home (accessed on 2 February 2022).
- Wu, J.; Muir, A. Comparative Structural, Emulsifying, and Biological Properties of 2 Major Canola Proteins, Cruciferin and Napin. J. Food Sci. 2008, 73, C210–C216. [Google Scholar] [CrossRef]
- Wanasundara, J.P.; McIntosh, T.C.; Perera, S.P.; Withana-Gamage, T.S.; Mitra, P. Canola/rapeseed protein-functionality and nutrition. OCL 2016, 23, D407. [Google Scholar] [CrossRef] [Green Version]
- Tan, S.H.; Mailer, R.J.; Blanchard, C.L.; Agboola, S.O. Canola Proteins for Human Consumption: Extraction, Profile, and Functional Properties. J. Food Sci. 2011, 76, R16–R28. [Google Scholar] [CrossRef] [PubMed] [Green Version]
- Fetzer, A.; Herfellner, T.; Stäbler, A.; Menner, M.; Eisner, P. Influence of process conditions during aqueous protein extraction upon yield from pre-pressed and cold-pressed rapeseed press cake. Ind. Crop. Prod. 2018, 112, 236–246. [Google Scholar] [CrossRef]
- CCC. Canola Council of Canada. Available online: www.canoalacouncil.org (accessed on 2 February 2022).
- Östbring, K.; Malmqvist, E.; Nilsson, K.; Rosenlind, I.; Rayner, M. The Effects of Oil Extraction Methods on Recovery Yield and Emulsifying Properties of Proteins from Rapeseed Meal and Press Cake. Foods 2019, 9, 19. [Google Scholar] [CrossRef] [PubMed] [Green Version]
- Chabanon, G.; Chevalot, I.; Framboisier, X.; Chenu, S.; Marc, I. Hydrolysis of rapeseed protein isolates: Kinetics, characterization and functional properties of hydrolysates. Process Biochem. 2007, 42, 1419–1428. [Google Scholar] [CrossRef]
- Fetzer, A.; Müller, K.; Schmid, M.; Eisner, P. Rapeseed proteins for technical applications: Processing, isolation, modification and functional properties—A review. Ind. Crop. Prod. 2020, 158, 112986. [Google Scholar] [CrossRef]
- Aluko, R.; McIntosh, T. Polypeptide profile and functional properties of defatted meals and protein isolates of canola seeds. J. Sci. Food Agric. 2001, 81, 391–396. [Google Scholar] [CrossRef]
- Aider, M.; Barbana, C. Canola proteins: Composition, extraction, functional properties, bioactivity, applications as a food ingredient and allergenicity—A practical and critical review. Trends Food Sci Technol. 2011, 22, 21–39. [Google Scholar] [CrossRef]
- Bérot, S.; Compoint, J.; Larre, C.; Malabat, C.; Guéguen, J. Large scale purification of rapeseed proteins (Brassica napus L.). J. Chromatogr. B 2005, 818, 35–42. [Google Scholar] [CrossRef]
- Schatzki, J.; Ecke, W.; Becker, H.C.; Möllers, C. Mapping of QTL for the seed storage proteins cruciferin and napin in a winter oilseed rape doubled haploid population and their inheritance in relation to other seed traits. Theor. Appl. Genet. 2014, 127, 1213–1222. [Google Scholar] [CrossRef]
- Wanasundara, J.P.D.; Abeysekara, S.J.; McIntosh, T.C.; Falk, K.C. Solubility Differences of Major Storage Proteins of Brassicaceae Oilseeds. J. Am. Oil Chem. Soc. 2011, 89, 869–881. [Google Scholar] [CrossRef]
- Perera, S.P.; McIntosh, T.C.; Wanasundara, J.P.D. Structural Properties of Cruciferin and Napin of Brassica napus (Canola) Show Distinct Responses to Changes in pH and Temperature. Plants 2016, 5, 36. [Google Scholar] [CrossRef] [PubMed] [Green Version]
- Akbari, A.; Wu, J. An integrated method of isolating napin and cruciferin from defatted canola meal. LWT 2015, 64, 308–315. [Google Scholar] [CrossRef]
- Jolivet, P.; Boulard, C.; Bellamy, A.; Larré, C.; Barre, M.; Rogniaux, H.; D’Andréa, S.; Chardot, T.; Nesi, N. Protein composition of oil bodies from mature Brassica napus seeds. Proteomics 2009, 9, 3268–3284. [Google Scholar] [CrossRef] [PubMed]
- Deleu, M.; Vaca-Medina, G.; Fabre, J.-F.; Roïz, J.; Valentin, R.; Mouloungui, Z. Interfacial properties of oleosins and phospholipids from rapeseed for the stability of oil bodies in aqueous medium. Colloids Surf. B Biointerfaces 2010, 80, 125–132. [Google Scholar] [CrossRef] [PubMed]
- Wijesundera, C.; Boiteau, T.; Xu, X.; Shen, Z.; Watkins, P.; Logan, A. Stabilization of Fish Oil-in-Water Emulsions with Oleosin Extracted from Canola Meal. J. Food Sci. 2013, 78, C1340–C1347. [Google Scholar] [CrossRef]
- Dong, X.-Y.; Guo, L.-L.; Wei, F.; Li, J.-F.; Jiang, M.-L.; Li, G.-M.; Zhao, Y.-D.; Chen, H. Some characteristics and functional properties of rapeseed protein prepared by ultrasonication, ultrafiltration and isoelectric precipitation. J. Sci. Food Agric. 2011, 91, 1488–1498. [Google Scholar] [CrossRef]
- Ntone, E.; van Wesel, T.; Sagis, L.M.; Meinders, M.; Bitter, J.H.; Nikiforidis, C.V. Adsorption of rapeseed proteins at oil/water interfaces. Janus-like napins dominate the interface. J. Colloid Interface Sci. 2020, 583, 459–469. [Google Scholar] [CrossRef]
- Krause, J.-P.; Schwenke, K. Behaviour of a protein isolate from rapeseed (Brassica napus) and its main protein components—Globulin and albumin—At air/solution and solid interfaces, and in emulsions. Colloids Surf. B 2001, 21, 29–36. [Google Scholar] [CrossRef]
- Tan, S.H.; Mailer, R.J.; Blanchard, C.L.; Agboola, S.O. Emulsifying properties of proteins extracted from Australian canola meal. LWT 2014, 57, 376–382. [Google Scholar] [CrossRef]
- Östbring, K.; Nilsson, K.; Ahlström, C.; Fridolfsson, A.; Rayner, M. Emulsifying and Anti-Oxidative Properties of Proteins Extracted from Industrially Cold-Pressed Rapeseed Press-Cake. Foods 2020, 9, 678. [Google Scholar] [CrossRef]
- Kuschel, M.; Neumann, T.; Barthmaier, P.; Kratzmeier, M. Use of lab-on-a-chip technology for protein sizing and quantitation. J. Biomol. Tech. JBT 2002, 13, 172–178. [Google Scholar]
- Zhang, Z.; He, S.; Liu, H.; Sun, X.; Ye, Y.; Cao, X.; Wu, Z.; Sun, H. Effect of pH regulation on the components and functional properties of proteins isolated from cold-pressed rapeseed meal through alkaline extraction and acid precipitation. Food Chem. 2020, 327, 126998. [Google Scholar] [CrossRef] [PubMed]
- Ghodsvali, A.; Khodaparast, M.H.; Vosoughi, M.; Diosady, L. Preparation of canola protein materials using membrane technology and evaluation of meals functional properties. Food Res. Int. 2005, 38, 223–231. [Google Scholar] [CrossRef]
- Manamperi, W.A.R.; Wiesenborn, D.P.; Chang, S.K.; Pryor, S.W. Effects of Protein Separation Conditions on the Functional and Thermal Properties of Canola Protein Isolates. J. Food Sci. 2011, 76, E266–E273. [Google Scholar] [CrossRef] [PubMed]
- Gerzhova, A.; Mondor, M.; Benali, M.; Aider, M. Study of total dry matter and protein extraction from canola meal as affected by the pH, salt addition and use of zeta-potential/turbidimetry analysis to optimize the extraction conditions. Food Chem. 2016, 201, 243–252. [Google Scholar] [CrossRef] [PubMed]
- Quinn, J.; Jones, J. Rapeseed Protein. pH Solubility and Electrophoretic Characteristics. Can. Inst. Food Sci. Technol. J. 1976, 9, 47–51. [Google Scholar] [CrossRef]
- Pedroche, J.; Yust, M.D.M.; Lqari, H.; Giron-Calle, J.; Alaiz, M.; Vioque, J.; Millán, F. Brassica carinata protein isolates: Chemical composition, protein characterization and improvement of functional properties by protein hydrolysis. Food Chem. 2004, 88, 337–346. [Google Scholar] [CrossRef]
- Rayner, M. Current status on novel ways for stabilizing food dispersions by oleosins, particles and microgels. Curr. Opin. Food Sci. 2015, 3, 94–109. [Google Scholar] [CrossRef]
- Qu, W.; Zhang, X.; Han, X.; Wang, Z.; He, R.; Ma, H. Structure and functional characteristics of rapeseed protein isolate-dextran conjugates. Food Hydrocoll. 2018, 82, 329–337. [Google Scholar] [CrossRef]
- Lorenz, M.; Alkhafadji, L.; Stringano, E.; Nilsson, S.; Mueller-Harvey, I.; Udén, P. Relationship between condensed tannin structures and their ability to precipitate feed proteins in the rumen. J. Sci. Food Agric. 2014, 94, 963–968. [Google Scholar] [CrossRef]
- Östbring, K.; Matos, M.; Marefati, A.; Ahlström, C.; Gutiérrez, G. The Effect of pH and Storage Temperature on the Stability of Emulsions Stabilized by Rapeseed Proteins. Foods 2021, 10, 1657. [Google Scholar] [CrossRef] [PubMed]
- Jiang, J.; Chen, J.; Xiong, Y. Structural and emulsifying properties of soy protein isolate subjected to acid and alkaline pH-shifting processes. J. Agric. Food Chem. 2009, 57, 7576–7583. [Google Scholar] [CrossRef] [PubMed]


| Precipitate Fraction | ||||||||
|---|---|---|---|---|---|---|---|---|
| pH 3.0 | pH 3.5 | pH 4.0 | pH 4.5 | pH 5.0 | pH 5.5 | pH 6.0 | pH 6.5 | |
| Wet mass (g) | 34 ± 5 a | 29 ± 1 b | 25 ± 0 bc | 21 ± 0 cd | 18 ± 0 de | 19 ± 1 de | 16 ± 0 e | 14 ± 0 e |
| Dry matter (g) | 7.4 ± 0.4 a | 7.6 ± 0.1 a | 7.3 ± 0.1 a | 6.7 ± 0.1 b | 5.7 ± 0.1 c | 5.5 ± 0.1 c | 4.6 ± 0.0 d | 4.0 ± 0.1 f |
| Protein (g) | 4.2 ± 0.0 c | 4.7 ± 0.1 a | 4.7 ± 0.0 a | 4.5 ± 0.1 b | 3.7 ± 0.1 d | 3.4 ± 0.0 e | 2.7 ± 0.0 f | 2.3 ± 0.1 g |
| Protein concentration dry basis (%) | 56 ± 3 g | 62 ± 1 c | 64 ± 1 b | 67 ± 0 a | 64 ± 1 b | 61 ± 1 d | 59 ± 1 e | 57 ± 3 f |
| Protein precipitation coefficient (%) | 53 ± 0 c | 64 ± 0 a | 62 ± 0 ab | 59 ± 1 b | 52 ± 0 c | 46 ± 0 d | 37 ± 0 e | 32 ± 1 f |
Publisher’s Note: MDPI stays neutral with regard to jurisdictional claims in published maps and institutional affiliations. |
© 2022 by the authors. Licensee MDPI, Basel, Switzerland. This article is an open access article distributed under the terms and conditions of the Creative Commons Attribution (CC BY) license (https://creativecommons.org/licenses/by/4.0/).
Share and Cite
Ahlström, C.; Thuvander, J.; Rayner, M.; Matos, M.; Gutiérrez, G.; Östbring, K. The Effect of Precipitation pH on Protein Recovery Yield and Emulsifying Properties in the Extraction of Protein from Cold-Pressed Rapeseed Press Cake. Molecules 2022, 27, 2957. https://doi.org/10.3390/molecules27092957
Ahlström C, Thuvander J, Rayner M, Matos M, Gutiérrez G, Östbring K. The Effect of Precipitation pH on Protein Recovery Yield and Emulsifying Properties in the Extraction of Protein from Cold-Pressed Rapeseed Press Cake. Molecules. 2022; 27(9):2957. https://doi.org/10.3390/molecules27092957
Chicago/Turabian StyleAhlström, Cecilia, Johan Thuvander, Marilyn Rayner, María Matos, Gemma Gutiérrez, and Karolina Östbring. 2022. "The Effect of Precipitation pH on Protein Recovery Yield and Emulsifying Properties in the Extraction of Protein from Cold-Pressed Rapeseed Press Cake" Molecules 27, no. 9: 2957. https://doi.org/10.3390/molecules27092957