
Chemometric Assisted UV-Spectrophotometric Methods Using Multivariate Curve Resolution Alternating Least Squares and Partial Least Squares Regression for Determination of Beta-Antagonists in Formulated Products: Evaluation of the Ecological Impact


Abstract
:1. Introduction
2. Experimental
2.1. Instrumentation
2.2. Material and Reagents
2.3. Preparation of Calibration and Standard Solutions
2.4. Sample Preparation
3. Theoretical Background
3.1. MCR-ALS
3.2. PLSR
3.3. Figures of Merit
4. Results and Discussion
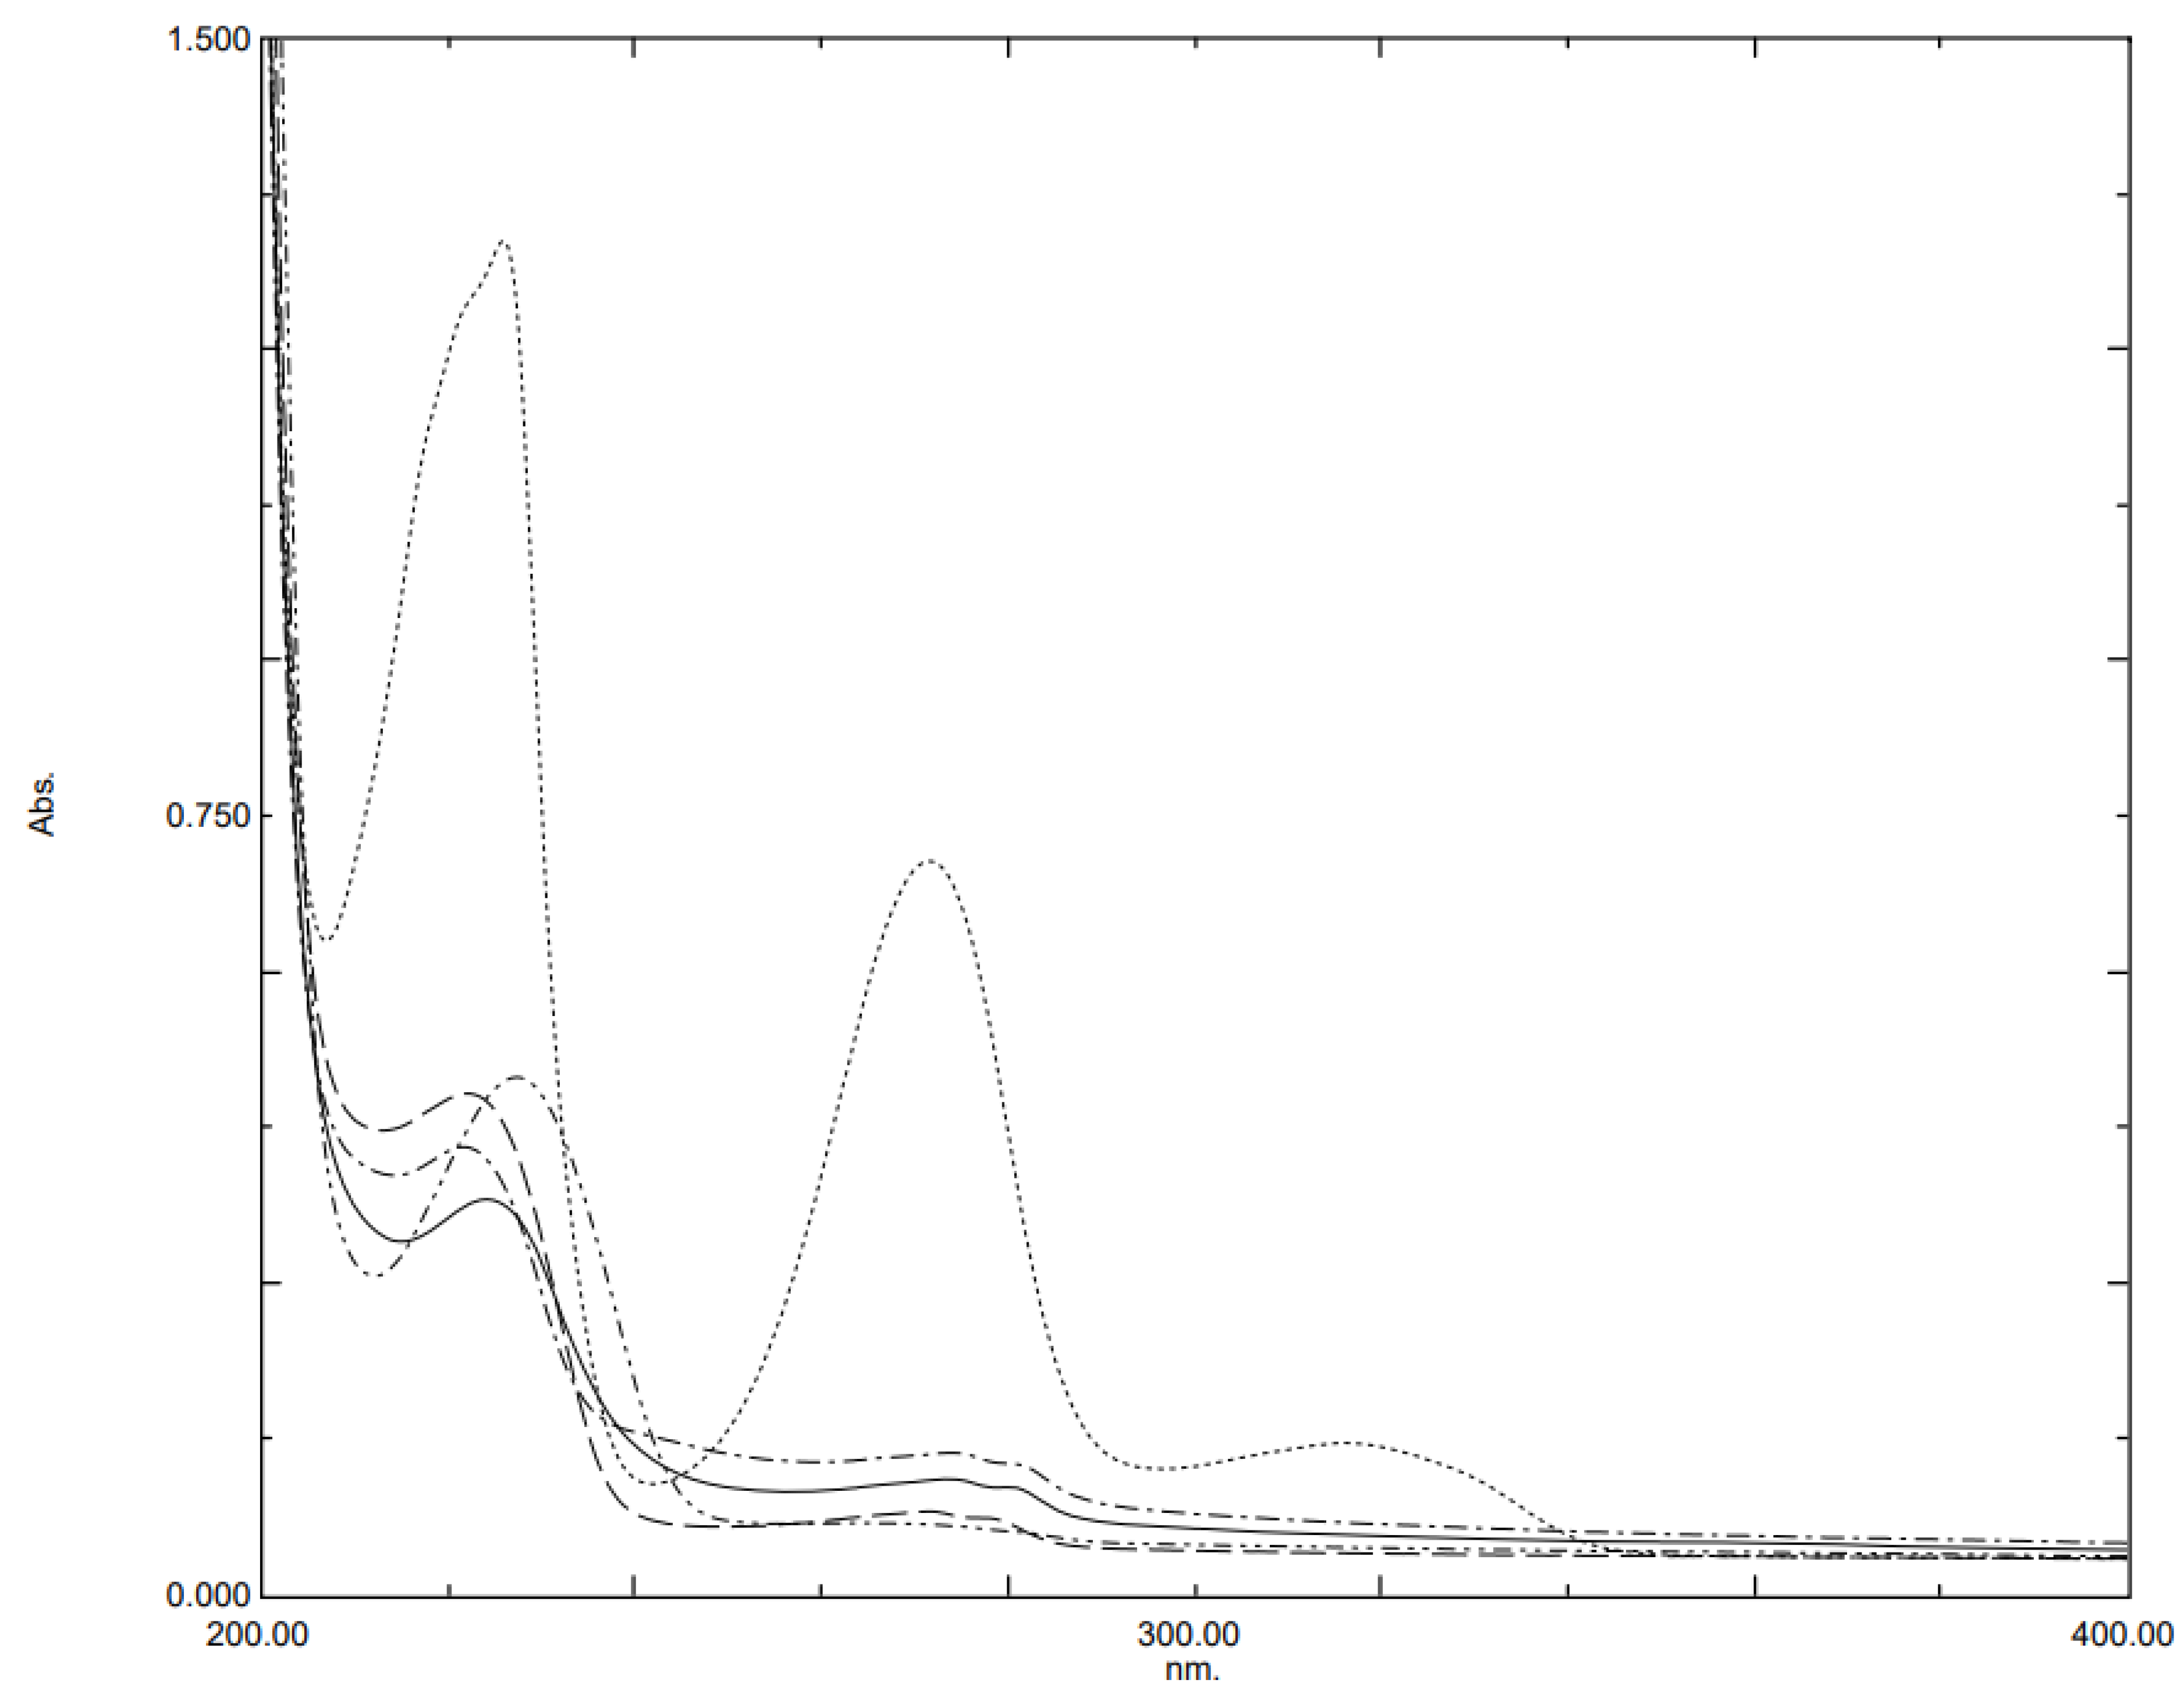
4.1. Selection of Wavelength Intervals for MCR-ALS and PLSR
4.2. Multivariate Calibration
4.2.1. MCR-ALS Model
4.2.2. PLSR Model
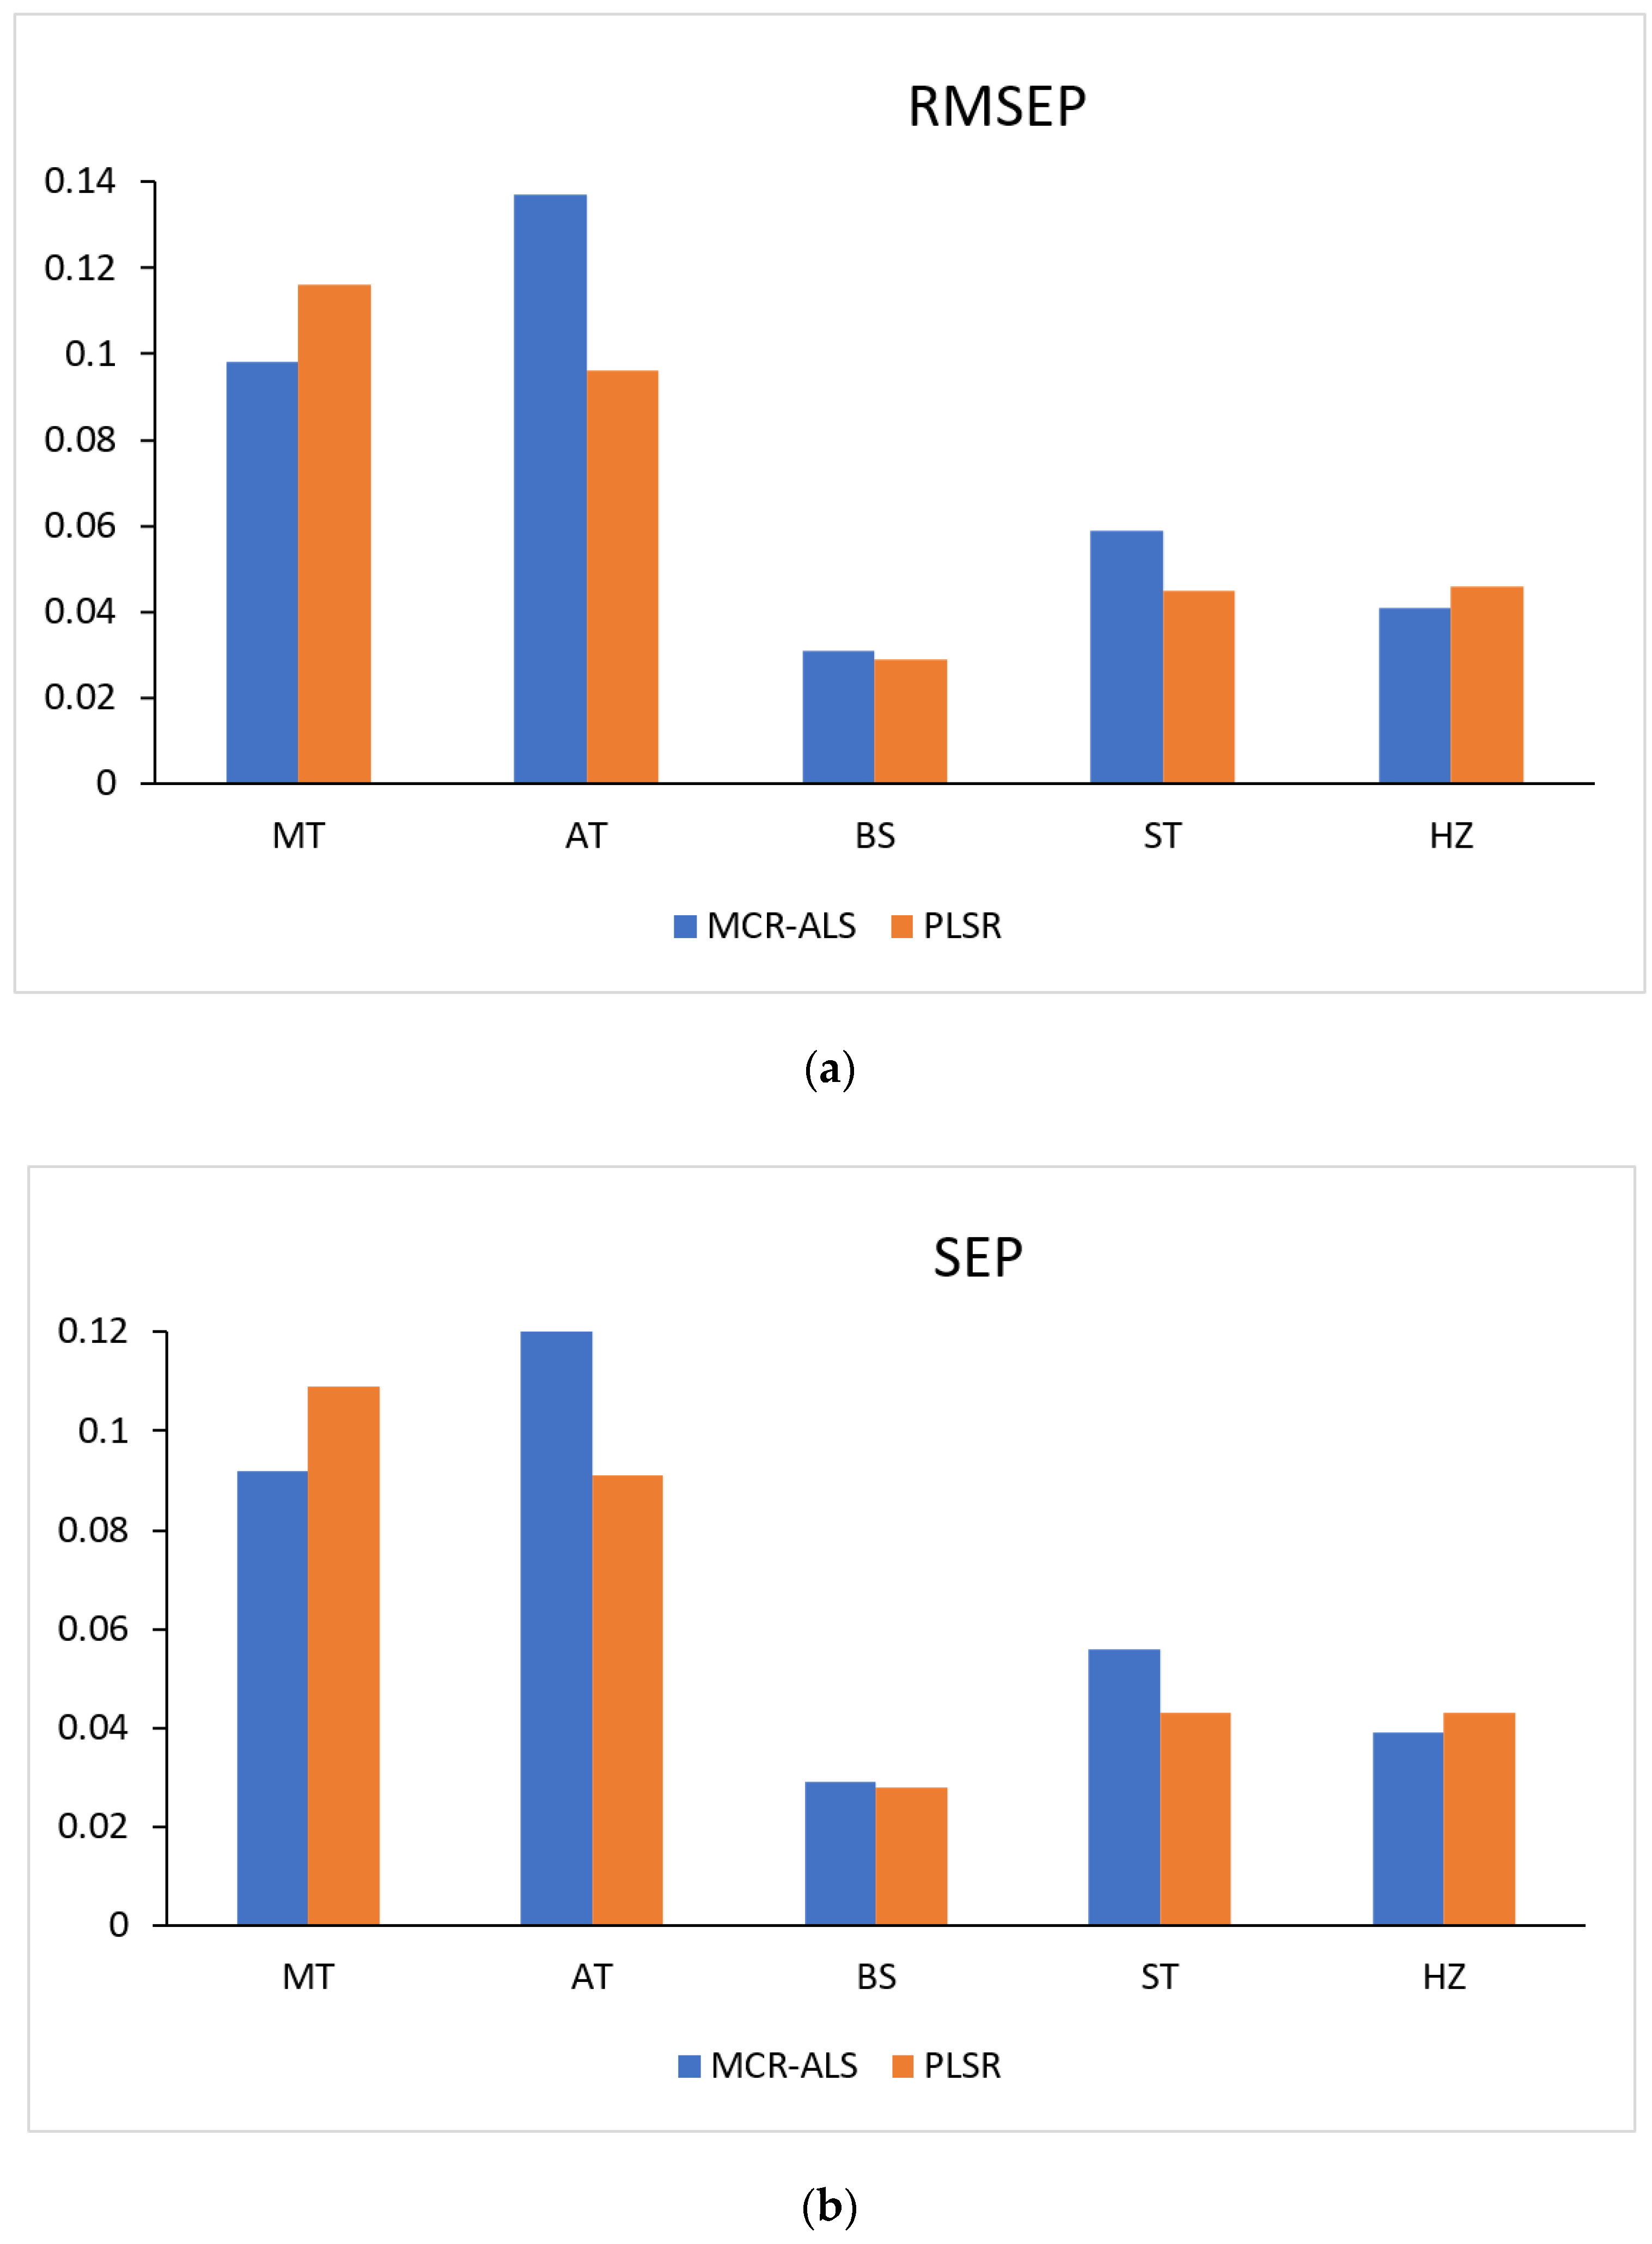
4.3. Method Validation
4.4. Analysis of Commercial Drug Products
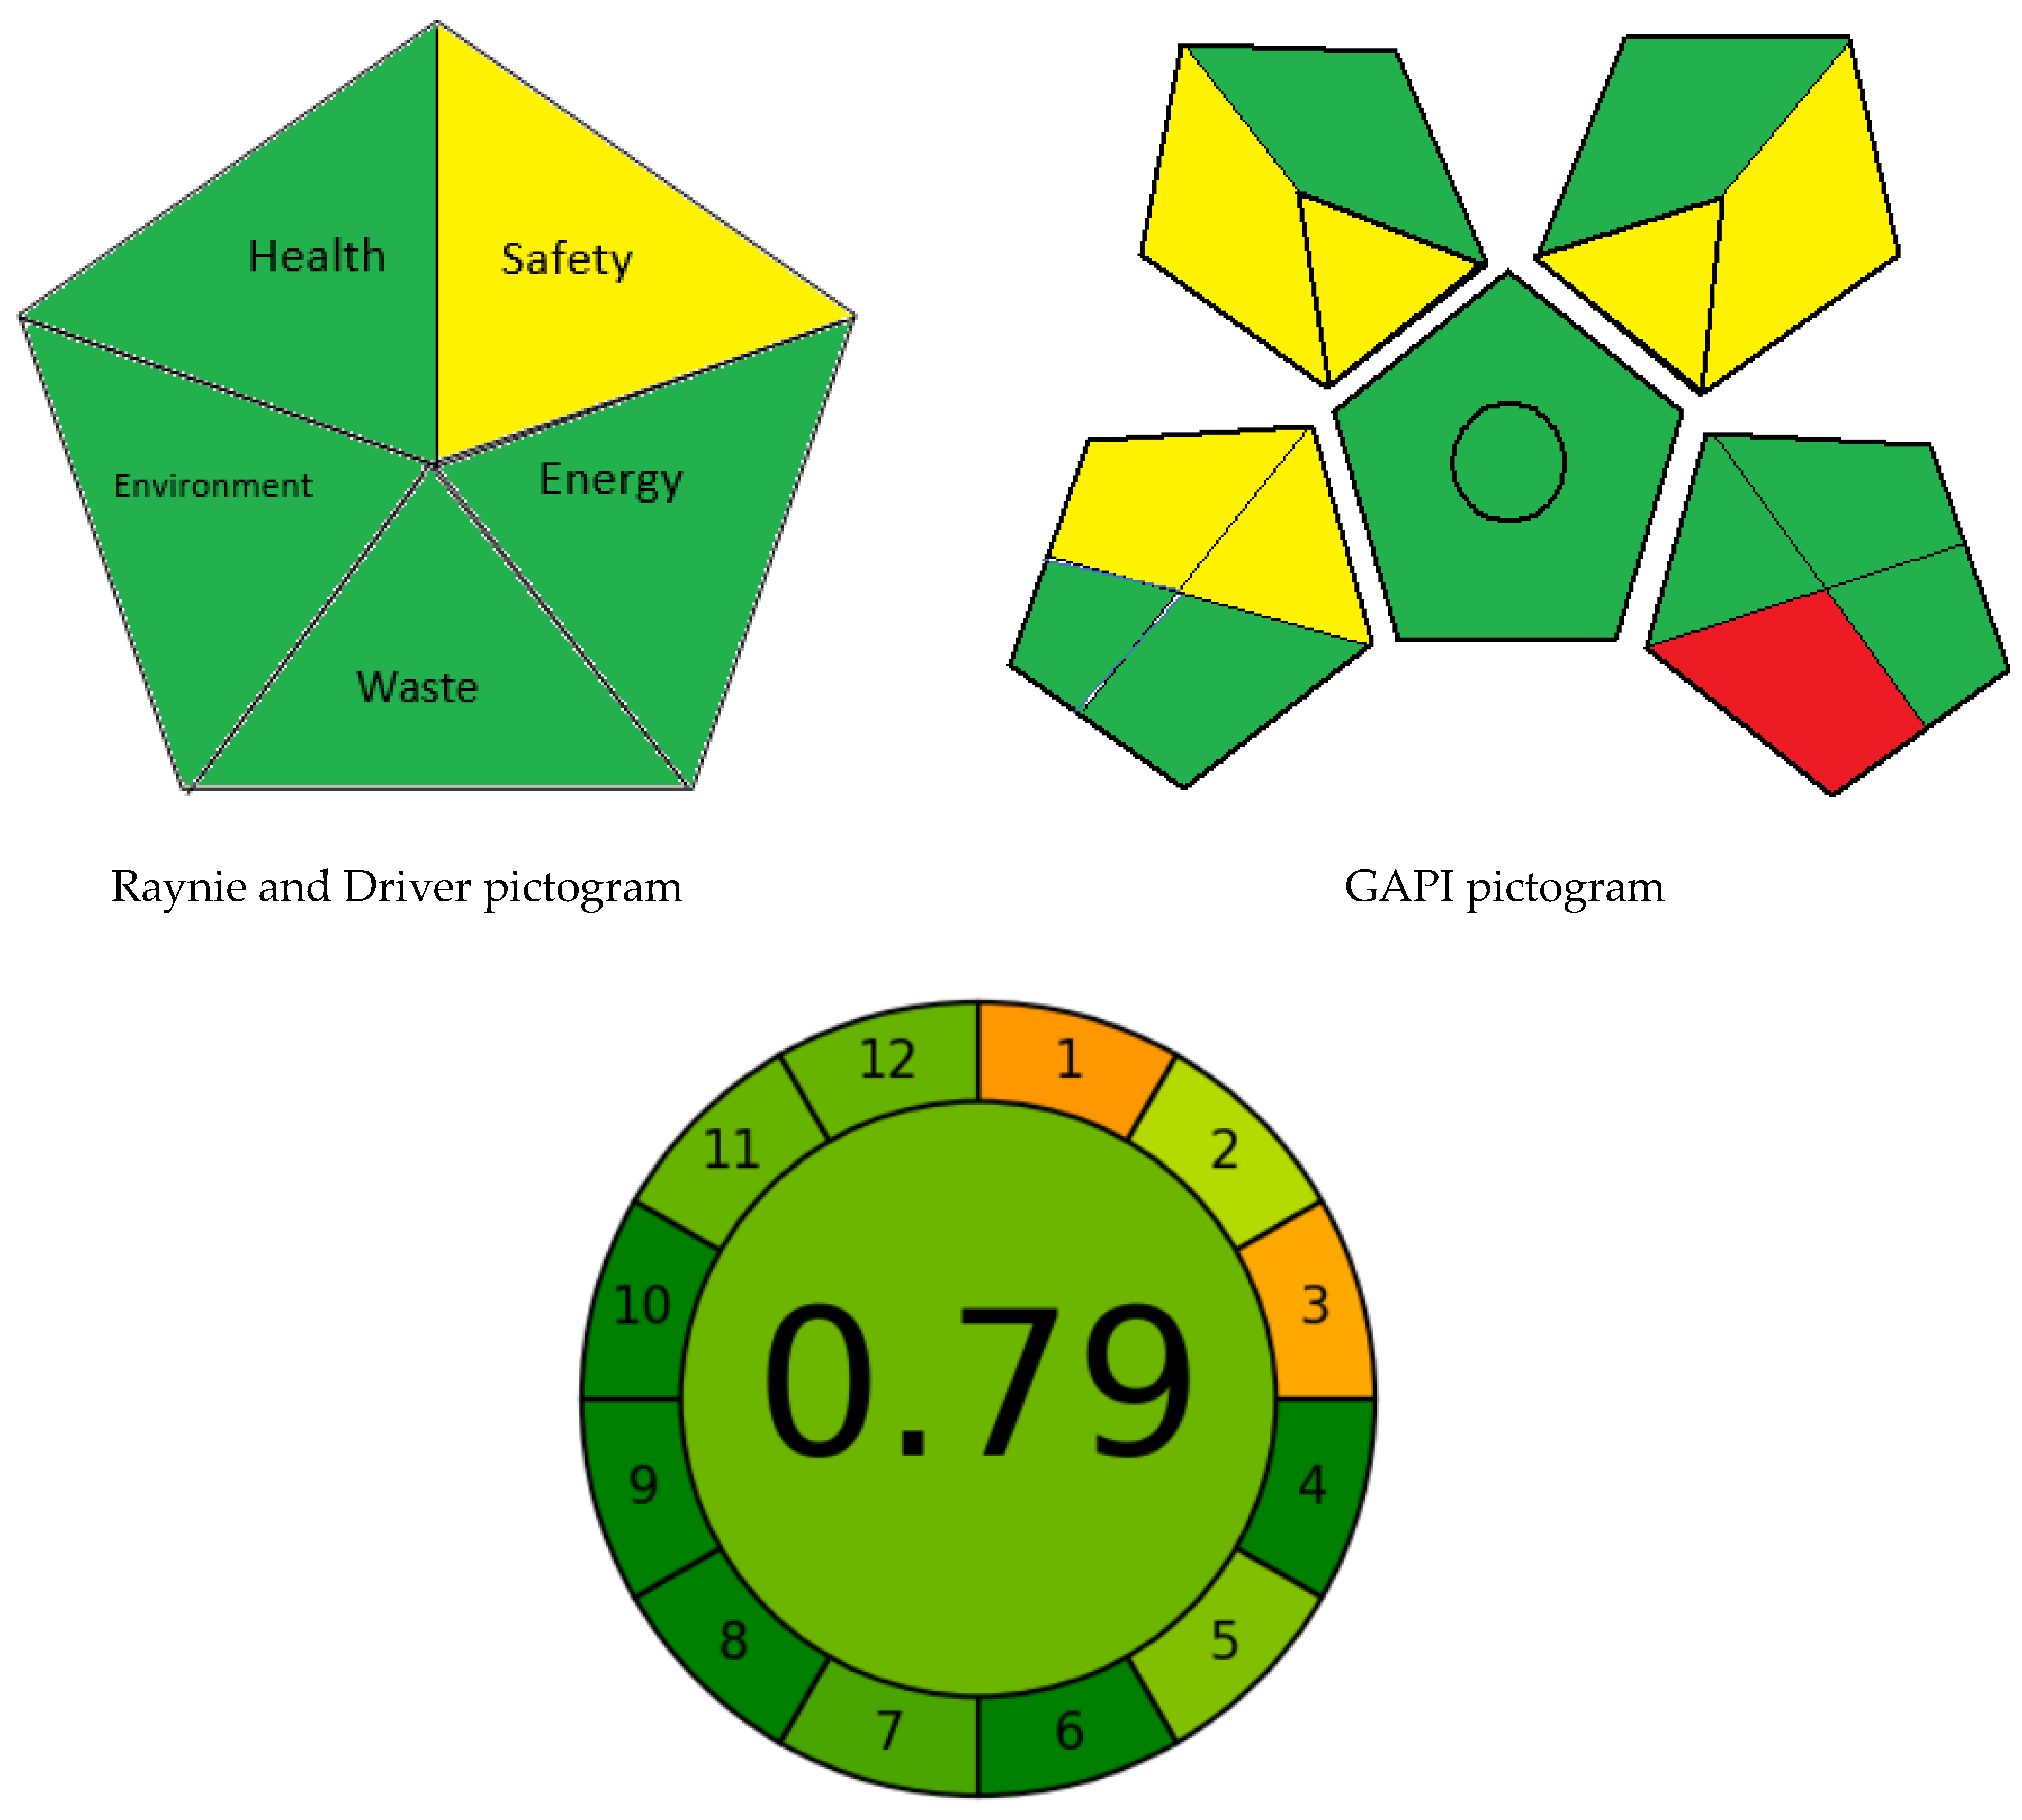
4.5. Assessment of the Environmental Impact of the Developed Methods
5. Conclusions
Author Contributions
Funding
Institutional Review Board Statement
Informed Consent Statement
Data Availability Statement
Acknowledgments
Conflicts of Interest
Sample Availability
References
- Shaaban, H. Eco-Friendly Bio-Analytical Techniques for Pharmaceutical Analysis. J. Clin. Bioanal. Chem. 2017, 1, 3–4. Available online: https://www.alliedacademies.org/articles/green-ecofriendly-bioanalytical-techniques-for-pharmaceutical-analysis.pdf (accessed on 24 December 2022).
- Sweetman, S.C. Martindale—The Complete Drug Reference, 35th ed.; Pharmaceutical Press: London, UK, 2009. [Google Scholar]
- Shaaban, H. New insights into liquid chromatography for more eco-friendly analysis of pharmaceuticals. Anal. Bioanal. Chem. 2016, 408, 6929–6944. [Google Scholar] [CrossRef] [PubMed]
- El-Gindy, A.; Hadad, G.M. Chemometrics in Pharmaceutical Analysis: An Introduction, Review, and Future Perspectives. J. AOAC Int. 2012, 95, 609–623. [Google Scholar] [CrossRef]
- Sajedi-Amin, S.; Naseri, A.; Abdollahi, H. Designing an interactive molecular autoburette for quantification approach of pharmaceuticals by MCR-ALS. Microchem. J. 2022, 174, 107096. [Google Scholar] [CrossRef]
- Mostafa, A.; Shaaban, H. Quantitative analysis and resolution of pharmaceuticals in the environment using multivariate curve resolution-alternating least squares (MCR-ALS). Acta Pharm. 2019, 69, 217–231. [Google Scholar] [CrossRef] [Green Version]
- Parastar, H.; Shaye, H. Comparative study of partial least squares and multivariate curve resolution for simultaneous spectrophotometric determination of pharmaceuticals in environmental samples. RSC Adv. 2015, 5, 70017–70024. [Google Scholar] [CrossRef]
- Azzouz, T.; Tauler, R. Application of multivariate curve resolution alternating least squares (MCR-ALS) to the quantitative analysis of pharmaceutical and agricultural samples. Talanta 2008, 74, 1201–1210. [Google Scholar] [CrossRef] [PubMed]
- Attimarad, M.; Venugopala, K.N.; Sreeharsha, N.; Chohan, M.S.; Shafi, S.; Nair, A.B.; Pottathil, S.J.S. A rapid HPLC method for the concurrent determination of several antihypertensive drugs from binary and ternary formulations. Separations 2021, 8, 86. [Google Scholar] [CrossRef]
- Hemdan, A.; Al-Tannak, N.F.; Mohamed, E.H. Development of a multivariate model with desirability-based optimization for determination of atenolol and hydrochlorothiazide by eco-friendly HPLC method with fluorescence detection. J. Sep. Sci. 2022, 45, 824–831. [Google Scholar] [CrossRef]
- Salem, A.A.; Wasfi, I.; Al-Nassib, S.S.; Allawy, M.M.; Al-Katheeri, N. Determination of Some β-Blockers and β2-Agonists in Plasma and Urine Using Liquid Chromatography–tandem Mass Spectrometry and Solid Phase Extraction. J. Chromatogr. Sci. 2017, 55, 846–856. [Google Scholar] [CrossRef]
- Tomková, J.; Ondra, P.; Kocianová, E.; Václavík, J. Fast and sensitive analysis of beta blockers by ultra-high-performance liquid chromatography coupled with ultra-high-resolution TOF mass spectrometry. Biomed. Chromatogr. 2017, 31, e3911. [Google Scholar] [CrossRef] [PubMed]
- Pocrnić, M.; Ansorge, M.; Dovhunová, M.; Habinovec, I.; Tesařová, E.; Galić, N. Chiral separation of beta-blockers by high-performance liquid chromatography and determination of bisoprolol enantiomers in surface waters. Arh. Hig. Rada Toksikol. 2020, 71, 56–62. [Google Scholar] [CrossRef] [PubMed]
- Gałuszka, A.; Migaszewski, Z.M.; Konieczka, P.; Namieśnik, J. Analytical Eco-Scale for assessing the greenness of analytical procedures. TrAC—Trends Anal. Chem. 2012, 37, 61–72. [Google Scholar] [CrossRef]
- Płotka-Wasylka, J. A new tool for the evaluation of the analytical procedure: Green Analytical Procedure Index. Talanta 2018, 181, 204–209. [Google Scholar] [CrossRef]
- Raynie, D.; Driver, J. Green Assessment of Chemical Methods. In Proceedings of the 13th Annual Green Chemistry and Engineering Conference, College Park, MD, USA, 23–25 June 2009. [Google Scholar]
- Pena-Pereira, F.; Wojnowski, W.; Tobiszewski, M. AGREE—Analytical GREEnness metric approach and software. Anal. Chem. 2020, 92, 10076–10082. [Google Scholar] [CrossRef]
- Jaumot, J.; de Juan, A.; Tauler, R. MCR-ALS GUI 2.0: New features and applications. Chemom. Intell. Lab. Syst. 2015, 140, 1–12. [Google Scholar] [CrossRef]
- Jaumot, J.; de Juan, A.; Tauler, R. A graphical user-friendly interface for MCR-ALS: A new tool for multivariate curve resolution in MATLAB. Chemom. Intell. Lab. Syst. 2005, 76, 101–110. [Google Scholar] [CrossRef]
- De Juan, A.; Jaumot, J.; Tauler, R. Multivariate Curve Resolution (MCR). Solving the mixture analysis problem. Anal. Methods 2014, 6, 4964–4976. [Google Scholar] [CrossRef]
- Windig, W.; Guilment, J. Interactive self-modeling mixture analysis. Anal. Chem. 1991, 63, 1425–1432. [Google Scholar] [CrossRef]
- de Juan, A.; Tauler, R. Chemometrics applied to unravel multicomponent processes and mixtures: Revisiting latest trends in multivariate resolution. Anal. Chim. Acta 2003, 500, 195–210. [Google Scholar] [CrossRef]
- de Oliveira, R.R.; de Lima, K.M.; Tauler, R.; de Juan, A. Application of correlation constrained multivariate curve resolution alternating least-squares methods for determination of compounds of interest in biodiesel blends using NIR and UV-visible spectroscopic data. Talanta 2014, 125, 233–241. [Google Scholar] [CrossRef] [PubMed]
- de Carvalho, A.R.; Sanchez, M.N.; Wattoom, J.; Brereton, R.G. Comparison of PLS and kinetic models for a second-order reaction as monitored using ultraviolet visible and mid-infrared spectroscopy. Talanta 2006, 68, 1190–1200. [Google Scholar] [CrossRef] [PubMed]
- Beebe, K.R.; Kowalski, B.R. An introduction to multivariate calibration and analysis. Anal. Chem. 1987, 59, 1007A–1017A. [Google Scholar] [CrossRef]
- Brereton, R.G. Multilevel multifactor designs for multivariate calibration. Analyst 1997, 122, 1521–1529. [Google Scholar] [CrossRef]
- Bro, R.; De Jong, S. A fast non-negativity-constrained least squares algorithm. J. Chemom. 1997, 11, 393–401. [Google Scholar] [CrossRef]
- Shaaban, H. The ecological impact of liquid chromatographic methods reported for bioanalysis of COVID-19 drug, hydroxychloroquine: Insights on greenness assessment. Microchem. J. 2022, 184, 108145. [Google Scholar] [CrossRef]
- List of NFPA Codes & Standards 2019. Available online: https://www.nfpa.org/Codes-and-Standards/All-Codes-and-Standards/List-of-Codes-and-Standards (accessed on 24 December 2022).
 ) and validation set (
 ) of the investigated drugs.
) and validation set () of the investigated drugs.
) of the investigated drugs.
) and validation set () of the investigated drugs.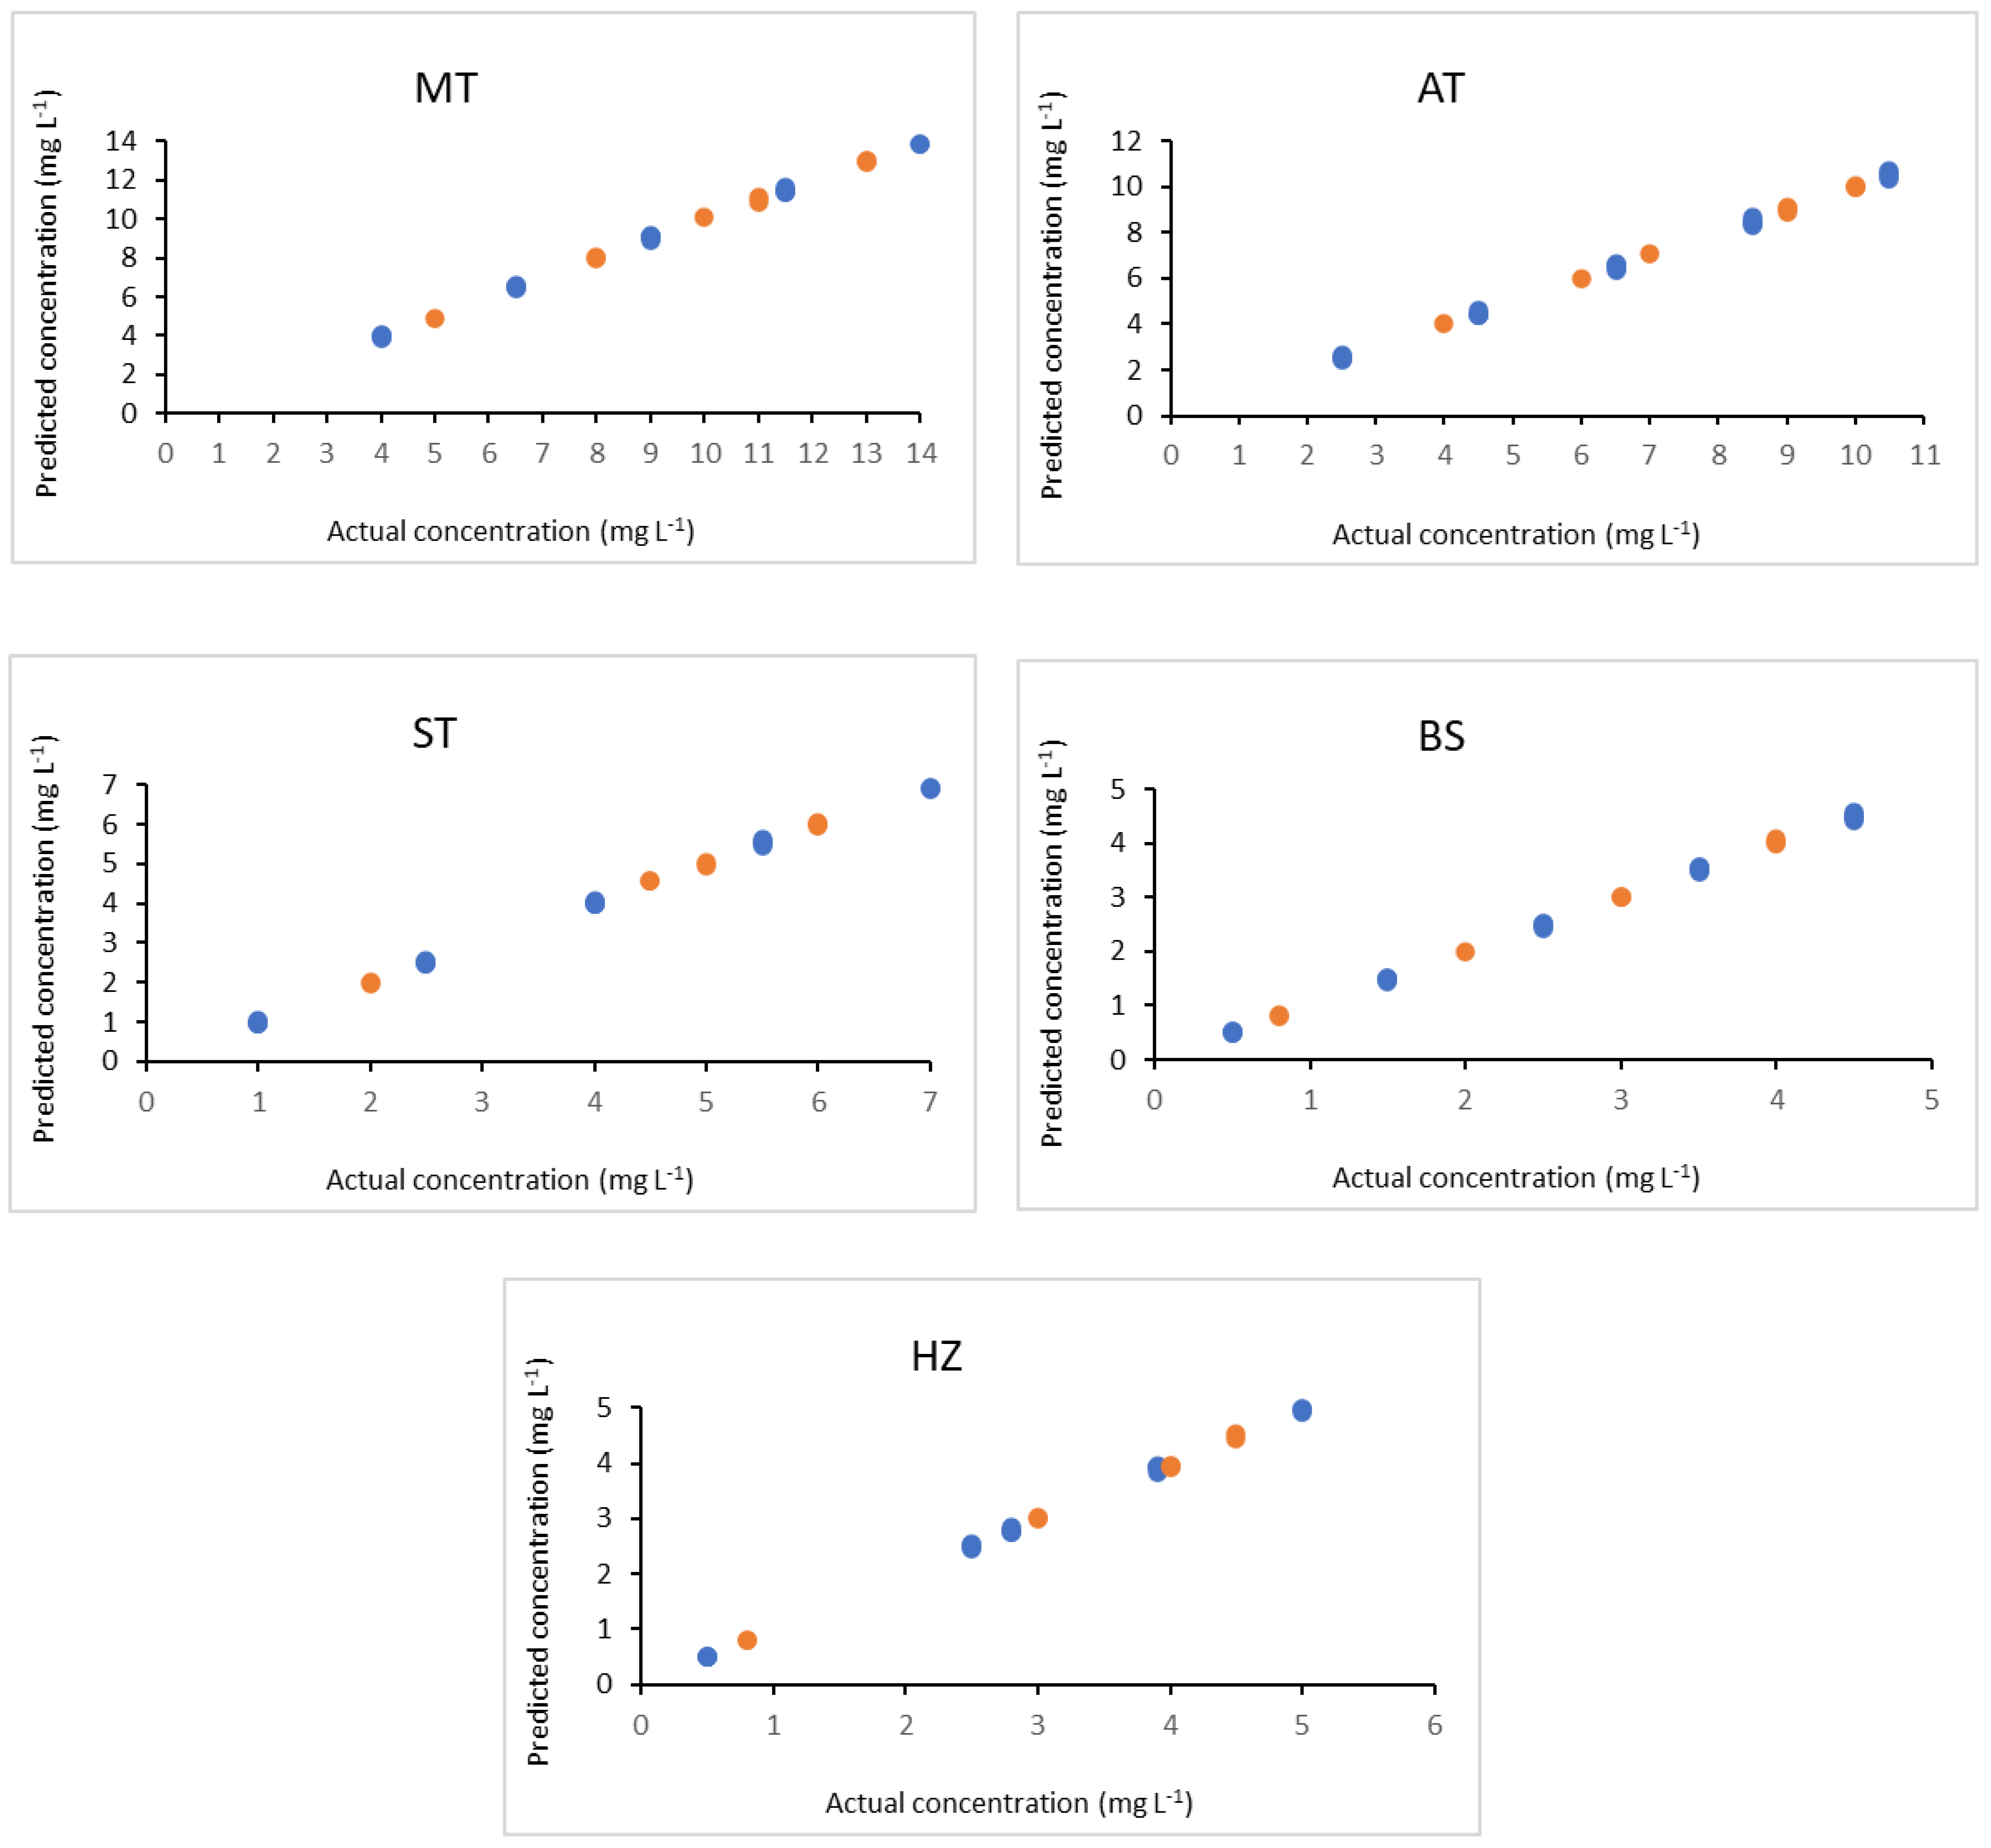 ) and validation set () of the investigated drugs.
) and validation set () of the investigated drugs.
) and validation set () of the investigated drugs.

| No. | Calibration Set (µg mL−1) | Validation Set (µg mL−1) | ||||||||
|---|---|---|---|---|---|---|---|---|---|---|
| MT | AT | BS | ST | HZ | MT | AT | BS | ST | HZ | |
| 1 | 9.0 | 6.5 | 2.5 | 4.0 | 2.8 | 8.0 | 6.0 | 3.0 | 6.0 | 4.0 |
| 2 | 9.0 | 2.5 | 0.5 | 7.0 | 2.5 | 8.0 | 9.0 | 4.0 | 5.0 | 3.0 |
| 3 | 4.0 | 2.5 | 4.5 | 2.5 | 5.0 | 11.0 | 10.0 | 3.0 | 4.5 | 4.5 |
| 4 | 4.0 | 10.5 | 1.5 | 7.0 | 2.8 | 13.0 | 9.0 | 2.0 | 6.0 | 4.5 |
| 5 | 14.0 | 4.5 | 4.5 | 4.0 | 2.5 | 11.0 | 7.0 | 4.0 | 6.0 | 0.8 |
| 6 | 6.5 | 10.5 | 2.5 | 2.5 | 2.5 | 10.0 | 10.0 | 4.0 | 2.0 | 4.0 |
| 7 | 14.0 | 6.5 | 1.5 | 2.5 | 3.9 | 13.0 | 10.0 | 0.8 | 5.0 | 0.8 |
| 8 | 9.0 | 4.5 | 1.5 | 5.5 | 5.0 | 13.0 | 4.0 | 3.0 | 2.0 | 3.0 |
| 9 | 6.5 | 4.5 | 3.5 | 7.0 | 3.9 | 5.0 | 9.0 | 0.8 | 4.5 | 4.0 |
| 10 | 6.5 | 8.5 | 4.5 | 5.5 | 2.8 | |||||
| 11 | 11.5 | 10.5 | 3.5 | 4.0 | 5.0 | |||||
| 12 | 14.0 | 8.5 | 2.5 | 7.0 | 5.0 | |||||
| 13 | 11.5 | 6.5 | 4.5 | 7.0 | 0.5 | |||||
| 14 | 9.0 | 10.5 | 4.5 | 1.0 | 3.9 | |||||
| 15 | 14.0 | 10.5 | 0.5 | 5.5 | 0.5 | |||||
| 16 | 14.0 | 2.5 | 3.5 | 1.0 | 2.8 | |||||
| 17 | 4.0 | 8.5 | 0.5 | 4.0 | 3.9 | |||||
| 18 | 11.5 | 2.5 | 2.5 | 5.5 | 3.9 | |||||
| 19 | 4.0 | 6.5 | 3.5 | 5.5 | 2.5 | |||||
| 20 | 9.0 | 8.5 | 3.5 | 2.5 | 0.5 | |||||
| 21 | 11.5 | 8.5 | 1.5 | 1.0 | 2.5 | |||||
| 22 | 11.5 | 4.5 | 0.5 | 2.5 | 2.8 | |||||
| 23 | 6.5 | 2.5 | 1.5 | 4.0 | 0.5 | |||||
| 24 | 4.0 | 4.5 | 2.5 | 1.0 | 0.5 | |||||
| 25 | 6.5 | 6.5 | 0.5 | 1.0 | 5.0 | |||||
| Calibration | ||||||||||
|---|---|---|---|---|---|---|---|---|---|---|
| Parameters | MCR-ALS | PLSR | ||||||||
| MT | AT | BS | ST | HZ | MT | AT | BS | ST | HZ | |
| Calibration range (µg mL−1) | 4.0–14.0 | 2.5–10.5 | 0.5–4.5 | 1.0–7.0 | 0.5–5.0 | 4.0–14.0 | 2.5–10.5 | 0.5–4.5 | 1.0–7.0 | 0.5–5.0 |
| Intercept | −8.0 × 10⁻³ | 3.0 × 10⁻¹² | −8.0 × 10⁻¹⁴ | −1.0 × 10⁻¹³ | −5.0 × 10⁻¹⁴ | 3.4 × 10⁻³ | 4.6 × 10⁻³ | 1.4 × 10⁻³ | 1.9 × 10⁻³ | 1.4 × 10⁻³ |
| Slope | 1.0000 | 1.0000 | 1.0000 | 1.0000 | 1.0000 | 0.9996 | 0.9993 | 0.9994 | 0.9995 | 0.9995 |
| Correlation coefficient (r2) | 0.9994 | 0.9990 | 0.9994 | 0.9993 | 0.9994 | 0.9996 | 0.9993 | 0.9994 | 0.9995 | 0.9995 |
| RMSECV | 0.086 | 0.105 | 0.035 | 0.056 | 0.035 | 0.068 | 0.075 | 0.033 | 0.046 | 0.033 |
| SEP | 0.084 | 0.104 | 0.035 | 0.055 | 0.035 | 0.067 | 0.074 | 0.033 | 0.045 | 0.033 |
| Bias | −4.17 × 10⁻¹³ | 7.59 × 10⁻¹³ | 8.72 × 10⁻¹⁴ | −2.64 × 10⁻¹³ | −2.62 × 10⁻¹⁴ | 1.2 × 10⁻¹² | 4.00 × 10⁻¹³ | −9.60 × 10⁻¹³ | 1.20 × 10⁻¹³ | 4.40 × 10⁻¹³ |
| RE (%) | 0.886 | 1.492 | 1.231 | 1.236 | 1.073 | 0.707 | 1.061 | 1.166 | 1.024 | 1.005 |
| Validation | ||||||||||
| Parameters | MCR-ALS | PLSR | ||||||||
| MT | AT | BS | ST | HZ | MT | AT | BS | ST | HZ | |
| Correlation coefficient (r2) | 0.9990 | 0.9993 | 0.9995 | 0.9994 | 0.9994 | 0.9993 | 0.9994 | 0.9996 | 0.9992 | 0.9992 |
| Accuracy (Mean ± SD) | 99.84 ± 1.04 | 100.31 ± 0.70 | 100.54 ± 0.99 | 100.34 ± 0.93 | 99.89 ± 1.37 | 99.71 ± 0.94 | 99.93 ± 0.62 | 100.86 ± 1.15 | 100.47 ± 1.07 | 100.04 ± 1.55 |
| Precision repeatability (RSD, %) | 1.32 | 1.10 | 1.61 | 0.99 | 1.09 | 1.42 | 1.12 | 1.56 | 1.33 | 1.65 |
| Intermediate precision (RSD, %) | 1.42 | 1.25 | 1.54 | 1.11 | 1.21 | 1.56 | 1.20 | 1.35 | 1.05 | 1.50 |
| RMSEP | 0.098 | 0.137 | 0.031 | 0.059 | 0.041 | 0.116 | 0.096 | 0.029 | 0.045 | 0.046 |
| SEP | 0.092 | 0.129 | 0.029 | 0.056 | 0.039 | 0.109 | 0.091 | 0.028 | 0.043 | 0.043 |
| Bias | −2.59 × 10⁻³ | 1.46 × 10⁻³ | −0.013 | −0.026 | 0.015 | −0.012 | −0.004 | −0.017 | −0.020 | 0.013 |
| RE (%) | 0.927 | 1.617 | 1.032 | 1.238 | 1.197 | 1.097 | 1.136 | 0.978 | 0.950 | 1.317 |
| MCR-ALS | PLSR | ||
|---|---|---|---|
| Sample 1 | AT (Tenormin® tablets) | ||
| Mean ± SD | 101.06 ± 0.97 | 101.23 ± 0.78 | |
| t | 1.31 | - | |
| F | 1.51 | - | |
| ST (Betacor® tablets) | |||
| Sample 2 | Mean ± SD | 101.02 ± 1.24 | 101.54 ± 0.71 |
| t | 1.91 | - | |
| F | 2.25 | - | |
| MT (Betaloc® tablets) | 100.46 ± 0.82 | 100.30 ± 0.71 | |
| Sample 3 | Mean ± SD | ||
| t | 1.34 | - | |
| F | 1.31 | - | |
| BS (Concor® tablets) | |||
| Sample 4 | Mean ± SD | 100.09 ± 1.11 | 100.60 ± 0.90 |
| t | 1.68 | - | |
| F | 1.53 | - | |
| Sample 5 | BS (Concor 5 plus® tablets) | ||
| Mean ± SD | 101.10 ± 1.74 | 101.15 ± 1.01 | |
| t | 0.10 | - | |
| F | 2.95 | - | |
| HZ (Concor 5 plus® tablets) | |||
| Mean ± SD | 99.72 ± 0.59 | 99.66 ± 0.75 | |
| t | 0.25 | - | |
| F | 2.16 | - |
| Penalty points (PPs) | ||
| Amount | ˂10 mL | 1 |
| Hazard type | Single word: Danger | 2 | |
| Hazard amount | pictograms | 3 | |
| Total PPs = 6 | |||
| Amount | ˂10 mL | 1 |
| Hazard type | Single word: Danger | 2 | |
| Hazard amount | 2 pictograms | 2 | |
| Total PPs = 4 | |||
| |||
| LC-UV | ≤0.1 | 0 |
| No hermetic sealing release of gas or vapor into air | 0 | |
| |||
| 1–10 mL | 3 | |
| No treatment | 3 | |
| Total penalty points | 16 | ||
| Eco-scale score | 100−16 = 84 |
Disclaimer/Publisher’s Note: The statements, opinions and data contained in all publications are solely those of the individual author(s) and contributor(s) and not of MDPI and/or the editor(s). MDPI and/or the editor(s) disclaim responsibility for any injury to people or property resulting from any ideas, methods, instructions or products referred to in the content. |
© 2022 by the authors. Licensee MDPI, Basel, Switzerland. This article is an open access article distributed under the terms and conditions of the Creative Commons Attribution (CC BY) license (https://creativecommons.org/licenses/by/4.0/).
Share and Cite
Mostafa, A.; Shaaban, H. Chemometric Assisted UV-Spectrophotometric Methods Using Multivariate Curve Resolution Alternating Least Squares and Partial Least Squares Regression for Determination of Beta-Antagonists in Formulated Products: Evaluation of the Ecological Impact. Molecules 2023, 28, 328. https://doi.org/10.3390/molecules28010328
Mostafa A, Shaaban H. Chemometric Assisted UV-Spectrophotometric Methods Using Multivariate Curve Resolution Alternating Least Squares and Partial Least Squares Regression for Determination of Beta-Antagonists in Formulated Products: Evaluation of the Ecological Impact. Molecules. 2023; 28(1):328. https://doi.org/10.3390/molecules28010328
Chicago/Turabian StyleMostafa, Ahmed, and Heba Shaaban. 2023. "Chemometric Assisted UV-Spectrophotometric Methods Using Multivariate Curve Resolution Alternating Least Squares and Partial Least Squares Regression for Determination of Beta-Antagonists in Formulated Products: Evaluation of the Ecological Impact" Molecules 28, no. 1: 328. https://doi.org/10.3390/molecules28010328
APA StyleMostafa, A., & Shaaban, H. (2023). Chemometric Assisted UV-Spectrophotometric Methods Using Multivariate Curve Resolution Alternating Least Squares and Partial Least Squares Regression for Determination of Beta-Antagonists in Formulated Products: Evaluation of the Ecological Impact. Molecules, 28(1), 328. https://doi.org/10.3390/molecules28010328