Article

Diffuse Reflectance Spectroscopy with Dilution: A Powerful Method for Halide Perovskites Study

by
Aleksei O. Murzin
1,
Anna Yu. Samsonova
1,
Constantinos C. Stoumpos
1,2,*,
Nikita I. Selivanov
1,
Alexei V. Emeline
1 and
Yury V. Kapitonov
1
1
Photonics of Crystals Laboratory, Saint Petersburg State University, Ulyanovskaya d.1, St. Petersburg 198504, Russia
2
Department of Materials Science and Technology, University of Crete, Voutes, GR-70013 Heraklion, Greece
*
Author to whom correspondence should be addressed.
Molecules 2023, 28(1), 350; https://doi.org/10.3390/molecules28010350
Submission received: 24 November 2022 / Revised: 15 December 2022 / Accepted: 25 December 2022 / Published: 1 January 2023

Abstract

:
Halide perovskites and their low-dimensional analogs are promising semiconductor materials for solar cells, LEDs, lasers, detectors and other applications in the area of photonics. The most informative optical property of semiconductor photonics materials is the absorption spectrum enabling observation of the fundamental absorption edge, exciton structure, defect-related bands, etc. Traditionally, in the study of halide perovskites, this spectrum is obtained by absorption spectroscopy of thin films or diffuse reflectance spectroscopy of powders. The first method is applicable only to compounds with the developed thin film deposition technology, and in the second case, a large absorption coefficient narrows the observations down to the sample transparency region. In this paper, we suggest the diffuse reflectance spectroscopy with dilution as a method for obtaining the full-range absorption spectrum from halide perovskite powders, and demonstrate its application to practically important cases.

1. Introduction

Halide perovskites burst into the world of photonics and optoelectronics as a material for solar cell absorbers [1], but soon showed their applicability for lasers [2], LEDs [3], X-ray [4] and photodetectors [5]. For halide perovskites, as for all other semiconductors, determinative parameters are the band gap, exciton binding energy and oscillator strengths of transitions. One needs also to evaluate the role of defects in electronic structure and quantum-size effect in low-dimensional perovskite-like compounds. All of these material characteristics can be traced back to the electronic structure and could be studied experimentally using various optical methods, the basic ones of which are photoluminescence (PL) and absorption spectroscopy.
PL spectroscopy is based on the optical excitation of the sample above the band gap and detection of the emitted light. The requirement for this method is the presence of emission, which is not met in many halide perovskites at room temperature, in the presence of non-radiative recombination centers or for indirect band gap materials. PL gives information about lowest lying states in the sample which are not necessary the states with high oscillator strength, but could be doping-related or defect states [6], or self-trapped excitons (STE) [7]. In the presence of emission the PL excitation (PLE) spectrum can be measured by scanning the excitation light energy. Taking into account all the above complexities the PLE spectrum could be taken as the estimation of the absorption spectrum.
Absorption spectroscopy gives information about optical transitions with corresponding oscillator strengths and could be used also for non-emitting samples. The most straightforward method for absorption determination is the measurement of the spectrum of the light transmitted through a slab of the material. For semiconductor materials the absorption coefficient in the fundamental absorption range is α > 10 4 cm−1 so the slab should have sub-micrometer thickness in order to light to pass through. Although many of halide perovskite materials are grown as single crystals, fabrication of thin slabs from them is limited by the brittleness of the material [8] with only exception for exfoliation techniques of 2D haloplumbates with low interlayer connectivity [9,10]. For this reason, polycrystalline thin films are the common samples for transmittance measurements. Fabrication of such films is a separate technological issue solved only for limited number of halide perovskite materials, such as MAPbI3 (MA+ = CH3 NH 3 + ) and few others [11].
For the rest of halide perovskites the method of choice for absorption measurements is the diffuse reflectance spectroscopy (DRS) of powders. Typically this method is implemented in a spectrophotometer equipped with an integrating sphere. First the signal from the known non-absorbing (”white”) reference material is collected. Then the holder filled with the grained sample is placed instead of the reference. The reflectivity signal R is measured. The simplest way to visualize the portion of light not leaving the sample is to plot the function A = 1 R . In the assumption of the infinitely thick sample the Kubelka–Munk transformation [12,13,14] could be used to determine pseudo-absorbance (remission):
F = 1 R 2 2 R = K S ,
where K is absorption and S is scattering coefficients of the studied material. Although the F ( E ) function is usually taken as a close approximation of the absorption spectrum, care should be taken for strongly absorbing materials. The almost absent reflectivity from the sample ( R 0 ) leads to the undefined value of F being very sensitive to any experimental errors. DRS measurements of semiconductors without the sample dilution allows to reliably determine only the defect-related absorption and the long-wavelength tail of the fundamental absorption. Thus, despite the general prevalence of the DRS equipment in labs, in the study of halide perovskites, with rare exceptions, DRS is used for obtaining nonsupporting data, and sometimes even for drawing incorrect conclusions. Also, we would like to point out that in halide perovskites it is necessary to use the Tauc formalism [15,16,17] with great care, since it is applicable for interband transitions in the absence of any absorption below the bandgap E g [18]. The presence of strong exciton transitions below E g requires the use instead the Elliot formalism [19,20] that takes such transitions into account. The presence of exciton transitions can also lead to the misinterpretation of them as the Urbach tail.
With this work, we would like to show that the well-known method of DRS with dilution allows obtaining reliable data in a variety of practical-important cases of halide perovskites study.

2. Results and Discussion

For DRS measurements with dilution the sample powder is diluted by a powder of transparent (”white”) matrix. For the visible range measurements the BaSO4 is the material of choice due to its nonreactivity and transparency at E < 3.5 eV [21]. Let us denote the volume fraction β in the following way:
β = V 1 V 1 + V 2 ,
where V 1 , 2 are volumes of the sample and matrix respectively. The condition of transparency of the matrix material means that its absorption coefficient K 2 = 0 in the region of interest. In this case the absorption and transmission coefficients of the mixture will be equal to K = β K 1 and S = β S 1 + ( 1 β ) S 2 , respectively. Here we designated the absorption and scattering coefficients of the sample as K 1 and S 1 , and the scattering coefficient of the matrix as S 2 . Substitution of these expressions in Equation (1) leads to the following equation for pseudo-absorbance of the mixture:
F ( β ) = K 1 S 2 · β 1 1 S 1 S 2 β .
This equation could be used to fit experimental F ( β ) series and to independently determine the K 1 S 2 and S 1 S 2 values. Usually the scattering coefficient of the matrix in the transparency energy range is monotonic and slowly changing, so the functional behaviour of K 1 and S 1 could be determined. We would like to emphasise that such approach could be used to untangle absorption and scattering of studied material opposed to Kubelka–Munk transformation of single DRS spectrum. The minimal series of dilutions consist of only two DRS spectra with different fractions. In this case Equation (3) leads to a simple set of equations that could be solved for K 1 S 2 and S 1 S 2 (see Methods). The choice of an undiluted sample ( β = 1 ) as one of the points simplifies the experiment. As the second point we recommend choosing a fraction with β < 0.01 . When preparing a mixture of materials by mass, a formula should be used that takes into account materials densities (see Methods).
For a detailed illustration of the method, we chose the most studied and practically demanded three-dimensional halide perovskite MAPbI3 (MA+ = CH3 NH 3 + ). Single crystals of MAPbI3 were synthesised using the counterdiffusion-in-gel method [22]. The crystals were pulverized and mixed with BaSO4 powder. Figure 1a shows vials with mixed powders starting from pure MAPbI3 ( β = 1 ) with each following is diluted twice by mass with BaSO4. The DRS data in the form of A = 1 R are shown in Figure 1b. Note the ”saturation” of the spectra for β 1 due to the total absorption of light in the sample. Using these data to analyze the energy structure of the sample can lead to incorrect conclusions. For example, the measurement of the band gap energy using the apparent absorption edge could lead to the band gap underestimation. These data also do not allow extracting information about the energy structure of transitions in the absorption region. To obtain complete information about the spectral properties of the sample, the entire data array should be analyzed. Figure 1c shows the dependencies of the Kubelka–Munk transformation of DRS data on the volume fraction for three different energies (marked by arrows in Figure 1b). These sections could be fitted by Equation (3) yielding the relative absorption and scattering coefficients. Same fitting procedure was used for the whole set of DRS data. Figure 1d shows the relative absorption and scattering spectra for MAPbI3 material. The fundamental absorption of the material began around 1.6 eV, with two absorption edges of higher-lying states could be observed around 2.5 and 3.0 eV. This data is in a good agreement with transmission measurements of MAPbI3 thin films [23,24]. In this work, we do not want to discuss the nature of the observed states any further. However we would like to note that a correct description of interband absorption in a direct-gap semiconductor even above the exciton dissociation temperature requires the use of the Elliot formalism, which takes into account excitonic, as well as the electron-hole correlation effects. The relative absorption and relative scattering (Figure 1d) show similar spectral behaviour. Thus, their ratio in the expression for the Kubelka–Munk transformation (Equation (1)) is not very informative. One of the advantages of the proposed method of DRS with dilution is the ability to separate these contributions.
The proposed method allows obtaining reliable spectroscopic data for other cases of practical importance for the study of halide perovskites. A hot area of research is the study of low-dimensional perovskite-like compounds. Quantum-size effects in these materials lead to a significant blue shift in the band gap of the material and an increase in the exciton binding energy to hundreds of meV [25,26]. The stability of a free exciton at room temperature and the complex emission routes involving self-trapped excitons [7] make measurements of the absorption of these materials both important and difficult task. To demonstrate the applicability of the proposed method to low-dimensional compounds, we chose the PyPbI3 (Py+ = C5H5NH) single crystal [27]. The crystal lattice of this material is the package of one-dimensional inorganic chains separated by an organic pyridinium cations. Restriction of electron and hole movement in the inorganic chain makes the material a natural quantum wire structure with band gap blue-shifted to near-UV region in comparison to the near-IR band gap of 3D iodide perovskites.
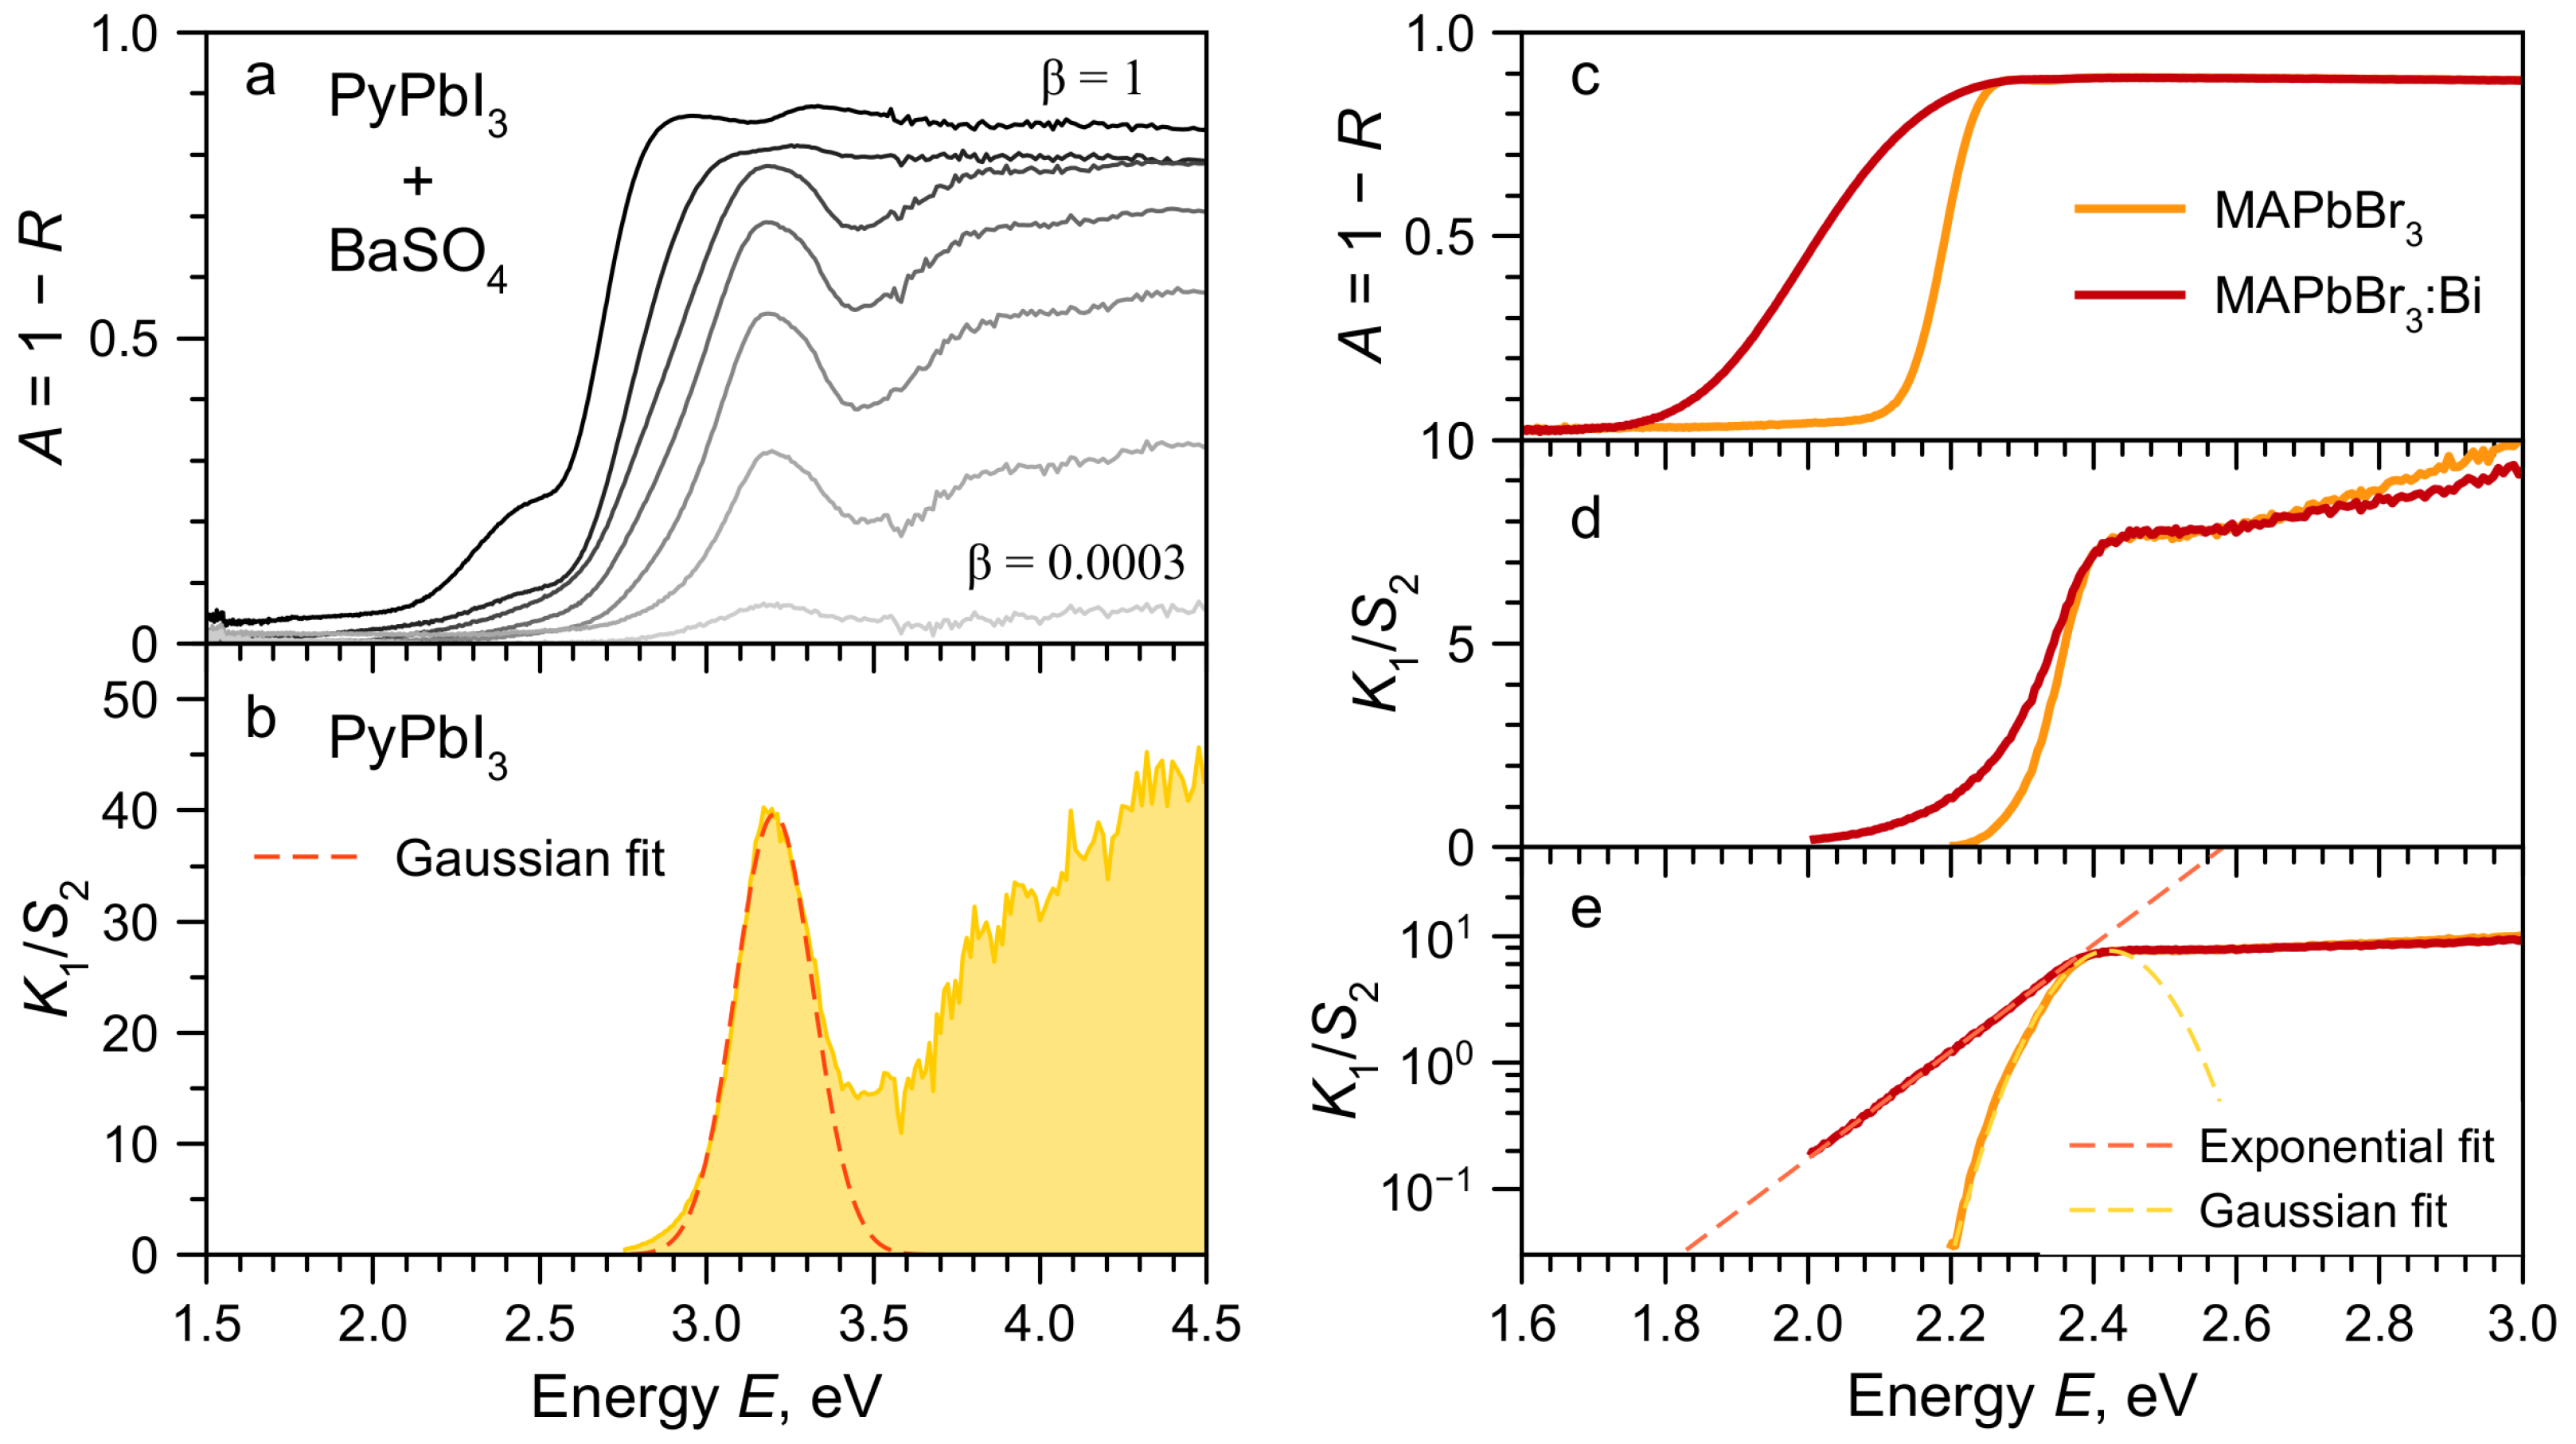
As earlier, PyPbI3 single crystals grown by counterdiffusion-in-gel method were pulverized and mixed with BaSO4 powder with different volume fractions β . Figure 2a shows the DRS spectra of mixtures. The DRS from undiluted sample ( β = 1 ) shows the total absorption above 2.9 eV with features corresponding to experimental imperfections rather than the actual material resonances. The only reliably recorded state is the weak absorption band around 2.4 eV in the transparency region of the sample. Much more informative is the analysis of the full set of DRS data using proposed method. Figure 2b shows the obtained relative absorption spectrum of PyPbI3. The spectra is dominated by the free exciton absorption peak centred at 3.20 eV. This peak has Gaussian lineshape with FWHM = 0.27 eV indicating the inhomogeneous broadening of the transition. The exciton absorption peak is followed by the interband absorption. The gap between the excitonic and interband (electron-hole) absorption indicates the high exciton binding energy on the order of 0.5 eV which is typical for such low-dimensional structures. Obtaining such information for PyPbI3 using other methods is difficult, since there is no developed technology for deposition of thin films this material, and PLE measurements are impossible, since the material does not show any luminescence at room temperature.
Doping is an important area of research for halide perovskites. The introduction of impurities, as well as the presence of intrinsic defects in crystals, can introduce significant changes in their absorption spectra in the form of absorption bands in the transparency region of the material or tail states. On the other hand, the doping can also lead to a change in the fundamental absorption, for example, to the band gap shift. The described method allows one to obtain accurate data on the absorption spectra in this case as well. To demonstrate this, we took the example of bismuth doping of MAPbBr3 halide perovskite [28]. Two single crystals were synthesised, pulverized and studied: nominally pure MAPbBr3 and MAPbBr3 doped with Bi3+. Figure 2c shows the DRS spectra for the undiluted sample powders. The only conclusion that can be drawn from these data is that states appear in the MAPbBr3 transparency region under doping. At the same time, it is not possible to establish the nature of these states. Figure 2d,e shows the relative absorption spectra of both materials obtained by the DRS with dilution method. In both cases, the spectral position of the interband absorption edge coincides, which indicates the invariance of the band gap upon doping [28]. The long-wavelength absorption edge in the case of an undoped material is well described by the Gaussian, which is a manifestation of its excitonic nature. The absorption of defect states arising upon doping with bismuth is well described by an exponential dependence, which is a typical manifestation of the so-called Urbach tail.

3. Materials and Methods

3.1. Reagents and Crystal Growth

Lead(II) bromide PbBr2 (98%, Sigma-Aldrich, St. Louis, MO, USA), lead(II) iodide PbI2 (99%, Sigma-Aldrich), hydrobromic acid HBr (40% in H2O, Iodobrom, Crimea), hydroiodic acid HI (56% in H2O, Iodobrom), hypophosphorous acid H3PO2 (50% in H2O, Acros Organics, Geel, Belgium), methylamine CH3NH2 (38% in H2O, Lenreactiv, Saint Petersburg, Russia), pyridine (99.8% Sigma-Aldrich) and BiBr3 (98% Sigma-Aldrich) were used as received. Silica gel was prepared from sodium metasilicatecrystallohydrate solution Na2SiO3·9H2O with the distilled water as solvent. To stabilize the hydroiodic acid, hypophosphorous acid was added to it in the 9:1 volume ratio. All solutions and sols, where HI was used as a solvent or reagent, were prepared using this stabilized solution with H3PO2.
The counterdiffusion-in-gel growth method [22] developed by us was used for crystal growth of single crystals of materials studied. The glass U-tubes were filled with silica gel and solutions of lead halides and amines (methylamine, pyridine) in hydrohalic acid with 1 M concentrations. For Bi3+-doped crystals the BiBr3 was used with 1 M concentration in the solution.

3.2. Basic Characterization

In order to prove the single phase nature of synthesised materials the X-ray diffraction was recorded from crushed crystals with a high resolution X-ray diffractometer Bruker D8 Discover using a long focus X-ray tube CuK α anode. Reflected X-rays were detected using a solid position-sensitive detector LYNXEYE. Measurements were carried out at room temperature and proved the known crystal structure and single-phase nature of studied samples.

3.3. DRS Measurements

The grown single crystals were crushed in an agate mortar. Next, a series of diluted mixtures was prepared: at each next stage, the previous powder was diluted twice by weight with BaSO4 powder. The volume fraction was determined from known material densities: ρ (BaSO4) = 4.5 g/cm3, ρ (MAPbI3) = 4.159 g/cm3 [29], ρ (MAPbBr3) = 3.83 g/cm3 [30], ρ (PyPbI3) = 3.837 g/cm3 [27]. The DRS spectra were recorded by the Cary 5000 UV-Vis-NIR spectrometer equipped with a diffuse reflectance apparatus.

3.4. DRS Spectra Fitting for Two Dilutions

Let the F 1 and F 2 values are obtained when measuring DRS for two fractions β 1 and β 2 . In this case material parameters could be found in the following way:
K 1 S 2 = F 1 F 2 F 1 F 2 · β 1 β 2 β 1 β 2 , S 1 S 2 = F 1 F 2 F 1 F 2 1 β 1 F 1 β 1 1 β 2 F 2 β 2 .
The expression further simplifies if the undiluted sample is taken as the first point ( β 1 = 1 ):
K 1 S 2 = F 1 F 2 F 1 F 2 · β 2 1 β 2 , S 1 S 2 = F 1 F 2 F 1 · 1 β 2 β 2 .

3.5. Conversion between Mass and Volume Fractions

Let us denote the mass fraction as γ = m 1 m 1 + m 2 , where m 1 , 2 are masses of the sample and the matrix powders. Volumes of materials could be determined as V 1 , 2 = m 1 , 2 ρ 1 , 2 , where ρ 1 , 2 are materials densities. The volume fraction could be found as:
β = ρ 2 ρ 1 · γ 1 γ 1 ρ 2 ρ 1 .
Substitution of β into Equation (3) leads to the following equation for F ( γ ) value:
F ( γ ) = K 1 S 2 · ρ 2 ρ 1 · γ 1 1 S 1 S 2 · ρ 2 ρ 1 γ .

4. Conclusions

In conclusion, we have described the diffuse reflectance spectroscopy with dilution—a method being able to independently obtain relative absorption and scattering spectra of strongly absorbing materials. The use of this method is especially promising for halide perovskites, since these materials have strong absorption and a complex energy structure of transitions. This method allows to measure powders and pulverized single crystals, which significantly expands applicability of the method compared to transmission spectroscopy of thin films. We have demonstrated the applicability of this method to obtain reliable data on the energy structure of 3D perovskites and their low-dimensional analogues, including doped ones. The method allows to distinguish exciton and interband absorption, as well as defect bands and tail states. We hope that the addition to the existing and extremely widespread DRS experimental technique discussed in our work will open up for many groups the possibility of obtaining reliable and physically significant results concerning the optical structure of halide perovskites and their low-dimensional analogues.

Author Contributions

Investigation A.O.M., A.Y.S., N.I.S.; supervision A.V.E., C.C.S., Y.V.K.; writing—original draft A.O.M., Y.V.K. All authors have read and agreed to the published version of the manuscript.

Funding

This research has been supported by the Ministry of Science and Higher Education of the Russian Federation (Megagrant no. 075-15-2022-1112).

Institutional Review Board Statement

Not applicable.

Informed Consent Statement

Not applicable.

Data Availability Statement

Not applicable.

Acknowledgments

This work was carried out on the equipment of the SPbU Resource Centers “Nanophotonics” and using research facilities of the laboratory “Photoactive Nanocomposite Materials” (SPbU ID: 91696387).

Conflicts of Interest

The authors declare no conflict of interest.

Sample Availability

Samples of the compounds are not available from the authors.

Abbreviations

The following abbreviations are used in this manuscript:
DRSDiffuse reflectance spectroscopy
FWHMFull width at half maximum

References

  1. Kojima, A.; Teshima, K.; Shirai, Y.; Miyasaka, T. Organometal Halide Perovskites as Visible-Light Sensitizers for Photovoltaic Cells. J. Am. Chem. Soc. 2009, 131, 6050–6051. [Google Scholar] [CrossRef]
  2. Dong, H.; Zhang, C.; Liu, X.; Yao, J.; Zhao, Y.S. Materials chemistry and engineering in metal halide perovskite lasers. Chem. Soc. Rev. 2020, 49, 951–982. [Google Scholar] [CrossRef]
  3. Van Le, Q.; Jang, H.W.; Kim, S.Y. Recent Advances toward High-Efficiency Halide Perovskite Light-Emitting Diodes: Review and Perspective. Small Methods 2018, 2, 1700419. [Google Scholar] [CrossRef]
  4. Wei, H.; Huang, J. Halide lead perovskites for ionizing radiation detection. Nat. Commun. 2019, 10, 1066. [Google Scholar] [CrossRef] [Green Version]
  5. Ahmadi, M.; Wu, T.; Hu, B. A Review on Organic–Inorganic Halide Perovskite Photodetectors: Device Engineering and Fundamental Physics. Adv. Mater. 2017, 29, 1605242. [Google Scholar] [CrossRef]
  6. Murzin, A.O.; Selivanov, N.I.; Kozlov, V.O.; Ryzhov, I.I.; Miyasaka, T.; Emeline, A.V.; Kapitonov, Y.V. Photoluminescence Excitation Spectroscopy of Defect-Related States in MAPbI3 Perovskite Single Crystals. Adv. Opt. Mater. 2021, 9, 2001327. [Google Scholar] [CrossRef]
  7. Smith, M.D.; Jaffe, A.; Dohner, E.R.; Lindenberg, A.M.; Karunadasa, H.I. Structural origins of broadband emission from layered Pb–Br hybrid perovskites. Chem. Sci. 2017, 8, 4497–4504. [Google Scholar] [CrossRef] [Green Version]
  8. Rakita, Y.; Cohen, S.R.; Kedem, N.K.; Hodes, G.; Cahen, D. Mechanical properties of APbX3 (A = Cs or CH3NH3; X= I or Br) perovskite single crystals. MRS Commun. 2015, 5, 623–629. [Google Scholar] [CrossRef] [Green Version]
  9. Yaffe, O.; Chernikov, A.; Norman, Z.M.; Zhong, Y.; Velauthapillai, A.; van der Zande, A.; Owen, J.S.; Heinz, T.F. Excitons in ultrathin organic-inorganic perovskite crystals. Phys. Rev. B 2015, 92, 045414. [Google Scholar] [CrossRef] [Green Version]
  10. Li, J.; Wang, J.; Zhang, Y.; Wang, H.; Lin, G.; Xiong, X.; Zhou, W.; Luo, H.; Li, D. Fabrication of single phase 2D homologous perovskite microplates by mechanical exfoliation. 2D Mater. 2018, 5, 021001. [Google Scholar] [CrossRef]
  11. Dunlap-Shohl, W.A.; Zhou, Y.; Padture, N.P.; Mitzi, D.B. Synthetic Approaches for Halide Perovskite Thin Films. Chem. Rev. 2019, 119, 3193–3295. [Google Scholar] [CrossRef]
  12. Kubelka, P.; Munk, F. Ein Beitrag zur Optik der Farbanstriche. Z. Techn. Physik 1931, 12, 593–609. See also English Translation by S. Westin (An Article on Optics of Paint Layers). Available online: http://www.graphics.cornell.edu/~westin/pubs/kubelka.pdf (accessed on 23 November 2022).
  13. Kodaira, T.; Nozue, Y.; Ohwashi, S.; Goto, T.; Terasaki, O. Optical properties of potassium clusters incorporated into zeolite LTA. Phys. Rev. B 1993, 48, 12245–12252. [Google Scholar] [CrossRef]
  14. Gustav, K. Reflectance Spectroscopy Principles, Methods, Applications; Springer: Berlin, Germany, 1969. [Google Scholar]
  15. Tauc, J. Optical properties and electronic structure of amorphous Ge and Si. Mater. Res. Bull. 1968, 3, 37–46. [Google Scholar] [CrossRef]
  16. Davis, E.; Mott, N. Conduction in non-crystalline systems V. Conductivity, optical absorption and photoconductivity in amorphous semiconductors. Philos. Mag. 1970, 22, 0903–0922. [Google Scholar] [CrossRef]
  17. Lösche, A. N. F. MOTT, E. A. DAVIS. Electronic Processes in Non-Crystalline Materials Clarendon-Press, Oxford 1971 437 Seiten. £ 7,50. Kristall Technik 1972, 7, K55–K56. [Google Scholar] [CrossRef]
  18. Makuła, P.; Pacia, M.; Macyk, W. How To Correctly Determine the Band Gap Energy of Modified Semiconductor Photocatalysts Based on UV–Vis Spectra. J. Phys. Chem. Lett. 2018, 9, 6814–6817. [Google Scholar] [CrossRef] [Green Version]
  19. Lefebvre, P.; Christol, P.; Mathieu, H. General formalism for excitonic absorption edges in confined systems with arbitrary dimensionality. J. Phys. IV 1993, 03, C5-377–C5-380. [Google Scholar] [CrossRef] [Green Version]
  20. Tanguy, C. Optical Dispersion by Wannier Excitons. Phys. Rev. Lett. 1995, 75, 4090–4093. [Google Scholar] [CrossRef]
  21. Patterson, E.M.; Shelden, C.E.; Stockton, B.H. Kubelka-Munk optical properties of a barium sulfate white reflectance standard. Appl. Opt. 1977, 16, 729–732. [Google Scholar] [CrossRef]
  22. Selivanov, N.I.; Murzin, A.O.; Yudin, V.I.; Kapitonov, Y.V.; Emeline, A.V. Counterdiffusion-in-gel growth of high optical and crystal quality MAPbX3 (MA = CH3NH3+, X = I-, Br-) lead-halide perovskite single crystals. CrystEngComm 2022, 24, 2976–2981. [Google Scholar] [CrossRef]
  23. Panzer, F.; Li, C.; Meier, T.; Köhler, A.; Huettner, S. Impact of Structural Dynamics on the Optical Properties of Methylammonium Lead Iodide Perovskites. Adv. Energy Mater. 2017, 7, 1700286. [Google Scholar] [CrossRef] [Green Version]
  24. Bohn, B.J.; Simon, T.; Gramlich, M.; Richter, A.F.; Polavarapu, L.; Urban, A.S.; Feldmann, J. Dephasing and Quantum Beating of Excitons in Methylammonium Lead Iodide Perovskite Nanoplatelets. ACS Photonics 2018, 5, 648–654. [Google Scholar] [CrossRef]
  25. Blancon, J.C.; Stier, A.V.; Tsai, H.; Nie, W.; Stoumpos, C.C.; Traoré, B.; Pedesseau, L.; Kepenekian, M.; Katsutani, F.; Noe, G.T.; et al. Scaling law for excitons in 2D perovskite quantum wells. Nat. Commun. 2018, 9, 2254. [Google Scholar] [CrossRef] [Green Version]
  26. Hirasawa, M.; Ishihara, T.; Goto, T. Exciton Features in 0-, 2-, and 3-Dimensional Networks of [PbI6]4-Octahedra. J. Phys. Soc. Jpn. 1994, 63, 3870–3879. [Google Scholar] [CrossRef]
  27. Selivanov, N.I.; Murashkina, A.A.; Kevorkyants, R.; Emeline, A.V.; Bahnemann, D.W. Pyridinium lead tribromide and pyridinium lead triiodide: Quasi-one-dimensional perovskites with an optically active aromatic π-system. Dalton Trans. 2018, 47, 16313–16319. [Google Scholar] [CrossRef]
  28. Lozhkina, O.A.; Murashkina, A.A.; Shilovskikh, V.V.; Kapitonov, Y.V.; Ryabchuk, V.K.; Emeline, A.V.; Miyasaka, T. Invalidity of Band-Gap Engineering Concept for Bi3+ Heterovalent Doping in CsPbBr3 Halide Perovskite. J. Phys. Chem. Lett. 2018, 9, 5408–5411. [Google Scholar] [CrossRef]
  29. Stoumpos, C.C.; Malliakas, C.D.; Kanatzidis, M.G. Semiconducting Tin and Lead Iodide Perovskites with Organic Cations: Phase Transitions, High Mobilities, and Near-Infrared Photoluminescent Properties. Inorg 2013, 52, 9019–9038. [Google Scholar] [CrossRef]
  30. Weber, D. CH3NH3PbX3, ein Pb(II)-System mit kubischer Perowskitstruktur/ CH3NH3PbX3, a Pb(II)-System with Cubic Perovskite Structure. Z. Naturforschung B 1978, 33, 1443–1445. [Google Scholar] [CrossRef]
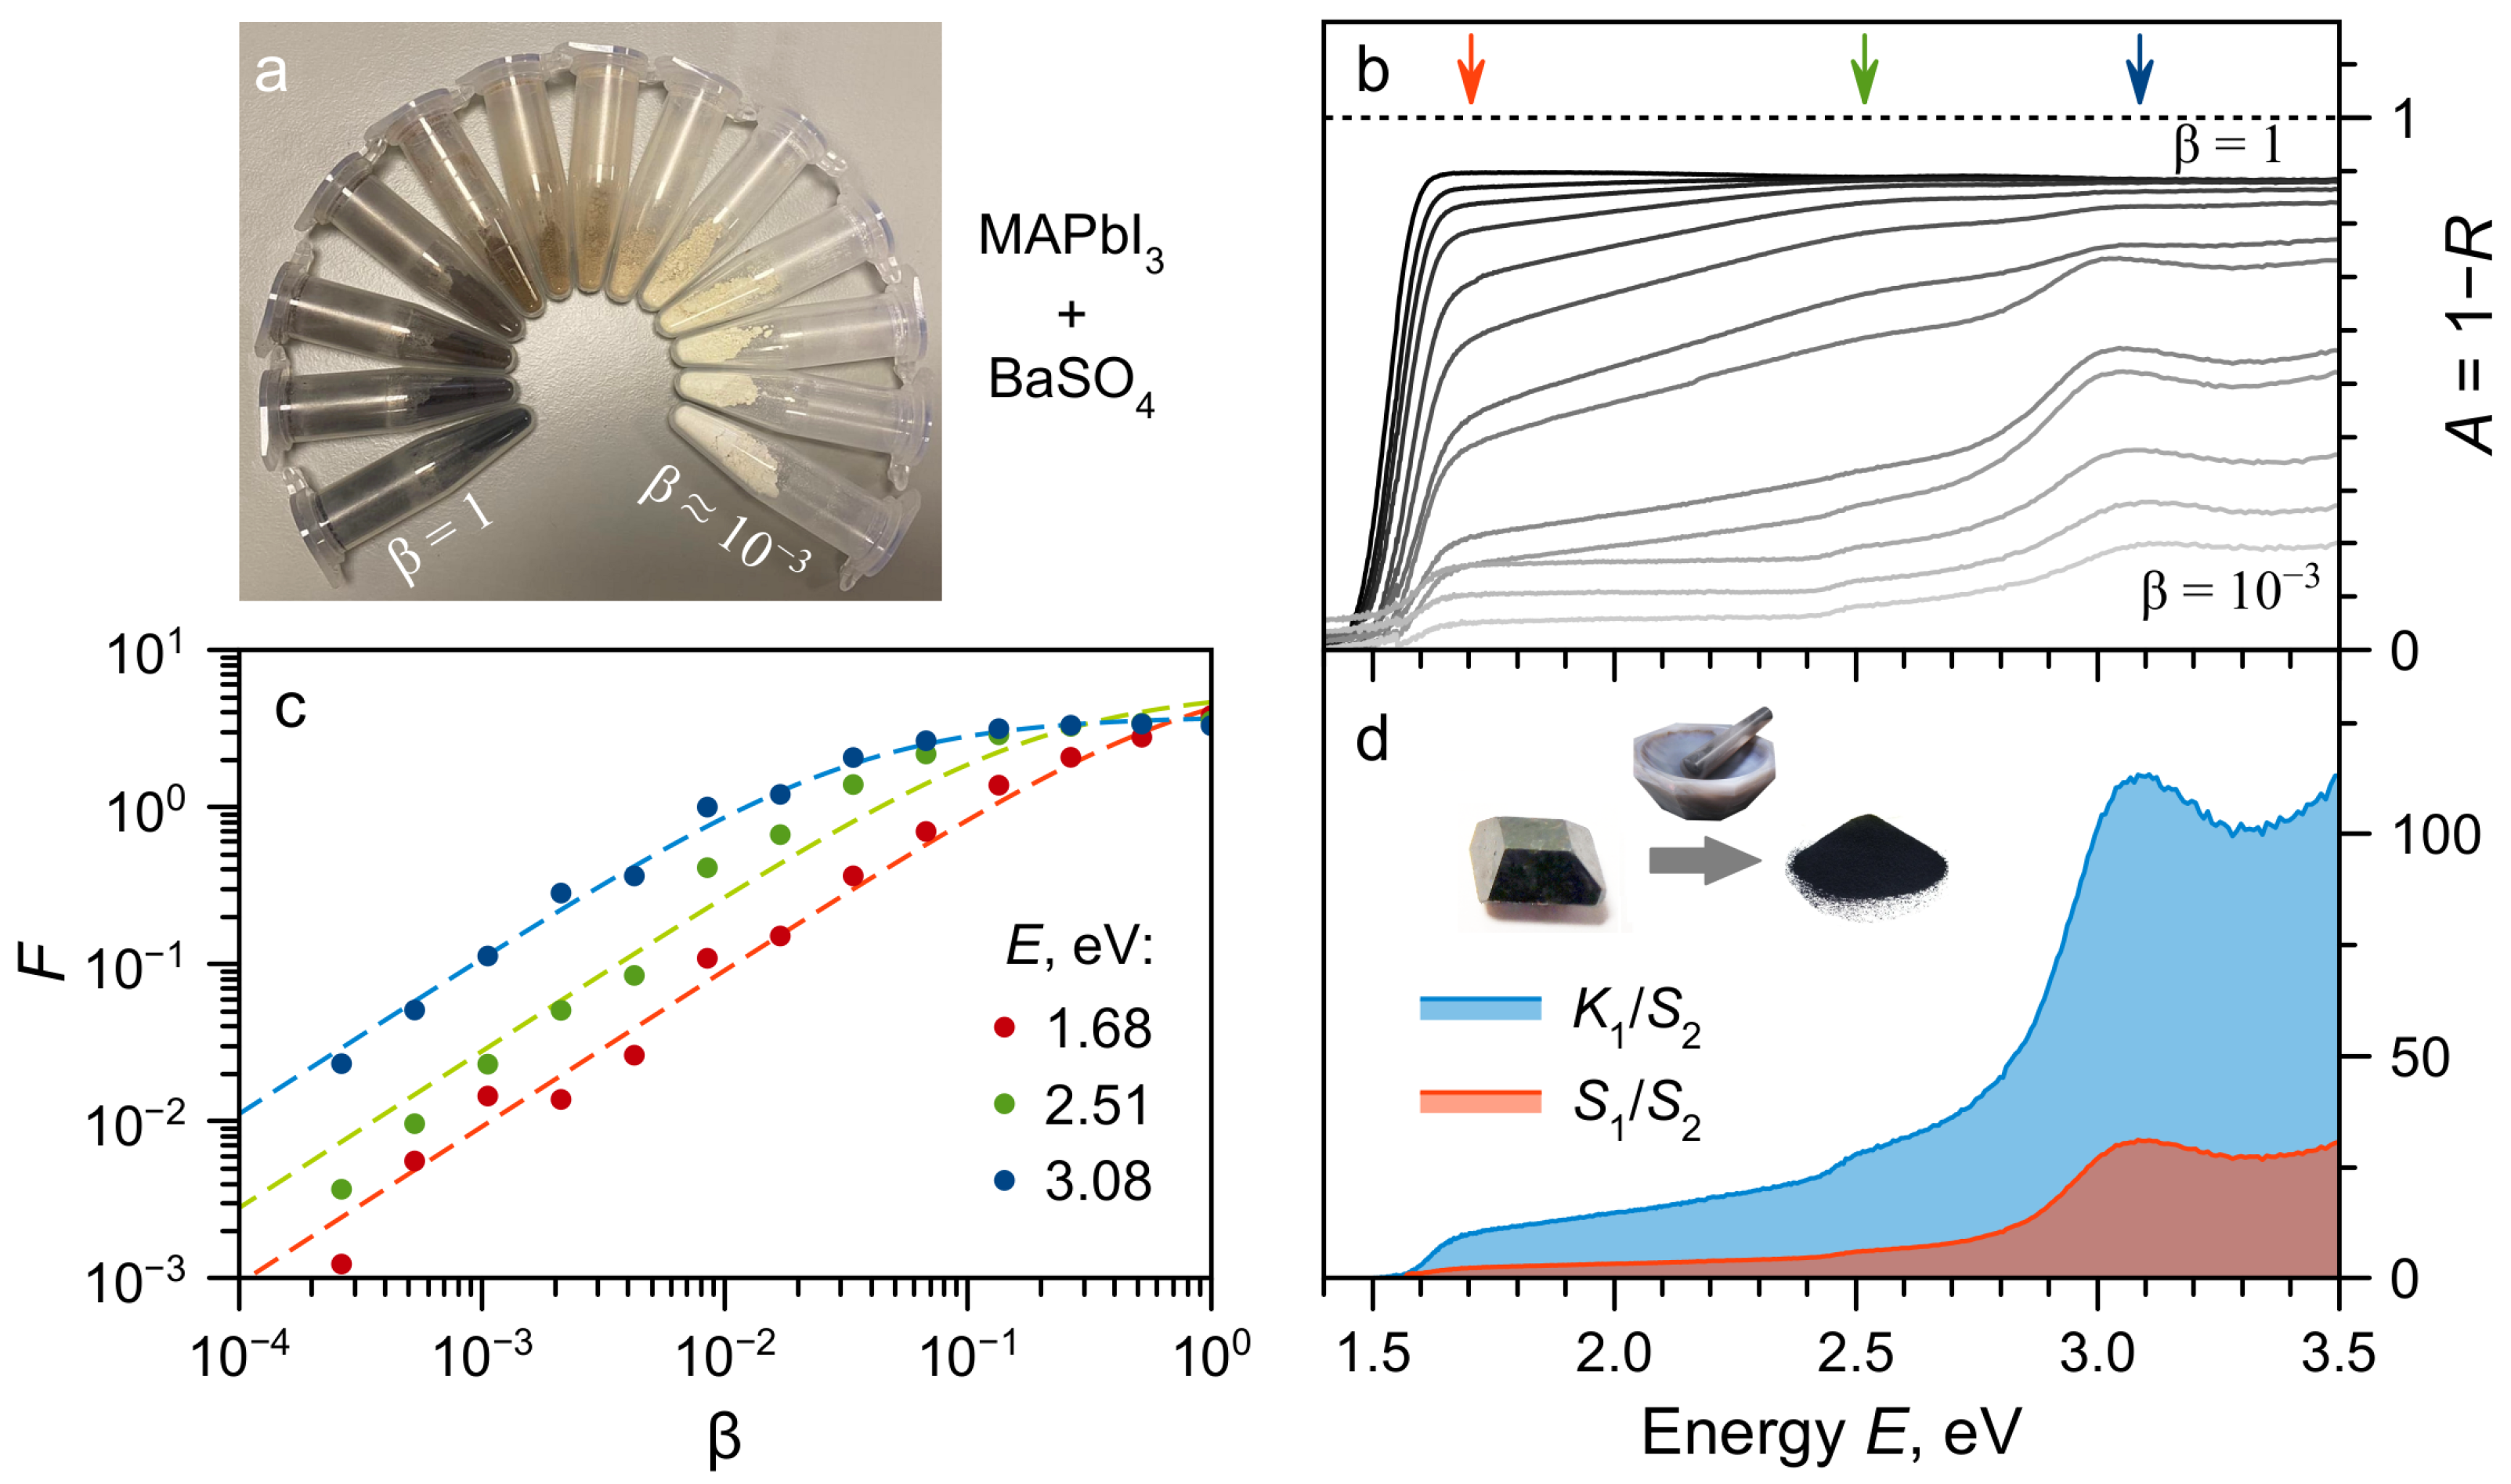
Figure 1. (a) Vials with mixtures of MAPbI3 and BaSO4 powders starting from undiluted MAPbI3 ( β = 1 ) and halving the mass fraction for every next vial clockwise. Note the appearance of the material colour at β > 0.1 (sixth and further vials). (b) DRS spectra of powders mixtures from (a). (c) Dependence of the Kubelka–Munk transformation F of DRS data on the volume fraction β for different light energies (dots). Dots color corresponds to the energies marked by arows in (b). Dashed curves—fit by Equation (3). (d) Relative absorption K 1 S 2 and scattering S 1 S 2 coefficients of MAPbI3 extracted from DRS data fitting. Inset shows the pulverization process schematically.
Molecules 28 00350 g001
Figure 2. (a) DRS spectra of powders mixtures of PyPbI3 and BaSO4 for different mass fractions β . (b) Relative absorption K 1 S 2 coefficients of PyPbI3 extracted from DRS data fitting. Dashed line—Gaussian fit of the excitonic resonance. (c) DRS spectra and relative absorption K 1 S 2 coefficients in linear (d) and log (e) scales for undiluted MAPbBr3 (orange curves) and MAPbBr3:Bi (red curves) powders. Dashed curves in (e) are fits by Gaussian (orange) and exponent (red) functions.
Molecules 28 00350 g002
Disclaimer/Publisher’s Note: The statements, opinions and data contained in all publications are solely those of the individual author(s) and contributor(s) and not of MDPI and/or the editor(s). MDPI and/or the editor(s) disclaim responsibility for any injury to people or property resulting from any ideas, methods, instructions or products referred to in the content.