Abstract
Selenium (Se) is a trace mineral found in plants with a distinct sulfuric odor that is cardioprotective and reported to have low toxicity. West Java, Indonesia, has a variety of plants with a distinct odor that are consumed raw, such as jengkol (Archidendron pauciflorum). This study is conducted to determine the Se content of jengkol using the fluorometric method, where the jengkol extract is separated, and the Se content is detected using high-pressure liquid chromatography (HPLC), combined with fluorometry. Two fractions with the highest Se concentration (A and B) are found and characterized using liquid chromatography mass spectrometry to predict the organic Se content by comparing the results with those in the external literature. The Se content of fraction (A) is found to be selenomethionine (m/z 198), gamma glutamyl-methyl-selenocysteine-(GluMetSeCys; m/z 313), and the Se-sulfur (S) conjugate of cysteine-selenoglutathione (m/z 475). Furthermore, these compounds are docked on receptors involved in cardioprotection. The receptors are peroxisome proliferator-activated receptor-γ (PPAR-γ), nuclear factor kappa-B (NF-κB), and phosphoinositide 3-kinase (PI3K/AKT). The interaction of receptor and ligan that has the lowest binding energy of the docking simulation is measured with molecular dynamic simulation. MD is performed to observe bond stability and conformation based on root mean square deviation, root mean square fluctuation, radius gyration, and MM-PBSA parameters. The results of the MD simulation show that the stability of the complex organic Se compounds tested with the receptors is lower than that of the native ligand, while the binding energy is lower than that of the native ligand based on the MM-PSBA parameter. This indicates that the predicted organic Se in jengkol, i.e., gamma-GluMetSeCys to PPAR-γ, gamma-GluMetSeCys AKT/PI3K, and Se-S conjugate of cysteine-selenoglutathione to NF-κB, has the best interaction results and provides a cardioprotection effect, compared to the molecular interaction of the test ligands with the receptors.
1. Introduction
In recent years, cardiovascular disease (CVD) has been the leading cause of death in the world [1]. Various triggers of the disease include other diseases, such as hypertension and diabetes, and lifestyle factors, such as a lack of exercise, smoking, and a high-fat diet [2]. The risk factors damage and cause the death of cardiomyocytes, which leads to CVD [3]. The cell survival processes associated with apoptosis or necrosis, inflammation, and autophagy [4] involve the peroxisome proliferator-activated receptor-γ (PPAR-γ; apoptosis and inflammation) [5], nuclear factor kappa-B (NF-κB; inflammation) [6], and phosphoinositide 3-kinase (PI3K/AKT; autophagy and apoptosis) [7], all of which play a role in heart cell survival.
Furthermore, due to their role in cell metabolism, several minerals, such as iron (Fe), zinc (Zn), copper (Cu), and selenium (Se), play major roles in a cardioprotective diet [8]. An Se-deficient diet can cause heart cell defects, leading to Keshan disease [9,10]. A previous study claimed that Se has a cardioprotective effect, preventing necrosis of heart cells [11], reducing apoptosis and autophagy [12], and reducing inflammation [13]. Investigation of the cardioprotective mechanism of Se as well as the signaling pathways involved is ongoing in the development of new therapeutic strategies [14]. The effects of Se in reducing apoptosis and autophagy via the PPAR-γ pathway [15], cardio- and endothelial cell protection via the PI3K/AKT pathway [16,17], and inflammation through activation of the NF-ΚB, which is a proinflammatory cytokine, have all been previously studied [18].
Some evidence shows that Se supplementation is beneficial for preventing chronic diseases and it is followed with the development studies of selenium as a dietary supplement from food sources [19] and plants [20]. The organic form of Se is often given as a supplement because it is less toxic [21], has better absorption, and has high bioavailability [22]. Organic Se is also known to have anti-inflammatory and cardioprotective effects [23], such as that of selenomethionine [24,25]. Various plants are natural sources of organic Se [26,27] wherein Se is transported via a sulfur (S) transporter and metabolized in the S pathway [28]. Previous studies have shown that the Se and S in plants compete for biochemical processes such as the assimilation of amino acids into essential proteins [29]. The S content of Allium sp. produces a characteristic odor and is found to contain selenocysteine and glutamyl-methyl-selenocysteine (GluMetSeCys) [30]. Jengkol (Archidendron pauciflorum) fruit seeds have a strong amino acid cysteine scent, which contains S [31]. The S contents of Allium sativum (garlic) [32] and jengkol, are 2.3% and 25.9%, respectively [33], which means that the Se content in jengkol is higher than that in garlic. Jengkol is often consumed raw and is part of the culture of West Java, Indonesia [34]. Therefore, it is interesting to know the characteristics of organic Se in jengkol as a candidate of organic Se dietary supplement’s food source and its correlation with cardioprotection through molecular interaction.
Currently, studies on the types of organic Se in jengkol and their molecular interaction with a cardioprotection receptor have not been carried out. In this study, we analyze Se and predict the characteristics of organic Se in jengkol using fluorometric analysis, followed by liquid chromatography mass spectrometry (LC-MS). The spectrum data obtained are matched with those from the external literature or previous studies. Meanwhile, to determine activity in heart protection, an in silico study is carried out on several cardioprotective receptors. The studies include molecular docking and molecular dynamic simulation through PPAR-γ, NF-ΚB, and AKT/PI3K.
2. Results
2.1. Jengkol Se Content Analysis
First, to determine the selenium concentration, a calibration standard was made with various concentrations of sodium selenite (Na2SeO3) which were calculated as selenium. The calibration standard series concentrations were 0, 0.05, 0.10, 0.20, 0.50, and 1.00 μmol/L (equation: y = 26,704x + 26,148; coefficient correlation: 0.999). The limits of detection and quantification obtained were 0.21 and 0.63 μmol/L, respectively. Jengkol was obtained from 15 cities or regencies in West Java, Indonesia, and their Se levels range from 27.3 to 498 ng/g. The highest level of selenium detected was in Kabupaten Subang. The results of the Se content of jengkol from West Java are shown in Table 1.

Table 1.
Se content of Jengkol from West Java, Indonesia.
2.2. Separation of the Jengkol Extract Using HPLC Combined with Fluorometry
Before the organic Se characterization of jengkol, separation of the jengkol extract using HPLC based on elution time was performed. In this study, the HPLC-PDA Waters® (photodiode array detector) was used to obtain a fingerprint 3D chromatogram for jengkol extract. The mobile phase used was a gradient elution system with water and ACN for 40 min. The chromatogram showed several peaks (Figure 1) with different maximum wavelengths. The separation solution was stored in the tube at elution times of 0–10 (0), 10–20 (A), 20–30 (B), and 30–40 (C) min. Separation was carried out to obtain the fraction with the most Se content, which was then characterized for its organic Se content using the fluorometric method.
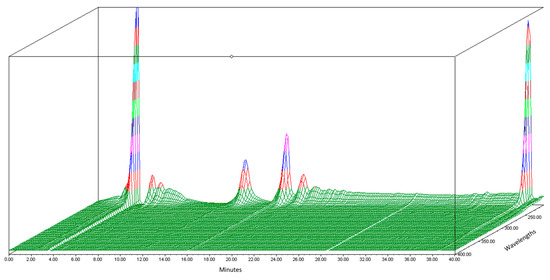
Figure 1.
3D Chromatogram of jengkol extract using HPLC-PDA.
These fractions (Table 2) were identified, and their levels were calculated using the fluorometric method with 2,3-diaminonaphthalene reagent. The determination of selenium concentration in the separated fractions was carried out by calibration standard. The fluorometric method used the Se selenite as the standard with various concentrations of 0.1–1 μmol/L. The correlation coefficient (r) obtained was 0.96 and the equation y = 32,297x + 17,918. The fractions (A) and (B) had Se levels of 0.45 and 0.7 μmol/L, respectively, with fraction B having the highest Se concentration (Table 2). The 3D chromatogram was scanned at 210–400 nm. It shows four main peaks at 8.77, 13.11, 16.96, and 18.441 min of retention time, which had maximum wavelength at 375, 265, 273, and 267 nm, respectively (Figure 2).
Table 2.
Se concentration in jengkol extract fractions.
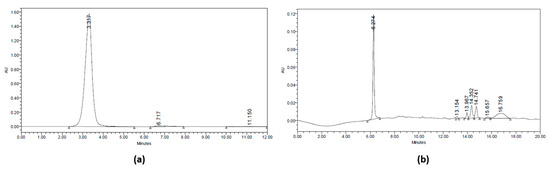
Figure 2.
HPLC Chromatogram at 210 nm. (a) Fraction (A) of jengkol extract (10–20) and (b) fraction (B) of jengkol extract (20–30).
Because the peaks in fraction (B) were more numerous, the HPLC results were separated again into a tube. Fraction (B) was collected at 0–10 (B1) and 10–20 (B2) min. A second separation was performed to reduce the amount of the compound in the solution. The collected fractions were put into a tube and freeze-dried to reduce the solvent for further analysis using LC-MS.
2.3. Characterization of Organic Se Using LC-MS
The A, B1, and B2 fractions were then analyzed using LC-MS to identify organic Se compounds based on their molecular weight. The chromatogram of jengkol fraction (Figure 3) shows a different peak and fingerprint. Each peak was analyzed using MS. The data collection on organic Se compounds was carried out on the basis of previously published scientific articles [27,35,36,37]. In addition, compound prediction was carried out using MS based on the possible elemental composition of the compound.
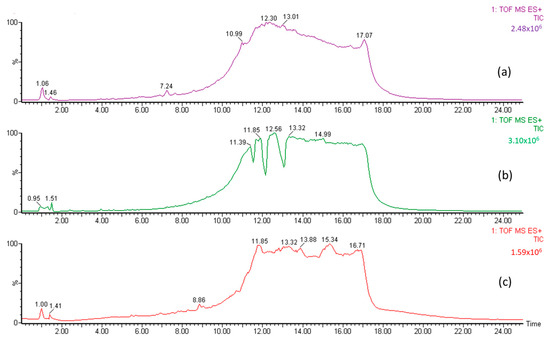
Figure 3.
LC chromatogram for (a) fraction (A) of the jengkol extract, (b) fraction (B1) of the jengkol extract, and (c) fraction (B2) of the jengkol extract.
The organic Se compounds found in fraction (A) are selenomethionine [38], gamma-glu-MetSeCys [27], and the Se-S conjugate of cysteine-selenoglutathione [27], whose molecular weights, according to the literature, are m/z 198, m/z 313, and m/z 475, respectively, as shown in Figure 4. In the (B1) fraction are C3H9N4Se (m/z 181) and C5H11N4OSe (m/z 223), which are fragments of Se organic compounds. In the (B2) fraction, most of the compounds cannot be determined with the previous literature, so they were excluded from this study. The result of prediction compounds in fraction (A) was continued for molecular docking studies. The organic Se compounds based on the possible elemental composition of the compounds are shown in Table 3.
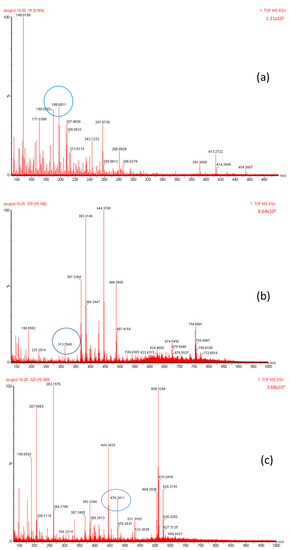
Figure 4.
Mass spectrum fraction of the jengkol extract (A), i.e., (a) selenomethionine (m/z 198), (b) gamma-glu-MetSeCys (m/z 313), and (c) the Se-S conjugate of cysteine-selenoglutathione (m/z 475).
Table 3.
Prediction of molecular formula based on (m/z) in the jengkol extract fraction.
2.4. Docking Simulation of Organic Se in Jengkol to Cardioprotection Receptor
The molecular docking was performed with three ligand tests, which were the result of the LC-MS prediction of fraction (A) of the jengkol extract, i.e., between selenomethionine (Se01), gamma-glu-MetSeCys (Se02), and the Se-S conjugate of cysteine-selenoglutathione (Se03) and the cardioprotective receptors, PPAR-γ, NF-κB, and AKT/PI3K.
The result of the docking of the three organic Se compounds with PPAR-γ and their visualization are shown in Figure 5. The docking simulations in the three ligand tests were analyzed for binding energy, hydrogen bond, hydrogen bond distance, nearest amino acid residues, and other interactions (Table 4).
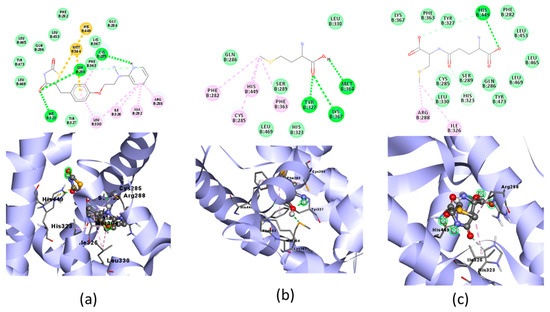
Figure 5.
Molecular docking visualization of PPAR-γ and organic Se (a) the Se-S conjugate of cysteine-selenoglutathione (Se03), (b) selenomethionine (Se01) and (c) gamma-GluMetSeCys (Se02).
Table 4.
Molecular docking of PPAR-γ and selenomethionine, gamma-GluMetSeCys, and the Se-S conjugate of cysteine-selenoglutathione.
The molecular docking simulations of the native ligand with AKT/PI3K receptors are shown in Figure 6, and the result of the docking of the three organic Se compounds are written in Table 5.
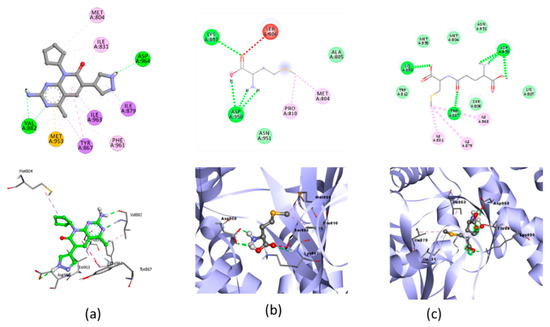
Figure 6.
Molecular docking visualization of AKT/PI3K and (a) Native Ligand, (b) selenomethionine (Se01) and (c) Gamma-GluMetSeCys.
Table 5.
Molecular docking of AKT/PI3K and selenomethionine, gamma-GluMetSeCys, and the Se-S conjugate of cysteine-selenoglutathione.
The molecular docking simulations of NF-KB are shown in Table 6. The molecular docking visualization of the NF-KB receptor is shown in Figure 7.
Table 6.
Molecular docking of NF-ΚB and selenomethionine, gamma-GluMetSeCys, and the Se-S conjugate of cysteine-selenoglutathione.
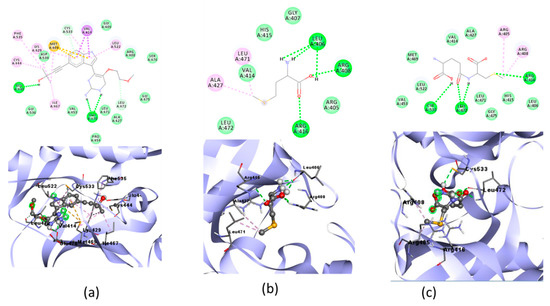
Figure 7.
Molecular docking visualization of NF-ΚB and (a) Native Ligand, (b) selenomethionine (Se01) and c) gamma-GluMetSeCys (Se02).
2.5. Molecular Dynamic Simulation
2.5.1. Root Mean Square Deviation (RMSD) and Root Mean Square Fluctuation (RMSF) Analysis of the Ligand–Receptor Complex
The ligand–receptor complexes were analyzed using molecular dynamic simulations over a 100 ns simulation using GROMACS 2016. System stability over a 100-ns simulation was successfully measured via RMSD and RMSF (Figure 8).
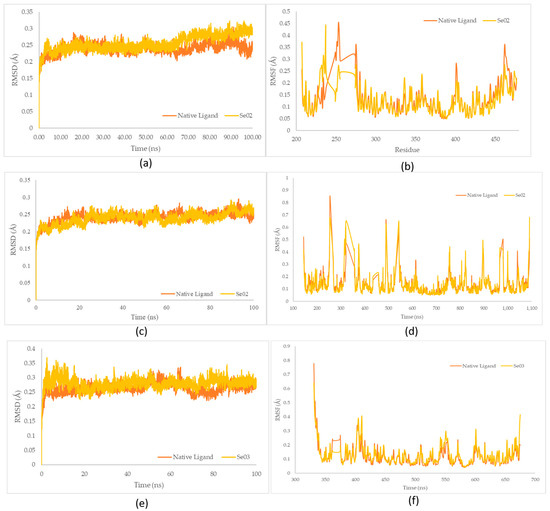
Figure 8.
(a) RMSD complex of PPAR-γ; (b) RMSF value of native ligand–PPAR-γ (orange) and gamma-GluMetSeCys (Se02)–PPAR-γ (yellow) complexes; (c) RMSD complex of PI3K; (d) RMSF value of native ligand–PI3K (orange) and gamma-GluMetSeCys (Se02)–PI3K (yellow) complexes; (e) RMSD complex of NF-ΚB; (f) RMSF value of native ligand–NF-ΚB (orange) and Se-S conjugate of cysteine-selenoglutathione (Se03)– NF-ΚB (yellow) complexes.
The native ligand–PPAR-γ complex showed lower fluctuations than gamma-GluMetSeCys (Se02), with RMSD fluctuations of 0.240 Å and 0.255 Å, respectively. Furthermore, the gamma-GluMetSeCys (Se02)–PI3K complex showed low fluctuations compared with the native ligand, with an average increase in RMSD for each system at 0.237 Å and 0.240 Å, respectively. Meanwhile, the native ligand–NF-KB complex showed a similar decrease to the Se-S conjugate of cysteine-selenoglutathione (Se03), with an average RMSD fluctuation of 0.264 Å and 0.280 Å, respectively. The RMSD average values showed the lowest fluctuations for native ligands of the PPAR-γ and NF-KB receptors, while gamma-GluMetSeCys (Se02) had the lowest fluctuations for PI3K receptors.
2.5.2. Solvent-Accessible Surface Area (SASA) Analysis
The identification of SASA was carried out to predict conformational changes of proteins during the simulation that were accessible to water molecules. SASA value estimates the increased of computational complexity and accuracy, as well as the knowledge-based environmental of free energy potential based on the SASA values [39]. SASA was used to analyze over 100 ns of simulations of the MD trajectory, which is shown in Figure 9.
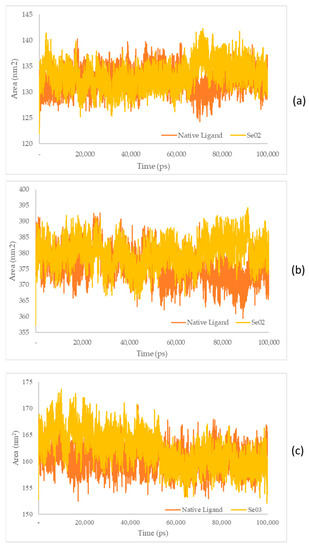
Figure 9.
(a) SASA plot of the native ligand–PPAR-γ (orange) and gamma-GluMetSeCys (Se02)–PPAR-γ (yellow) complexes; (b) SASA plot of the native ligand–PI3K (orange) and gamma-GluMetSeCys (Se02)–PI3K (yellow) complexes; (c) SASA plot of the native ligand–NFκB (orange) and the Se-S conjugate of cysteine-selenoglutathione (Se03)–NF-KB (yellow) complexes.
2.5.3. Radius Gyration (Rg) Analysis
The measurement of the Rg aims to identify the stability of the complex in its folded or unfolded form during the simulation [40]. The Rg plots of the molecular dynamic simulation of the three receptors and each test ligand are shown in Figure 10.
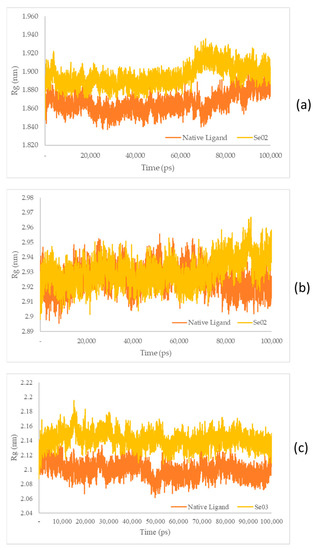
Figure 10.
(a) Rg plot of the native ligand–PPAR-γ (orange) and gamma-GluMetSeCys (Se02)–PPAR-γ (yellow) complexes; (b) Rg plot of the native ligand–PI3K (orange) and gamma-GluMetSeCys (Se02)–PI3K (yellow) complexes; (c) Rg plot of the native ligand–NF-ΚB (orange) and the Se-S conjugate of cysteine-selenoglutathione (Se03)–PI3K (yellow) complexes.
2.5.4. MM-PBSA Binding Free Energy Calculations
The binding free energy of the molecular dynamic trajectories of the system complexes was calculated using the MM-PBSA method from the 0–100 ns timestep (Table 7).
Table 7.
MM-PBSA energy summary of ligand–receptor during the 100 ns simulation.
3. Discussion
3.1. Analysis of the Se Content in Jengkol
A fluorometric method was performed for the formation of the complexes of piazselenol, which is from selenite and 2,3-diaminonaphthalene. This method was recommended in the AOAC 1996 compendium for Se determination [41]. The advantages of the fluorometric method are that it can be used to measure low sample concentrations and is more selective and sensitive. The fluorometric method makes it possible to reach detection limits of up to ppm–ppb units [42,43].
The highest level of Se from jengkol, detected in Kabupaten Subang, West Java, was 498 ng/g, which is higher than that of garlic (69.2 ng/g) from previous studies of the same province [44]. In another study from Turkey, the Se levels in onions and garlic were 24 ng/g and 15 ng/g, respectively [45], showing that jengkol has a greater Se content and is a potential source of Se supplementation. The procedure was continued with the characterization of organic Se based on the fraction with the highest Se content.
3.2. Separation of the Jengkol Extract and Characterization of Organic Se
Fractions (A) and (B) have compounds with lower molecular weights, and their retention times show higher polarity because the more carbon and hydrogen atoms they have, the less polar they are [46]. In a previous study, the selenomethionine (Se01), gamma-GluMetSeCys (Se02) and Se-S conjugate of cysteine-selenoglutathione (Se03) were seleno-compounds that are found in sunflower, radish, and onion sprouts by MS [27]. Selenomethionine and gamma-GluMetSeCys are also found in garlic (A. sativum) [37]. An in vitro study of H9C2 cardiac myoblasts found the potential benefit of selenomethionine with limited efficacy as an agent for treatment of heart attacks [24]. Contrary to claims that Se has a protective effect, cardiotoxic studies in zebrafish have shown that selenomethionine has a negative effect on the hearts of fish [47]. But until now, there has been no study of the interaction between selenomethionine, gamma-GluMetSeCys, and the Se-S conjugate of cysteine-selenoglutathione and receptors that affect cardioprotection.
3.3. Docking Simulation of Organic Se in Jengkol to a Cardioprotective Receptor
3.3.1. Preparation of Protein Receptor and Validation
PPAR-γ, which belongs to the superfamily of nuclear receptors and serves as a ligand-inducible transcription factor, has been studied in CVDs [48]. Recent studies have explained that PPAR-γ activation can prevent an inflammatory response in cardiac tissue [49]. To determine whether the docking molecular simulation system was valid, validation was carried out by redocking native ligands. The validation obtained with the redocking of the native ligand (rosiglitazone) to PPARγ receptors (PDB:2PRG) was 1.91 Å, which met the requirement (<2 Å). The Gibbs free energy (ΔG) obtained −9.37 kkal/mol, and the hydrogen bond was at CYS285, SER289, HIS323. The acidic head group is crucial for PPAR activation. It forms an H-bonding network with a part of the PPAR that mainly contains the critical polar residues. The carbonyl groups of rosiglitazone create hydrogen bonds with HIS449 and HIS323 [50].
The molecular docking validation of the native ligand to AKT/PI3K receptors obtained 0.635 Å, which met the requirement (<2 Å). The Gibbs Free energy (ΔG) obtained −8.7 kkal/mol, and the hydrogen bond was at VAL882 and ASP964. NF-κB validation was 1.732 Å and met the requirements (<2 Å) [51]. The Gibbs free energy (ΔG) obtained −9.71 kkal/mol, and the hydrogen bond was at GLU440 and GLU470.
3.3.2. Docking Simulation
PPAR-γ is a key regulator in maintaining energy homeostasis [52] and functions as a ligand-induced transcription factor whose activation inhibits cardiac tissue inflammatory responses and minimizes ischemic pathological damage to the heart [53]. The test ligand was docked with PPAR-γ; Se02 had the lowest free binding energy (−4.44) compared with Se01 and Se03, which were−3.99 and −3.32, respectively, but was higher when compared with the native ligand, which was −9.37. SE02 created hydrogen bonds with HIS449 and had a greater number of the same interaction sites as that of the native ligand, such as LEU330, LEU453, LEU465, LEU469, PHE282, PHE363, TYR327, TYR473, HIS323, ARG288, and ILE326. For the hydrogen bond and hydrogen bond distance, the three test compounds did not have similarities with the native ligands. Therefore, the SE02 compound was chosen for its molecular dynamics with the PPAR-γ receptor.
Oxidative stress is characterized by a decreased activation of the PI3K/AKT pathway in the apoptosis of various cells [54]. Research on Se-deficient heart cells showed inhibition of the PI3K/AKT pathway [17]. The test ligand was docked with AKT/PI3K, and the result showed that SE02 had the lowest free binding energy compared with SE01 and SE03, which were −5.04, −4.5, and −4.67, respectively. Compared with the native ligand, the three test ligands had a higher bond-free energy at −8.7. SE02 had a greater number of the same interactions as the native ligand, such as MET804, ILE831, ILE879, and ILE963. For the hydrogen bond and hydrogen bond distance, the three test compounds did not have similarities with the native ligands. Therefore, the SE02 compound was chosen for its molecular dynamics with the AKT/PI3K receptor.
The protective effect of Se on inflammation associated with oxidative stress can also be seen from the activation of NF-ΚB, which is a proinflammatory cytokine [18]. In the molecular docking of the three organic Se compounds, SE03 had the lowest free binding energy compared with SE01 and SE02, which were −5.56, −4.86, and −5.27, respectively. Compared with the native ligand, the three test ligands had a greater bond-free energy. SE03 also had a greater number of the same interactions as the native ligand, such as GLY475, LEU472, ASP534, SER476, and GLU470. SE03 had the same hydrogen bond as native ligands on GLU470 with a larger hydrogen bond distance, and had the nearest amino acid residue, which was the same as that of the native ligand, specifically GLU470. SE01 and SE02 did not have the same hydrogen bonds or closest amino acid residues as the native ligand. Therefore, the SE03 compound was chosen for its molecular dynamics with the NF-κB receptor.
3.4. Molecular Dynamic Simulation
RMSD analysis was used to assess the stability of the complex over time, and RMSF analysis was used to assess the fluctuation and stability per amino acid [55]. The native ligand and the best test ligand result of docking stimulation were perform with molecular dynamics . After that the complex stability of Se02 also compared to the native ligand which inhibited PPAR-γ receptors. Amino acid fluctuations of the two receptor complex systems analyzed using RMSF showed similar patterns in all regions for the PPAR-γ receptor residue numbers: 207, 237, 253, 275, 401, and 462; and for the PI3K receptor: 144, 255, 323, 490, 544, 980, and 1092. The residue values of NF-ΚB receptors (331, 405, 411, 601, and 675) compared with the PPAR-γ, PI3K, and NF-KB receptors showed higher fluctuations than other residues. These residues were visible on the amino acid chain which was responsible for the loop region.
The SASA receptor ligand–PPAR-γ complex was revealed. In the graph, the native ligand shows similarly low fluctuations compared with Se02, with values of 132.33 nm2 and 133.21 nm2, respectively. The SASA for the PI3K–ligand–receptor complex shows a graph that has the same lower fluctuation value as Se02, with an average value of 375.84 and 380.09 nm2 for the native ligand and Se02, respectively. SASA for the NF-ΚB–ligand–receptor complex shows a graph that has similar decreased-fluctuation values compared to Se03, with an average value of 160.62 and 162.27 nm2 for the native ligand and Se03, respectively. Lower SASA values were given by the native ligand, followed by the test ligand. A lower SASA value indicates a more stable complex system [56]. This analysis correlates with the RMSD value, which showed that the native ligand had better stability with the receptor than the tested ligand.
The Rg plots show a characteristic similarity between the protein–native ligand complex as well as the protein–exposed test ligands (SE02 and engkolSE03). Analysis of the stability of the native ligand–PPAR-γ complex shows a graph with a low stability value against SE02, with an average Rg value of 1.86 and 1.89 nm for the native ligand-PPAR-γ complex and SE02, respectively. Rg in the native ligand–PI3K complex, which yielded better stability values than SE02, yielded Rg values of 2.92 nm and 2.93 nm for the native ligand–PI3K complex and SE02, respectively. Analysis of Rg on the native ligand–NF-ΚB yielded good stability values for engkolSE03, with the average values of engkol being 2.09 and 2.14 nm, respectively. The native ligand that interacted with the receptor protein showed a significant similarity and a stable folding structure compared with the protein–native ligand complex.
Van der Waals and electrostatic and SASA energies in both complex systems showed negative values, whereas the polar solvation energy showed a positive value. These results, in both system complexes, indicated the polar solvation energy terms opposed the binding, whereas van der Waals and the electrostatic and SASA energies favored the binding. The total free energy of the ligand bonds showed various values. SE02 provided the lowest binding free energy compared with the native ligand. SE02 showed a total binding energy of −129.919 KJ/mol, while that of the native ligand was −69.565 KJ/mol. MM-PBSA analysis showed that SE02 had the strongest affinity to PPAR-γ. Furthermore, Se02 9 (−82.767 KJ/mol) provided the lowest binding free energy compared with the native ligand (−20.011 KJ/mol), which indicated that SE02 had the strongest affinity for PI3K receptors. Meanwhile, SE03 (−99.091 KJ/mol) provided the lowest binding free energy compared with the native ligand (−69.565 KJ/mol), which indicated that SE03 had the strongest affinity for the NF-κB receptor.
4. Materials and Methods
4.1. Materials
Samples of jengkol were obtained from several markets in West Java, using the cluster sampling method. The stationary phase used for HPLC was column C18 (250 × 4.6 mm, 5 µm) and for that of LC-MS was column C18 1.7 µm (2.1 × 100 mm). Chemical materials include 2,3-diaminonaphthalene (Sigma-Aldrich®, St. Louis, MO, USA), sodium selenite (Na2SeO3; Sigma-Aldrich®), acetonitrile (ACN; Merck® (St. Louis, MO, USA) HPLC grade)), methanol (Merck® HPLC Grade), cyclohexane (Merck® Analysis Grade), nitric acid (Merck® Analysis Grade), perchloric acid (Merck® Analysis Grade), hydrochloric acid (HCl; Merck® Analysis Grade), and Na-EDTA (Merck® Analysis Grade). The analysis of molecular docking was performed using Auto dock 1.2.6, BIOVIA Discovery Studio Visualizer® (San Diego, CA, USA), ChemDraw 8.0. The molecular dynamic simulation was performed using GROMACS 2016.3.
4.2. Standard and Sample Preparation
A standard solution stock of 200 µM Na2SeO3 was dissolved in 0.1 N HCl. A standard curve was prepared via dilution with various concentrations of 0.05–1 µM.
Jengkol samples for Se content analysis were crushed and weighed (400 mg), digested with nitric acid and perchloric acid (2:1), and then placed into a glass tube. The sample was destructed at 50–190 °C for 8 h in a tube heating block. After cooling, 0.5 mL of 10 N HCl was added, then heated again for 20 min at 150 °C.
As for characterization, the sample was crushed and weighed (20 g) to be extracted with 40 mL chloroform and then centrifuged. The supernatant was taken, evaporated at 50 °C, and dissolved with 10 mL ACN.
4.3. Analysis of the Se Content in Jengkol
Se forms a complex with 2,3-diaminonaphthalene by adding 0.1 mL of 0.1 N EDTA into sample tubes, standards, and blank. An amount of 0.1% of Thymol blue in ethanol was added with 25% ammonium hydroxide in an ice water bath. After color change occurred, 2N HCl was added to obtain a reddish color. Then, 1 mL of 0.1 N HCl and 0.1 mL of 2,3-diaminonaphthalene solution was added at 50 °C for 10 min. The extract was mixed with cyclohexane, shaken vigorously for 2 min, and centrifuged for 5 min at 2500 rpm. The cyclohexane part was pipetted and placed on 96-well plates (250 µL per well). The fluorometric intensity of cyclohexane was measured at the excitation wavelength of 378 nm and emission at 525 nm [57].
4.4. Separation of the Jengkol Extract Using HPLC Combined with the Fluorometric Method
The stationary phase used was reverse-phase HPLC, namely column C18 (250 × 4.6 mm, 5 µm). The elution system used a gradient system with the polar mobile phase. In the early stages, elution was carried out with variations in the percentage (%) of ACN and water concentration 20–80% for 40 minutes (Table 8). The sample was dissolved at a concentration of 100 ppm, filtered (0.45 µm PTFE membrane filter), and placed into a vial. Then, 20 µL of the sample solution was injected into the HPLC system and measured at a wavelength of 210 nm. The peaks on the chromatogram were observed for retention time and peak height. To identify Se, the results were collected by its separation time every 10 min and then measured using the fluorometric method.
Table 8.
Elution system for the separation of the jengkol extract using HPLC.
4.5. Characterization of Organic Se Using LC-MS
The fraction that had been separated using HPLC was then injected into the LC-MS, which operates using the reverse-phase method (column C18 1.7 µm (2.1 × 100 mm)). The elution system uses a gradient system with the mobile phase water with 0.01% formic acid aIACN 5%–95% in 25 min, 0.2 mL/min flow rate, and 5 µL volume injection.
MS was performed using ESI-Quadrupole-Tof (Q-Tof MS Xevo, Waters (Milford, MA, USA) with a microchannel plates detector. The MS system was Capillary (kV) 3.0, Sampling Cone 20.0, Extraction Cone 2.0, Source Temperature 100 °C, Desolvation Temperature 250 °C, Cone Gas Flow 50.0 (L/Hr), Desolvation Gas Flow (L/Hr) 500.0, Purge Gas Flow (L/Hr) 500.0, Collision Energy 2.0 (eV), and Detector Voltage 2000 V. The chromatogram of each fraction along with the peaks and retention time were recorded, then it was continued with MS. The mass spectra were observed and compared with the literature [27,35,38].
4.6. Docking Simulation of Organic Se in Jengkol
4.6.1. Preparation of the Ligand Structure
The two-dimensional structure of organic Se which was the predicted in jengkol obtained from PubChem. The ligands are shown in Table 9. The structure was then converted into a three-dimensional (3D) structure using ChemDraw 8.0.
Table 9.
Structure of organic Se prediction in jengkol.
4.6.2. Preparation of the Protein Receptor
High-resolution crystal structures of the PPAR-γ ligand binding domain complexed with rosiglitazone [PDB ID: 2PRG] were retrieved as receptor proteins for molecular docking-based binding studies. The 3D structure of the protein was downloaded into the PDB file format. Co-crystallized ligands, native ligands, and solvent molecules were removed from the complex. Hydrogen atoms were added to protein atoms, and their positions were optimized by energy minimization. Preparation of the receptor native ligands was carried out using AutoDock Tools 1.5.6 to obtain the position of the grid box and determine the spatial shape and coordinates of the docking material [58]. The procedure was the same for the NF-κB receptor crystals (PDB ID: 4IDV) and AKT/PI3K (PDB ID: 4FA6).
4.6.3. Validation of the Molecular Docking Method
Molecular docking validation was carried out using AutoDock Tools 1.5.6 by redocking a native ligand against a target protein that had had its natural ligand removed. Water ligands contained in the protein receptor were removed by adjusting the position of the grid box on the native ligand, which was then docked. The process was carried out to determine the RMSD value; native ligand redocking was considered successful if the RMSD value was <2 Å [51], which was obtained by looking at the overlay of the native ligand that was separated before docking, and the redocked validation of native ligand using Discovery Studio Visualizer.
4.6.4. Docking Simulation
Optimization of the 3D structure of the native ligand and ligands was carried out using Chem3D Ultra 8.0 and the MM2 semi-empirical computational method. The calculation was performed by optimizing the geometry at the minimum energy of the 3D structure.
The docking method was carried out by tethering each ligand to each receptor using the pdbqt format and the coordinates of the grid box size for PPAR-γ: x, y, and z (59.415, −5.607, and 42.406); AKT/PI3K (4FA6): x, y, and z (44.503, 14.952, and 31.315); and NF-ΚB (4IDV): x, y, and z (16.109, 13.917, and 87.361), with 50 total docking poses. Each ligand was in a stable state, and interactions with biomacromolecules were in a rigid state. The docking results obtained in the form of binding energy values and chemical interactions, such as hydrogen bonds, hydrophobic interactions, and bond distances, were visualized using Discovery Studio Visualizer.
4.7. Molecular Dynamic Simulation
The molecular dynamic simulation was carried out using organic Se with the lowest binding energy results from the molecular docking for PPAR-γ, AKT/PI3K, and NF-κB. Molecular dynamic simulation was performed using the GROMACS 2016.3 software with the AMBER99SB-ILDN force field [59]. Topology and ligand parameters were made using ACPYPE [60]. The electrostatic force over a distance was determined by the particle mesh Ewald method [61]. Neutralization of the system was carried out by adding Na+ and Cl− ions. Solvation was carried out using the TIP3P water cube model. The simulation preparation stage included the minimization step, heating to 310 K, temperature equilibration, and pressure equilibration. Furthermore, 100 ns for the production of molecular dynamics was performed with a 2-fs timestep. After the simulation, generalized RMSD (g_rmsd), RMSF (g_rmsf), and Rg (g_rg) functions were calculated. Post-molecular dynamic simulation analysis was performed by calculating the SASA to detect the direction and amplitude of the dominant motions, MM-PBSA, RMSD, and RMSF.
5. Conclusions
The determination of Se content and the prediction of organic compounds in jengkol were successfully carried out. Se01, Se02, and Se03 docked to three cardioprotective receptors. The results of docking with the lowest binding free energy were followed by molecular dynamic simulations using parameters such as RMSD, RMSF, Rg, and MM-PSBA. The stability of the native ligand bond was better compared with the test ligand based on parameters such as RMSD, RMSF, and Rg. Meanwhile, the total binding energy of the test ligand was better than that of the native ligand based on MM-PSBA. Based on the molecular interactions, the predicted organic compound in jengkol, i.e., gamma-GluMetSeCys to PPAR-γ and AKT/PI3K, and the Se-S conjugate of cysteine-selenoglutathione to NF-κB, has the best interaction results and provides a cardioprotection effect, compared to the molecular interaction of test ligands with the receptors. However, further research needs to be carried out to support this insilico study such as apurification method of organic selenium that are specific and sensitive and also activity studies to cardio-protection. In addition, administration of selenium as a dietary supplement in CVD patients has been observed [62], although recent clinical studies show differences in the effect of selenium supplementation on CVD [63,64]. The development of selenium as a functional food from natural sources continues to be studied [65,66]. The results of this study can provide an overview of jengkol as a candidate for a natural source of organic selenium for cardioprotection supplementation.
Author Contributions
Conceptualization M.M., R.L. and A.N.H.; methodology, M.M. and A.N.H.; resources, A.S.; writing—original draft preparation, A.S.; writing—review and editing, A.N.H.; visualization, A.S.; supervision, M.M., R.L. and A.N.H.; project administration, M.M.; funding acquisition, M.M. All authors have read and agreed to the published version of the manuscript.
Funding
This research was funded by the Ministry of Research, Technology and Higher Education (KEMENRISTEK DIKTI, PDUPT) of Mutakin (No: 1123ah/UN6.O/LT/2019).
Institutional Review Board Statement
Not applicable.
Informed Consent Statement
Not applicable.
Data Availability Statement
Data is contained within the article.
Acknowledgments
We acknowledge the support we received from the Directorate of Research and Community Engagement Universitas Padjadjaran for APC Funding. We would like to thank Salsa Sagitasa, Cecep Suhandi, Taufik Muhammad Fakih, Dwi Syah Fitra Ramadhan, and Syawal Abdurrahman for assisting with the in silico studies. Ida, Iyam, Yusuf, and Kansi assisted in the laboratory.
Conflicts of Interest
The authors declare no conflict of interest.
Sample Availability
Not applicable.
References
- Mensah, G.A.; Roth, G.A.; Fuster, V. The Global Burden of Cardiovascular Diseases and Risk Factors 2020 and Beyond. J. Am. Coll. Cardiol. 2019, 74, 2529–2532. [Google Scholar] [CrossRef] [PubMed]
- Leong, D.P.; Joseph, P.G.; McKee, M.; Anand, S.S.; Teo, K.K.; Schwalm, J.-D.; Yusuf, S. Reducing the Global Burden of Cardiovascular Disease, Part 2. Circ. Res. 2017, 121, 695–710. [Google Scholar] [CrossRef]
- Konstantinidis, K.; Whelan, R.S.; Kitsis, R.N. Mechanisms of Cell Death in Heart Disease. Arterioscler. Thromb. Vasc. Biol. 2012, 32, 1552–1562. [Google Scholar] [CrossRef] [PubMed]
- Portt, L.; Norman, G.; Clapp, C.; Greenwood, M.; Greenwood, M.T. Biochimica et Biophysica Acta Anti-Apoptosis and Cell Survival : A Review. BBA-Mol. Cell Res. 2011, 1813, 238–259. [Google Scholar] [CrossRef]
- Liu, H.-J.; Liao, H.-H.; Yang, Z.; Tang, Q.-Z. Peroxisome Proliferator-Activated Receptor-γ—Is Critical to Cardiac Fibrosis. PPAR Res. 2016, 2016, 2198645. [Google Scholar] [CrossRef]
- Fiordelisi, A.; Iaccarino, G.; Morisco, C.; Coscioni, E.; Sorriento, D. NfkappaB Is a Key Player in the Crosstalk between Inflammation and Cardiovascular Diseases. Int. J. Mol. Sci. 2019, 20, 1599. [Google Scholar] [CrossRef]
- Ghafouri-Fard, S.; Khanbabapour Sasi, A.; Hussen, B.M.; Shoorei, H.; Siddiq, A.; Taheri, M.; Ayatollahi, S.A. Interplay between PI3K/AKT Pathway and Heart Disorders. Mol. Biol. Rep. 2022, 49, 9767–9781. [Google Scholar] [CrossRef]
- Mohammadifard, N.; Humphries, K.H.; Gotay, C.; Mena-Sánchez, G.; Salas-Salvadó, J.; Esmaillzadeh, A.; Ignaszewski, A.; Sarrafzadegan, N. Trace Minerals Intake: Risks and Benefits for Cardiovascular Health. Crit. Rev. Food Sci. Nutr. 2019, 59, 1334–1346. [Google Scholar] [CrossRef]
- Tinggi, U. Selenium: Its Role as Antioxidant in Human Health. Environ. Health Prev. Med. 2008, 13, 102–108. [Google Scholar] [CrossRef]
- Benstoem, C.; Goetzenich, A.; Kraemer, S.; Borosch, S.; Manzanares, W.; Hardy, G.; Stoppe, C. Selenium and Its Supplementation in Cardiovascular Disease—What Do We Know? Nutrients 2015, 7, 3094–3118. [Google Scholar] [CrossRef]
- Gunes, S.; Sahinturk, V.; Karasati, P.; Sahin, I.K. Cardioprotective Effect of Selenium Against Cyclophosphamide-Induced Cardiotoxicity in Rats. Biol. Trace Elem. Res. 2017, 177, 107–114. [Google Scholar] [CrossRef] [PubMed]
- Yang, J.; Zhang, Y.; Hamid, S.; Cai, J.; Liu, Q.; Li, H.; Zhao, R.; Wang, H.; Xu, S.; Zhang, Z. Interplay between Autophagy and Apoptosis in Selenium Deficient Cardiomyocytes in Chicken. J. Inorg. Biochem. 2017, 170, 17–25. [Google Scholar] [CrossRef]
- Liu, H.; Huang, K. Selenium in the Prevention of Atherosclerosis and Its Underlying Mechanisms. Metallomics 2016, 9, 21–37. [Google Scholar] [CrossRef] [PubMed]
- Sofia, B.; Alessandro, D. Dietary Supplements and Cardiovascular Diseases. Int. J. Prev. Med. 2018, 9, 80. [Google Scholar] [CrossRef]
- Feng, C.; Li, D.; Chen, M.; Jiang, L.; Liu, X.; Li, Q.; Geng, C.; Sun, X.; Yang, G.; Zhang, L.; et al. Citreoviridin Induces Myocardial Apoptosis through PPAR-γ-MTORC2-Mediated Autophagic Pathway and the Protective Effect of Thiamine and Selenium. Chem.-Biol. Interact. 2019, 311, 108795. [Google Scholar] [CrossRef]
- Ren, H.; Mu, J.; Ma, J.; Gong, J.; Li, J.; Wang, J.; Gao, T.; Zhu, P.; Zheng, S.; Xie, J.; et al. Selenium Inhibits Homocysteine-Induced Endothelial Dysfunction and Apoptosis via Activation of AKT. Cell. Physiol. Biochem. 2016, 38, 871–882. [Google Scholar] [CrossRef]
- Liu, Q.; Cai, J.; Gao, Y.; Yang, J.; Gong, Y.; ZHang, Z. MiR-2954 Inhibits PI3K Signaling and Induces Autophagy and Apoptosis in Myocardium Selenium Deficiency. Cwllular Physiol. Biochem. 2018, 51, 778–792. [Google Scholar] [CrossRef]
- Manjunatha, S.; Shaik, A.H.; E., M.P.; Al Omar, S.Y.; Mohammad, A.; Kodidhela, L.D. Combined Cardio-Protective Ability of Syringic Acid and Resveratrol against Isoproterenol Induced Cardio-Toxicity in Rats via Attenuating NF-KB and TNF-α Pathways. Sci. Rep. 2020, 10, 3426. [Google Scholar] [CrossRef]
- Hu, W.; Zhao, C.; Hu, H.; Yin, S. Food Sources of Selenium and Its Relationship with Chronic Diseases. Nutrients 2021, 13, 1739. [Google Scholar] [CrossRef]
- Tangjaidee, P.; Swedlund, P.; Xiang, J.; Yin, H.; Quek, S.Y. Selenium-Enriched Plant Foods: Selenium Accumulation, Speciation, and Health Functionality. Front. Nutr. 2022, 9, 962312. [Google Scholar] [CrossRef]
- Alissa, E.M.; Bahijri, S.M.; Ferns, G.A. The Controversy Surrounding Selenium and Cardiovascular Disease : A Review of the Evidence. Med. Sci. Monit 2003, 9, 9–19. [Google Scholar]
- Richardson, S.M.; Siciliano, P.D.; Engle, T.E.; Larson, C.K.; Ward, T.L. Effect of Selenium Supplementation and Source on the Selenium Status of Horses 1. J. Anim. Sci. 2006, 84, 1742–1748. [Google Scholar] [CrossRef]
- Terra, S.; Gubert, P.; Puntel, B.; Rigon, C.; Matiko, M.; De Campos, A.; Salman, S.M.; Dornelles, L.; Silva, D.; Aschner, M.; et al. Protective Effects of Novel Organic Selenium Compounds against Oxidative Stress in the Nematode Caenorhabditis Elegans. Toxicol. Rep. 2015, 2, 961–967. [Google Scholar]
- Reyes, L.; Bishop, D.P.; Hawkins, C.L.; Rayner, B.S. Assessing the Efficacy of Dietary Selenomethionine Supplementation in the Setting of Cardiac Ischemia/Reperfusion Injury. Antioxidants 2019, 8, 546. [Google Scholar] [CrossRef]
- Zhang, Y.; Cartland, S.P.; Henriquez, R.; Patel, S.; Gammelgaard, B.; Flouda, K.; Hawkins, C.L.; Rayner, B.S. Selenomethionine Supplementation Reduces Lesion Burden, Improves Vessel Function and Modulates the Inflammatory Response within the Setting of Atherosclerosis. Redox Biol. 2020, 29, 101409. [Google Scholar] [CrossRef]
- Maseko, T.; Callahan, D.L.; Dunshea, F.R.; Doronila, A.; Kolev, S.D.; Ng, K. Chemical Characterisation and Speciation of Organic Selenium in Cultivated Selenium-Enriched Agaricus Bisporus. Food Chem. 2013, 141, 3681–3687. [Google Scholar] [CrossRef]
- Kurek, E.; Michalska-kacymirow, M.; Konopka, A.; Ko, O.; Tomiak, A. Searching for Low Molecular Weight Seleno-Compounds in Sprouts by Mass Spectrometry. Molecules 2020, 25, 2870. [Google Scholar] [CrossRef] [PubMed]
- Gupta, M. An Overview of Selenium Uptake, Metabolism, and Toxicity in Plants. Front. Plant Sci. 2017, 7, 2074. [Google Scholar] [CrossRef]
- White, P.J.; Bowen, H.C.; Parmaguru, P.; Fritz, M.; Spracklen, W.P.; Spiby, R.E.; Meacham, M.C.; Mead, A.; Harriman, M.; Trueman, L.J.; et al. Interactions between Selenium and Sulphur Nutrition in Arabidopsis Thaliana. J. Exp. Bot. 2004, 55, 1927–1937. [Google Scholar] [CrossRef] [PubMed]
- Ogra, Y.; Ishiwata, K.; Iwashita, Y.; Suzuki, K.T. Simultaneous Speciation of Selenium and Sulfur Species in Selenized Odorless Garlic (Allium Sativum L. Shiro) and Shallot (Allium Ascalonicum) by HPLC—Inductively Coupled Plasma-(Octopole Reaction System)-Mass Spectrometry and Electrospray Ioni. J. Chromatogr. 2005, 1093, 118–125. [Google Scholar] [CrossRef] [PubMed]
- Muslim, N.; Majid, A.M.S.A. Pithecellobium Jiringa: A Traditional Medicinal Herb. Webmed Cent. Complement. Med. 2010, 1, 1371. [Google Scholar]
- Omar, S.H. Organosulfur Compounds and Possible Mechanism of Garlic in Cancer. Saudi Pharm. J. 2010, 18, 51–58. [Google Scholar] [CrossRef] [PubMed]
- Asikin, Y.; Shikanai, T.; Wada, K. Volatile Aroma Components and MS-Based Electronic Nose Profiles of Dogfruit (Pithecellobium Jiringa) and Stink Bean (Parkia Speciosa). J. Adv. Res. 2017, 9, 79–85. [Google Scholar] [CrossRef] [PubMed]
- Heyne, K. Tumbuhan Berguna Indonesia. Badan Penelit. Dan Pengemb. Kehutan. Dep. Kehutan. 1987, 2, 1188–1189. [Google Scholar]
- Dernovics, M.; Lobinski, R. Identification of Anionic Selenium Species in Se-Rich Yeast by Electrospray QTOF MS/MS and Hybrid Linear Ion Trap/Orbitrap MS n W. Metallomics 2009, 1, 317–329. [Google Scholar] [CrossRef] [PubMed]
- Vonderheide, A.P.; Mounicou, S.; Meija, J.; Henry, H.F.; Caruso, J.A.; Shann, J.R. Investigation of Selenium-Containing Root Exudates of Brassica Juncea Using HPLC-ICP-MS and ESI-QTOF-MS. Analyst 2006, 131, 33–40. [Google Scholar] [CrossRef] [PubMed]
- Dumont, E.; Ogra, Y.; Vanhaecke, F.; Suzuki, K.T.; Cornelis, R. Liquid Chromatography-Mass Spectrometry (LC-MS): A Powerful Combination for Selenium Speciation in Garlic (Allium Sativum). Anal. Bioanal. Chem. 2006, 384, 1196–1206. [Google Scholar] [CrossRef]
- Kieliszek, M.; Blazejak, S. Speciation Analysis of Selenium in Candida Utilis Yeast Cells Using HPLC-ICP-MS and UHPLC-ESI-Orbitrap MS Techniques. Appl. Sci. 2018, 8, 2050. [Google Scholar] [CrossRef]
- Durham, E.; Dorr, B.; Woetzel, N.; Staritzbichler, R.; Meiler, J. Solvent Accessible Surface Area Approximations for Rapid and Accurate Protein Structure Prediction. J. Mol. Model. 2009, 15, 1093–1108. [Google Scholar] [CrossRef]
- Gloss, L.M. Chapter 14—Equilibrium and Kinetic Approaches for Studying Oligomeric Protein Folding. In Biothermodynamics, Part B; Academic Press: Cambridge, MA, USA, 2009; Volume 466, pp. 325–357. ISBN 0076-6879. [Google Scholar]
- Foster, L.H.; Sumar, S. Methods of Analysis Used for the Determination of Selenium in Milk and Infant Formulae: A Review. Food Chem. 1995, 53, 453–466. [Google Scholar] [CrossRef]
- Niedzielski, P.; Siepak, M. Analytical Methods for Determining Arsenic, Antimony and Selenium in Environmental Samples. Pol. J. Environ. Stud. 2003, 12, 653–667. [Google Scholar]
- Kulikov, A.U. Determination of Selenium(IV) in Pharmaceuticals and Premixes by Micellar Liquid Chromatography. J. Pharm. Biomed. Anal. 2007, 43, 1283–1289. [Google Scholar] [CrossRef] [PubMed]
- Pratiwi, R.; Shalihat, A.; Dewantisari, D.; Nafisah, R.A.; Yunita; Saputri, F.A.; Gozali, D.; Pamungkas, K.; Lesmana, R.; Koyama, H.; et al. Correlation Study between Gastronomy Culture and Content of Selenium towards Prevalence of Cardiovascular and Diabetes in West Java, Indonesia. J. Trace Elem. Med. Biol. 2021, 64, 126679. [Google Scholar] [CrossRef] [PubMed]
- Izgi, B. Determination of Selenium in Garlic (Allium Sativum) and Onion (Allium Cepa) by Electro Thermal Atomic Absorption Spectrometry. Food Chem. 2006, 99, 630–637. [Google Scholar] [CrossRef]
- Zagrodzki, P.; Wiesner, A.; Marcinkowska, M.; Jamrozik, M.; Domínguez-Álvarez, E.; Bierła, K.; Łobiński, R.; Szpunar, J.; Handzlik, J.; Galanty, A.; et al. Relationships between Molecular Characteristics of Novel Organic Selenium Compounds and the Formation of Sulfur Compounds in Selenium Biofortified Kale Sprouts. Molecules 2023, 28, 2062. [Google Scholar] [CrossRef]
- Pettem, C.M.; Weber, L.P.; Janz, D.M. Cardiac and Metabolic Effects of Dietary Selenomethionine Exposure in Adult Zebrafish. Toxicol. Sci. 2017, 159, 449–460. [Google Scholar] [CrossRef]
- Chen, H.-X.; Li, M.-Y.; Jiang, Y.-Y.; Hou, H.-T.; Wang, J.; Liu, X.-C.; Yang, Q.; He, G.-W. Role of the PPAR Pathway in Atrial Fibrillation Associated with Heart Valve Disease: Transcriptomics and Proteomics in Human Atrial Tissue. Signal Transduct. Target. Ther. 2020, 5, 4. [Google Scholar] [CrossRef]
- Zhou, D.; Qu, Z.; Wang, H.; Su, Y.; Wang, Y.; Zhang, W.; Wang, Z.; Xu, Q. The Effect of Hydroxy Safflower Yellow A on Coronary Heart Disease through Bcl-2/Bax and PPAR-γ. Exp. Ther. Med. 2018, 15, 520–526. [Google Scholar] [CrossRef]
- Nolte, R.T.; Wisely, G.B.; Westin, S.; Cobb, J.E.; Lambert, M.H.; Kurokawa, R.; Rosenfeld, M.G.; Willson, T.M.; Glass, C.K.; Milburn, M.V. Ligand Binding and Co-Activator Assembly of the Peroxisome Proliferator-Activated Receptor-Gamma. Nature 1998, 395, 137–143. [Google Scholar] [CrossRef]
- Ramírez, D.; Caballero, J. Is It Reliable to Take the Molecular Docking Top Scoring Position as the Best Solution without Considering Available Structural Data? Molecules 2018, 23, 1038. [Google Scholar] [CrossRef]
- Sauer, S. Ligands for the Nuclear Peroxisome Proliferator-Activated Receptor Gamma. Trends Pharmacol. Sci. 2015, 36, 688–704. [Google Scholar] [CrossRef] [PubMed]
- Garg, S.; Irfan, S.; Kumar, R.; Kumar, M.; Kumar, M.; Kaur, P.; Chandra, T.; Bhatia, J.; Singh, D. The Molecular Mechanism Involved in Cardioprotection by the Dietary Flavonoid Fisetin as an Agonist of PPAR-γ in a Murine Model of Myocardial Infarction. Arch. Biochem. Biophys. 2020, 694, 108572. [Google Scholar] [CrossRef] [PubMed]
- Domracheva, I.; Kanepe-Lapsa, I.; Jackevica, L.; Vasiljeva, J.; Arsenyan, P. Selenopheno Quinolinones and Coumarins Promote Cancer Cell Apoptosis by ROS Depletion and Caspase-7 Activation. Life Sci. 2017, 186, 92–101. [Google Scholar] [CrossRef] [PubMed]
- Martínez, L. Automatic Identification of Mobile and Rigid Substructures in Molecular Dynamics Simulations and Fractional Structural Fluctuation Analysis. PLoS ONE 2015, 10, e0119264. [Google Scholar] [CrossRef] [PubMed]
- Damjanović, A.; Brooks, B.R.; García-Moreno, E.B. Conformational Relaxation and Water Penetration Coupled to Ionization of Internal Groups in Proteins. J. Phys. Chem. A 2011, 115, 4042–4053. [Google Scholar] [CrossRef]
- Haygarth, P.M.; Rowland, A.P.; Stürup, S.; Jones, K.C. Comparison of Instrumental Methods for the Determination of Total Selenium in Environmental Samples. Analyst 1993, 118, 1303–1308. [Google Scholar] [CrossRef]
- Jain, A.N.; Nicholls, A. Recommendations for Evaluation of Computational Methods. J. Comput.-Aided Mol. Des. 2008, 22, 133–139. [Google Scholar] [CrossRef]
- Abraham, M.J.; Murtola, T.; Schulz, R.; Páll, S.; Smith, J.C.; Hess, B.; Lindah, E. Gromacs: High Performance Molecular Simulations through Multi-Level Parallelism from Laptops to Supercomputers. SoftwareX 2015, 1–2, 19–25. [Google Scholar] [CrossRef]
- Mark, P.; Nilsson, L. Structure and Dynamics of the TIP3P, SPC, and SPC/E Water Models at 298 K. J. Phys. Chem. A 2001, 105, 9954–9960. [Google Scholar] [CrossRef]
- Essmann, U.; Perera, L.; Berkowitz, M.L.; Darden, T.; Lee, H.; Pedersen, L.G. A Smooth Particle Mesh Ewald Method. J. Chem. Phys. 1995, 103, 8577–8593. [Google Scholar] [CrossRef]
- Al-Mubarak, A.A.; van der Meer, P.; Bomer, N. Selenium, Selenoproteins, and Heart Failure: Current Knowledge and Future Perspective. Curr. Heart Fail. Rep. 2021, 18, 122–131. [Google Scholar] [CrossRef] [PubMed]
- An, P.; Wan, S.; Luo, Y.; Luo, J.; Zhang, X.; Zhou, S.; Xu, T.; He, J.; Mechanick, J.I.; Wu, W.-C.; et al. Micronutrient Supplementation to Reduce Cardiovascular Risk. J. Am. Coll. Cardiol. 2022, 80, 2269–2285. [Google Scholar] [CrossRef] [PubMed]
- Jenkins, D.J.A.; Kitts, D.; Giovannucci, E.L.; Sahye-Pudaruth, S.; Paquette, M.; Blanco Mejia, S.; Patel, D.; Kavanagh, M.; Tsirakis, T.; Kendall, C.W.C.; et al. Selenium, Antioxidants, Cardiovascular Disease, and All-Cause Mortality: A Systematic Review and Meta-Analysis of Randomized Controlled Trials. Am. J. Clin. Nutr. 2020, 112, 1642–1652. [Google Scholar] [CrossRef] [PubMed]
- Adadi, P.; Barakova, N.V.; Muravyov, K.Y.; Krivoshapkina, E.F. Designing Selenium Functional Foods and Beverages: A Review. Food Res. Int. 2019, 120, 708–725. [Google Scholar] [CrossRef]
- Dobrzyńska, M.; Drzymała-Czyż, S.; Woźniak, D.; Drzymała, S.; Przysławski, J. Natural Sources of Selenium as Functional Food Products for Chemoprevention. Foods 2023, 12, 1247. [Google Scholar] [CrossRef] [PubMed]


Disclaimer/Publisher’s Note: The statements, opinions and data contained in all publications are solely those of the individual author(s) and contributor(s) and not of MDPI and/or the editor(s). MDPI and/or the editor(s) disclaim responsibility for any injury to people or property resulting from any ideas, methods, instructions or products referred to in the content. |
© 2023 by the authors. Licensee MDPI, Basel, Switzerland. This article is an open access article distributed under the terms and conditions of the Creative Commons Attribution (CC BY) license (https://creativecommons.org/licenses/by/4.0/).