Article

Transition Metal Sensing with Nitrogenated Holey Graphene: A First-Principles Investigation

by
Uroosa Sohail
1,
Faizan Ullah
1,
Nur Hazimah Binti Zainal Arfan
2,
Malai Haniti Sheikh Abdul Hamid
2,
Tariq Mahmood
1,3,
Nadeem S. Sheikh
2,* and
Khurshid Ayub
1,*
1
Department of Chemistry, COMSATS University Islamabad, Abbottabad Campus, Abbottabad 22060, Pakistan
2
Chemical Sciences, Faculty of Science, Universiti Brunei Darussalam, Jalan Tungku Link, Gadong BE1410, Brunei
3
Department of Chemistry, College of Science, University of Bahrain, Isa Town 32038, Bahrain
*
Authors to whom correspondence should be addressed.
Molecules 2023, 28(10), 4060; https://doi.org/10.3390/molecules28104060
Submission received: 11 March 2023 / Revised: 25 April 2023 / Accepted: 4 May 2023 / Published: 12 May 2023
(This article belongs to the Special Issue Computational Studies of Novel Function Materials)

Abstract

:
The toxicity of transition metals, including copper(II), manganese(II), iron(II), zinc(II), hexavalent chromium, and cobalt(II), at elevated concentrations presents a significant threat to living organisms. Thus, the development of efficient sensors capable of detecting these metals is of utmost importance. This study explores the utilization of two-dimensional nitrogenated holey graphene (C2N) nanosheet as a sensor for toxic transition metals. The C2N nanosheet’s periodic shape and standard pore size render it well suited for adsorbing transition metals. The interaction energies between transition metals and C2N nanosheets were calculated in both gas and solvent phases and were found to primarily result from physisorption, except for manganese and iron which exhibited chemisorption. To assess the interactions, we employed NCI, SAPT0, and QTAIM analyses, as well as FMO and NBO analysis, to examine the electronic properties of the TM@C2N system. Our results indicated that the adsorption of copper and chromium significantly reduced the HOMO–LUMO energy gap of C2N and significantly increased its electrical conductivity, confirming the high sensitivity of C2N towards copper and chromium. The sensitivity test further confirmed the superior sensitivity and selectivity of C2N towards copper. These findings offer valuable insight into the design and development of sensors for the detection of toxic transition metals.

Graphical Abstract

1. Introduction

First row transition metals (Sc, Ti, Vn, Cr, Mn, Fe, Co, Ni, Cu and Zn) play undeniable role in various disciplines which include medicine, construction, catalysis, nuclear processes, engineering, and numerous medical applications [1,2,3]. One of the major application accounts for their catalytic properties in isomerization, hydrogenation, oxidation, polymerization and building small molecules, etc. [4,5] In a biological system, transition metals are associated with most of proteins to perform number of enzymatic processes and transportation to their target [6]. However, high concentration causes toxicity and is hazardous to life [7]. All elements of the series have some level of toxicity, but some are highly toxic while others are moderate [8,9]. The first row transition metals have oxidation state dependent toxicity [10]. Manganese has an interesting chemistry of multiple oxidation states. Being essential nutrition, manganese helps in the production of glucose and the feeding of mitochondria during its maintenance [11]. However, Mn in +2 oxidation state predominates in cellular toxicity [12]. Immoderate exposure of Mn2+ causes “Manganism”, which is neurodegenerative disorder which leads to neuronal death [13]. Some general effects of manganese toxicity are memory loss, insomnia, headache, and speech disturbances [14]. Similarly, iron is a good biocatalyst but it also has harmful effects [15]. A high concentration of tissue iron causes numerous pathological states such as heart disease, diabetes, abnormality in immune system and liver disorders [16]. Similarly, Fe2+ (ferrous ion) is highly poisonous and has corrosive effects on the gastrointestinal mucosa (GI). Nausea, diarrhea, vomiting, and abdominal pain are the outcomes of iron poisoning [17]. Moreover, macromolecules are also destroyed by the free radicals generated by Fe2+ in the presence of oxygen, resulting in cell death [18]. Co+2 is likely to be more dangerous than Co+3. The ultimate effects of cobalt toxicity in a +2 oxidation state are fever, gastrointestinal distress, heart failure, inflammation, and low thyroid level [19]. According to The International Agency for Research on Cancer (IARC), the risk of cancer from cobalt toxicity is about 30% [20]. Copper acts as a component of allosteric the enzyme and is used in the production of a variety of neurotransmitters [21]. Copper in a +2 oxidation state is associated with liver damage, Wilson disease and insomnia [22]. Excessive intake of copper has adverse toxicological complications. Lost cognition is also observed due to a high copper intake in the general population [23]. The notable functions of zinc in humans include proliferation, protein synthesis, neuronal growth, DNA metabolism, free radical sequestration, cellular division and lipid peroxidation [24]. Zn+2 is considered toxic when a surplus amount of it is ingested into the body [25]. An elevated risk of prostatic cancer is caused by high doses of zinc [26]. On the contrary, if the toxicity of chromium is extremely interrelated with its oxidation state, it will be highly toxic if the state of oxidation is higher, and vice versa. Cr+6 is the sturdiest oxidizing agent and is considered to be 1000 times more dangerous than chromium in a +3 oxidation state [27]. Chromium is cancer-causing metal; its toxicity is not only accessible to humans—plants and animals are also heavily affected by its consumption [28]. Different surfaces are used for the detection, adsorption, and removal of transition metals in different oxidation states; however, the selectivity of a particular metal in the presence of other transition metals is a challenge. Various sensing materials are used for their detection, including kaolinite, magnetite, polyphenol acetaldehyde resins, activated carbon, graphene oxide, picolinamide (Pi-A)-decorated reduced-graphene oxide (RGO), etc. [29,30,31,32,33,34] Here, we are using a C2N nanosheet which is already employed as an electrochemical sensor for the detection of toxic and hazardous organic compounds such as HCN, H2S, PH3, HF, NCl3, COCl2, NCl3, NBr3, NH3, NI3 and NF3 [35]. Additionally C2N has shown its high efficacy in the field of optics, batteries, gas sensors and photo catalysis [36]. To the best of our knowledge, the nitrogenated holey graphene nanosheet has not been previously adopted as an electrochemical sensor for transition metals. The C2N nanosheet has periodic geometry with standard pore size. C2N comprises a highly electron-rich cavity consisting of benzene and pyrazine rings alternatively attached. The pyrazine ring of C2N provides us with highly electronegative nitrogen, which coheres to and catches transition metals.
Our theoretical study provides valuable insight into the unique properties of the C2N nanosheet and its potential applications as a sensor. However, we also acknowledge that experimental studies are required to validate our theoretical findings and to address the practical challenges associated with the use of C2N nanosheets, for example, improving the structural stability of C2N nanosheets is crucial for their long-term use, as they can be unstable under certain conditions, such as high temperature or when exposed to moisture. Developing methods for the precise control of the size and thickness of C2N nanosheets is important for optimizing their properties and performance. Controlling and minimizing defects and impurities in the structure of C2N nanosheets is crucial for improving their chemical and electronic properties, as well as their overall performance. While carbon and nitrogen are generally considered non-toxic, the potential toxicity of C2N nanosheets is not well understood. Further research is needed to determine any adverse effects of C2N on human health and the environment. It is important to handle and use C2N nanosheets with caution and follow the appropriate safety guidelines to minimize the potential risks.

2. Results and Discussion

2.1. Geometric Optimization

The structure of the cluster model of the nitrogenated holey graphene (C2N) nanosheet is shown in Figure 1. A single unit of a C2N nanosheet comprises nitrogen atoms which are arranged in a periodical manner to set up a ring diameter of 8.30 Å. The pyrazine ring of C2N provided us with highly electronegative nitrogen which acts as an extremely powerful part, cohering and adsorbing toxic transition metals. The single monolayer of C2N reflects four possible sites for the adsorption of analytes: (a) in the middle of C2N surface (A), (b) in the middle of nitrogen atoms (B), (c) above the pyrazine ring (C), and (d) above the benzene ring (D). To find the most stable geometry with the lowest energy for each TM@C2N complex, all possible orientations of each metal ion over carbon nitride surface were explored. All the complexes (Cu2+@C2N, Mn2+@C2N, Co2+@C2N, Fe2+@C2N, Cr6+@C2N, Zn2+@C2N) exhibited the best performance in the central position, i.e., position (A), as it was the most stable and had the lowest energy (Figure 2).

2.2. Most Stable Spin State of TM@C2N Complexes

In this study, the analytes selected for sensing studies were six metals of a first-row transition series (Cu2+, Mn2+, Fe2+, Zn2+, Cr6+ and Co2+). First, it was essential to determine the most stable spin state of the TM@C2N complexes. The optimization of Cu@C2N, Mn@C2N and Co@C2N was carried out in doublet, quartet, sextet, and octet spin states. The relative energies of different spin states for all the complexes are given in Table 1. The most stable spin states obtained for Cu@C2N, Mn@C2N and Co@C2N were doublet, sextet, and quartet spin states, respectively. Similarly, the rest of metal complexes, such as Fe@C2N, Cr@C2N and Zn@C2N, showed quintet, triplet and singlet spin states to the most stable states, respectively.

2.3. Interaction Energies

The interaction energies and interaction distances of all the complexes are given in Table 2. In all the complexes, the transition metal interacts with N-atoms of the C2N cavity (Figure 3). The value of interaction energy of the Cu2+@C2N complex is the lowest among all the studied complexes, i.e., −6.6 kcal mol−1 along with 2.2 Å of interaction distance between closest interacting (Cu-62….N-47) atoms. The Eint and Dint (Cr-61…N-34) in the Cr6+@C2N complex are −9.2 kcal mol−1 and 2.09 Å, respectively. In the case of Zn2+@C2N, Fe2+@C2N and Co2+@C2N complexes, the Eint is −15.9, −25.9 and −20.7 kcal mol−1, respectively. The interaction energy of Mn2+@C2N (−43.1 kcal mol−1) is greater than the rest of the five complexes showing chemisorption; it interacts at site A of the C2N cavity with an interaction distance of 2.34 Å.
The interaction energy results of the TM@C2N complexes support the existence of a physisorption mechanism, except for Mn@C2N and Fe2+@C2N which show chemisorption. The interaction energy trends observed for TM@C2N complexes are Cu@C2N > Cr@C2N > Zn@C2N > Co@C2N > Fe@C2N > Mn@C2N, respectively. The results of the interaction energy indicate that C2N can accommodate transition metals on its surface, but the highest interaction energy was seen for the Mn@C2N complex (−43.1 kcal mol−1).

2.4. Natural Bond Orbital Analysis (NBO)

The analysis of natural bond orbital reveals the ability of the sensor to detect the toxic transition metals. The transfer of charge, as well as the direction of charge transfer, was determined using NBO analysis. The calculated charge transfer is listed in Table 3. The transfer of charge may occur from C2N to metal or metal to C2N. In this study, the charge values on adsorbed metals are 0.871 |𝑒| (Cu), 1.640 |𝑒| (Fe), 1.672 |𝑒| (Mn), 1.652 |𝑒| (Zn), 0.861 |𝑒| (Co) and 1.79 |𝑒| (Cr). The QNBO values of TM@C2N complexes show that charges shifted from analytes (transition metals) to the C2N nanosheet, as evidenced by the highly electron-rich cavity of C2N (due to the presence of electronegative nitrogen) and the positive charge of the metals. The following order of charge transfer was observed in the complexes: Cr6+@C2N ˃ Mn2+@C2N ˃ Zn2+@C2N ˃ Fe2+@C2N > Cu2+@C2N > Co2+@C2N.

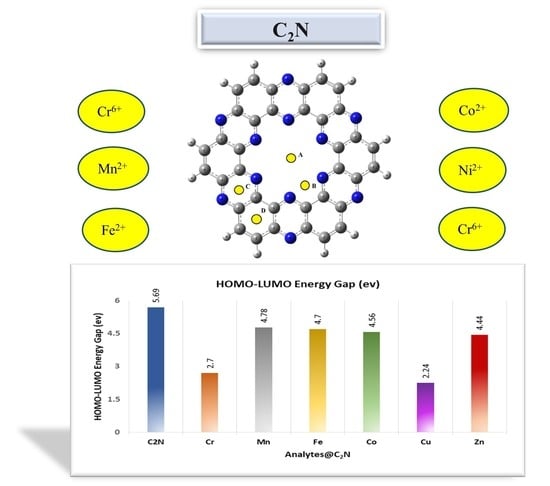
2.5. Frontier Molecular Orbital Analysis (FMO)

The reactivity of interacting substances is significantly defined by frontier molecular orbital analysis (FMO). The energy gap obtained by taking the difference between the highest occupied molecular orbital (HOMO) and the lowest unoccupied molecular orbitals (LUMO) greatly influences the conductivity as well as the stability of complexes. The EHOMO and ELUMO of C2N are −7.87 eV and −2.17 eV, respectively. The H–L energy gap in C2N is 5.71 eV. In TM@C2N complexes, the H–L energy gap reduced to 2.24 eV (Cu), 4.71 eV (Fe), 4.80 eV (Mn), 4.44 eV (Zn), 2.70 (Cr) and 4.56 eV (Co) as graphically represented in Figure 4. In the Cu@C2N complex, HOMO and LUMO energies were −13.3 eV and −11.06 eV, respectively. A moderate reduction in H–L energy gap was observed for the complexes of Fe, Mn, and Co, i.e., 4.71, 4.80 and 4.56 eV, respectively. However, a remarkable decrease was observed in the EH–L energy gap of Cu2+@C2N (2.24 eV), which indicates the increased conductivity and sensitivity of C2N towards copper. Similarly, the LUMO (−21.35 eV) and HOMO (−24.05) of Cr6+@C2N were more highly stabilized compared to the bare C2N unit (−2.17 eV, −7.870 eV), which caused a notable decrease in the H–L energy gap (2.70 eV). The notable decrease in the EH–L gap evidences the greater sensitivity of C2N towards copper and chromium. The appreciable downfall in the HOMO–LUMO energy gap of any substances represents its appreciable sensitivity and selectivity towards toxic transition metals. Moreover, the orbital densities are also analyzed to visualize the interaction behavior of transition metals and the C2N surface (Figure 5). All the complexes show totally different orbital densities for LUMO. Except for manganese, the densities of LUMO for the rest of complexes were distributed at different half portions of the C2N cavity. In case of Mn@C2N, the LUMO was entirely located on manganese metal at the center of cavity, whereas the density of HOMO was present as seen in the C2N unit. The highest decline in the H–L energy gap was observed in the Cu@C2N having the maximum conductivity. Therefore, Cu tends to enhance the conductivity of the carbon nitride surface as compared to the other selected metals.

2.6. Non-Covalent Interactions (NCI)

NCI analysis reveals the nature of interactions between the analyte and the surface through RDG graphs and 3D isosurfaces. The RDG graph is based on the following equation:
RDG s = 1 2 3 π 2 1 3   ρ ρ 4 3
where ρ and ρ are electronic density gradient and electronic density, respectively. The color scheme of NCI graphs comprises different types of interactions; the steric repulsion is reported in the red color, while weak and strong interactions are represented by the green and blue colors, respectively. In the 3D isosurfaces of all the TM@C2N complexes, the patches of interactions are mainly shown in the middle part, i.e., the center of the ring; the dotted patches reflect weak interactions, whereas the thicker patches show the strong interactions. In all TM@C2N complexes, the appearance of green surfaces of different intensities between the metals and C2N surface indicates the existence of strong and weak van der Waals interactions. In all the complexes, steric clashes are observed from the presence of thicker patches of red color; these repulsive forces are observed due to the presence of the delocalized electrons present in the metals as well as the nitrogen atom of the pyrazine rings. In RDG plots as shown in the Figure 6, the TM@C2N presents a variety of greenish peaks between −0.02 and 0.01 a.u. A dispersive light-bluish and the greenish spike (nearly −0.02 a.u.) implies the presence of strong non-bonding interactions.

2.7. QTAIM Analysis

In QTAIM analysis, the bond nature between analyte and complex depends on bond-critical point (BCP). BCP’s are further classified into five components, i.e., electronic density (ρ), potential energy density V(r), energy density H(r), Laplacian of electron density (∇2 ρ) and kinetic energy density G(r). The bond-critical point (BCP) can be more distantly elucidated by the following equation:
H r = G r + V r
which shows that the sum of the potential energy and kinetic energy density is equal to the electron density. The value of H(r) > 0 and H(r) < 0 indicates the presence of closed-shell and shared-shell interactions, respectively. The bond-critical point (BCP) results of electronic density (ρ) and Laplacian (∇2 ρ) are given in Table 4 and the BCPs are depicted in Figure 7. The geometry of Cu@C2N complexes consists of four BCPs. The bond-critical point values of ρ ranges from 0.02 to 0.05 a.u. and ∇2ρ from 0.07 to 0.19 a.u. Among four BCPs values, two interactions (N23 --- Cu30 and N36 --- Cu30 of C2N and Cu) contain the highest value of electronic density (ρ), 0.05 a.u. In Cu@C2N, the values of electronic density (ρ) are less than 0.1, which indicate the presence of weak van der Waals interactions, as confirmed by a 3D isosurface of an NCI plot. The highest number of BCPs obtained among the studied systems was six in the cases of Fe2+@C2N and Mn2+@C2N. The values of 0.02 a.u to 0.35 a.u for ρ, and −0.10 a.u to −0.97 a.u for ∇2ρ, were obtained for Fe2+@C2N. In case of Fe2+@C2N, one of the values of electronic density (ρ) was less than zero, which indicates the existence of electrostatic interactions, as confirmed by SAPT0 analysis. Similarly, the electronic density (ρ) of Zn2+@C2N (0.2 to 0.4 a.u) is greater than 0.1, which confirms the electrostatic interactions between zinc and the C2N nanosheet. For Cr6+@C2N and Co2+@C2N, the values of electronic density confirm the presence of van der Waals interactions, i.e., ρ < 0.1 as confirmed by the greenish patches in the RDG graph. The outcomes of QTAIM analysis were in great accordance with the NCI and SAPT0 analyses.

2.8. SAPT0 Analysis

Symmetry-adapted perturbation theory (SAPT) provides a quantitative analysis of the noncovalent interaction between two entities through the perturbative approach by directly computing the interaction energy as a perturbation to the Hamiltonian of the individual monomers instead of the supermolecular approach. The division of interaction energy into different components such as dispersion, exchange, electrostatic and induction has been performed using SAPT (Eint SAPT = Eele + Eind + Edisp + Eexch). The interpretation of SAPT0 analysis is helpful for providing an explanation of the nature of interactions between the analytes (metals) and the C2N unit, and for quantifying the chemical bonds. The interactions of SAPT0 for six complexes are shown in Table 5. The components of SAPT0, which are negative, reveal the presence of attractive interactions between the C2N units and the transition metals. The exchange part contains the positive energies, which indicates the presence of repulsive interactions between the C2N unit and the analytes. As shown in Table 5, the negative energies of SAPT0 among all the complexes (TM@C2N) denote the presence of attractive interactions. The interaction energies obtained in SAPT0 studies of metal complexes were −255.09 kcal/mol (Cu2+@C2N), −131.88 kcal/mol (Fe2+@C2N), −283.35 kcal/mol (Mn2+@C2N), −306.20 kcal/mol (Zn2+@C2N), −174 kcal/mol (Co2+@C2N) and −5145.7 kcal/mol (Cr6+@C2N). The highest contribution towards the total SAPT0 was observed for Eelec. Hence, electrostatic interactions dominate and stabilize the complexes. The findings of the SAPT0 analysis are consistent with the NCI and QTAIM analyses. The trend in supermoleculor interaction energy (without solvent) is exactly followed by the ESAPT0. The trend for ESAPT0 is Cr@C2N > Zn@C2N > Mn@C2N > Cu@C2N > Co@C2N < Fe@C2N.

2.9. Electrical Conductivity and Sensitivity Analysis

Electrical conductivity (σ) is calculated for pristine C2N and TM@C2N complexes at 300 K and the σ values are given in Table 6. The conductivity of TM@C2N complexes show a marked increase as compared to pristine C2N. In particular, Cu2+@C2N and Cr6+@C2N conductivities increase largely when compared to other TM@C2N complexes. This large increase in conductivity can be converted to an electrical signal. Therefore, it can be concluded that the nitrogenated holey graphene C2N may be a promising electronic sensor for the detection of Cu and Cr. To further confirm the higher sensitivity of C2N towards toxic transition metals, the sensing characteristics of C2N were quantitatively analyzed using a sensitivity (S) test. Sensitivity is the response of a sensor towards analyte exposure. A high value of S means the material is an excellent sensor for the particular analyte. The sensitivity of the C2N nanosheet is found to be 142.63, 10.79, 0.09, 0.69, 107.30, and 51.90 towards Cu, Fe, Mn, Zn, Cr, and Co, respectively. Cu adsorbed on the C2N complex shows the highest S value, which indicates that among the mixture of analytes, C2N is the most sensitive and selective towards Cu.

3. Computational Methodology

The level of theory employed for geometry optimization is M05-2X/6-31+G (d, p) [37,38]. In our investigation of C2N–transition metal complexes, non-covalent interactions are involved, and therefore, we have employed the hybrid meta-exchange-correlation functional M05-2X. The choice of M05-2X functional is based on its accuracy in describing non-covalent interactions, as demonstrated by benchmark studies such as the one by Burns et al. [39] and other studies reported in the literature on the non-covalent interactions [40,41,42,43]. Additionally, the choice of an appropriate basis set is a crucial factor in computational simulations. To this end, we have utilized the double zeta basis set 6-31+G(d,p), which includes diffuse and polarized functions and strikes a balance between accuracy and computational efficiency [44]. The interaction energies between C2N and transition metals were calculated by using the following equation:
E i n t = E T M @ C 2 N E C 2 N + E T M
where E T M @ C 2 N , E C 2 N and E T M are the interaction energies of C2N–transition metal complexes, pristine C2N surface, and isolated transition metal, respectively. To find the lowest energy structure, each metal is placed in different possible orientations and the results are visualized using Gaussview 5.0 [45]. To validate the true minima’s nature of the TM@C2N complexes, vibrational frequencies were examined for the presence of imaginary frequencies. An NCI analysis was carried out using VMD and Multiwfn software for an improved evaluation of the interactive sites between C2N and the selected transition metals [46,47]. The electronic properties, such as the natural bond orbital (NBO) and frontier molecular orbital (FMO) analyses, were performed at the same level of theory used for optimization. The non-covalent interactions between C2N and transition metals were quantified by bond-critical point using QTAIM analysis [48]. The interaction energies between transition metals and the C2N nanosheet were also analyzed using SAPT0 (symmetry-adaptation perturbation theory). SAPT0 analysis illustrates four types of interactions: electrostatic (ΔEelst), exchange (ΔEexh), induction (ΔEind) and dispersion (ΔEdis) [49]. The equation for ΔEint through SAPT0 is as follows:
ΔEint = ΔEelst + ΔEexh + ΔEind + ΔEdis
All the SAPT calculations were performed using PSI4 1.6 software [50].

4. Conclusions

This study aimed to systematically investigate the ability of a two-dimensional nitrogenated holey graphene (C2N) nanosheet to detect toxic transition metals (Cu2+, Mn2+, Fe2+, Zn2+, Cr6+, and Co2+) using DFT calculations. The interaction energies between C2N and each of the transition metals were calculated, with values of −6.6, −43.1, −20.7, −25.9, −9.2, and −15.9 kcal mol−1 for Cu2+@C2N, Mn2+@C2N, Co2+@C2N, Fe2+@C2N, Cr6+@C2N, and Zn2+@C2N, respectively. These results suggest that the adsorption of the transition metals on C2N is mainly due to physisorption, except for Mn and Fe, which are chemisorbed. The dominant interaction between C2N and the metals was found to be the electrostatic force of attraction, which stabilizes the TM@C2N complexes. The computed EH–L gap of the C2N nanosheet was found to decrease significantly upon the adsorption of Cu2+ and Cr6+. The NCI plots and QTAIM analysis showed the presence of strong and weak van der Waals interactions between C2N and the metals. The increase in the electrical conductivity of Cu2+@C2N and Cr6+@C2N, as compared to the pristine C2N, indicates the superior sensitivity of C2N towards these metals. The sensitivity (S) test also confirms the higher sensitivity and selectivity of C2N towards Cu2+. In conclusion, the results of this study suggest that the two-dimensional nitrogenated holey graphene (C2N) nanosheet could be an effective sensor for detecting copper (II) and hexavalent chromium. The findings may also provide valuable insights into the design and development of sensors for detecting other toxic metals.

Author Contributions

Conceptualization, U.S. and F.U.; Data curation, U.S. and N.H.B.Z.A.; Formal analysis, N.H.B.Z.A. and M.H.S.A.H.; Funding acquisition, N.S.S.; Methodology, U.S. and F.U.; Project administration, N.S.S.; Resources, T.M.; Software, F.U.; Supervision, K.A.; Validation, T.M.; Visualization, M.H.S.A.H.; Writing—original draft, U.S. and F.U.; Writing—review and editing, K.A. All authors have read and agreed to the published version of the manuscript.

Funding

FIC research grant and allied research grant, Universiti Brunei Darussalam (UBD/RSCH/1.4/FICBF(b)/2022/049).

Institutional Review Board Statement

Not applicable.

Informed Consent Statement

Not applicable.

Data Availability Statement

All data are provided in the manuscript.

Acknowledgments

The authors thank the Universiti Brunei Darussalam for the FIC research grant (UBD/RSCH/1.4/FICBF(b)/2022/049) and the allied research grant.

Conflicts of Interest

The authors declare no conflict of interest.

References

  1. Pareek, B.; Singh, V.; Sharma, V.; Singh, P.S. Properties of Transition Metals and Their Compounds. Contemp. Adv. Sci. Technol. 2021, 1, 146. [Google Scholar]
  2. Hossain, M.R.; Hasan, M.M.; Nishat, M.; Noor, E.A.; Ahmed, F.; Ferdous, T.; Hossain, M.A. DFT and QTAIM investigations of the adsorption of chlormethine anticancer drug on the exterior surface of pristine and transition metal functionalized boron nitride fullerene. J. Mol. Liq. 2021, 323, 114627. [Google Scholar] [CrossRef]
  3. El-Gammal, O.A.; El-Bindary, A.A.; Mohamed, F.S.; Rezk, G.N.; El-Bindary, M.A. Synthesis, characterization, design, molecular docking, anti COVID-19 activity, DFT calculations of novel Schiff base with some transition metal complexes. J. Mol. Liq. 2022, 346, 117850. [Google Scholar] [CrossRef]
  4. Bönnemann, H.; Brijoux, W.; Brinkmann, R.; Joußen, T.; Korall, B.; Dinjus, E. Formation of colloidal transition metals in organic phases and their application in catalysis. Angew. Chem. Int. Ed. Engl. 1991, 30, 1312–1314. [Google Scholar] [CrossRef]
  5. Ullah, F.; Ayub, K.; Mahmood, T. High performance SACs for HER process using late first-row transition metals anchored on graphyne support: A DFT insight. Int. J. Hydrogen Energy 2021, 46, 37814–37823. [Google Scholar] [CrossRef]
  6. O’Halloran, T.V. Transition metals in control of gene expression. Science 1993, 261, 715–725. [Google Scholar] [CrossRef]
  7. Huang, Y.W.; Wu, C.H.; Aronstam, R.S. Toxicity of Transition Metal Oxide Nanoparticles: Recent Insights from in vitro Studies. Materials 2010, 3, 4842–4859. [Google Scholar] [CrossRef]
  8. Crans, D.C.; Kostenkova, K. Open questions on the biological roles of first-row transition metals. Commun. Chem. 2020, 3, 104. [Google Scholar] [CrossRef]
  9. Mills, K.C.; Curry, S.C. Acute iron poisoning. Emerg. Med. Clin. N. Am. 1994, 12, 397–413. [Google Scholar] [CrossRef]
  10. Van Cleave, C.; Crans, D.C. The first-row transition metals in the periodic table of medicine. Inorganics 2019, 7, 111. [Google Scholar] [CrossRef]
  11. Reaney, S.H.; Kwik-Uribe, C.L.; Smith, D.R. Manganese oxidation state and its implications for toxicity. Chem. Res. Toxicol. 2002, 15, 1119–1126. [Google Scholar] [CrossRef]
  12. Erikson, K.M.; Syversen, T.; Aschner, J.L.; Aschner, M. Interactions between excessive manganese exposures and dietary iron-deficiency in neurodegeneration. Environ. Toxicol. Pharmacol. 2005, 19, 415–421. [Google Scholar] [CrossRef]
  13. Crossgrove, J.; Zheng, W. Manganese toxicity upon overexposure. NMR Biomed. 2004, 17, 544–553. [Google Scholar] [CrossRef]
  14. McMillan, D. A brief history of the neurobehavioral toxicity of manganese: Some unanswered questions. Neurotoxicology 1999, 20, 499–507. [Google Scholar]
  15. Dias, A.M.; Hussain, A.; Marcos, A.S.; Roque, A.C. A biotechnological perspective on the application of iron oxide magnetic colloids modified with polysaccharides. Biotechnol. Adv. 2011, 29, 142–155. [Google Scholar] [CrossRef]
  16. Fraga, C.G.; Oteiza, P.I. Iron toxicity and antioxidant nutrients. Toxicology 2002, 180, 23–32. [Google Scholar] [CrossRef]
  17. Chamnongpol, S.; Dodson, W.; Cromie, M.J.; Harris, Z.L.; Groisman, E.A. Fe(III)-mediated cellular toxicity. Mol. Microbiol. 2002, 45, 711–719. [Google Scholar] [CrossRef]
  18. Britton, R.S.; Leicester, K.L.; Bacon, B.R. Iron toxicity and chelation therapy. Int. J. Hematol. 2002, 76, 219–228. [Google Scholar] [CrossRef]
  19. Leyssens, L.; Vinck, B.; Van Der Straeten, C.; Wuyts, F.; Maes, L. Cobalt toxicity in humans-A review of the potential sources and systemic health effects. Toxicology 2017, 387, 43–56. [Google Scholar] [CrossRef]
  20. Suh, M.; Thompson, C.M.; Brorby, G.P.; Mittal, L.; Proctor, D.M. Inhalation cancer risk assessment of cobalt metal. Regul. Toxicol. Pharm. 2016, 79, 74–82. [Google Scholar] [CrossRef]
  21. Kaim, W.; Rall, J. Copper—A “modern” bioelement. Angew. Chem. Int. Ed. Engl. 1996, 35, 43–60. [Google Scholar] [CrossRef]
  22. Tisato, F.; Marzano, C.; Porchia, M.; Pellei, M.; Santini, C. Copper in diseases and treatments, and copper-based anticancer strategies. Med. Res. Rev. 2010, 30, 708–749. [Google Scholar] [CrossRef] [PubMed]
  23. Uriu-Adams, J.Y.; Keen, C.L. Copper, oxidative stress, and human health. Mol. Asp. Med. 2005, 26, 268–298. [Google Scholar] [CrossRef] [PubMed]
  24. Frassinetti, S.; Bronzetti, G.; Caltavuturo, L.; Cini, M.; Croce, C.D. The role of zinc in life: A review. J. Env. Pathol. Toxicol. Oncol. 2006, 25, 597–610. [Google Scholar] [CrossRef]
  25. Beyersmann, D. Homeostasis and cellular functions of zinc. Materialwiss. Werkstofftech. 2002, 33, 764–769. [Google Scholar] [CrossRef]
  26. Tudor, R.; Zalewski, P.D.; Ratnaike, R.N. Zinc in health and chronic disease. J. Nutr. Health Aging 2005, 9, 45–51. [Google Scholar]
  27. Shekhawat, K.; Chatterjee, S.; Joshi, B. Chromium toxicity and its health hazards. Int. J. Adv. Res 2015, 3, 167–172. [Google Scholar]
  28. Guertin, J. Toxicity and health effects of chromium (all oxidation states). In Chromium (VI) Handbook; CRC Press: Boca Raton, FL, USA, 2004; pp. 215–234. [Google Scholar] [CrossRef]
  29. Gu, X.; Evans, L.J. Surface complexation modelling of Cd (II), Cu (II), Ni (II), Pb (II) and Zn (II) adsorption onto kaolinite. Geochim. Cosmochim. Acta 2008, 72, 267–276. [Google Scholar] [CrossRef]
  30. Mulani, K.; Daniels, S.; Rajdeo, K.; Tambe, S.; Chavan, N. Adsorption of chromium (VI) from aqueous solutions by coffee polyphenol-formaldehyde/acetaldehyde resins. J. Polym. 2013, 2013, 98368. [Google Scholar] [CrossRef]
  31. Saha, B.; Tai, M.; Streat, M. Adsorption of transition metals from aqueous solutions by modified activated carbons. Chem. Eng. Res. Des. 2003, 81, 1343–1353. [Google Scholar] [CrossRef]
  32. White, R.L.; White, C.M.; Turgut, H.; Massoud, A.; Tian, Z.R. Comparative studies on copper adsorption by graphene oxide and functionalized graphene oxide nanoparticles. J. Taiwan Inst. Chem. Eng. 2018, 85, 18–28. [Google Scholar] [CrossRef]
  33. Yang, L.; Huang, N.; Huang, L.; Liu, M.; Li, H.; Zhang, Y.; Yao, S. An electrochemical sensor for highly sensitive detection of copper ions based on a new molecular probe Pi-A decorated on graphene. Anal. Methods 2017, 9, 618–624. [Google Scholar] [CrossRef]
  34. Das, B.; Ghosh, A.; Dorairaj, D.P.; Dolai, M.; Karvembu, R.; Mabhai, S.; Im, H.; Dey, S.; Jana, A.; Misra, A. Multiple ion (Al3+, Cr3+, Fe3+, and Cu2+) sensing using a cell-compatible rhodamine-phenolphthalein-derived Schiff-base probe. J. Mol. Liq. 2022, 354, 118824. [Google Scholar] [CrossRef]
  35. Yar, M.; Hashmi, M.A.; Khan, A.; Ayub, K. Carbon nitride 2-D surface as a highly selective electrochemical sensor for V-series nerve agents. J. Mol. Liq. 2020, 311, 113357. [Google Scholar] [CrossRef]
  36. Yar, M.; Hashmi, M.A.; Ayub, K. The C 2 N surface as a highly selective sensor for the detection of nitrogen iodide from a mixture of NX 3 (X = Cl, Br, I) explosives. RSC Adv. 2020, 10, 31997–32010. [Google Scholar] [CrossRef]
  37. Csonka, G. Proper basis set for quantum mechanical studies of potential energy surfaces of carbohydrates. J. Mol. Struct. Theochem. 2002, 584, 1–4. [Google Scholar] [CrossRef]
  38. Zhao, Y.; Schultz, N.E.; Truhlar, D.G. Design of Density Functionals by Combining the Method of Constraint Satisfaction with Parametrization for Thermochemistry, Thermochemical Kinetics, and Noncovalent Interactions. J. Chem. Theory Comput. 2006, 2, 364–382. [Google Scholar] [CrossRef]
  39. Burns, L.A.; Vazquez-Mayagoitia, A.; Sumpter, B.G.; Sherrill, C.D. Density-functional approaches to noncovalent interactions: A comparison of dispersion corrections (DFT-D), exchange-hole dipole moment (XDM) theory, and specialized functionals. J. Chem. Phys. 2011, 134, 084107. [Google Scholar] [CrossRef]
  40. Hohenstein, E.G.; Chill, S.T.; Sherrill, C.D. Assessment of the Performance of the M05-2X and M06-2X Exchange-Correlation Functionals for Noncovalent Interactions in Biomolecules. J. Chem. Theory. Comput. 2008, 4, 1996–2000. [Google Scholar] [CrossRef]
  41. Goel, S.; Masunov, A.E. Dissociation curves and binding energies of diatomic transition metal carbides from density functional theory. Int. J. Quantum Chem. 2011, 111, 4276–4287. [Google Scholar] [CrossRef]
  42. Malloum, A.; Conradie, J. Structures, binding energies and non-covalent interactions of furan clusters. J. Mol. Graph. Model. 2022, 111, 108102. [Google Scholar] [CrossRef] [PubMed]
  43. Zhao, Y.; Truhlar, D.G. Applications and validations of the Minnesota density functionals. Chem. Phys. Lett. 2011, 502, 1–13. [Google Scholar] [CrossRef]
  44. Elm, J.; Mikkelsen, K.V. Computational approaches for efficiently modelling of small atmospheric clusters. Chem. Phys. Lett. 2014, 615, 26–29. [Google Scholar] [CrossRef]
  45. Li, W.; Xie, H.; Huang, Y.; Song, L.; Shao, Y.; Qiu, K. Application of Gaussian 09/GaussView 5.0 in analytical chemistry teaching. J. Kunming Med. Univ. 2016, 134–136. [Google Scholar]
  46. Lu, T.; Chen, F. Multiwfn: A multifunctional wavefunction analyzer. J. Comput. Chem. 2012, 33, 580–592. [Google Scholar] [CrossRef]
  47. Johnson, E.R.; Keinan, S.; Mori-Sanchez, P.; Contreras-Garcia, J.; Cohen, A.J.; Yang, W. Revealing noncovalent interactions. J. Am. Chem. Soc. 2010, 132, 6498–6506. [Google Scholar] [CrossRef]
  48. Vega, D.; Almeida, D. AIM-UC: An application for QTAIM analysis. J. Comput. Methods Sci. Eng. 2014, 14, 131–136. [Google Scholar] [CrossRef]
  49. Hohenstein, E.G.; Sherrill, C.D. Density fitting of intramonomer correlation effects in symmetry-adapted perturbation theory. J. Chem. Phys. 2010, 133, 014101. [Google Scholar] [CrossRef]
  50. Smith, D.G.A.; Burns, L.A.; Simmonett, A.C.; Parrish, R.M.; Schieber, M.C.; Galvelis, R.; Kraus, P.; Kruse, H.; Di Remigio, R.; Alenaizan, A.; et al. Psi4 1.4: Open-source software for high-throughput quantum chemistry. J. Chem. Phys. 2020, 152, 184108. [Google Scholar] [CrossRef]
Figure 1. Optimized structure and available adsorption sites of C2N surface. A–D shows four possible sites for the adsorption of analytes.
Molecules 28 04060 g001
Figure 2. The most stable configuration of TM@C2N complexes (Cr6+@C2N, Co2+@C2N, Zn2+@C2N, Fe2+@C2N, Mn2+@C2N and Cu2+@C2N).
Molecules 28 04060 g002
Figure 3. The closest interaction distances Dint for TM@C2N complexes.
Molecules 28 04060 g003
Figure 4. Graphical representation of H–L gap of TM@C2N.
Molecules 28 04060 g004
Figure 5. 3D isosurfaces of HOMO and LUMO of TM@C2N complexes.
Molecules 28 04060 g005
Figure 6. 2D RDG graphs of TM@C2N complexes (Cr6+@C2N, Co2+@C2N, Zn2+@C2N, Fe2+@C2N, Mn2+@C2N and Cu2+@C2N).
Molecules 28 04060 g006
Figure 7. The BCPs obtained using a QTAIM analysis of TM@C2N complexes.
Molecules 28 04060 g007
Table 1. Relative energies in kcal mol−1 for the spin states of TM@C2N complexes.
Spin StatesComplexes
Cu2+@C2NCo2+@C2NMn2+@C2N
Doublet0.02368
Quartet370.069
Sextet85410.0
Octet1368946
Cr6+@C2NFe2+@C2NZn2+@C2N
Singlet80600.0
Triplet0.02128
Quintet0.40.029
Septet6.83530
Table 2. Interaction energies (kcal mol−1) of the most stable TM@C2N complexes.
TM@C2N
(Solvent = Water)
Interaction Energy
(kcal mol−1)
Interacting AtomsInteraction Distance (Å)
Cu2+@C2N (Doublet)−6.6Cu-61………N-472.21
Cr6+@C2N (Quintet)−9.2Cr-61………..N-342.09
Zn2+@C2N (Singlet)−15.9Zn-61………N-472.12
Co2+@C2N (Quartet)−20.7Co-61………N-342.20
Fe2+@C2N (Sextet)−25.9Fe-61………N-472.30
Mn2+@C2N (Triplet)−43.1Mn-61……..N-472.34
Table 3. The EHOMO, ELUMO, EH–L gap (in eV) of TM@C2N complexes and charges on metals |𝑒|.
ComplexesEHOMOELUMOEH–L (eV)QNBO
C2N−7.870−2.175.71-
Cu2+@C2N−13.30−11.062.240.871
Fe2+@C2N−13.22−8.514.711.640
Mn2+@C2N−13.27−8.484.801.672
Zn2+@C2N−13.17−8.734.441.652
Cr6+@C2N−24.05−21.352.701.79
Co2+@C2N−13.20−8.6374.560.861
Table 4. The values of topological parameter of BCPs of TM@C2N complex obtained from QTAIMs analysis.
Analytes@C2NC2N—AnalyteBCPρ2ρG (r)V (r)H (r)V(r)/G(r)
Cu2+@C2NN18-960.020.070.01−0.010.0011.0
N23-990.050.190.06−0.08−0.0141.3
N36-1120.050.190.06−0.07−0.0141.1
N44-1170.020.070.01−0.040.0014
Fe2+@C2NN18-970.35−0.100.34−0.94−0.592.7
N23-1000.33−0.970.11−0.48−0.364.3
N25-1040.29−0.780.07−0.34−0.274.8
N37-1150.30−0.820.08−0.37−0.294.6
N39-1190.34−0.100.31−0.89−0.572.8
N-441220.020.180.04−0.030.0080.7
Zn2+@C2NN20-970.40−0.0100.34−0.90−0.62.6
N21-1010.29−0.7790.078−0.35−0.34.4
N33-1090.29−0.1140.0330.35−0.310
N42-1150.302−0.820.086−0.37−0.24.3
Mn2+@C2NN19-970.35−0.100.34−0.94−0.62.7
N22-1010.293−0.7790.078−0.35−0.34.4
N28-1060.292−0.110.032−0.35−0.311
N34-1110.28−0.760.073−0.33−0.34.5
N40-1160.33−0.990.122−0.49−0.44.0
N43-1200.0150.0450.010−0.0090.0080.9
Cr6+@C2NN18-940.0160.0330.010−0.012−0.0021.2
N23-970.0530.290.071−0.0690.0030.9
N36-1080.0690.3750.095−0.097−0.0021.0
N44-1120.0260.0680.020−0.0240.0041.2
Co2+@C2NN18-980.020.050.016−0.019−0.0031.1
N26-1030.0570.180.059−0.072−0.0131.2
N39-1160.0570.180.059−0.072−0.0131.2
N44-1170.0210.05610.016−0.019−0.0021.1
Table 5. The SAPT0 analysis (in kcal mol−1) of TM@C2N complexes.
TM@C2NEelecEexchEIndEdispESAPT0
Cu2+@C2N−167.4641.33−121.82−7.15−255.09
Fe2+@C2N−163.2838.030.3244−6.96−131.88
Mn2+@C2N−156.8424.55−144.44−6.62−283.35
Zn2+@C2N−173.3345.06−170.61−7.31−306.20
Co2+@C2N−172.6854.46−48.38−7.82−174.43
Cr6+@C2N−463.2681.73−4759.46−4.76−5145.76
Table 6. Work function (Φ), sensitivity S (%), and conductivity (σ) values of TM@C2N complexes.
ComplexesΦS (%)σ
C2N5.02-1.09 × 10−48
Cu2+@C2N12.18142.631.53 × 10−19
Fe2+@C2N10.8610.792.74 × 10−40
Mn2+@C2N10.870.094.80 × 10−41
Zn2+@C2N10.950.695.08 × 10−38
Cr6+@C2N22.7107.302.09 × 10−23
Co2+@C2N10.9251.904.98 × 10−39
Disclaimer/Publisher’s Note: The statements, opinions and data contained in all publications are solely those of the individual author(s) and contributor(s) and not of MDPI and/or the editor(s). MDPI and/or the editor(s) disclaim responsibility for any injury to people or property resulting from any ideas, methods, instructions or products referred to in the content.

