
Discovery of New 2-Phenylamino-3-acyl-1,4-naphthoquinones as Inhibitors of Cancer Cells Proliferation: Searching for Intra-Cellular Targets Playing a Role in Cancer Cells Survival
 , , and
Abstract
:1. Introduction
2. Results and Discussion
2.1. Anti-Proliferative Evaluation
2.2. Physicochemical Descriptors
2.3. pkCSM and SwissADME
2.4. mRNA Expression Evaluation
2.5. Molecular Docking
3. Materials and Methods
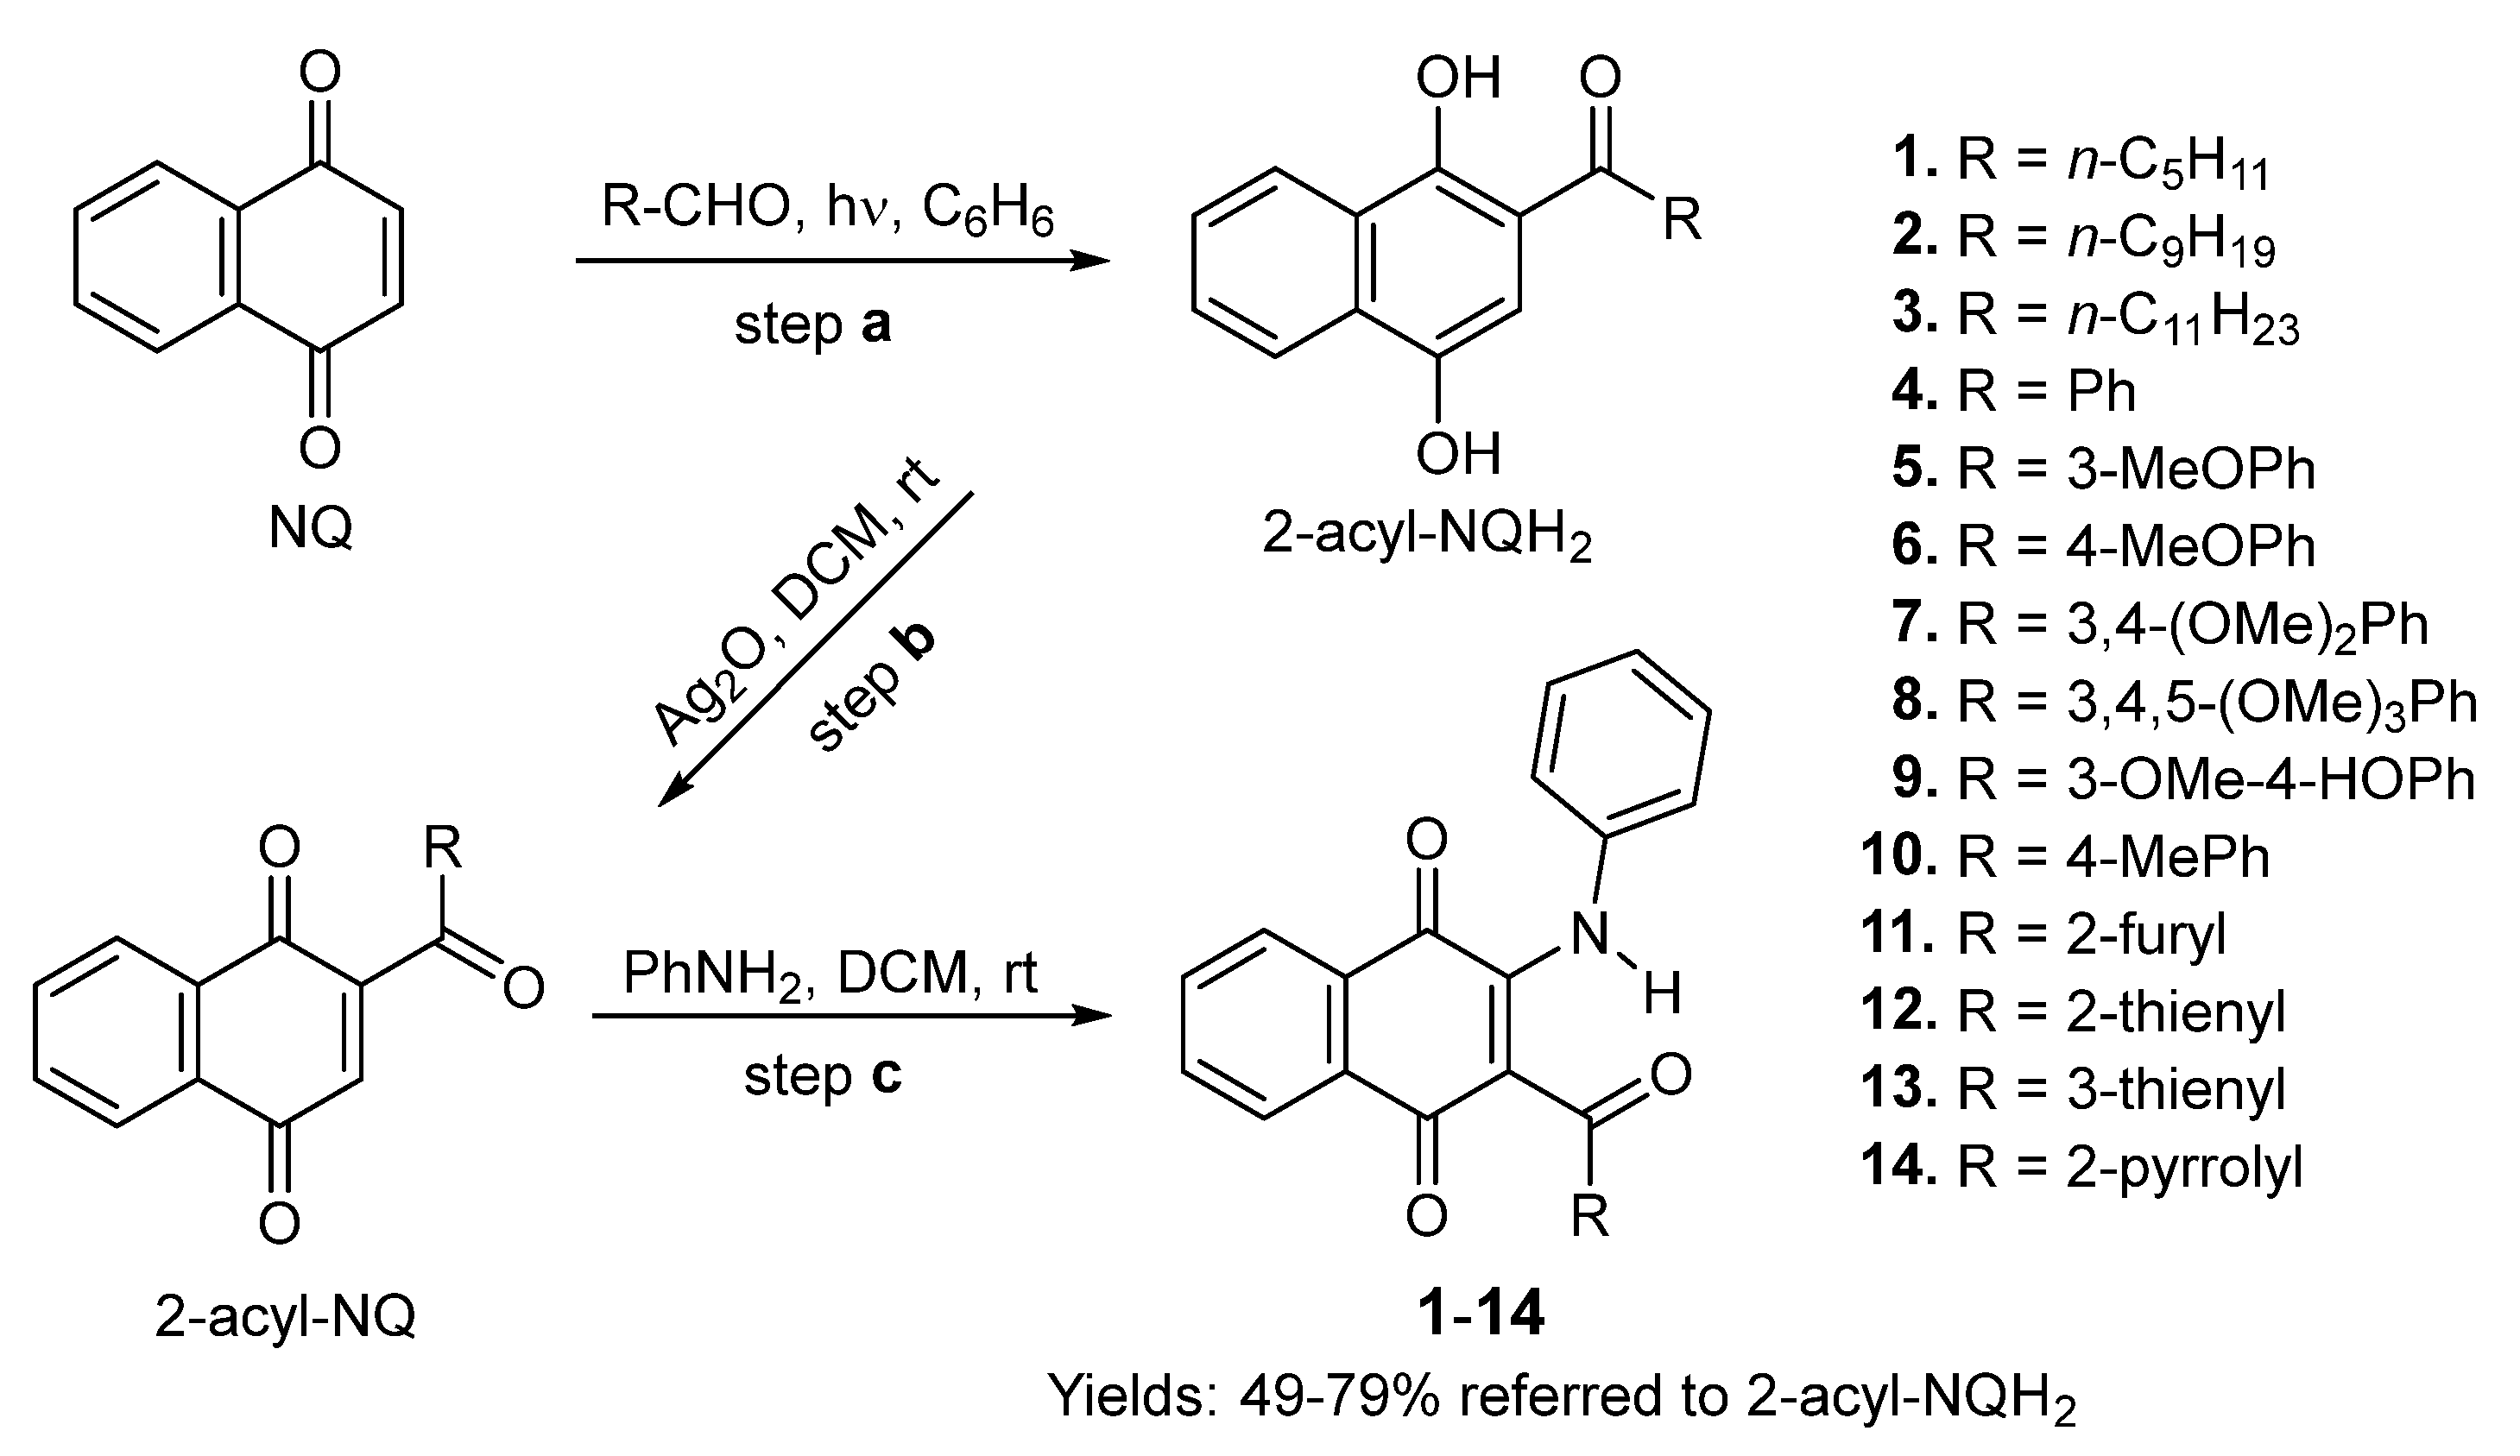
3.1. Chemistry
3.1.1. General Information
3.1.2. Synthesis of 2-Phenylamino-3-acyl-1,4-naphtoquinones 1–14
3.1.3. General Procedure for the Preparation of 2-Phenylamino-3-acyl-1,4-naphtoquinones 1–10 and 13–14
- 2-(Phenylamino)-3-hexanoylnaphthalene-1,4-dione1. (55%), red solid, mp: 124–126 °C. IR (KBr) νmáx cm−1: 3431 (NH); 1687 (C=O); 1640 (C=O); 1595 (C=O). 1H–NMR (300 MHz, CDCl3) δ: 0.90 (t, 3H, J = 6.9 Hz, –COCH2–(CH2)3–CH3); 1.32 (m, 4H, –COCH2–CH2–CH2–CH2–CH3); 1.55 (m, 2H, –COCH2–CH2–(CH2)2–CH3); 3.04 (m, 2H, –COCH2–(CH2)3–CH3); 7.13 (m, 2H, H–arom); 7.29 (m, 1H, H–arom); 7.38 (m, 2H, H–arom); 7.65 (td, 1H, J = 7.5, 1.3 Hz, H–6 or H–7); 7.79 (td, 1H, J = 7.6, 1.4 Hz, H–7 or H–6); 7.93 (dd, 1H, J = 7.7, 0.9 MHz, H–5); 8.17 (dd, 1H, J = 7.8, 0.8 MHz, H–8); 12.09 (s, 1H, –NH). 13C–NMR (75 MHz, CDCl3) δ: 14.16; 22.73; 24.11; 31.65; 44.89; 112.78; 124.74 (2C); 126.25; 126.78; 126.98; 129.39 (2C); 131.04; 132.74; 133.53; 135.43; 139.20; 150.43; 181.69; 182.41; 205.39. HRMS (APCI): [M + H]+ calcd for C22H21NO3: 347.15214; found 347.15209.
- 2-(Phenylamino)-3-decanoylnaphthalene-1,4-dione2. (55%), red solid, mp: 95–96 °C. IR (KBr) νmáx cm−1: 3783 (NH); 1678 (C=O); 1638 (C=O); 1594 (C=O). 1H–NMR (300 MHz, CDCl3) δ: 0.88 (t, 3H, J = 6.6 Hz, –COCH2–(CH2)7–CH3); 1.29 (m, 12H, –COCH2–CH2–CH2–CH2–CH2–CH2–CH2–CH2–CH3); 1.54 (d, 2H, J = 6.8 Hz, –COCH2–CH2–(CH2)6–CH3); 3.04 (m, 2H, –COCH2–(CH2)7–CH3); 7.12 (d, 2H, J = 7.6 Hz, H–arom); 7.31 (d, 1H, J = 7.2 Hz, H–arom); 7.39 (t, 2H, J = 7.5 Hz, H–arom); 7.65 (td, 1H, J = 7.6, 1.1 Hz, H–6 or H–7); 7.80 (td, 1H, J = 7.6, 1.2 Hz, H–7 or H–6); 7.94 (d, 1H, J = 7.7 Hz, H–5); 8.17 (d, 1H, J = 7.8 Hz, H–8); 12.09 (s, 1H, –NH). 13C–NMR (75 MHz, CDCl3) δ: 14.15; 22.70; 24.31; 29.33; 29.36; 29.53; 29.58; 31.92; 44.83; 112.70; 124.63 (2C); 126.13; 126.67; 126.86; 129.27 (2C); 130.94; 132.62; 133.43; 135.31; 139.10; 150.31; 181.58; 182.30; 205.29. HRMS (APCI): [M + H]+ calcd for C26H29NO3: 403.21474; found 403.21159.
- 2-(Phenylamino)-3-dodecanoylnaphthalene-1,4-dione3. (53%), red solid, mp: 100–101°C. IR (KBr) νmáx cm−1: 3434 (NH); 1679 (C=O); 1638 (C=O); 1569 (C=O). 1H–NMR (300 MHz, CDCl3) δ: 0.87 (t, 3H, J = 6.3 Hz, –COCH2–(CH2)9–CH3); 1.28 (m, 16H, COCH2–CH2–CH2–CH2–CH2–CH2–CH2–CH2–CH2–CH2–CH3); 1.54 (m, 2H, COCH2–CH2–(CH2)8–CH3); 3.04 (t, 2H, J = 7.4 Hz, –COCH2–(CH2)9–CH3); 7.12 (d, 2H, J = 7.7 Hz, H–arom); 7.30 (d, 1H, J = 7.0 Hz, H–arom); 7.38 (t, 2H, J = 7.4 Hz, H–arom); 7.65 (t, 1H, J = 7.5 Hz H–6 or H–7); 7.79 (t, 1H, J = 7.6 Hz, H–7 or H–6); 7.93 (d, 1H, J = 7.6 Hz, H–5); 8.17 (d, 1H, J = 7.7 Hz, H–8); 12.09 (s, 1H, –NH). 13C–NMR (75 MHz, CDCl3) δ: 14.28; 22.83; 24.42; 29.49 (2C); 29.70 (2C); 29.79 (2C); 32.05; 44.95; 112.78; 124.73 (2C); 126.24; 126.78; 126.97; 129.38 (2C), 131.04; 132.73; 133.52; 135.43; 139.21; 150.42; 181.68; 182.41; 205.40. HRMS (APCI): [M + H]+ calcd for C28H33NO3: 431.21604; found 431.21814.
- 2-(Phenylamino)-3-benzoylnaphthalene-1,4-dione4. (55%), orange solid, mp: 224–226 °C. IR (KBr) νmáx cm−1: 3438 (NH); 1667 (C=O); 1592 (C=O); 1560 (C=O). 1H–NMR (300 MHz, CDCl3) δ: 6.85 (d, 2H, J = 7.0 Hz, H–arom); 7.00 (m, 3H, H–arom); 7.29 (m, 2H, H–arom); 7.46 (t, 1H, J = 7.4 Hz, H–arom); 7.55 (m, 2H, H–arom); 7.72 (td, 1H, J = 7.5, 1.3 Hz, H–7 or H–6); 7.80 (td, 1H, J =7.5, 1.3 Hz, H–6 or H–7); 7.90 (s, 1H, –NH), 8.12 (d, 1H, J = 7.6 Hz, H–5), 8.17 (d, 1H, J = 7.6 Hz, H–8). 13C–NMR (75 MHz, CDCl3) δ: 113.57; 126.19 (2xC); 126.69; 126.78; 127.18; 128.30 (2C); 128.93 (4C); 130.01; 132.85; 133.00; 133.17; 135.59; 136.85; 137.48; 143.77; 182.19; 182.38; 193.87. HRMS (APCI): [M + H]+ calcd for C23H15NO3: 353.10519; found 353.10196.
- 2-(Phenylamino)-3-(3-methoxybenzoyl)naphthalene-1,4-dione5. (60%), orange solid, mp: 164–166 °C. IR (KBr) νmáx cm−1: 3435 (NH); 1677 (C=O); 1652 (C=O); 1594 (C=O). 1H–NMR (300 MHz, CDCl3) δ: 3.74 (s, 3H, –OCH3); 6.86 (d, 2H, J = 6.8 Hz, H–arom); 7.01 (m, 5H, H–arom); 7.21 (d, 2H, J = 5.0 Hz, H–arom); 7.72 (t, 1H, J = 7.5 Hz, H–7 or H–6); 7.80 (t, 1H, J = 7.5 Hz, H–6 or H–7); 7.87 (s, 1H, –NH); 8.12 (d, 1H, J = 7.5 Hz, H–5), 8.17 (d, 1H, J = 7.6 Hz, H–8).13C–NMR (75 MHz, CDCl3) δ: 55.48; 112.00; 113.62; 120.13; 122.31; 126.30 (2C); 126.68; 126.79; 127.09; 128.95 (2C); 129.24; 129.98; 132.85; 132.98; 135.58; 136.83; 138.90; 143.63; 159.62; 182.14; 182.36; 193.66. HRMS (APCI): [M + H]+ calcd for C24H17NO4: 383.576; found 383.11242.
- 2-(Phenylamino)-3-(4-methoxybenzoyl)naphthalene-1,4-dione6. (53%), orange solid, mp: 227–229 °C. IR (KBr) νmáx cm−1: 3435 (NH); 1667 (C=O); 1659 (C=O); 1592 (C=O). 1H–NMR (300 MHz, CDCl3) δ: 3.83 (s, 3H, –OCH3); 6.77 (d, 2H, J = 8.7 Hz, H–arom); 6.86 (d, 2H, J = 7.0 Hz, H–arom); 7.00 (m, 3H, H–arom); 7.52 (d, 2H, J = 8.7 Hz, H–arom); 7.71 (t, 1H, J = 7.5 Hz, H–7 or H–6); 7.80 (m, 2H, –NH + H–6 or H–7); 8.11 (d, 1H, J = 7.6 Hz, H–5), 8.16 (d, 1H, J = 7.6 Hz, H–8). 13C–RMN (75 MHz, CDCl3) δ: 55.58; 113.52 (2C); 113.95; 126.16 (2C); 126.63; 126.76; 127.10; 128.78 (2C); 129.98; 130.97; 131.34 (2C); 132.78; 133.02; 135.52; 136.86; 143.45; 163.65; 182.21; 182.48; 192.20. HRMS (APCI): [M + H]+ calcd for C24H17NO4: 383.39608; found 383.39818.
- 2-(Phenylamino)-3-(3,4-dimethoxybenzoyl)naphthalene-1,4-dione7. (63%), orange solid, mp: 217–219 °C. IR (KBr) νmáx cm−1: 3435 (NH); 1675 (C=O); 1649 (C=O); 1618 (C=O). 1H–NMR (300 MHz, DMSO–d6) δ: 3.65 (s, 3H, –OCH3); 3.81 (s, 3H, –OCH3); 6.89 (m, 7H, H–arom); 7.30 (dd, 1H, J = 8.4, 1.5 Hz, H–arom); 7.87 (m, 3H, H–5 + H–6 + H–7); 8.11 (d, 1H, J = 7.5 Hz, H–8); 9.33 (s, 1H, –NH). 13C–NMR (75 MHz, DMSO–d6) δ: 55.38; 55.72; 109.88; 110.33; 113.37; 124.28; 125.53; 125.75; 126.07; 126.27 (2C); 127.91 (2C); 130.31; 130.72; 132.61; 132.80; 135.07; 137.92; 144.66; 148.24; 152.94; 181.53; 182.10; 192.02. HRMS (APCI): [M + H]+ calcd for C25H19NO5: 413.12632; found 413.12275.
- 2-(Phenylamino)-3-(3,4,5-trimethoxybenzoyl)naphthalene-1,4-dione8. (55%), orange solid, mp: 209–210° C. IR (KBr) νmáx cm−1: 3435 (NH); 1683 (C=O); 1657 (C=O); 1509 (C=O). 1H–NMR (300 MHz, DMSO–d6) δ: 3.69 (s, 6H, –OCH3); 3.72 (s, 3H, –OCH3); 6.74 (s, 2H, H–arom); 6.82 (m, 2H, H–arom); 6.95 (m, 3H, H–arom); 7.85 (m, 2H, H–5 + H–7 or H–6); 7.96 (d, 1H, J = 7.3 Hz, H–6 or H–7); 8.12 (d, 1H, J = 6.7 Hz, H–8); 9.35 (s, 1H, –NH). 13C–NMR (75 MHz, DMSO–d6) δ: 56.10 (2C); 60.24; 106.24; 112.84; 125.55; 125.71; 126.05; 126.24 (2C); 128.00 (3C); 130.44; 132.75 (2C); 132.78; 135.01; 137.98; 141.94; 144.99; 152.43 (2xC); 181.53; 182.09; 192.43. HRMS (APCI): [M + H]+ calcd for C26H21NO6: 443.13689; found 443.13299.
- 2-(Phenylamino)-3-(4-hydroxy-3-methoxybenzoyl)naphthalene-1,4-dione9. (54%), orange solid, mp: 194–195 °C. IR (KBr) νmáx cm−1: 3433 (NH); 1679 (C=O); 1565 (C=O); 1503 (C=O). 1H–NMR (300 MHz, CDCl3) δ: 3.78 (s, 3H, –OCH3); 6.15 (s, 1H, –OH); 6.79 (d, 1H, J = 8.2 Hz, H–arom); 6.85 (m, 2H, H–arom); 6.94 (d, 1H, J = 1.7 Hz, H–arom); 7.01 (m, 3H, H–arom); 7.23 (dd, 1H, J = 8.2, 1.8 Hz, H–arom); 7.71 (dt, 1H, J = 7.5, 3.8 Hz, H–7 or H–6); 7.79 (m, 2H, –NH + H–6 or H–7); 8.12 (d, 1H, J = 7.6 Hz, H–5); 8.16 (d, 1H, J = 7.7 Hz, H–8). 13C–NMR (75 MHz, CDCl3) δ: 56.09; 109.54; 113.61; 113.83; 125.55; 126.40 (2C); 126.66; 126.80; 126.92; 128.78 (2C); 129.95; 130.89; 132.82; 133.00; 135.55; 136.82; 143.34; 146.57; 150.63; 182.19; 182.43; 192.28. HRMS (APCI): [M + H]+ calcd for C24H17NO5: 399.11067; found 399.11316.
- 2-(Phenylamino)-3-(4-methylbenzoyl)naphthalene-1,4-dione10. (50%), red solid, mp: 224–226 °C. IR (KBr) νmáx cm−1: 3434 (NH); 1679 (C=O); 1658 (C=O); 1604 (C=O). 1H-NMR (300 MHz, CDCl3) δ: 2.36 (s, 3H, –CH3); 6.86 (d, 2H, J = 7.3 Hz, H–arom); 7.00 (m, 3H, H–arom); 7.09 (d, 2H, J = 7.9 Hz, H–arom); 7.46 (d, 2H, J = 8.0 Hz, H–arom); 7.71 (t, 1H, J = 7.5 Hz, H–7 or H–6); 7.79 (t, 1H, J = 7.5 Hz, H–6 or H–7); 7.89 (s, 1H, -NH); 8.11 (d, 1H, J = 7.6 Hz, H–5); 8.16 (d, 1H, J = 7.5 Hz, H–8). 13C-NMR (75 MHz, CDCl3) δ: 21.87; 113.78; 126.06 (2xC); 126.64; 126.76; 127.09; 128.87 (2xC); 129.03 (2xC); 129.09 (2xC); 130.00; 132.79; 133.01; 135.21; 135.53; 136.91; 143.61; 144.03; 182.23; 182.44; 193.46. HRMS (APCI): [M + H]+ calcd for C24H17NO3: 367.12084; found 367.12371.
- 2-(Phenylamino)-3-(thiophene-3-carbonyl)naphthalene-1,4-dione13. (50%), orange solid. mp: 187–189 °C. IR (KBr) νmáx cm−1: 3432 (NH); 1677 (C=O); 1657 (C=O); 1561 (C=O). 1H–NMR (300 MHz, CDCl3) δ: 6.87 (m, 2H, H–arom); 7.06 (m, 4H, H–arom); 7.12 (m, 1H, H–arom); 7.71 (m, 2H, H–7 or H–6 + H–arom); 7.80 (t, 1H, J = 7.5 Hz, H–6 or H–7); 7.86 (s, 1H, –NH); 8.14 (t, 2H, J = 8.3 Hz, H–5 + H–8). 13C-NMR (75 MHz, CDCl3) δ: 114.40; 125.83; 125.96 (2C); 126.67; 126.79; 127.09; 127.16; 128.87 (2C); 129.91; 132.86; 132.95; 133.62; 135.62; 136.81; 143.27; 143.30; 181.94; 182.50; 187.07. HRMS (APCI): [M + H]+ calcd for C21H13NO3S: 359.06161; found 359.05989
- 2-(Phenylamino)-3-(1H-pyrrole-2-carbonyl)naphthalene-1,4-dione14. (55%), red solid, mp: 210–212 °C. IR (KBr) νmáx cm−1: 3439 (NH); 1670 (C=O); 1615 (C=O); 1591 (C=O). 1H–NMR (300 MHz, CDCl3) δ: 6.19 (m, 1H, H–arom); 6.69 (s, 1H, H–arom); 6.89 (d, 3H, J = 7.6 Hz, H–arom); 7.04 (d, 3H, J = 6.8 Hz, H–arom); 7.71 (t, 1H, J = 7.5 Hz, H–7 or H–6); 7.80 (m, 2H, –NH + H–6 or H–7); 8.15 (d, 2H, J = 8.2 Hz, H–8 + H–5); 8.97 (s, 1H, –NH). 13C–NMR (75 MHz, CDCl3) δ: 110.94; 113.70; 118.83; 125.29; 125.80 (2C); 126.62; 126.84 (2C); 128.41 (2C); 129.96; 132.75; 133.08; 133.60; 135.52; 136.81; 143.27; 181.52; 181.89; 182.59. HRMS (APCI): [M + H]+ calcd for C21H14N2O3: 342.10044; found 342.099234.
3.1.4. Molecular Descriptors
3.2. Cytotoxic Assays
3.2.1. Cell Lines and Cell Cultures
3.2.2. Cell Survival Assays
3.3. Quantitative Real-Time PCR (qPCR) Assay
3.4. In Silico Studies
3.4.1. Molecular Docking
3.4.2. Ligand Efficiency
3.5. Physicochemical, Pharmacokinetic, and Drug Likeness Properties
3.6. Statistical Analysis
4. Conclusions
Supplementary Materials
Author Contributions
Funding
Institutional Review Board Statement
Informed Consent Statement
Data Availability Statement
Acknowledgments
Conflicts of Interest
Sample Availability
References
- Verma, R. Anti-Cancer Activities of 1,4-Naphthoquinones: A QSAR Study. Anti-Cancer Agents Med. Chem. 2006, 6, 489–499. [Google Scholar] [CrossRef] [PubMed]
- Tandon, V.; Kumar, S. Recent development on naphthoquinone derivatives and their therapeutic applications as anticancer agents. Expert Opin. Ther. Pat. 2013, 23, 1087–1108. [Google Scholar] [CrossRef] [PubMed]
- Prachayasittikul, V.; Pingaew, R.; Worachartcheewan, A.; Nantasenamat, C.; Prachayasittikul, S.; Ruchirawat, S.; Prachayasittikul, V. Synthesis, anticancer activity and QSAR study of 1,4-naphthoquinone derivatives. Eur. J. Med. Chem. 2014, 84, 247–263. [Google Scholar] [CrossRef] [PubMed]
- Pingaew, R.; Prachayasittikul, V.; Worachartcheewan, A.; Nantasenamat, C.; Prachayasittikul, S.; Ruchirawat, S.; Prachayasittikul, V. Novel 1,4-naphthoquinone-based sulfonamides: Synthesis, QSAR, anticancer and antimalarial studies. Eur. J. Med. Chem. 2015, 103, 446–459. [Google Scholar] [CrossRef]
- Badave, D.K.; Khan, A.A.; Rane, Y.S. Anticancer Vitamin K3 Analogs: A Review. Anti-Cancer Agents Med. Chem. 2016, 16, 1017–1030. [Google Scholar] [CrossRef] [PubMed]
- Benites, J.; Valderrama, J.A.; Bettega, K.; Pedrosa, R.C.; Calderon, P.B.; Verrax, J. Biological evaluation of donor-acceptor aminonaphthoquinones as antitumor agents. Eur. J. Med. Chem. 2010, 45, 6052–6057. [Google Scholar] [CrossRef] [PubMed]
- Mahalapbutr, P.; Leechaisit, R.; Thongnum, A.; Todsaporn, D.; Prachayasittikul, V.; Rungrotmongkol, T.; Prachayasittikul, S.; Ruchirawat, S.; Prachayasittikul, V.; Pingaew, R. Discovery of Anilino-1,4-naphthoquinones as Potent EGFR Tyrosine Kinase Inhibitors: Synthesis, Biological Evaluation, and Comprehensive Molecular Modeling. ACS Omega 2022, 7, 17881–17893. [Google Scholar] [CrossRef]
- Bolton, J.; Dunlap, T. Formation and Biological Targets of Quinones: Cytotoxic versus Cytoprotective Effects. Chem. Res. Toxicol. 2017, 30, 13–37. [Google Scholar] [CrossRef]
- Ríos, D.; Benites, J.; Torrejón, F.; Theoduloz, C.; Valderrama, J. Synthesis and in vitro antiproliferative evaluation of 3-acyl-2-arylamino-1,4-naphthoquinones. Med. Chem. Res. 2014, 23, 4149–4155. [Google Scholar] [CrossRef]
- Rios, D.; Benites, J.; Valderrama, J.A.; Farias, M.; Pedrosa, R.C.; Verrax, J.; Buc Calderon, P. Biological Evaluation of 3-Acyl-2-Arylamino-1,4-Naphthoquinones as Inhibitors of Hsp90 Chaperoning Function. Curr. Top. Med. Chem. 2012, 12, 2094–2102. [Google Scholar] [CrossRef]
- Gorrini, C.; Harris, I.; Mak, T. Modulation of oxidative stress as an anticancer strategy. Nat. Rev. Drug Discov. 2013, 12, 931–947. [Google Scholar] [CrossRef] [PubMed]
- Panieri, E.; Santoro, M.M. ROS homeostasis and metabolism: A dangerous liason in cancer cells. Cell Death Dise. 2016, 7, e2253. [Google Scholar] [CrossRef] [PubMed]
- Locasale, J.W.; Cantley, L.C. Metabolic Flux and the Regulation of Mammalian Cell Growth. Cell Metab. 2011, 14, 443–451. [Google Scholar] [CrossRef]
- Vafa, O.; Wade, M.; Kern, S.; Beeche, M.; Pandita, T.; Hampton, G.; Wahl, G. c-Myc Can Induce DNA Damage, Increase Reactive Oxygen Species, and Mitigate p53 Function. Mol. Cell 2002, 9, 1031–1044. [Google Scholar] [CrossRef]
- Ghoneum, A.; Abdulfattah, A.; Warren, B.; Shu, J.; Said, N. Redox Homeostasis and Metabolism in Cancer: A Complex Mechanism and Potential Targeted Therapeutics. Int. J. Mol. Sci. 2020, 21, 3100. [Google Scholar] [CrossRef] [PubMed]
- Sies, H.; Jones, D. Reactive oxygen species (ROS) as pleiotropic physiological signalling agents. Nat. Rev. Mol. Cell Biol. 2020, 21, 363–383. [Google Scholar] [CrossRef] [PubMed]
- Xing, F.; Hu, Q.; Qin, Y.; Xu, J.; Zhang, B.; Yu, X.; Wang, W. The Relationship of Redox with Hallmarks of Cancer: The Importance of Homeostasis and Context. Front. Oncol. 2022, 12, 862743. [Google Scholar] [CrossRef] [PubMed]
- Jamison, J.; Gilloteaux, J.; Taper, H.; Calderon, P.; Summers, J. Autoschizis: A novel cell death. Biochem. Pharmacol. 2002, 63, 1773–1783. [Google Scholar] [CrossRef]
- Verrax, J.; Cadrobbi, J.; Marques, C.; Taper, H.; Habraken, Y.; Piette, J.; Calderon, P. Ascorbate potentiates the cytotoxicity of menadione leading to an oxidative stress that kills cancer cells by a non-apoptotic caspase-3 independent form of cell death. Apoptosis 2004, 9, 223–233. [Google Scholar] [CrossRef]
- Zhou, B.; Zhang, J.-Y.; Liu, X.-S.; Chen, H.-Z.; Ai, Y.-L.; Cheng, K.; Sun, R.-Y.; Zhou, D.; Han, J.; Wu, Q. Tom20 senses iron-activated ROS signaling to promote melanoma cell pyroptosis. Cell Res. 2018, 28, 1171–1185. [Google Scholar] [CrossRef]
- Su, Y.; Zhao, B.; Zhou, L.; Zhang, Z.; Shen, Y.; Lv, H.; Alqudsy, L.; Shang, P. Ferroptosis, a novel pharmacological mechanism of anti-cancer drugs. Cancer Lett. 2020, 483, 127–136. [Google Scholar] [CrossRef]
- Kim, S.; Lee, H.; Lim, J.; Kim, H. Astaxanthin induces NADPH oxidase activation and receptor-interacting protein kinase 1-mediated necroptosis in gastric cancer AGS cells. Mol. Med. Rep. 2021, 24, 837–849. [Google Scholar] [CrossRef]
- Valderrama, J.; Ríos, D.; Muccioli, G.; Buc Calderon, P.; Brito, I.; Benites, J. Hetero-annulation reaction between 2-acylnaphthoquinones and 2-aminobenzothiazoles. A new synthetic route to antiproliferative benzo[g]benzothiazolo[2,3-b]quinazoline-7,12-quinones. Tetrahedron Lett. 2015, 56, 5103–5105. [Google Scholar] [CrossRef]
- Valderrama, J.; Delgado, V.; Sepúlveda, S.; Benites, J.; Theoduloz, C.; Buc Calderon, P.; Muccioli, G. Synthesis and Cytotoxic Activity on Human Cancer Cells of Novel Isoquinolinequinone–Amino Acid Derivatives. Molecules 2016, 21, 1199. [Google Scholar] [CrossRef] [PubMed]
- Benites, J.; Valderrama, J.; Ríos, D.; Lagos, R.; Monasterio, O.; Calderon, P. Inhibition of cancer cell growth and migration by dihydroxynaphthyl aryl ketones. Mol. Cell. Toxicol. 2016, 12, 237–242. [Google Scholar] [CrossRef]
- Valderrama, J.; Cabrera, M.; Benites, J.; Ríos, D.; Inostroza-Rivera, R.; Muccioli, G.; Calderon, P. Synthetic approaches and in vitro cytotoxic evaluation of 2-acyl-3-(3,4,5-trimethoxyanilino)-1,4-naphthoquinones. RSC Adv. 2017, 7, 24813–24821. [Google Scholar] [CrossRef]
- Benites, J.; Valderrama, J.; Ramos, M.; Muccioli, G.; Buc Calderon, P. Targeting Akt as strategy to kill cancer cells using 3-substituted 5-anilinobenzo[c]isoxazolequinones: A preliminary study. Biomed. Pharmacother. 2018, 97, 778–783. [Google Scholar] [CrossRef]
- Benites, J.; Valderrama, J.; Ramos, M.; Valenzuela, M.; Guerrero-Castilla, A.; Muccioli, G.; Buc Calderon, P. Half-Wave Potentials and In Vitro Cytotoxic Evaluation of 3-Acylated 2,5-Bis(phenylamino)-1,4-benzoquinones on Cancer Cells. Molecules 2019, 24, 1780. [Google Scholar] [CrossRef]
- Ríos, D.; Valderrama, J.; Cautin, M.; Tapia, M.; Salas, F.; Guerrero-Castilla, A.; Muccioli, G.; Buc Calderón, P.; Benites, J. New 2-Acetyl-3-aminophenyl-1,4-naphthoquinones: Synthesis and In Vitro Antiproliferative Activities on Breast and Prostate Human Cancer Cells. Oxid. Med. Cell. Longev. 2020, 2020, 8939716. [Google Scholar] [CrossRef]
- Verma, R.; Hansch, C. Elucidation of structure–activity relationships for 2- or 6-substituted-5,8-dimethoxy-1,4-naphthoquinones. Bioorg. Med. Chem. 2004, 12, 5997–6009. [Google Scholar] [CrossRef]
- Elfaki, M.; Sultan, M.; Mohammed, I. Mechanistic Study of Anticancer Activity of Some Known Aminopyrimidoisoquinolinequinones via QSAR Classification Methodology. Comp. Chem. 2020, 8, 1–13. [Google Scholar] [CrossRef]
- Veber, D.; Johnson, S.; Cheng, H.-Y.; Smith, B.; Ward, K.; Kopple, K. Molecular Properties That Influence the Oral Bioavailability of Drug Candidates. J. Med. Chem. 2002, 45, 2615–2623. [Google Scholar] [CrossRef] [PubMed]
- Angelis, I.; Turco, L. Caco-2 Cells as a Model for Intestinal Absorption. Curr. Protoc. Toxicol. 2011, 47, 20–26. [Google Scholar] [CrossRef] [PubMed]
- Cheng, F.; Li, W.; Zhou, Y.; Shen, J.; Wu, Z.; Liu, G.; Lee, P.; Tang, Y. admetSAR: A Comprehensive Source and Free Tool for Assessment of Chemical ADMET Properties. J. Chem. Inf. Mod. 2012, 52, 3099–3105. [Google Scholar] [CrossRef] [PubMed]
- Nau, R.; Sörgel, F.; Eiffert, H. Penetration of Drugs through the Blood-Cerebrospinal Fluid/Blood-Brain Barrier for Treatment of Central Nervous System Infections. Clin. Microbiol. Revi. 2010, 23, 858–883. [Google Scholar] [CrossRef] [PubMed]
- Domínguez-Villa, F.; Durán-Iturbide, N.; Ávila-Zárraga, J. Synthesis, molecular docking, and in silico ADME/Tox profiling studies of new 1-aryl-5-(3-azidopropyl)indol-4-ones: Potential inhibitors of SARS CoV-2 main protease. Bioorg. Chem. 2021, 106, 104497. [Google Scholar] [CrossRef] [PubMed]
- Brenk, R.; Schipani, A.; James, D.; Krasowski, A.; Gilbert, I.H.; Frearson, J.; Wyatt, P.G. Lessons Learnt from Assembling Screening Libraries for Drug Discovery for Neglected Diseases. ChemMedChem 2008, 3, 435–444. [Google Scholar] [CrossRef]
- Vaux, D.; Cory, S.; Adams, J. Bcl-2 gene promotes haemopoietic cell survival and cooperates with c-myc to immortalize pre-B cells. Nature 1988, 335, 440–442. [Google Scholar] [CrossRef]
- Gross, A.; McDonnell, J.; Korsmeyer, S. BCL-2 family members and the mitochondria in apoptosis. Genes Dev. 1999, 13, 1899–1911. [Google Scholar] [CrossRef]
- Hardwick, J.; Soane, L. Multiple Functions of BCL-2 Family Proteins. Cold Spring Harb. Perspect. Biol. 2013, 5, a008722. [Google Scholar] [CrossRef]
- Adams, J.; Cory, S. The BCL-2 arbiters of apoptosis and their growing role as cancer targets. Cell Death Differ. 2018, 25, 27–36. [Google Scholar] [CrossRef] [PubMed]
- Hay, N.; Sonenberg, N. Upstream and downstream of mTOR. Genes Dev. 1926, 18, 1926–1945. [Google Scholar] [CrossRef]
- Wullschleger, S.; Loewith, R.; Hall, M. TOR Signaling in Growth and Metabolism. Cell 2006, 124, 471–484. [Google Scholar] [CrossRef] [PubMed]
- Xu, K.; Liu, P.; Wei, W. mTOR signaling in tumorigenesis. Biochim. Biophys. Acta 2014, 1846, 638–654. [Google Scholar] [CrossRef] [PubMed]
- Guertin, D.; Sabatini, D. An expanding role for mTOR in cancer. Trends Mol. Med. 2005, 11, 353–361. [Google Scholar] [CrossRef]
- Rafalski, V.; Brunet, A. Energy metabolism in adult neural stem cell fate. Prog. Neurobiol. 2011, 93, 182–203. [Google Scholar] [CrossRef]
- King, D.; Yeomanson, D.; Bryant, H. PI3King the lock: Targeting the PI3K/Akt/mTOR pathway as a novel therapeutic strategy in neuroblastoma. J. Ped. Hematol. Oncol 2015, 37, 245–251. [Google Scholar] [CrossRef]
- Mossmann, D.; Park, S.; Hall, M. mTOR signalling and cellular metabolism are mutual determinants in cancer. Nat. Rev. Cancer 2018, 18, 744–757. [Google Scholar] [CrossRef]
- Magaway, C.; Kim, E.; Jacinto, E. Targeting mTOR and Metabolism in Cancer: Lessons and Innovations. Cells 2019, 8, 1584. [Google Scholar] [CrossRef]
- Huang, S. mTOR Signaling in Metabolism and Cancer. Cells 2020, 9, 2278. [Google Scholar] [CrossRef]
- Alzahrani, A.S. PI3K/Akt/mTOR inhibitors in cancer: At the bench and bedside. Semin. Cancer Biol. 2019, 59, 125–132. [Google Scholar] [CrossRef] [PubMed]
- Hua, H.; Kong, Q.; Zhang, H.; Wang, J.; Luo, T.; Jiang, Y. Targeting mTOR for cancer therapy. J. Hematol. Oncol. 2019, 12, 71. [Google Scholar] [CrossRef] [PubMed]
- Popova, N.; Jücker, M. The Role of mTOR Signaling as a Therapeutic Target in Cancer. Int. J. Mol. Sci. 2021, 22, 1743. [Google Scholar] [CrossRef]
- Qiu, H.-Y.; Wang, P.-F.; Zhang, M. A patent review of mTOR inhibitors for cancer therapy (2011–2020). Expert Opin. Ther. Pat. 2011, 31, 965–975. [Google Scholar] [CrossRef]
- Sun, S.-Y. mTOR-targeted cancer therapy: Great target but disappointing clinical outcomes, why? Front. Med. 2020, 15, 221–231. [Google Scholar] [CrossRef]
- Bendavit, G.; Aboulkassim, T.; Hilmi, K.; Shah, S.; Batist, G. Nrf2 Transcription Factor Can Directly Regulate mTOR: Linking cytoprotective gene expression to a major metabolic regulator that generates redox activity. J. Biol. Chem 2016, 291, 25476–25488. [Google Scholar] [CrossRef]
- Benites, J.; Rios, D.; Díaz, P.; Valderrama, J. The solar-chemical photo-Friedel–Crafts heteroacylation of 1,4-quinones. Tetrahedron Lett. 2011, 52, 609–611. [Google Scholar] [CrossRef]
- Prieto, Y.; Muñoz, M.; Arancibia, V.; Valderrama, M.; Lahoz, F.; Luisa Martín, M. Synthesis, structure and properties of ruthenium(II) complexes with quinolinedione derivatives as chelate ligands: Crystal structure of [Ru(CO)2Cl2(6-methoxybenzo[g]quinoline-5,10-dione)]. Polyhedron 2007, 26, 5527–5532. [Google Scholar] [CrossRef]
- Mosmann, T. Rapid colorimetric assay for cellular growth and survival: Application to proliferation and cytotoxicity assays. J. Immunol. Methods 1983, 65, 55–63. [Google Scholar] [CrossRef]
- Guerrero-Castilla, A.; Olivero-Verbel, J.; Sandoval, I.; Jones, D. Toxic effects of a methanolic coal dust extract on fish early life stage. Chemosphere 2019, 227, 100–108. [Google Scholar] [CrossRef]
- Fauman, E.; Cogswell, J.; Lovejoy, B.; Rocque, W.; Holmes, W.; Montana, V.; Piwnica-Worms, H.; Rink, M.; Saper, M. Crystal Structure of the Catalytic Domain of the Human Cell Cycle Control Phosphatase, Cdc25A. Cell 1998, 93, 617–625. [Google Scholar] [CrossRef] [PubMed]
- Smith, A.; Oslob, J.; Flanagan, W.; Braisted, A.; Whitty, A.; Cancilla, M.; Wang, J.; Lugovskoy, A.; Yoburn, J.; Fung, A.; et al. Small-molecule inhibition of TNF-alpha. Science 2005, 11, 1022–10255. [Google Scholar]
- Bottomley, M.; Lo Surdo, P.; Di Giovine, P.; Cirillo, A.; Scarpelli, R.; Ferrigno, F.; Jones, P.; Neddermann, P.; De Francesco, R.; Steinkühler, C.; et al. Structural and Functional Analysis of the Human HDAC4 Catalytic Domain Reveals a Regulatory Structural Zinc-binding Domain. J. Biol. Chem. 2008, 283, 26694–26704. [Google Scholar] [CrossRef] [PubMed]
- Berkholz, D.; Faber, H.; Savvides, S.; Karplus, P. Catalytic Cycle of Human Glutathione Reductase Near 1 Å Resolution. J. Mol. Biol. 2008, 382, 371–384. [Google Scholar] [CrossRef]
- Yang, H.; Rudge, D.; Koos, J.; Vaidialingam, B.; Yang, H.; Pavletich, N. mTOR kinase structure, mechanism and regulation. Nature 2013, 497, 217–223. [Google Scholar] [CrossRef]
- Iadanza, M.; Silvers, R.; Boardman, J.; Smith, H.; Karamanos, T.; Debelouchina, G.; Su, Y.; Griffin, R.; Ranson, N.; Radford, S. The structure of a β2-microglobulin fibril suggests a molecular basis for its amyloid polymorphism. Nature Commun. 2018, 9, 4517. [Google Scholar] [CrossRef]
- Porter, J.; Payne, A.; De Candole, B.; Ford, D.; Hutchinson, B.; Trevitt, G.; Turner, J.; Edwards, C.; Watkins, C.; Whitcombe, I.; et al. Tetrahydroisoquinoline amide substituted phenyl pyrazoles as selective Bcl-2 inhibitors. Bioorg. Med. Chem. Lett. 2009, 19, 230–233. [Google Scholar] [CrossRef]
- Stewart, J. Optimization of parameters for semiempirical methods V: Modification of NDDO approximations and appli-cation to 70 elements. J. Mol. Model. 2007, 13, 1173–1213. [Google Scholar] [CrossRef]
- Řezáč, J.; Hobza, P. Advanced Corrections of Hydrogen Bonding and Dispersion for Semiempirical Quantum Mechanical Methods. J. Chem. Theory Comput. 2012, 8, 141–151. [Google Scholar] [CrossRef]
- Sanner, M. Using the Python Programming Language for Bioinformatics; John Wiley & Sons, Ltd.: Hoboken, NJ, USA, 1999; Volume 17, pp. 55–84. [Google Scholar]
- Berman, H.; Westbrook, J.; Feng, Z.; Gilliland, G.; Bhat, T.; Weissig, H.; Ilya, N. The Protein Data Bank. Nucleic Acids Res. 2000, 28, 235–242. [Google Scholar] [CrossRef]
- Sastry, G.; Adzhigirey, M.; Day, T.; Annabhimoju, R.; Sherman, W. Protein and ligand preparation: Parameters, protocols, and influence on virtual screening enrichments. J. Comput. Aided Mol. Des. 2013, 27, 221–234. [Google Scholar] [CrossRef] [PubMed]
- Morris, G.; Goodsell, D.; Halliday, R.; Huey, R.; Hart, W.; Belew, R. Automated docking using a Lamarckian genetic algorithm and an empirical binding free energy function. J. Comput. Chem. 1998, 19, 1639–1662. [Google Scholar] [CrossRef]
- Trott, O.; Olson, A. AutoDock Vina: Improving the speed and accuracy of docking with a new scoring function, efficient optimization, and multithreading. J. Comput. Chem. 2010, 31, 455–461. [Google Scholar] [CrossRef]
- Eberhardt, J.; Santos-Martins, D.; Tillack, A.; Forli, S. AutoDock Vina 1.2.0: New Docking Methods, Expanded Force Field, and Python Bindings. J. Chem. Inf. Model. 2021, 61, 3891–3898. [Google Scholar] [CrossRef]
- Lauria, A.; Martorana, A.; La Monica, G.; Mannino, S.; Mannino, G.; Peri, D.; Gentile, C. In Silico Identification of Small Molecules as New Cdc25 Inhibitors through the Correlation between Chemosensitivity and Protein Expression Pattern. Int. J. Mol. Sci. 2021, 22, 3714. [Google Scholar] [CrossRef]
- Khan, M.; Nasr, F.; Baabbad, A.; Alqahtani, A.; Wadaan, M. Investigating the Anticancer Activity and Characterization of Bioactive Constituents of Moricandia sinaica (Boiss.) Boiss through In Vitro and In Silico Approaches in Triple-Negative Breast Cancer Cell Line. Appl. Sci. 2021, 11, 1244. [Google Scholar] [CrossRef]
- Deokar, S.; Shaikh, K. Exploring Cytotoxic Potential of Ciclopirox on Colorectal Cancer Cells by In-Silico Methodolo-gy. Biointerface Res. Appl. Chem. 2021, 12, 7287–7310. [Google Scholar]
- Bhat, S.; Nayek, U.; Bhattacharjee, H.; Abdul Ajees, A. In-silico studies on the protein-protein interactions between human Cdc25 and glutaredoxin. J. Comput. Methods Sci. Eng. 2017, 17, 235–242. [Google Scholar] [CrossRef]
- Tao, Y.; Hao, X.; Jing, L.; Sun, L.; Cherukupalli, S.; Liu, S.; Wu, G.; Xu, S.; Zhang, X.; Shi, X.; et al. Discovery of potent and selective Cdc25 phosphatase inhibitors via rapid assembly and in situ screening of Quinonoid-focused libraries. Bioorg. Chem. 2021, 115, 105254. [Google Scholar] [CrossRef]
- Kellenberger, E.; Hofmann, A.; Quinn, R. Similar interactions of natural products with biosynthetic enzymes and therapeutic targets could explain why nature produces such a large proportion of existing drugs. Nat. Prod. Rep. 2011, 28, 1483. [Google Scholar] [CrossRef]
- Evain-Bana, E.; Schiavo, L.; Bour, C.; Lanfranchi, D.; Berardozzi, S.; Ghirga, F.; Bagrel, D.; Botta, B.; Hanquet, G.; Mori, M. Synthesis, biological evaluation and molecular modeling studies on novel quinonoid inhibitors of CDC25 phosphatases. J. Enzyme Inhib. Med. Chem. 2017, 32, 113–118. [Google Scholar] [CrossRef] [PubMed]
- Sarkis, M.; Miteva, M.; Dasso Lang, M.; Jaouen, M.; Sari, M.-A.; Galcéra, M.-O.; Ethève-Quelquejeu, M.; Garbay, C.; Bertho, G.; Braud, E. Insights into the interaction of high potency inhibitor IRC-083864 with phosphatase CDC25. Proteins Struct. Funct. Bioinform. 2017, 85, 593–601. [Google Scholar] [CrossRef]
- Altowyan, M.; Barakat, A.; Al-Majid, A.; Al-Ghulikah, H. Spiroindolone analogues bearing benzofuran moiety as a selective cyclooxygenase COX-1 with TNF-α and IL-6 inhibitors. Saudi J. Biol. Sci. 2020, 27, 1208–1216. [Google Scholar] [CrossRef] [PubMed]
- Xu, S.; Peng, H.; Wang, N.; Zhao, M. Inhibition of TNF-α and IL-1 by compounds from selected plants for rheumatoid arthritis therapy: In vivo and in silico studies. Trop. J. Pharm. Res. 2018, 17, 277. [Google Scholar] [CrossRef]
- Kumar, P.; Krishnaswamy, G.; Desai, N.; Sreenivasa, S.; Kumar, D. Design, synthesis, PASS prediction, in-silico ADME and molecular docking studies of substituted-(Z)-3-benzylidine-5-aza-2-oxindole derivatives (Part-1). Chem. Data Collect. 2021, 31, 100617. [Google Scholar] [CrossRef]
- Upadhyay, N.; Tilekar, K.; Jänsch, N.; Schweipert, M.; Hess, J.; Henze Macias, L.; Mrowka, P.; Aguilera, R.; Choe, J.-Y.; Meyer-Almes, F.-J.; et al. Discovery of novel N-substituted thiazolidinediones (TZDs) as HDAC8 inhibitors: In-silico studies, synthesis, and biological evaluation. Bioorg. Chem. 2020, 100, 103934. [Google Scholar] [CrossRef] [PubMed]
- Schweipert, M.; Jänsch, N.; Upadhyay, N.; Tilekar, K.; Wozny, E.; Basheer, S.; Wurster, E.; Müller, M.; Ramaa, C.S.; Meyer-Almes, F.-J. Mechanistic Insights into Binding of Ligands with Thiazolidinedione Warhead to Human Histone Deacetylase 4. Pharmaceuticals 2021, 14, 1032. [Google Scholar] [CrossRef]
- Tilekar, K.; Hess, J.; Upadhyay, N.; Schweipert, M.; Flath, F.; Gutierrez, D.; Loiodice, F.; Lavecchia, A.; Meyer-Almes, F.J.; Aguilera, R.; et al. HDAC4 Inhibitors with Cyclic Linker and Non-hydroxamate Zinc Binding Group: Design, Synthesis, HDAC Screening and in vitro Cytotoxicity evaluation. ChemistrySelect 2021, 6, 6748–6763. [Google Scholar] [CrossRef]
- Cetin, A.; Bursal, E.; Türkan, F. 2-methylindole analogs as cholinesterases and glutathione S-transferase inhibitors: Synthesis, biological evaluation, molecular docking, and pharmacokinetic studies. Arab. J. Chem. 2021, 14, 103449. [Google Scholar] [CrossRef]
- Karaman, M. Molecular Insight of the Possible Inhibition Mechanism of Therapeutic Cephalosporin Derivatives against Human Glutathione Reductase Enzyme. Cumhur. Sci. J. 2020, 41, 747–755. [Google Scholar] [CrossRef]
- Beaufils, F.; Cmiljanovic, N.; Cmiljanovic, V.; Bohnacker, T.; Melone, A.; Marone, R.; Jackson, E.; Zhang, X.; Sele, A.; Borsari, C.; et al. 5-(4,6-Dimorpholino-1,3,5-triazin-2-yl)-4-(trifluoromethyl)pyridin-2-amine (PQR309), a Potent, Brain-Penetrant, Orally Bioavailable, Pan-Class I PI3K/mTOR Inhibitor as Clinical Candidate in Oncology. J. Med. Chem. 2017, 60, 7524–7538. [Google Scholar] [CrossRef] [PubMed]
- Ruiz-Torres, V.; Losada-Echeberría, M.; Herranz-López, M.; Barrajón-Catalán, E.; Galiano, V.; Micol, V.; Encinar, J. New Mammalian Target of Rapamycin (mTOR) Modulators Derived from Natural Product Databases and Marine Extracts by Using Molecular Docking Techniques. Mar. Drugs 2018, 16, 385. [Google Scholar] [CrossRef] [PubMed]
- Li, D.-D.; Meng, X.-F.; Wang, Q.; Yu, P.; Zhao, L.-G.; Zhang, Z.-P.; Wang, Z.-Z.; Xiao, W. Consensus scoring model for the molecular docking study of mTOR kinase inhibitor. J. Mol. Graphics Modell. 2018, 79, 81–87. [Google Scholar] [CrossRef] [PubMed]
- Kashyap, B.; Barge, S.; Bharadwaj, S.; Deka, B.; Rahman, S.; Ghosh, A.; Manna, P.; Dutta, P.; Sheikh, Y.; Kandimalla, R.; et al. Evaluation of therapeutic effect of Premna herbacea in diabetic rat and isoverbascoside against insulin resistance in L6 muscle cells through bioenergetics and stimulation of JNK and AKT/mTOR signaling cascade. Phytomedicine 2021, 93, 153761. [Google Scholar] [CrossRef]
- Gomha, S.; Riyadh, S.; Huwaimel, B.; Zayed, M.; Abdellattif, M. Synthesis, Molecular Docking Study, and Cytotoxic Activity against MCF Cells of New Thiazole–Thiophene Scaffolds. Molecules 2022, 27, 4639. [Google Scholar] [CrossRef]
- Suganya, V.; Anuradha, V. In silico molecular docking of astaxanthin and sorafenib with different apoptotic proteins involved in hepatocellular carcinoma. Biocatal. Agric. Biotechnol. 2019, 19, 101076. [Google Scholar] [CrossRef]
- El-Sawy, E.; Mandour, A.; Yahya, S.; Abo-Salem, H.; Ebaid, M. Synthesis, cytotoxic, proapoptotic evaluation, and molecular docking study of some new N-substituted sulfonyl-3-indolyl heterocycles. Egypt. Pharm. J. 2015, 14, 15. [Google Scholar] [CrossRef]
- Gowtham, H.; Ahmed, F.; Anandan, S.; Shivakumara, C.; Bilagi, A.; Pradeep, S.; Shivamallu, C.; Shati, A.; Alfaifi, M.; Elbehairi, S.; et al. In Silico Computational Studies of Bioactive Secondary Metabolites from Wedelia trilobata against Anti-Apoptotic B-Cell Lymphoma-2 (Bcl-2) Protein Associated with Cancer Cell Survival and Resistance. Molecules 2023, 28, 1588. [Google Scholar] [CrossRef]
- Lewkowicz, E.; Jayaraman, S.; Gursky, O. Protein Amyloid Cofactors: Charged Side-Chain Arrays Meet Their Match? Trends Biochem. Sci. 2021, 46, 626. [Google Scholar] [CrossRef]
- Abad-Zapatero, C. Ligand efficiency indices for effective drug discovery. Expert Opin. Drug Discov. 2007, 2, 469–488. [Google Scholar] [CrossRef]
- Abad-Zapatero, C.; Perišić, O.; Wass, J.; Bento, A.; Overington, J.; Al-Lazikani, B.; Johnson, M. Ligand efficiency indices for an effective mapping of chemico-biological space: The concept of an atlas-like representation. Drug Discov. Today 2010, 15, 804–811. [Google Scholar] [CrossRef] [PubMed]
- Reynolds, C.; Tounge, B.; Bembenek, S. Ligand Binding Efficiency: Trends, Physical Basis, and Implications. J. Med. Chem. 2008, 51, 2432–2438. [Google Scholar] [CrossRef] [PubMed]
- Cavalluzzi, M.; Mangiatordi, G.; Nicolotti, O.; Lentini, G. Ligand efficiency metrics in drug discovery: The pros and cons from a practical perspective. Expert Opin. Drug Discov. 2017, 12, 1087–1104. [Google Scholar] [CrossRef] [PubMed]
- Pan, Y.; Huang, N.; Cho, S.; Mackerell, A. Consideration of Molecular Weight during Compound Selection in Virtual Target-Based Database Screening. J. Chem. Inform. Comput. Sci. 2003, 43, 267–272. [Google Scholar] [CrossRef]
- Bakchi, B.; Krishna, A.; Sreecharan, E.; Ganesh, V.; Niharika, M.; Maharshi, S.; Puttagunta, S.; Sigalapalli, D.; Bhandare, R.; Shaik, A. An overview on applications of SwissADME web tool in the design and development of anticancer, antitubercular and antimicrobial agents: A medicinal chemist’s perspective. J. Mol. Struct. 1259, 1259, 132712. [Google Scholar] [CrossRef]
- Pires, D.; Blundell, T.; Ascher, D. pkCSM: Predicting Small-Molecule Pharmacokinetic and Toxicity Properties Using Graph-Based Signatures. J. Med. Chem. 2015, 58, 4066–4072. [Google Scholar] [CrossRef] [PubMed]


 | ||||||
|---|---|---|---|---|---|---|
| Compound | R | DU-145 | MCF-7 | T24 | HEK-293 | MSI |
| 1 | C5H11 | 60.89 ± 0.34 | 62.68 ± 0.53 | 86.69 ± 2.52 | 77.32 ± 3.66 | 1.1 |
| 2 | C9H19 | >100 | >100 | >100 | 79.76 ± 9.74 | 0.8 |
| 3 | C11H23 | >100 | >100 | >100 | >100 | 1.0 |
| 4 | Ph | 0.82 ± 0.10 | 5.16 ± 0.16 | 15.84 ± 0.90 | 45.18 ± 6.59 | 6.2 |
| 5 | 3-MeOPh | 10.22 ± 0.95 | 6.63 ± 0.13 | 11.96 ± 0.37 | 30.77 ± 4.07 | 3.2 |
| 6 | 4-MeOPh | 19.52 ± 0.95 | 11.84 ± 0.54 | 13.28 ± 0.44 | 38.93 ± 3.30 | 2.6 |
| 7 | 3,4-(OMe)2Ph | 11.90 ± 0.22 | 10.61 ± 0.27 | 15.15 ± 0.88 | 79.92 ± 10.41 | 6.4 |
| 8 | 3,4,5-(OMe)3Ph | 11.68 ± 0.29 | 4.88 ± 0.52 | 7.14 ± 0.20 | 37.41 ± 1.70 | 4.7 |
| 9 | 3-OMe-4-OHPh | 12.48 ± 0.55 | 5.81 ± 0.71 | 13.80 ± 1.87 | 47.73 ± 3.29 | 4.5 |
| 10 | 4-MePh | 11.11 ± 0.57 | 14.19 ± 0.53 | 21.48 ± 2.26 | 78.83 ± 5.53 | 5.0 |
| 11 | 2-Furyl | 5.45 ± 0.21 | 4.64 ± 0.23 | 11.71 ± 0.84 | >100 | 13.7 |
| 12 | 2-Thienyl | 6.97 ± 0.60 | 4.20 ± 0.06 | 11.72 ± 0.89 | 24.80 ± 1.41 | 3.3 |
| 13 | 3-Thienyl | 8.91 ± 0.82 | 6.37 ± 0.23 | 13.77 ± 0.58 | 20.38 ± 2.77 | 2.1 |
| 14 | 2-Pyrrolyl | 14.45 ± 0.25 | 10.71 ± 0.35 | 21.66 ± 0.22 | 13.66 ± 1.36 | 0.9 |
| DOX | 0.93 ± 0.06 | 0.33 ± 0.05 | 0.46 ± 0.08 | 4.27 ± 0.34 | 7.5 | |
 | ||||
|---|---|---|---|---|
| Product Nº | R | −EI½ (mV) a | ClogP b | CMR (cm3/mol) b |
| 1 | C5H11 | 475 | 2.73 | 9.96 |
| 2 | C9H19 | 480 | 4.40 | 11.81 |
| 3 | C11H23 | 484 | 5.23 | 12.74 |
| 4 | Ph | 695 | 2.62 | 10.15 |
| 5 | 3-MeOPh | 500 | 2.50 | 10.77 |
| 6 | 4-MeOPh | 800 | 2.50 | 10.77 |
| 7 | 3,4-(OMe)2Ph | 604 | 2.37 | 11.38 |
| 8 | 3,4,5-(OMe)3Ph | 690 | 2.25 | 12.00 |
| 9 | 3-OMe-4-OH-Ph | 595 | 2.11 | 10.92 |
| 10 | 4-MePh | 770 | 3.11 | 10.61 |
| 11 | 2-Furyl | 578 | 1.24 | 9.36 |
| 12 | 2-Thienyl | 552 | 2.61 | 9.96 |
| 13 | 3-Thienyl | 635 | 2.55 | 9.96 |
| 14 | 2-Pyrrolyl | 685 | 1.17 | 9.58 |
| Compound | ||||
|---|---|---|---|---|
| N° | 4 | 11 | ||
| Structure |  |  | ||
| Physicochemical parameters | MW (g/mol) | 353.37 | 343.33 | |
| ŋRot | 4 | 4 | ||
| HBA | 3 | 4 | ||
| HBD | 1 | 1 | ||
| TPSA | 63.24 | 76.38 | ||
| Pharmacokinetic parameters | Absorption | Caco2 permeability (log Papp in 10−6 cm/s) | 0.483 | 0.939 |
| Intestinal absorption (human) (%Absorbed) | 94.39 | 94.324 | ||
| Skin Permeability (log Kp) | −2.774 | −2.798 | ||
| Distribution | VDss (human) (log L/kg) | −0.105 | 0.013 | |
| BBB permeability (log BB) | 0.059 | −0.027 | ||
| CNS permeability (log PS) | −1.738 | −1.864 | ||
| Metabolism | CYP2D6 inhibitor | No | No | |
| CYP3A4 inhibitor | Yes | Yes | ||
| Excretion | Total Clearance (log mL/min/kg) | 0.138 | 0.138 | |
| Renal OCT2 substrate | No | No | ||
| Toxicity | Oral Rat Acute Toxicity (LD50) (mol/kg) | 2.704 | 2.779 | |
| Oral Rat Chronic Toxicity (log mg/kg_bw/day) | 1.762 | 1.44 | ||
| Hepatotoxicity | Yes | No | ||
| Drug likeness properties | Lipinski rule | Yes; 0 violation | Yes; 0 violation | |
| Bioavailability | 0.55 | 0.55 | ||
| Medicinal Chemistry | Brenk Alerts | Michael acceptor | Michael acceptor | |
| Gene Name | Gene Symbol | Relative Expression Levels (mRNA Levels) in DU145 Cells | ||
|---|---|---|---|---|
| Vehicle | Compound 4 | Compound 11 | ||
| Apoptosis regulator (Bcl2), transcript variant α | Bcl-2 | 1.00 ± 0.08 | 0.81 ± 0.05 | 0.78 ± 0.04 |
| Cell division cycle 25A | CDC25A | 1.00 ± 0.07 | 1.09 ± 0.10 | 0.90 ± 0.05 |
| Cellular communication network factor 2 | CCN2 | 1.00 ± 0.05 | 0.95 ± 0.03 | 0.95 ± 0.09 |
| Glutathione-disulfide reductase | GSR | 1.00 ± 0.07 | 0.95 ± 0.05 | 0.94 ± 0.06 |
| Histone deacetylase 4 | HDAC4 | 1.00 ± 0.07 | 0.91 ± 0.05 | 0.81 ± 0.07 |
| Mechanistic target of rapamycin kinase | mTOR | 1.00 ± 0.09 | 0.84 ± 0.06 | 0.72 ± 0.05 * |
| Tumor necrosis factor | TNF | 1.00 ± 0.10 | 1.20 ± 0.08 | 0.93 ± 0.08 |
| Tumor protein p53 | TP53 | 1.00 ± 0.07 | 0.94 ± 0.04 | 0.87 ± 0.05 |
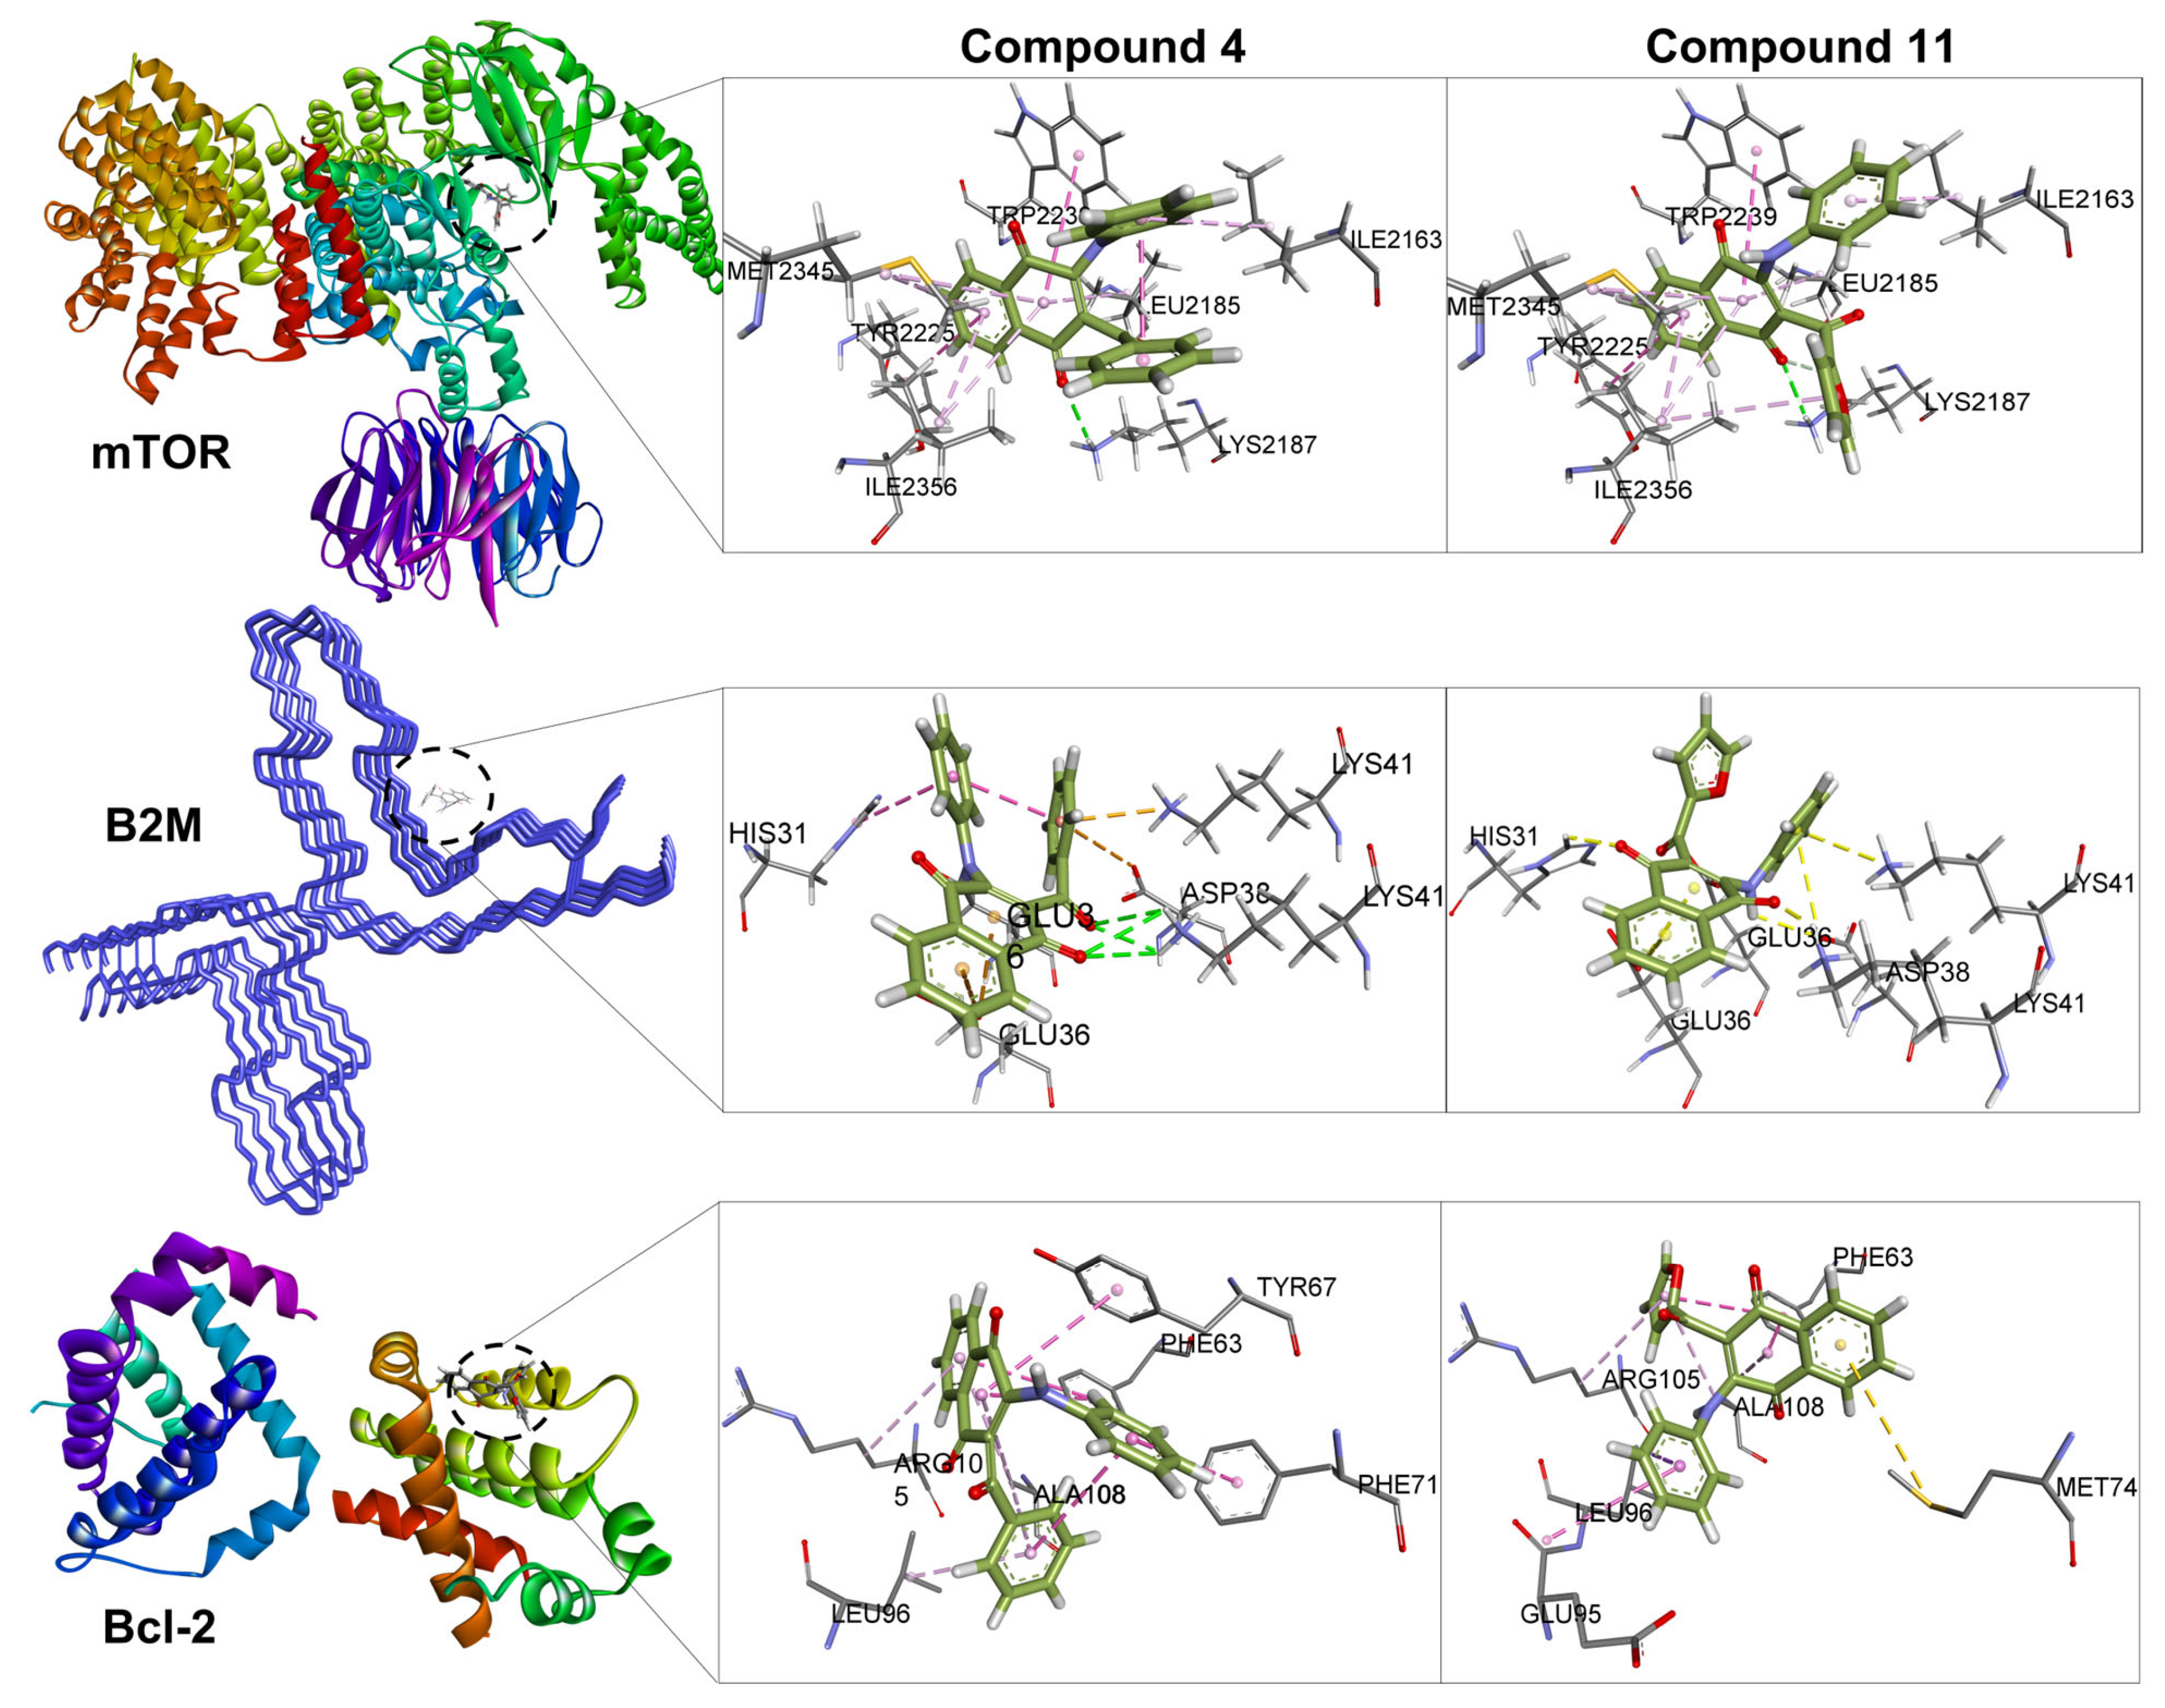
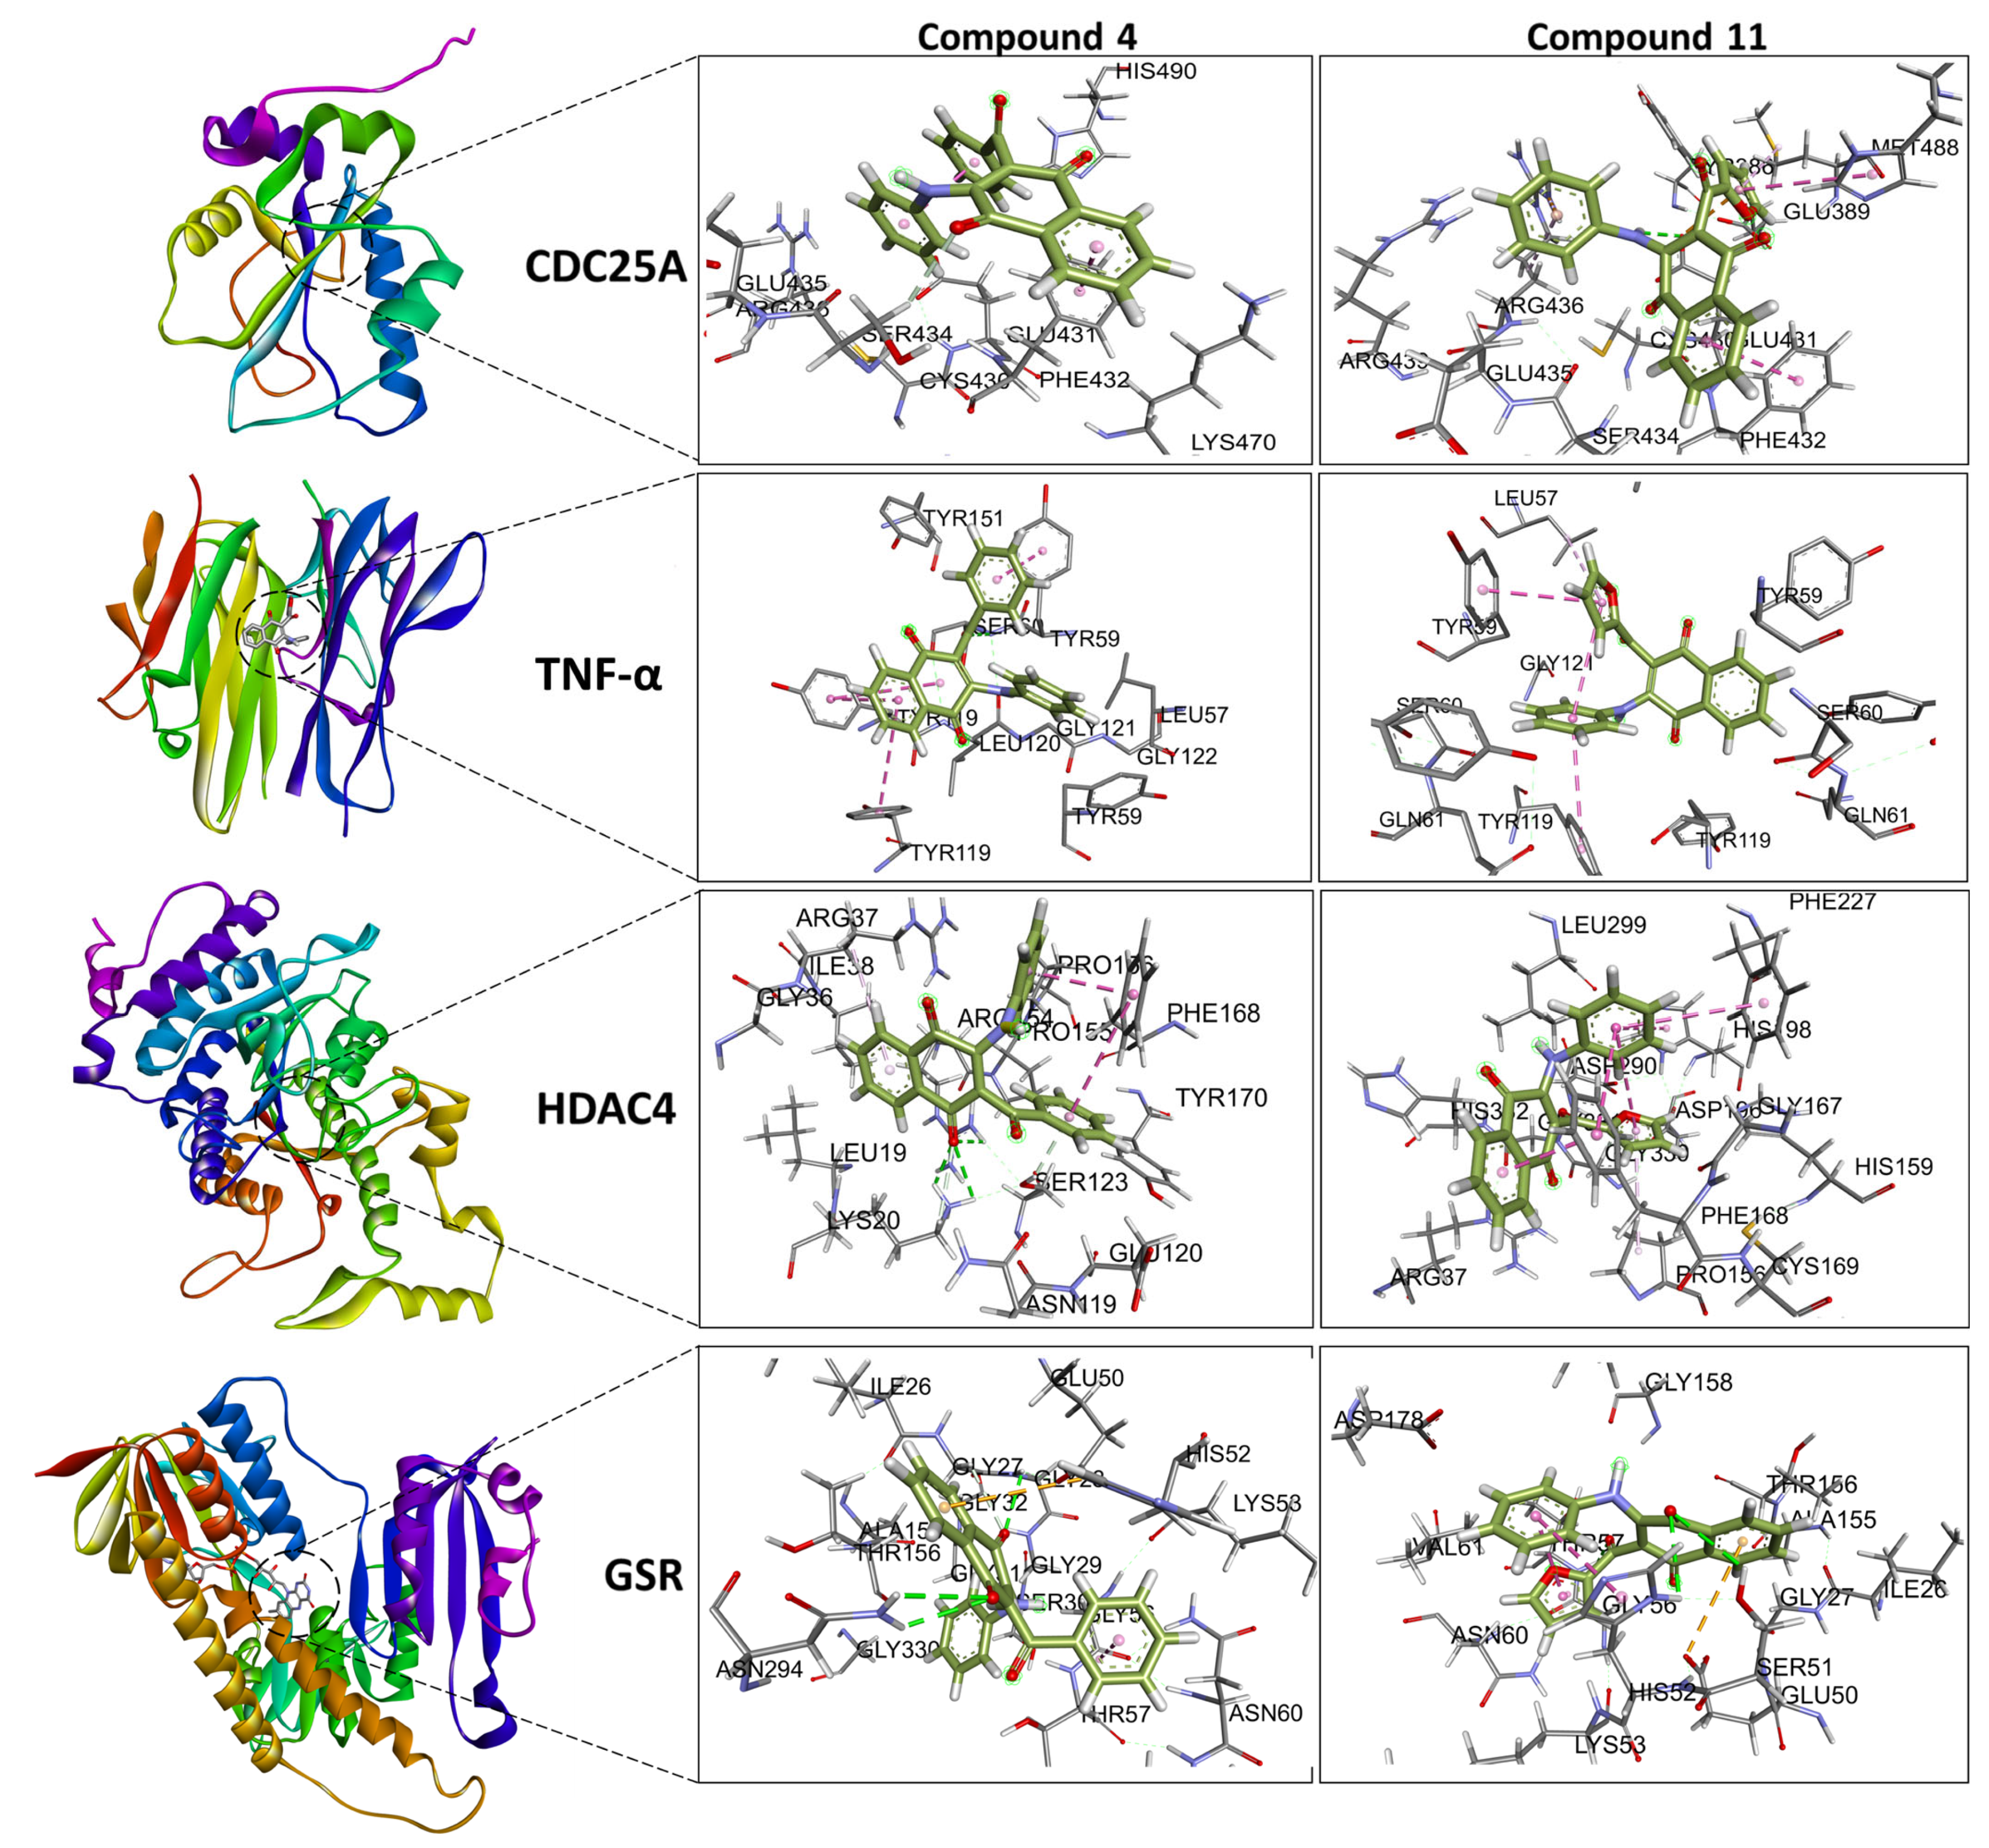
| Docking and Ligand Efficiency Analysis | ||||||
|---|---|---|---|---|---|---|
| Protein | PDBID | Molecule | ΔEbind (kcal/mol) | Kd | LE (kcal/mol) | ΔEMW (kcal/mol) |
| CDC25A | 1C25 | 4 | −5.2 | 1.5 × 10⁻⁴ | 0.19 | −1.0 |
| 11 | −5.9 | 4.7 × 10⁻⁵ | 0.23 | −1.2 | ||
| TNF-α | 2AZ5 | 4 | −9.1 | 2.1 × 10⁻⁷ | 0.34 | −1.8 |
| 11 | −8.4 | 6.9 × 10⁻⁷ | 0.32 | −1.6 | ||
| HDAC4 | 2VQJ | 4 | −8.6 | 5.0 × 10⁻⁷ | 0.32 | −1.7 |
| 11 | −8.2 | 9.8 × 10⁻⁷ | 0.32 | −1.6 | ||
| GSR | 3DK9 | 4 | −8.7 | 4.2 × 10⁻⁷ | 0.32 | −1.7 |
| 11 | −8.6 | 5.0 × 10⁻⁷ | 0.33 | −1.7 | ||
| mTOR | 4JSN | 4 | −7.7 | 2.3 × 10⁻⁶ | 0.29 | −1.5 |
| 11 | −8.0 | 1.4 × 10⁻⁶ | 0.31 | −1.6 | ||
| B2M | 6GK3 | 4 | −3.4 | 3.2 × 10⁻³ | 0.13 | −0.7 |
| 11 | −2.3 | 2.1 × 10⁻² | 0.09 | −0.5 | ||
| Bcl-2 | 6ZX7 | 4 | −6.9 | 8.8 × 10⁻⁶ | 0.26 | −1.3 |
| 11 | −6.7 | 1.2 × 10⁻⁵ | 0.26 | −1.3 | ||
| Protein | PDBID | Center Grid Box | Binding Site Reference | ||
|---|---|---|---|---|---|
| x | y | z | |||
| CDC25A | 1C25 | 7.26 | 38.60 | 64.43 | [76,77,78,79,80,81,82,83] |
| TNF-α | 2AZ5 | −19.40 | 74.65 | 33.84 | [36,58,59,60,62,84,85,86] |
| HDAC4 | 2VQJ | 19.33 | 77.30 | 37.91 | [co-crystallized ligand TFG], [87,88,89] |
| GSR | 3DK9 | 6.80 | 17.30 | 20.70 | [co-crystallized ligand FAD], [90,91] |
| mTOR | 4JSN | 55.48 | 2.38 | −46.53 | [92,93,94,95] |
| Bcl-2 | 2W3L | 39.80 | 26.93 | −12.41 | [co-crystallized ligand DRO], [96,97,98,99] |
| B2M | 6GK3 | 167.59 | 179.49 | 157.08 | [100] |
Disclaimer/Publisher’s Note: The statements, opinions and data contained in all publications are solely those of the individual author(s) and contributor(s) and not of MDPI and/or the editor(s). MDPI and/or the editor(s) disclaim responsibility for any injury to people or property resulting from any ideas, methods, instructions or products referred to in the content. |
© 2023 by the authors. Licensee MDPI, Basel, Switzerland. This article is an open access article distributed under the terms and conditions of the Creative Commons Attribution (CC BY) license (https://creativecommons.org/licenses/by/4.0/).
Share and Cite
Benites, J.; Valderrama, J.A.; Contreras, Á.; Enríquez, C.; Pino-Rios, R.; Yáñez, O.; Buc Calderon, P. Discovery of New 2-Phenylamino-3-acyl-1,4-naphthoquinones as Inhibitors of Cancer Cells Proliferation: Searching for Intra-Cellular Targets Playing a Role in Cancer Cells Survival. Molecules 2023, 28, 4323. https://doi.org/10.3390/molecules28114323
Benites J, Valderrama JA, Contreras Á, Enríquez C, Pino-Rios R, Yáñez O, Buc Calderon P. Discovery of New 2-Phenylamino-3-acyl-1,4-naphthoquinones as Inhibitors of Cancer Cells Proliferation: Searching for Intra-Cellular Targets Playing a Role in Cancer Cells Survival. Molecules. 2023; 28(11):4323. https://doi.org/10.3390/molecules28114323
Chicago/Turabian StyleBenites, Julio, Jaime A. Valderrama, Álvaro Contreras, Cinthya Enríquez, Ricardo Pino-Rios, Osvaldo Yáñez, and Pedro Buc Calderon. 2023. "Discovery of New 2-Phenylamino-3-acyl-1,4-naphthoquinones as Inhibitors of Cancer Cells Proliferation: Searching for Intra-Cellular Targets Playing a Role in Cancer Cells Survival" Molecules 28, no. 11: 4323. https://doi.org/10.3390/molecules28114323