
Riok1, A Novel Potential Target in MSI-High p53 Mutant Colorectal Cancer Cells

Abstract
:1. Introduction
2. Results
3. Materials and Methods
4. Discussion
Supplementary Materials
Author Contributions
Funding
Institutional Review Board Statement
Informed Consent Statement
Data Availability Statement
Conflicts of Interest
Sample Availability
References
- Keum, N.; Giovannucci, E. Global burden of colorectal cancer: Emerging trends, risk factors and prevention strategies. Nat. Rev. Gastroenterol. Hepatol. 2019, 16, 713–732. [Google Scholar] [CrossRef] [PubMed]
- Gelsomino, F.; Barbolini, M.; Spallanzani, A.; Pugliese, G.; Cascinu, S. The evolving role of microsatellite instability in colorectal cancer: A review. Cancer Treat. Rev. 2016, 51, 19–26. [Google Scholar] [CrossRef] [PubMed]
- Hsieh, P.; Zhang, Y. The Devil is in the details for DNA mismatch repair. Proc. Natl. Acad. Sci. USA 2017, 114, 3552–3554. [Google Scholar] [CrossRef]
- Uehara, T.; Ma, D.; Yao, Y.; Lynch, J.P.; Morales, K.; Ziober, A.; Feldman, M.; Ota, H.; Sepulveda, A.R.H. pylori Infection Is Associated with DNA Damage of Lgr5-Positive Epithelial Stem Cells in the Stomach of Patients with Gastric Cancer. Dig. Dis. Sci. 2013, 58, 140–149. [Google Scholar] [CrossRef] [PubMed]
- Cortes-Ciriano, I.; Lee, S.; Park, W.-Y.; Kim, T.-M.; Park, P.J. A molecular portrait of microsatellite instability across multiple cancers. Nat. Commun. 2017, 8, 15180. [Google Scholar] [CrossRef] [PubMed]
- Aaltonen, L.A.; Peltomäki, P.; Leach, F.S.; Sistonen, P.; Pylkkänen, L.; Mecklin, J.-P.; Järvinen, H.; Powell, S.M.; Jen, J.; Hamilton, S.R.; et al. Clues to the Pathogenesis of Familial Colorectal Cancer. Science 1993, 260, 812–816. [Google Scholar] [CrossRef]
- Peltomäki, P. Role of DNA Mismatch Repair Defects in the Pathogenesis of Human Cancer. J. Clin. Oncol. 2003, 21, 1174–1179. [Google Scholar] [CrossRef] [PubMed]
- Bonneville, R.; Krook, M.A.; Chen, H.-Z.; Smith, A.; Samorodnitsky, E.; Wing, M.R.; Reeser, J.W.; Roychowdhury, S. Detection of Microsatellite Instability Biomarkers via Next-Generation Sequencing. In Biomarkers for Immunotherapy of Cancer; Methods in Molecular Biology; Thurin, M., Cesano, A., Marincola, F., Eds.; Humana: New York, NY, USA, 2020. [Google Scholar]
- Pawlik, T.M.; Raut, C.P.; Rodriguez-Bigas, M.A. Colorectal Carcinogenesis: MSI-H Versus MSI-L. Dis. Markers 2004, 20, 199–206. [Google Scholar] [CrossRef]
- The Cancer Genome Atlas (TCGA) Research Network. Comprehensive molecular characterization of human colon and rectal cancer. Nature 2012, 487, 330–337. [Google Scholar] [CrossRef]
- Iacopetta, B. TP53 mutation in colorectal cancer. Hum. Mutat. 2003, 21, 271–276. [Google Scholar] [CrossRef]
- Michel, M.; Kaps, L.; Maderer, A.; Galle, P.R.; Moehler, M. The Role of p53 Dysfunction in Colorectal Cancer and Its Implication for Therapy. Cancers 2021, 13, 2296. [Google Scholar] [CrossRef] [PubMed]
- Liu, X.; Jakubowski, M.M.; Hunt, J.L. KRAS Gene Mutation in Colorectal Cancer Is Correlated With Increased Proliferation and Spontaneous Apoptosis. Am. J. Clin. Pathol. 2011, 135, 245–252. [Google Scholar] [CrossRef] [PubMed]
- Hadziavdić, V.; Pavlović-Calić, N.; Eminović, I. Microsatellite Instability and Loss of Heterozygosity of Tumor Suppressor Genes in Bosnian Patients with Sporadic Colorectal Cancer. Bosn. J. Basic Med. Sci. 2008, 8, 313–321. [Google Scholar] [CrossRef] [PubMed]
- Thibodeau, S.N.; Bren, G.; Schaid, D. Microsatellite Instability in Cancer of the Proximal Colon. Science 1993, 260, 816–819. [Google Scholar] [CrossRef] [PubMed]
- Tiong, K.-L.; Chang, K.-C.; Yeh, K.-T.; Liu, T.-Y.; Wu, J.-H.; Hsieh, P.-H.; Lin, S.-H.; Lai, W.-Y.; Hsu, Y.-C.; Chen, J.-Y.; et al. CSNK1E/CTNNB1 Are Synthetic Lethal To TP53 in Colorectal Cancer and Are Markers for Prognosis. Neoplasia 2014, 16, 441–450. [Google Scholar] [CrossRef]
- Zhao, Y.; Li, Y.; Sheng, J.; Wu, F.; Li, K.; Huang, R.; Wang, X.; Jiao, T.; Guan, X.; Lu, Y.; et al. P53-R273H mutation enhances colorectal cancer stemness through regulating specific lncRNAs. J. Exp. Clin. Cancer Res. 2019, 38, 379. [Google Scholar] [CrossRef]
- Rivlin, N.; Brosh, R.; Oren, M.; Rotter, V. Mutations in the p53 Tumor Suppressor Gene: Important Milestones at the Various Steps of Tumorigenesis. Genes Cancer 2011, 2, 466–474. [Google Scholar] [CrossRef]
- Ardito, F.; Giuliani, M.; Perrone, D.; Troiano, G.; Lo Muzio, L. The crucial role of protein phosphorylation in cell signaling and its use as targeted therapy (Review). Int. J. Mol. Med. 2017, 40, 271–280. [Google Scholar] [CrossRef]
- Kwon, Y.; Park, M.; Jang, M.; Yun, S.; Kim, W.K.; Kim, S.; Paik, S.; Lee, H.J.; Hong, S.; Kim, T.I.; et al. Prognosis of stage III colorectal carcinomas with FOLFOX adjuvant chemotherapy can be predicted by molecular subtype. Oncotarget 2017, 8, 39367–39381. [Google Scholar] [CrossRef]
- Sargent, D.J.; Marsoni, S.; Monges, G.; Thibodeau, S.N.; Labianca, R.; Hamilton, S.R.; French, A.J.; Kabat, B.; Foster, N.R.; Torri, V.; et al. Defective Mismatch Repair As a Predictive Marker for Lack of Efficacy of Fluorouracil-Based Adjuvant Therapy in Colon Cancer. J. Clin. Oncol. 2010, 28, 3219–3226. [Google Scholar] [CrossRef]
- Li, K.; Luo, H.; Huang, L.; Luo, H.; Zhu, X. Microsatellite instability: A review of what the oncologist should know. Cancer Cell Int. 2020, 20, 16. [Google Scholar] [CrossRef]
- Boland, C.R.; Goel, A. Microsatellite instability in colorectal cancer. Gastroenterology 2010, 138, 2073–2087.e3. [Google Scholar] [CrossRef] [PubMed]
- Weinberg, F.; Reischmann, N.; Fauth, L.; Taromi, S.; Mastroianni, J.; Köhler, M.; Halbach, S.; Becker, A.C.; Deng, N.; Schmitz, T.; et al. The Atypical Kinase RIOK1 Promotes Tumor Growth and Invasive Behavior. Ebiomedicine 2017, 20, 79–97. [Google Scholar] [CrossRef]
- Cho, Y.-H.; Ro, E.J.; Yoon, J.-S.; Mizutani, T.; Kang, D.-W.; Park, J.-C.; Kim, T.I.; Clevers, H.; Choi, K.-Y. 5-FU promotes stemness of colorectal cancer via p53-mediated WNT/β-catenin pathway activation. Nat. Commun. 2020, 11, 5321. [Google Scholar] [CrossRef]
- Liu, Y.; Bodmer, W.F. Analysis of P53 mutations and their expression in 56 colorectal cancer cell lines. Proc. Natl. Acad. Sci. USA 2006, 103, 976–981. [Google Scholar] [CrossRef]
- Mantovani, F.; Collavin, L.; Del Sal, G. Mutant p53 as a guardian of the cancer cell. Cell Death Differ. 2019, 26, 199–212. [Google Scholar] [CrossRef] [PubMed]
- Ferreira, A.; Pereira, F.; Reis, C.; Oliveira, M.J.; Sousa, M.J.; Preto, A. Crucial Role of Oncogenic KRAS Mutations in Apoptosis and Autophagy Regulation: Therapeutic Implications. Cells 2022, 11, 2183. [Google Scholar] [CrossRef]
- Frejno, M.; Meng, C.; Ruprecht, B.; Oellerich, T.; Scheich, S.; Kleigrewe, K.; Drecoll, E.; Samaras, P.; Hogrebe, A.; Helm, D.; et al. Proteome activity landscapes of tumor cell lines determine drug responses. Nat. Commun. 2020, 11, 3639. [Google Scholar] [CrossRef]
- Fabregat, A.; Korninger, F.; Viteri, G.; Sidiropoulos, K.; Marin-Garcia, P.; Ping, P.; Wu, G.; Stein, L.; D’eustachio, P.; Hermjakob, H. Reactome graph database: Efficient access to complex pathway data. PLoS Comput. Biol. 2018, 14, e1005968. [Google Scholar] [CrossRef] [PubMed]
- Fabregat, A.; Sidiropoulos, K.; Viteri, G.; Marin-Garcia, P.; Ping, P.; Stein, L.; D’eustachio, P.; Hermjakob, H. Reactome diagram viewer: Data structures and strategies to boost performance. Bioinformatics 2018, 34, 1208–1214. [Google Scholar] [CrossRef]
- Gillespie, M.B.; Jassal, R.; Stephan, M.; Milacic, K.; Rothfels, A.; Senff-Ribeiro, J.; Griss, C.; Sevilla, L.; Matthews, C.; Gong, C.; et al. The reactome pathway knowledgebase 2022. Nucleic Acids Res. 2022, 50, D687–D692. [Google Scholar] [CrossRef] [PubMed]
- Griss, J.; Viteri, G.; Sidiropoulos, K.; Nguyen, V.; Fabregat, A.; Hermjakob, H. ReactomeGSA—Efficient Multi-Omics Comparative Pathway Analysis. Mol. Cell. Proteom. 2020, 19, 2115–2125. [Google Scholar] [CrossRef]
- Jassal, B.; Matthews, L.; Viteri, G.; Gong, C.; Lorente, P.; Fabregat, A.; Sidiropoulos, K.; Cook, J.; Gillespie, M.; Haw, R.; et al. The reactome pathway knowledgebase. Nucleic Acids Res. 2020, 48, D498–D503. [Google Scholar] [CrossRef] [PubMed]
- Kanehisa, M. Toward understanding the origin and evolution of cellular organisms. Protein Sci. 2019, 28, 1947–1951. [Google Scholar] [CrossRef]
- Kanehisa, M.; Furumichi, M.; Sato, Y.; Ishiguro-Watanabe, M.; Tanabe, M. KEGG: Integrating viruses and cellular organisms. Nucleic Acids Res. 2021, 49, D545–D551. [Google Scholar] [CrossRef]
- Kanehisa, M.; Goto, S. KEGG: Kyoto Encyclopedia of Genes and Genomes. Nucleic Acids Res. 2000, 28, 27–30. [Google Scholar] [CrossRef]
- Sidiropoulos, K.; Viteri, G.; Sevilla, C.; Jupe, S.; Webber, M.; Orlic-Milacic, M.; Jassal, B.; May, B.; Shamovsky, V.; Duenas, C.; et al. Reactome enhanced pathway visualization. Bioinformatics 2017, 33, 3461–3467. [Google Scholar] [CrossRef]
- Subramanian, A.; Tamayo, P.; Mootha, V.K.; Mukherjee, S.; Ebert, B.L.; Gillette, M.A.; Paulovich, A.; Pomeroy, S.L.; Golub, T.R.; Lander, E.S.; et al. Gene set enrichment analysis: A knowledge-based approach for interpreting genome-wide expression profiles. Proc. Natl. Acad. Sci. USA 2005, 102, 15545–15550. [Google Scholar] [CrossRef]
- Schaefer, C.F.; Anthony, K.; Krupa, S.; Buchoff, J.; Day, M.; Hannay, T.; Buetow, K.H. PID: The Pathway Interaction Database. Nucleic Acids Res. 2009, 37, D674–D679. [Google Scholar] [CrossRef]
- Rouillard, A.D.; Gundersen, G.W.; Fernandez, N.F.; Wang, Z.; Monteiro, C.D.; McDermott, M.G.; Ma’Ayan, A. The harmonizome: A collection of processed datasets gathered to serve and mine knowledge about genes and proteins. Database 2016, 2016, baw100. [Google Scholar] [CrossRef] [PubMed]
- Llosa, N.J.; Cruise, M.; Tam, A.; Wicks, E.C.; Hechenbleikner, E.M.; Taube, J.M.; Blosser, R.L.; Fan, H.; Wang, H.; Luber, B.S.; et al. The Vigorous Immune Microenvironment of Microsatellite Instable Colon Cancer Is Balanced by Multiple Counter-Inhibitory Checkpoints. Cancer Discov. 2015, 5, 43–51. [Google Scholar] [CrossRef]
- Xiao, Y.; Freeman, G.J. The Microsatellite Instable Subset of Colorectal Cancer Is a Particularly Good Candidate for Checkpoint Blockade Immunotherapy. Cancer Discov. 2015, 5, 16–18. [Google Scholar] [CrossRef] [PubMed]
- Angelopoulou, K.; Stratis, M.; Diamandis, E.P. Humoral immune response against p53 protein in patients with colorectal car-cinoma. Int. J. Cancer 1997, 70, 46–51. [Google Scholar] [CrossRef]
- Chasov, V.; Zaripov, M.; Mirgayazova, R.; Khadiullina, R.; Zmievskaya, E.; Ganeeva, I.; Valiullina, A.; Rizvanov, A.; Bulatov, E. Promising New Tools for Targeting p53 Mutant Cancers: Humoral and Cell-Based Immunotherapies. Front. Immunol. 2021, 12, 707734. [Google Scholar] [CrossRef] [PubMed]
- Malekzadeh, P.; Pasetto, A.; Robbins, P.F.; Parkhurst, M.R.; Paria, B.C.; Jia, L.; Gartner, J.J.; Hill, V.; Yu, Z.; Restifo, N.P.; et al. Neoantigen screening identifies broad TP53 mutant immunogenicity in patients with epithelial cancers. J. Clin. Investig. 2019, 129, 1109–1114. [Google Scholar] [CrossRef]
- Blagih, J.; Buck, M.D.; Vousden, K.H. p53, cancer and the immune response. J. Cell Sci. 2020, 133, jcs237453. [Google Scholar] [CrossRef]
- Marjon, K.; Cameron, M.J.; Quang, P.; Clasquin, M.F.; Mandley, E.; Kunii, K.; McVay, M.; Choe, S.; Kernytsky, A.; Gross, S.; et al. MTAP Deletions in Cancer Create Vulnerability to Targeting of the MAT2A/PRMT5/RIOK1 Axis. Cell Rep. 2016, 15, 574–587. [Google Scholar] [CrossRef]
- Ciardiello, D.; Maiorano, B.; Martinelli, E. Targeting KRASG12C in colorectal cancer: The beginning of a new era. ESMO Open 2022, 8, 100745. [Google Scholar] [CrossRef]
- Ciardiello, F.; Ciardiello, D.; Martini, G.; Napolitano, S.; Tabernero, J.; Cervantes, A. Clinical management of metastatic colorectal cancer in the era of precision medicine. CA Cancer J. Clin. 2022, 72, 372–401. [Google Scholar] [CrossRef] [PubMed]
- Markowitz, S.; Wang, J.; Myeroff, L.; Parsons, R.; Sun, L.; Lutterbaugh, J.; Fan, R.S.; Zborowska, E.; Kinzler, K.W.; Vogelstein, B.; et al. Inactivation of the Type II TGF-β Receptor in Colon Cancer Cells with Microsatellite Instability. Science 1995, 268, 1336–1338. [Google Scholar] [CrossRef]
- Vilar, E.; Gruber, S.B. Microsatellite instability in colorectal cancer—The stable evidence. Nat. Rev. Clin. Oncol. 2010, 7, 153–162. [Google Scholar] [CrossRef] [PubMed]
- Vilar, E.; Mukherjee, B.; Kuick, R.; Raskin, L.; Misek, D.E.; Taylor, J.M.; Giordano, T.J.; Hanash, S.M.; Fearon, E.R.; Rennert, G.; et al. Gene Expression Patterns in Mismatch Repair-Deficient Colorectal Cancers Highlight the Potential Therapeutic Role of Inhibitors of the Phosphatidylinositol 3-Kinase-AKT-Mammalian Target of Rapamycin Pathway. Clin. Cancer Res. 2009, 15, 2829–2839. [Google Scholar] [CrossRef] [PubMed]
- Powell, S.M.; Zilz, N.; Beazer-Barclay, Y.; Bryan, T.M.; Hamilton, S.R.; Thibodeau, S.N.; Vogelstein, B.; Kinzler, K.W. APC mutations occur early during colorectal tumorigenesis. Nature 1992, 359, 235–237. [Google Scholar] [CrossRef] [PubMed]
- Luo, J.; Emanuele, M.J.; Li, D.; Creighton, C.J.; Schlabach, M.R.; Westbrook, T.F.; Wong, K.-K.; Elledge, S.J. A Genome-wide RNAi Screen Identifies Multiple Synthetic Lethal Interactions with the Ras Oncogene. Cell 2009, 137, 835–848. [Google Scholar] [CrossRef] [PubMed]
- Read, R.D.; Fenton, T.R.; Gomez, G.G.; Wykosky, J.; Vandenberg, S.R.; Babic, I.; Iwanami, A.; Yang, H.; Cavenee, W.K.; Mischel, P.S.; et al. A Kinome-Wide RNAi Screen in Drosophila Glia Reveals That the RIO Kinases Mediate Cell Proliferation and Survival through TORC2-Akt Signaling in Glioblastoma. PLoS Genet. 2013, 9, e1003253. [Google Scholar] [CrossRef]
- Roesch, A.; Vogt, T.; Stolz, W.; Dugas, M.; Landthaler, M.; Becker, B. Discrimination between gene expression patterns in the invasive margin and the tumour core of malignant melanomas. Melanoma Res. 2003, 13, 503–509. [Google Scholar] [CrossRef]
- Haug, S.; Schnerch, D.; Halbach, S.; Mastroianni, J.; Dumit, V.I.; Follo, M.; Hasenburg, A.; Köhler, M.; Dierbach, H.; Herzog, S.; et al. Metadherin exon 11 skipping variant enhances metastatic spread of ovarian cancer. Int. J. Cancer 2015, 136, 2328–2340. [Google Scholar] [CrossRef]
- Sarkar, D. AEG-1/MTDH/LYRIC in Liver Cancer. Adv. Cancer Res. 2013, 120, 193–221. [Google Scholar] [CrossRef]
- Burrows, C.; Latip, N.A.; Lam, S.-J.; Carpenter, L.; Sawicka, K.; Tzolovsky, G.; Gabra, H.; Bushell, M.; Glover, D.M.; Willis, A.E.; et al. The RNA binding protein Larp1 regulates cell division, apoptosis and cell migration. Nucleic Acids Res. 2010, 38, 5542–5553. [Google Scholar] [CrossRef]
- Essegian, D.; Khurana, R.; Stathias, V.; Schürer, S.C. The Clinical Kinase Index: A Method to Prioritize Understudied Kinases as Drug Targets for the Treatment of Cancer. Cell Rep. Med. 2020, 1, 100128. [Google Scholar] [CrossRef]
- Lim, H.; He, D.; Qiu, Y.; Krawczuk, P.; Sun, X.; Xie, L. Rational discovery of dual-indication multi-target PDE/Kinase inhibitor for precision anti-cancer therapy using structural systems pharmacology. PLoS Comput. Biol. 2019, 15, e1006619. [Google Scholar] [CrossRef]
- Chung, D.C. The genetic basis of colorectal cancer: Insights into critical pathways of tumorigenesis. Gastroenterology 2000, 119, 854–865. [Google Scholar] [CrossRef]
- Clark, K.J.; Cary, N.R.; Grace, A.A.; Metcalfe, J.C. Microsatellite Mutation of Type II Transforming Growth Factor-β Receptor Is Rare in Atherosclerotic Plaques. Arter. Thromb. Vasc. Biol. 2001, 21, 555–559. [Google Scholar] [CrossRef]
- Li, X.-L.; Zhou, J.; Chen, Z.-R.; Chng, W.-J. p53 mutations in colorectal cancer- molecular pathogenesis and pharmacological reactivation. World J. Gastroenterol. 2015, 21, 84–93. [Google Scholar] [CrossRef] [PubMed]
- Chen, Y.; Zhou, S.; Wan, K.; Yu, L.; Zhao, C.; Deng, H.; Ou, Q.; Qin, J.; Hu, J.; Hou, Z. RIOK1 mediates p53 degradation and radioresistance in colorectal cancer through phosphorylation of G3BP2. Oncogene 2022, 41, 3433–3444. [Google Scholar] [CrossRef]
- Weinberg, F.; Schulze, E.; Fatouros, C.; Schmidt, E.; Baumeister, R.; Brummer, T. Expression pattern and first functional characterization of riok-1 in Caenorhabditis elegans. Gene Expr. Patterns 2014, 15, 124–134. [Google Scholar] [CrossRef] [PubMed]
- Kiburu, I.N.; LaRonde-LeBlanc, N. Interaction of Rio1 Kinase with Toyocamycin Reveals a Conformational Switch That Controls Oligomeric State and Catalytic Activity. PLoS ONE 2012, 7, e37371. [Google Scholar] [CrossRef]
- Kubiński, K.; Masłyk, M. The Link between Protein Kinase CK2 and Atypical Kinase Rio1. Pharmaceuticals 2017, 10, 21. [Google Scholar] [CrossRef]
- Mielecki, M.; Krawiec, K.; Kiburu, I.; Grzelak, K.; Zagórski, W.; Kierdaszuk, B.; Kowa, K.; Fokt, I.; Szymanski, S.; Świerk, P.; et al. Development of novel molecular probes of the Rio1 atypical protein kinase. Biochim. Biophys. Acta 2013, 1834, 1292–1301. [Google Scholar] [CrossRef] [PubMed]
- Hörmann, A.; Hopfgartner, B.; Köcher, T.; Corcokovic, M.; Krammer, T.; Reiser, C.; Bader, G.; Shi, J.; Ehrenhöfer, K.; Wöhrle, S.; et al. RIOK1 kinase activity is required for cell survival irrespective of MTAP status. Oncotarget 2018, 9, 28625–28637. [Google Scholar] [CrossRef]
- McFall, T.; Stites, E.C. A mechanism for the response of KRASG13D expressing colorectal cancers to EGFR inhibitors. Mol. Cell. Oncol. 2020, 7, 1701914. [Google Scholar] [CrossRef]
- Briffa, R.; Um, I.; Faratian, D.; Zhou, Y.; Turnbull, A.K.; Langdon, S.P.; Harrison, D.J. Multi-Scale Genomic, Transcriptomic and Proteomic Analysis of Colorectal Cancer Cell Lines to Identify Novel Biomarkers. PLoS ONE 2015, 10, e0144708. [Google Scholar] [CrossRef]
- Brosh, R.; Rotter, V. When mutants gain new powers: News from the mutant p53 field. Nat. Rev. Cancer 2009, 9, 701–713. [Google Scholar] [CrossRef]
- Muller, P.A.; Vousden, K.H. Mutant p53 in Cancer: New Functions and Therapeutic Opportunities. Cancer Cell 2014, 25, 304–317. [Google Scholar] [CrossRef]
- Kim, D.; Xue, J.Y.; Lito, P. Targeting KRAS(G12C): From Inhibitory Mechanism to Modulation of Antitumor Effects in Patients. Cell 2020, 183, 850–859. [Google Scholar] [CrossRef] [PubMed]
- Debnath, J.; Brugge, J.S. Modelling glandular epithelial cancers in three-dimensional cultures. Nat. Rev. Cancer 2005, 5, 675–688. [Google Scholar] [CrossRef]
- Clarke, J.R.S.; Douglas, L.R.; Duriez, P.J.; Balourdas, D.-I.; Joerger, A.C.; Khadiullina, R.; Bulatov, E.; Baud, M.G.J. Discovery of Nanomolar-Affinity Pharmacological Chaperones Stabilizing the Oncogenic p53 Mutant Y220C. ACS Pharmacol. Transl. Sci. 2022, 5, 1169–1180. [Google Scholar] [CrossRef] [PubMed]
- Pelletier, J.; Thomas, G.; Volarević, S. Ribosome biogenesis in cancer: New players and therapeutic avenues. Nat. Rev. Cancer 2018, 18, 51–63. [Google Scholar] [CrossRef] [PubMed]
- D’Cruz, O.J.; Uckun, F.M. Protein kinase inhibitors against malignant lymphoma. Expert Opin. Pharmacother. 2013, 14, 707–721. [Google Scholar] [CrossRef] [PubMed]
- Berginski, M.E.; Moret, N.; Liu, C.; Goldfarb, D.; Sorger, P.K.; Gomez, S.M. The Dark Kinase Knowledgebase: An online compendium of knowledge and experimental results of understudied kinases. Nucleic Acids Res. 2021, 49, D529–D535. [Google Scholar] [CrossRef]
- Gyori, B.M.; Bachman, J.A.; Subramanian, K.; Muhlich, J.L.; Galescu, L.; Sorger, P.K. From word models to executable models of signaling networks using automated assembly. Mol. Syst. Biol. 2017, 13, 954. [Google Scholar] [CrossRef] [PubMed]


| Process Type | WT | MUT | χ2 | Significance |
|---|---|---|---|---|
| % Within WT | % Within MUT | |||
| (N = 485) | (N = 325) | |||
| Cell signaling | 0.0 (N = 0) | 1.5 (N = 5) | 7.51 | p < 0.01 |
| Cell-cycle checkpoint | 2.1 (N = 10) | 0.6 (N = 2) | 6.79 | p < 0.01 |
| DNA repair | 1.8 (N = 9) | 6.7 (N = 22) | 14.4 | p < 0.01 |
| Immune system | 13 (N = 63) | 21.8 (N = 71) | 11.06 | p < 0.01 |
| Metabolism of Proteins | 3.7 (N = 18) | 0.3 (N = 1) | 9.84 | p < 0.01 |
| Metabolism of RNA | 7.0 (N = 7) | 3.7 (N = 12) | 4 | p < 0.05 |
| Signal transduction | 5.2 (N = 25) | 1.5 (N = 5) | 7.14 | p < 0.01 |
| WNT signaling | 2.3 (N = 11) | 0.0 (N = 0) | 7.47 | p < 0.01 |
| Cell Type | TBK1 | RIOK1 | CHUK | CAMK1 |
|---|---|---|---|---|
| abundance (MSI-high-p53-Mut) | 0.81 | 0.81 | 0.78 | 0.57 |
| abundance (MSI-high-p53-WT) | 0.85 | 0.85 | 0.91 | 0.86 |
| abundance (MSS-p53-Mut) | 0.61 | 0.69 | 0.58 | 0.58 |
| abundance (MSS P53 WT) | 0.68 | 0.61 | 0.66 | 0.71 |
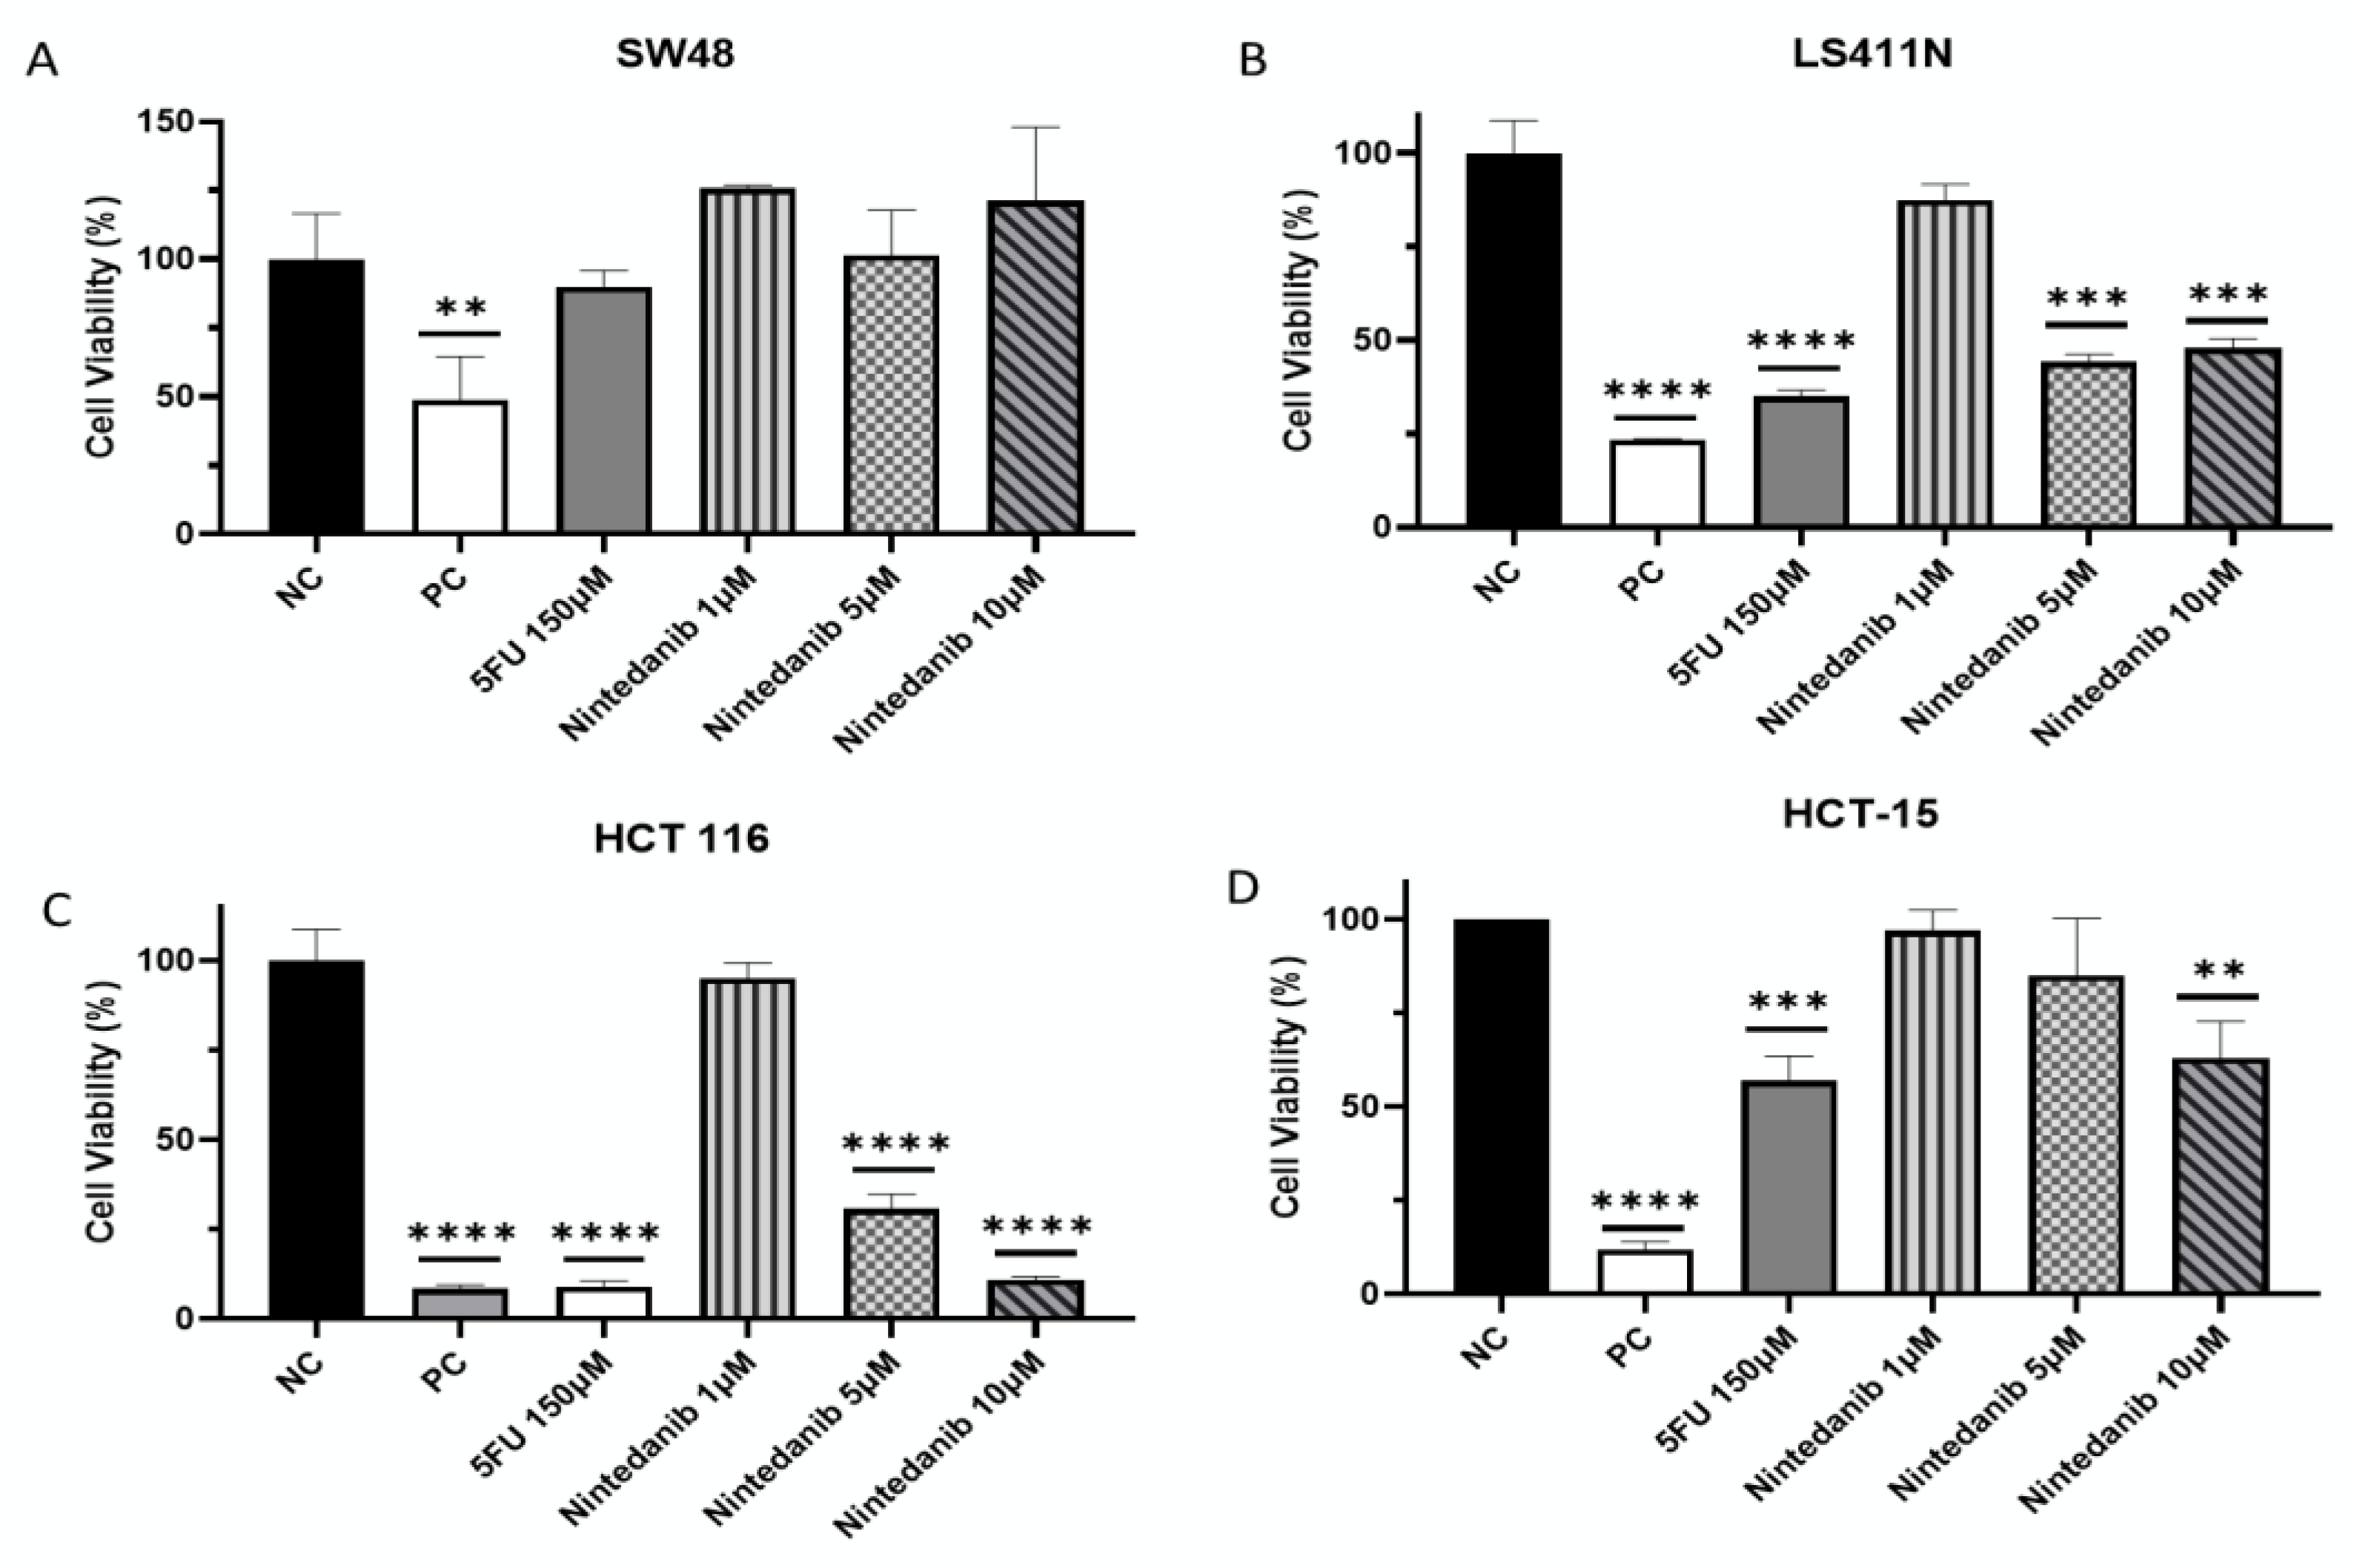
| Cell Line | p53 Status | KRAS Status | Toxicity |
|---|---|---|---|
| SW48 | WT | WT | - |
| LS411N | Mut | WT | 52% |
| HCT 116 | WT | Mut | 89% |
| HCT-15 | Mut | Mut | 37% |
Disclaimer/Publisher’s Note: The statements, opinions and data contained in all publications are solely those of the individual author(s) and contributor(s) and not of MDPI and/or the editor(s). MDPI and/or the editor(s) disclaim responsibility for any injury to people or property resulting from any ideas, methods, instructions or products referred to in the content. |
© 2023 by the authors. Licensee MDPI, Basel, Switzerland. This article is an open access article distributed under the terms and conditions of the Creative Commons Attribution (CC BY) license (https://creativecommons.org/licenses/by/4.0/).
Share and Cite
Shechter, S.; Ya’ar Bar, S.; Khattib, H.; Gage, M.J.; Avni, D. Riok1, A Novel Potential Target in MSI-High p53 Mutant Colorectal Cancer Cells. Molecules 2023, 28, 4452. https://doi.org/10.3390/molecules28114452
Shechter S, Ya’ar Bar S, Khattib H, Gage MJ, Avni D. Riok1, A Novel Potential Target in MSI-High p53 Mutant Colorectal Cancer Cells. Molecules. 2023; 28(11):4452. https://doi.org/10.3390/molecules28114452
Chicago/Turabian StyleShechter, Sharon, Sapir Ya’ar Bar, Hamdan Khattib, Matthew J. Gage, and Dorit Avni. 2023. "Riok1, A Novel Potential Target in MSI-High p53 Mutant Colorectal Cancer Cells" Molecules 28, no. 11: 4452. https://doi.org/10.3390/molecules28114452