
Physical Characteristics, Blue-Green Band Emission and Photocatalytic Activity of Au-Decorated ZnO Quantum Dots-Based Thick Films Prepared Using the Doctor Blade Technique
 ,
,
Abstract
:1. Introduction
2. Results and Discussion
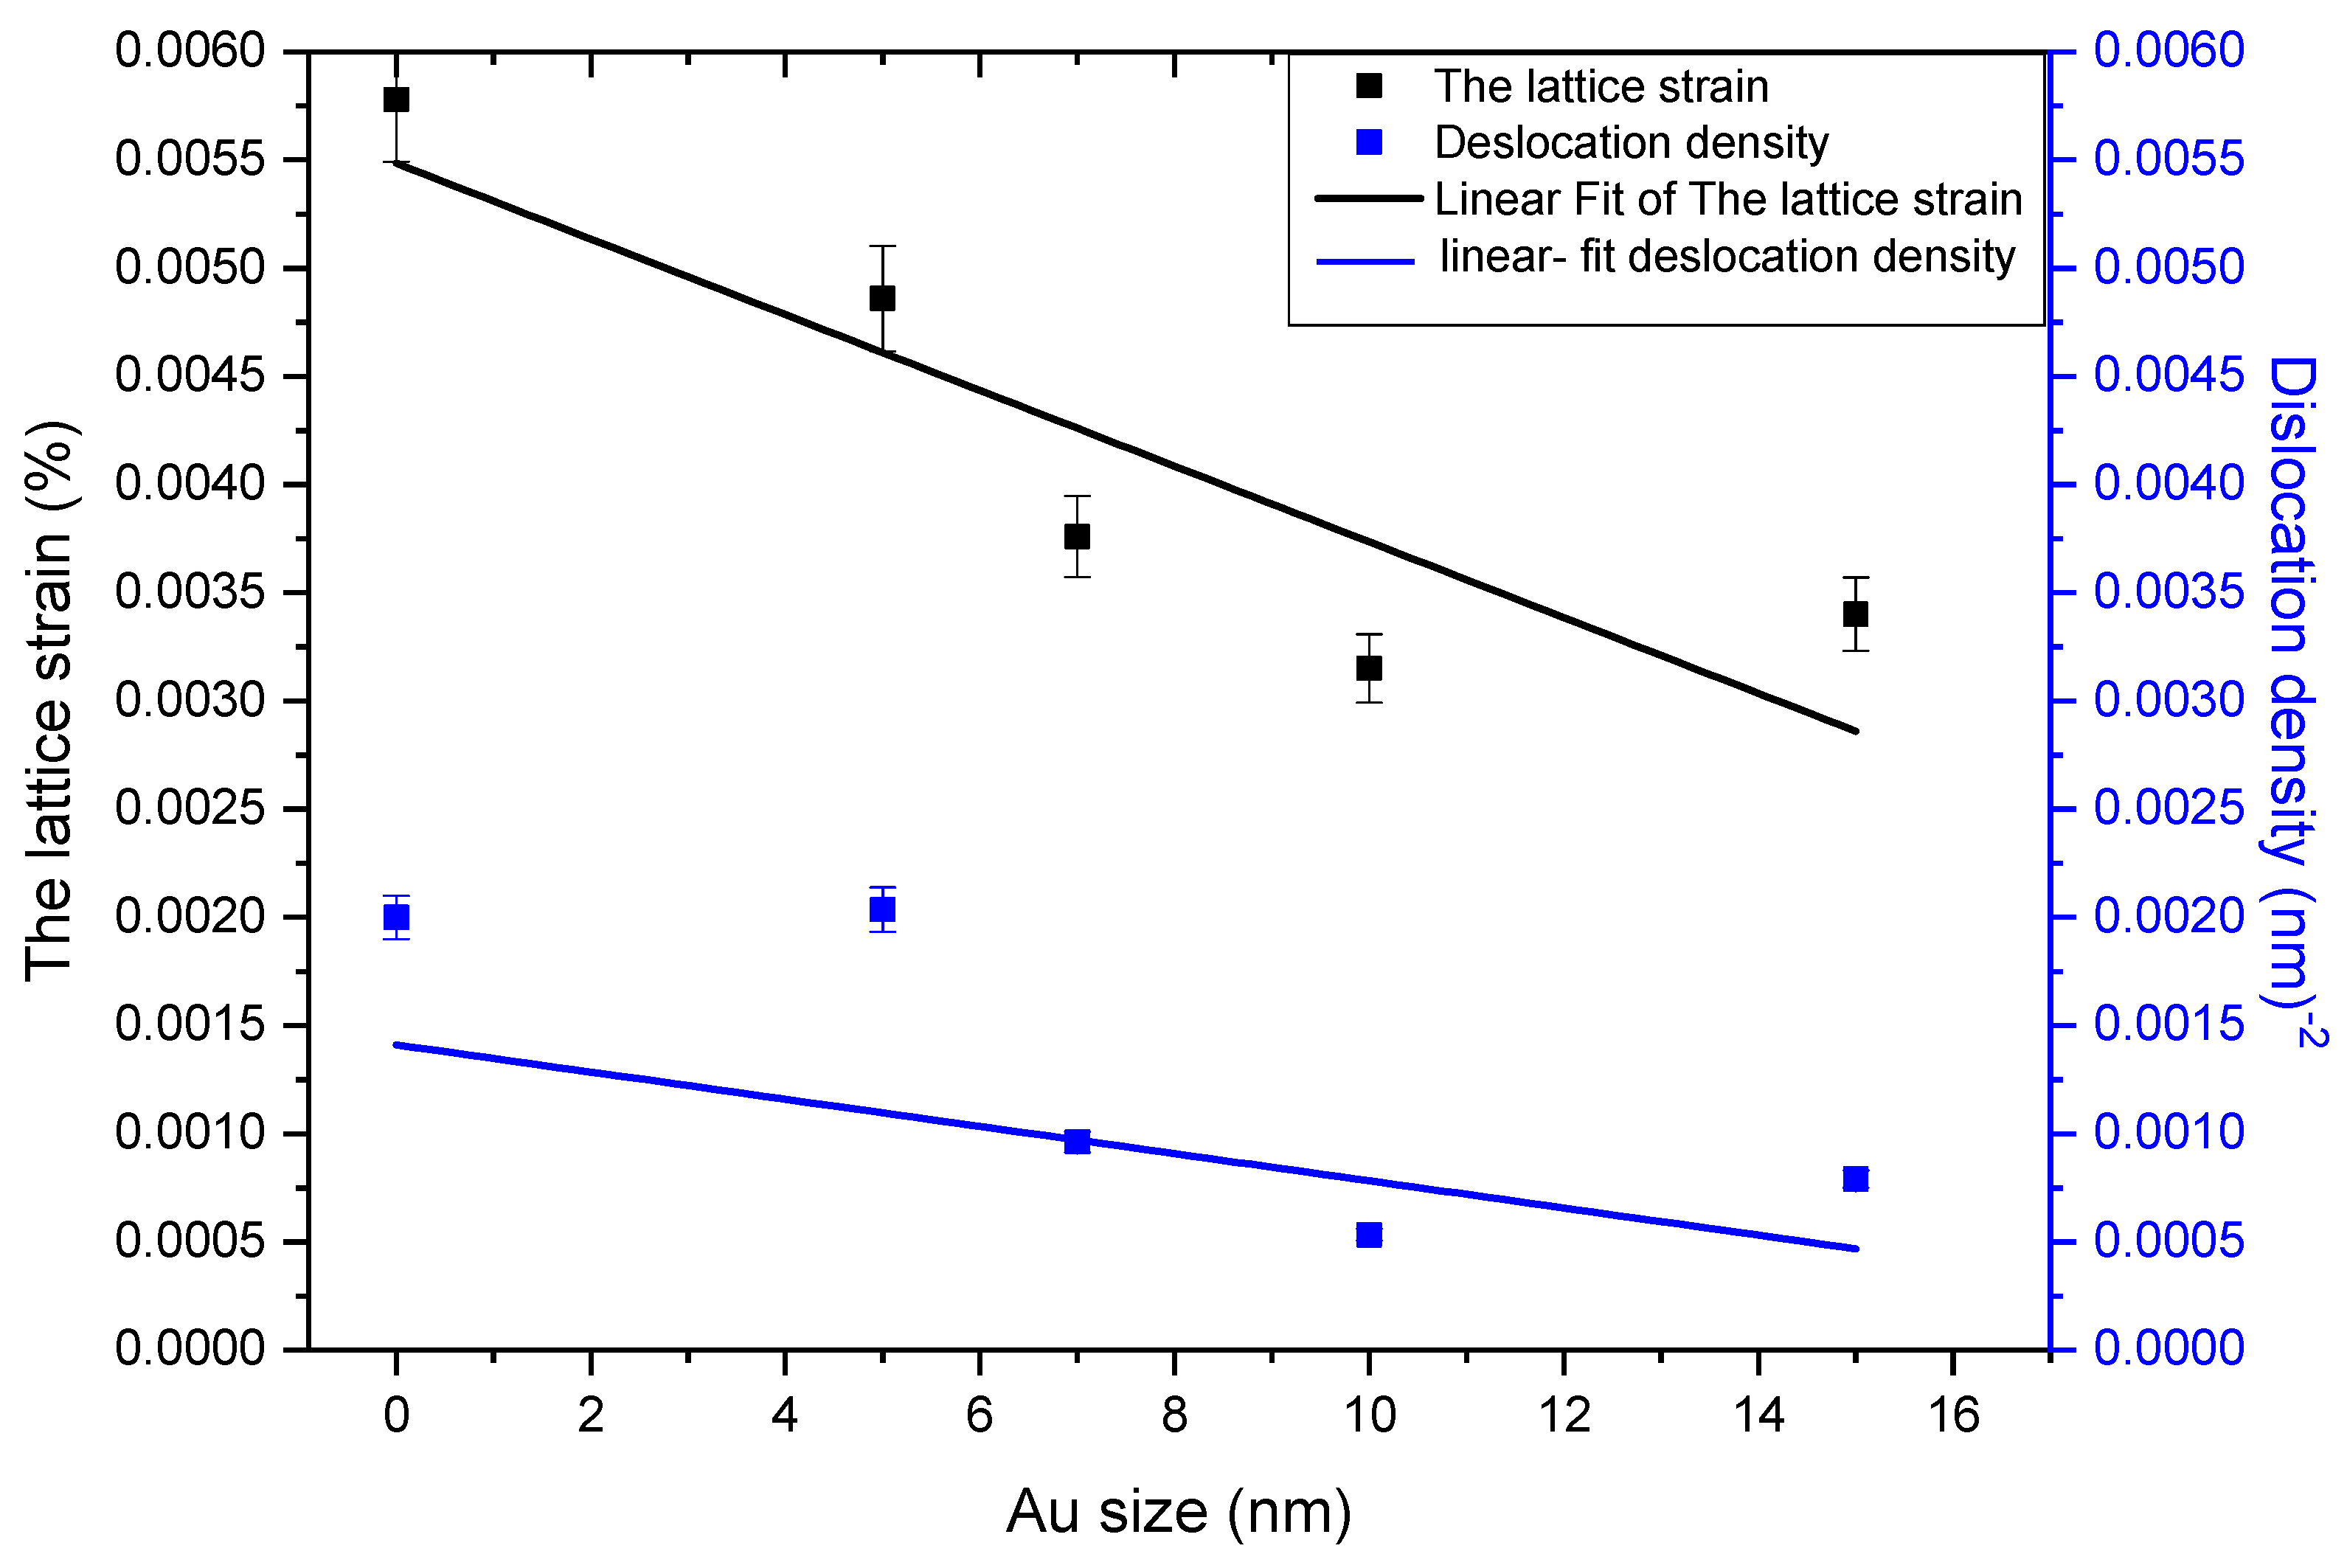
2.1. X-ray Diffraction Study
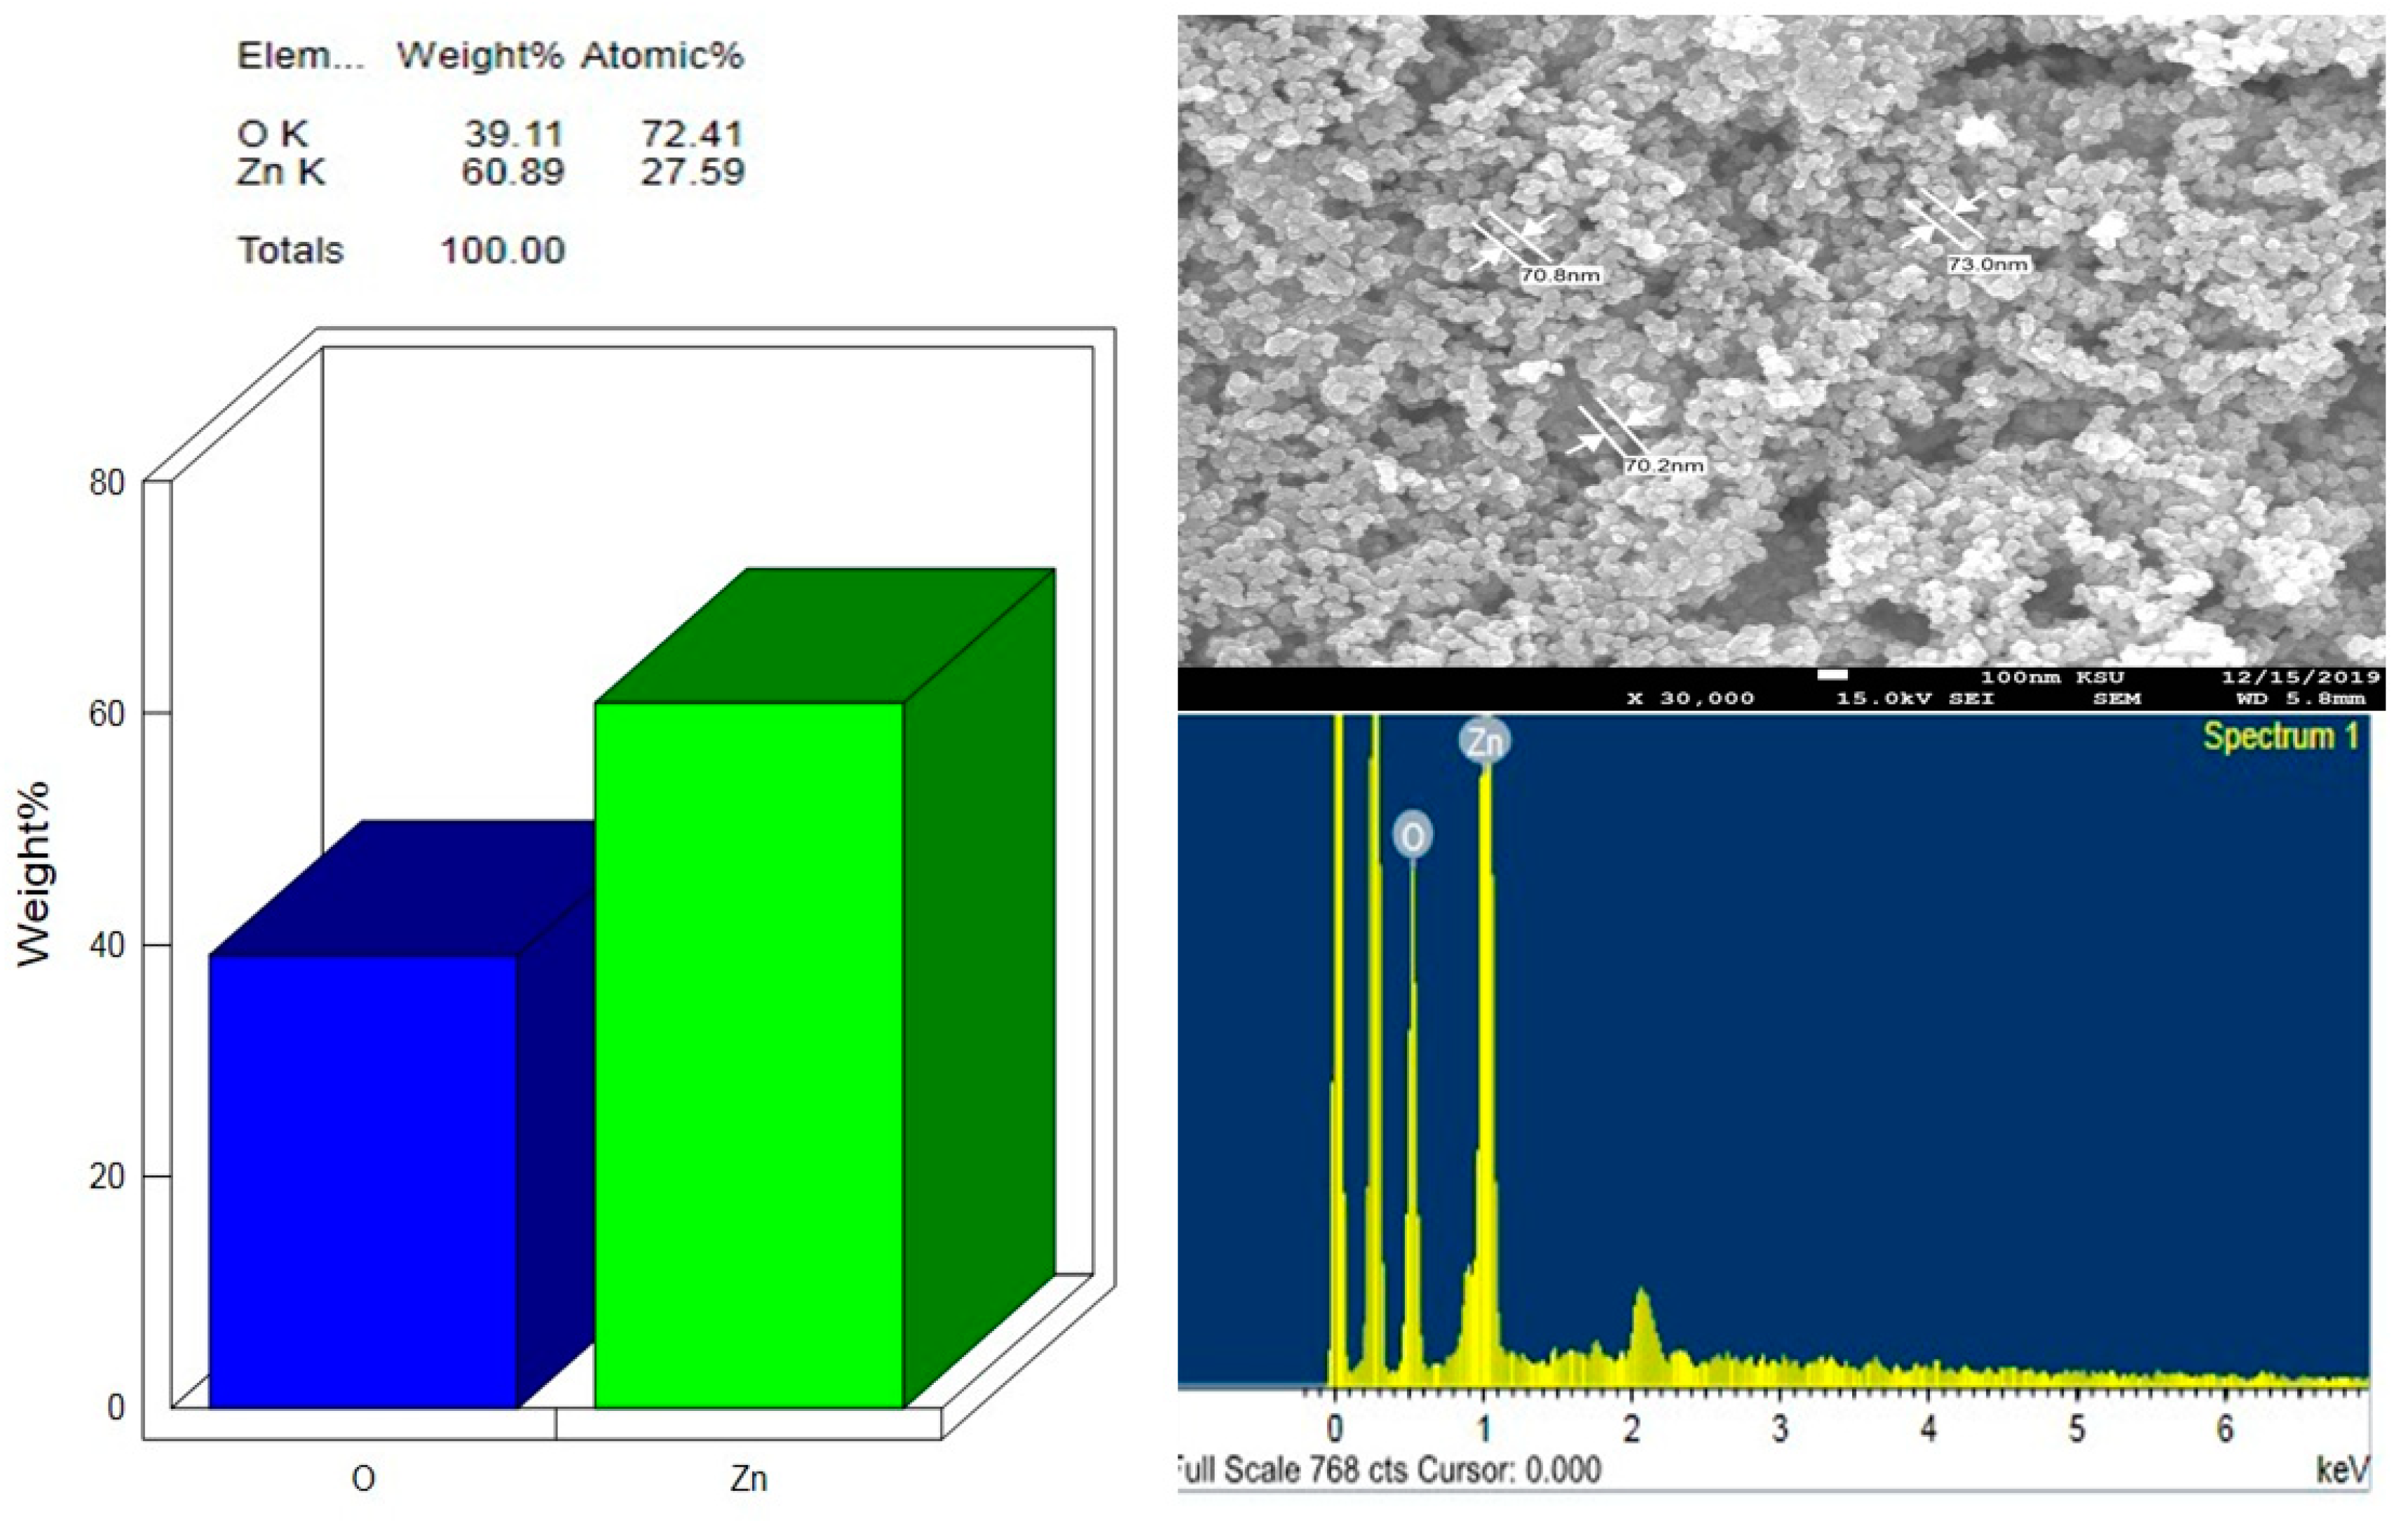
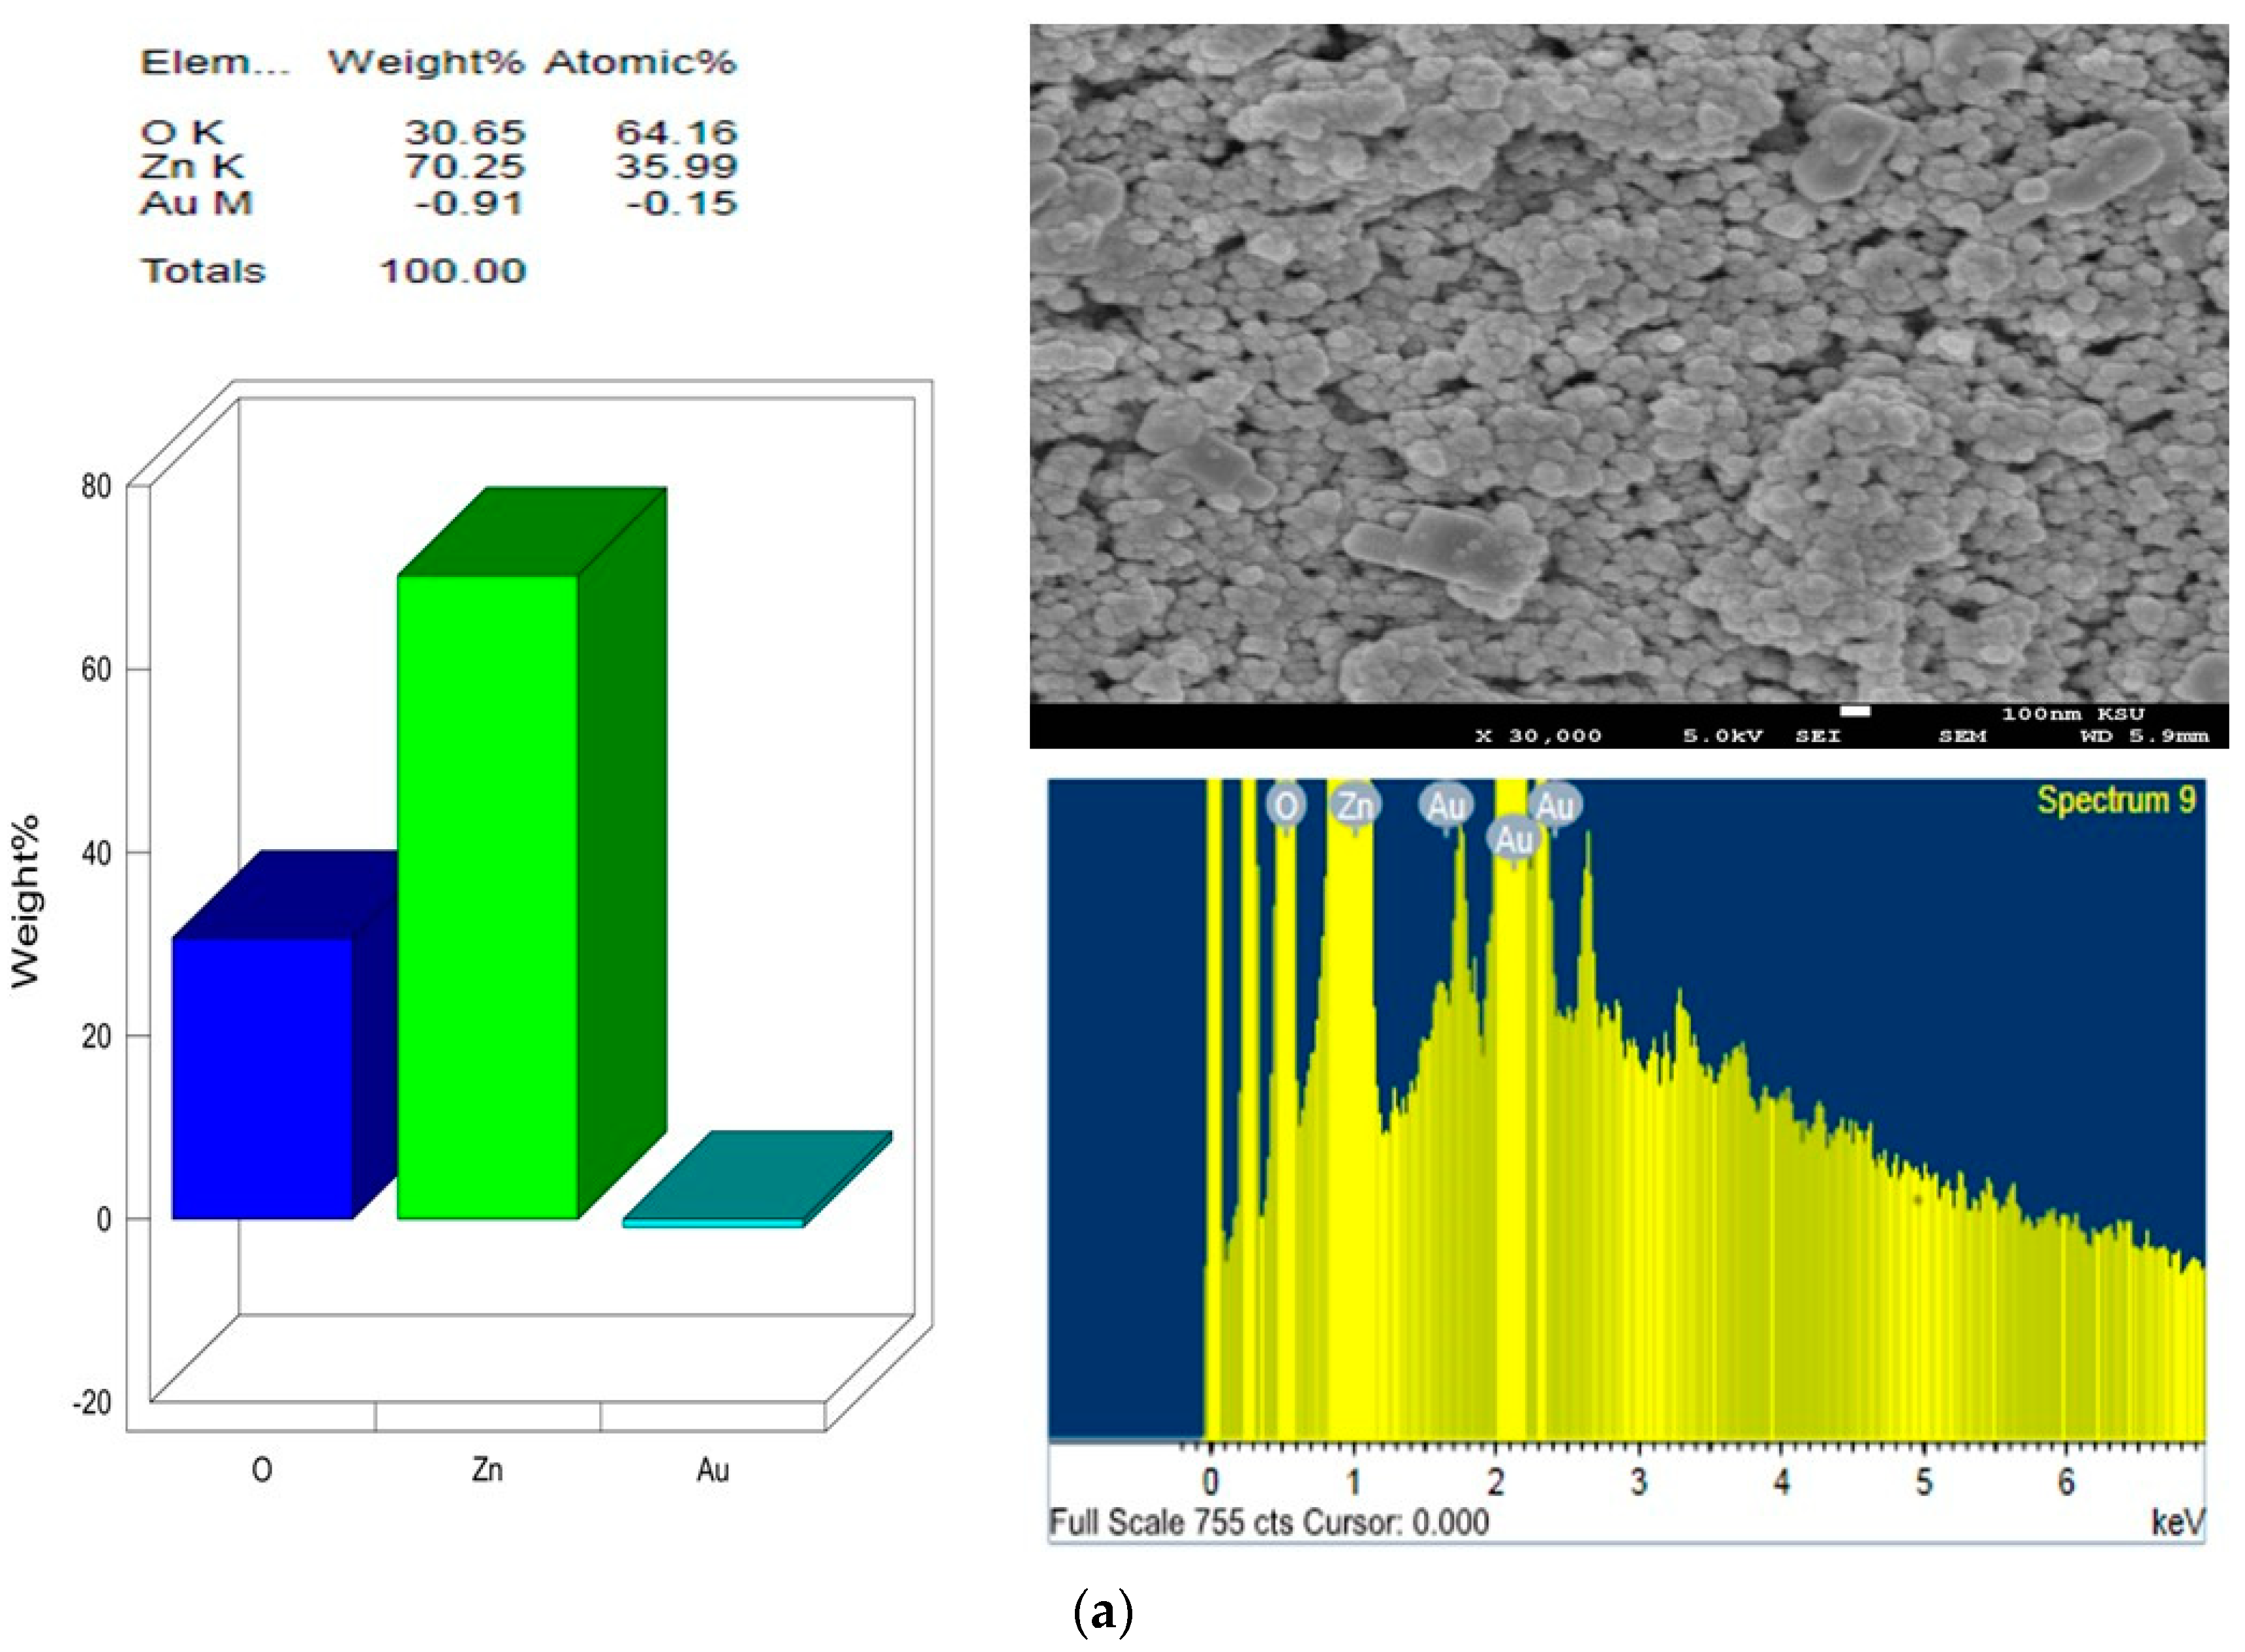
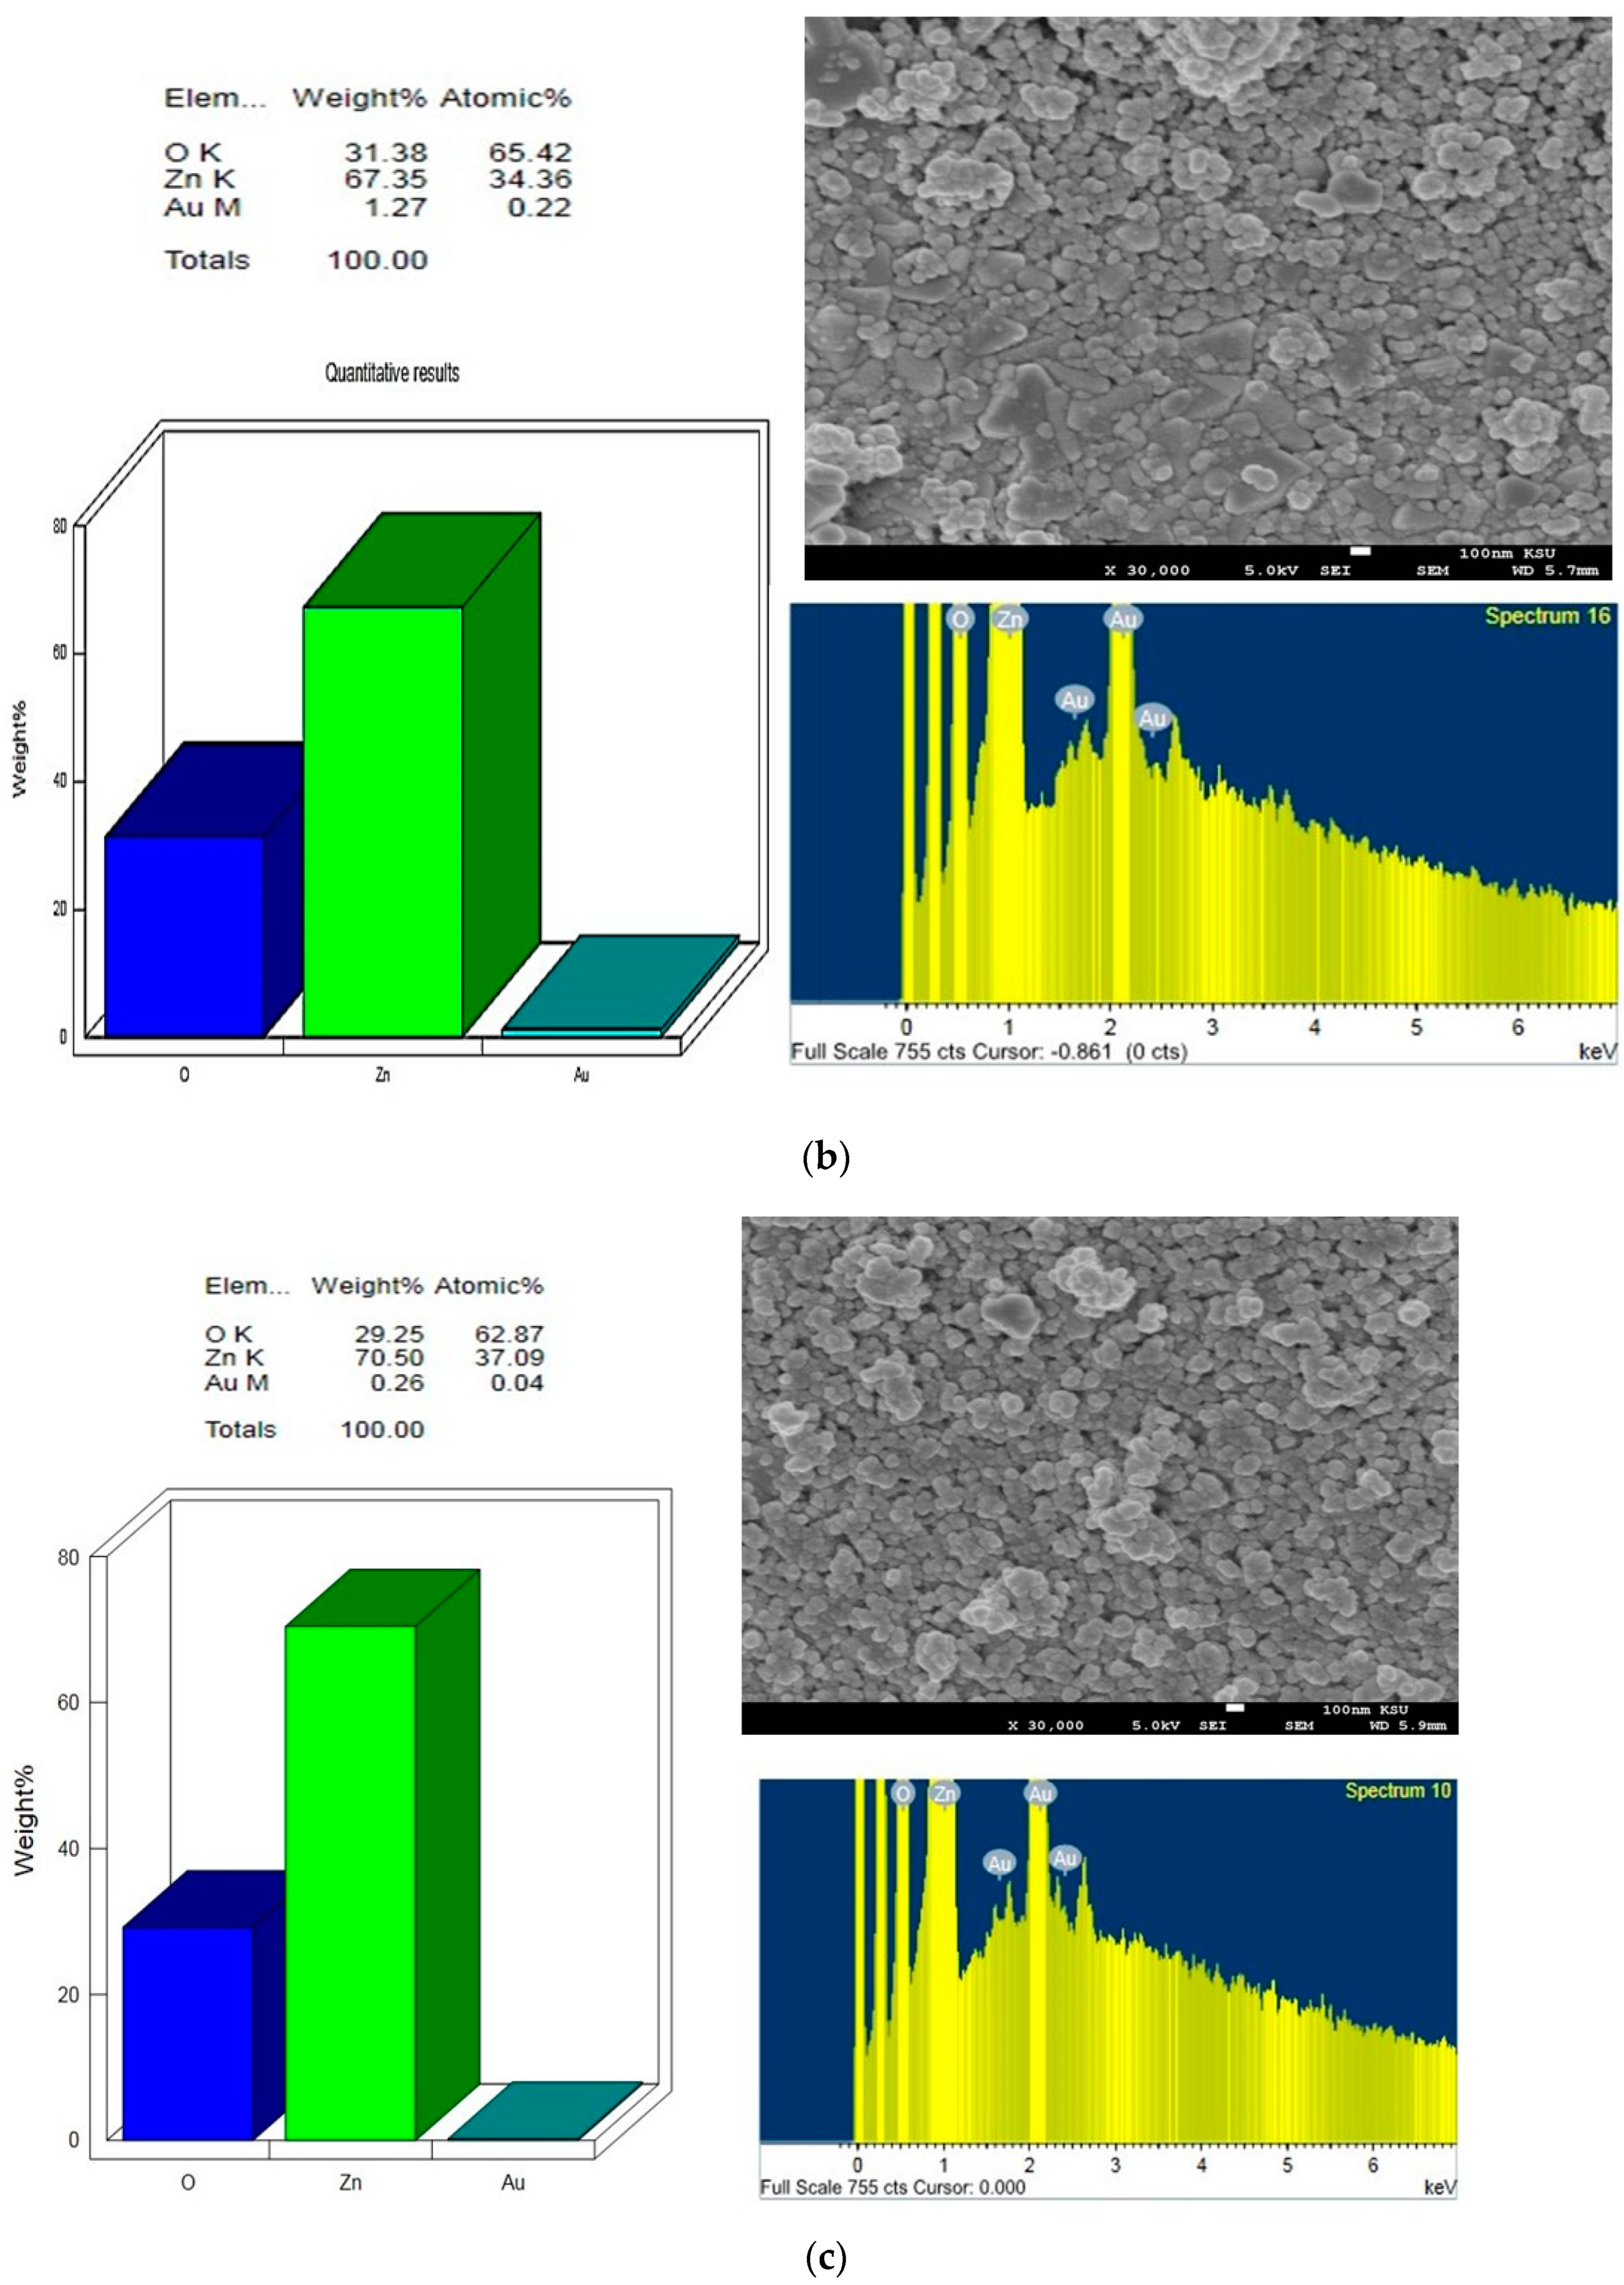
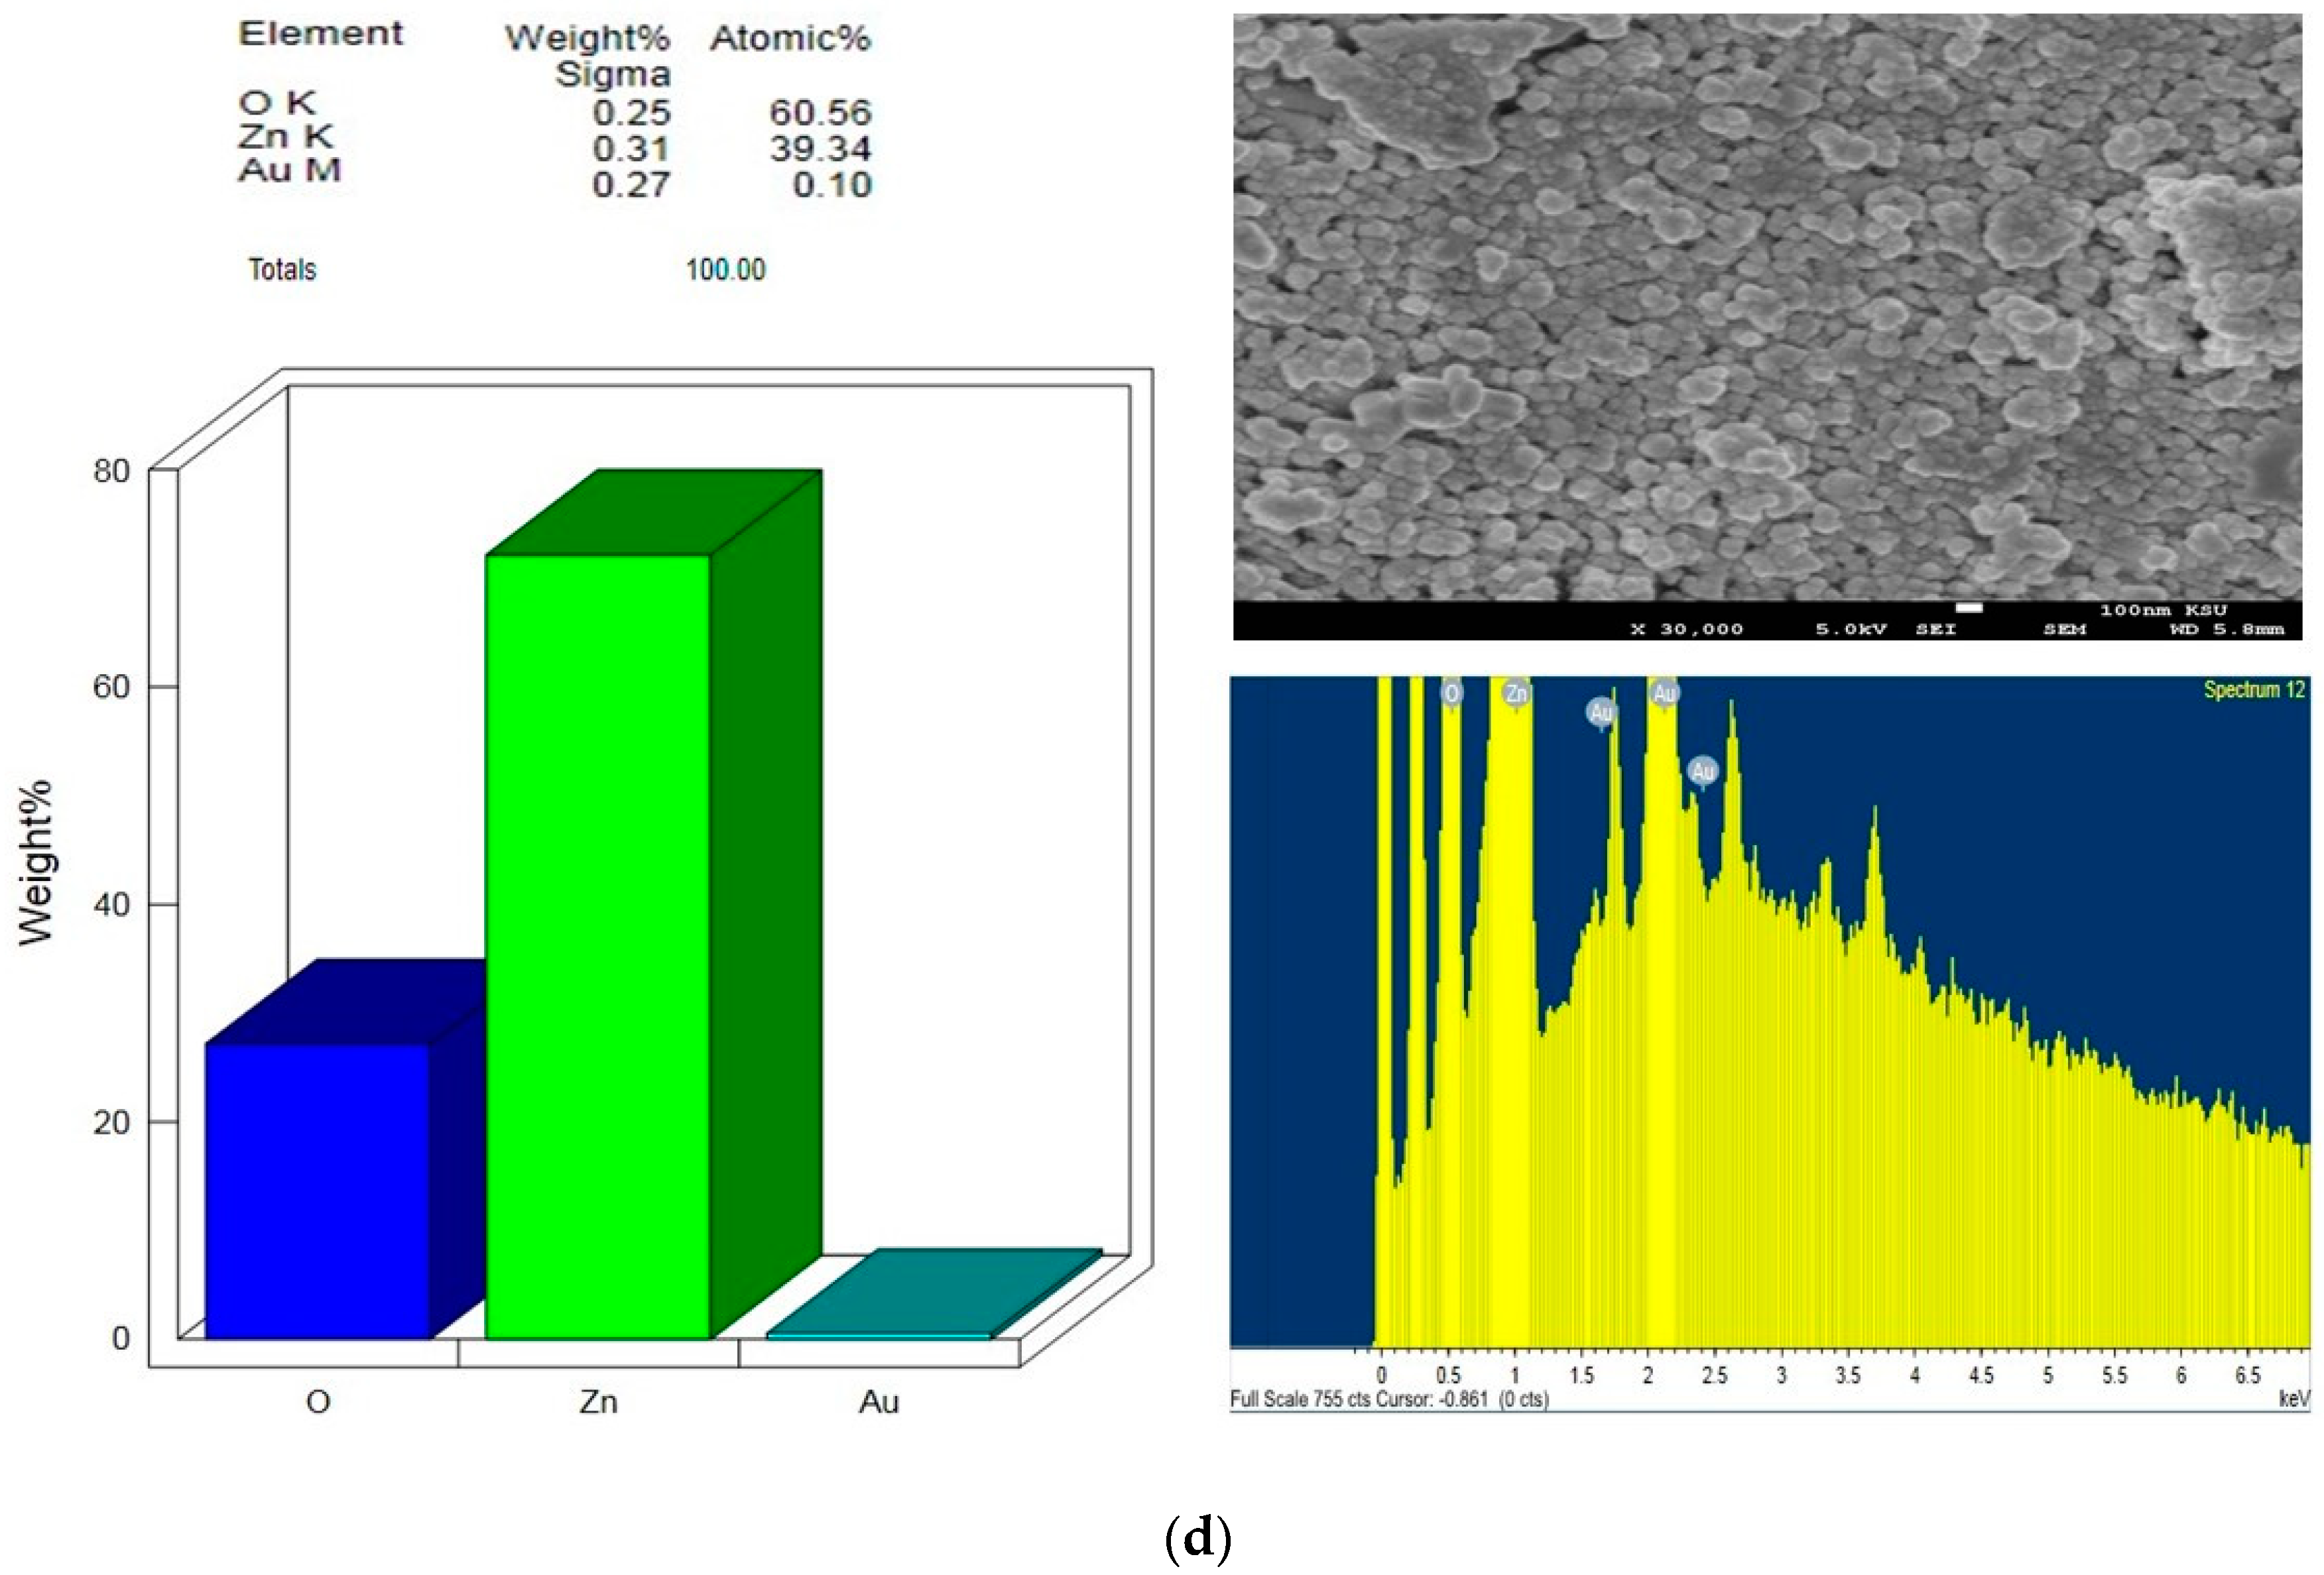
2.2. FESEM and EDS
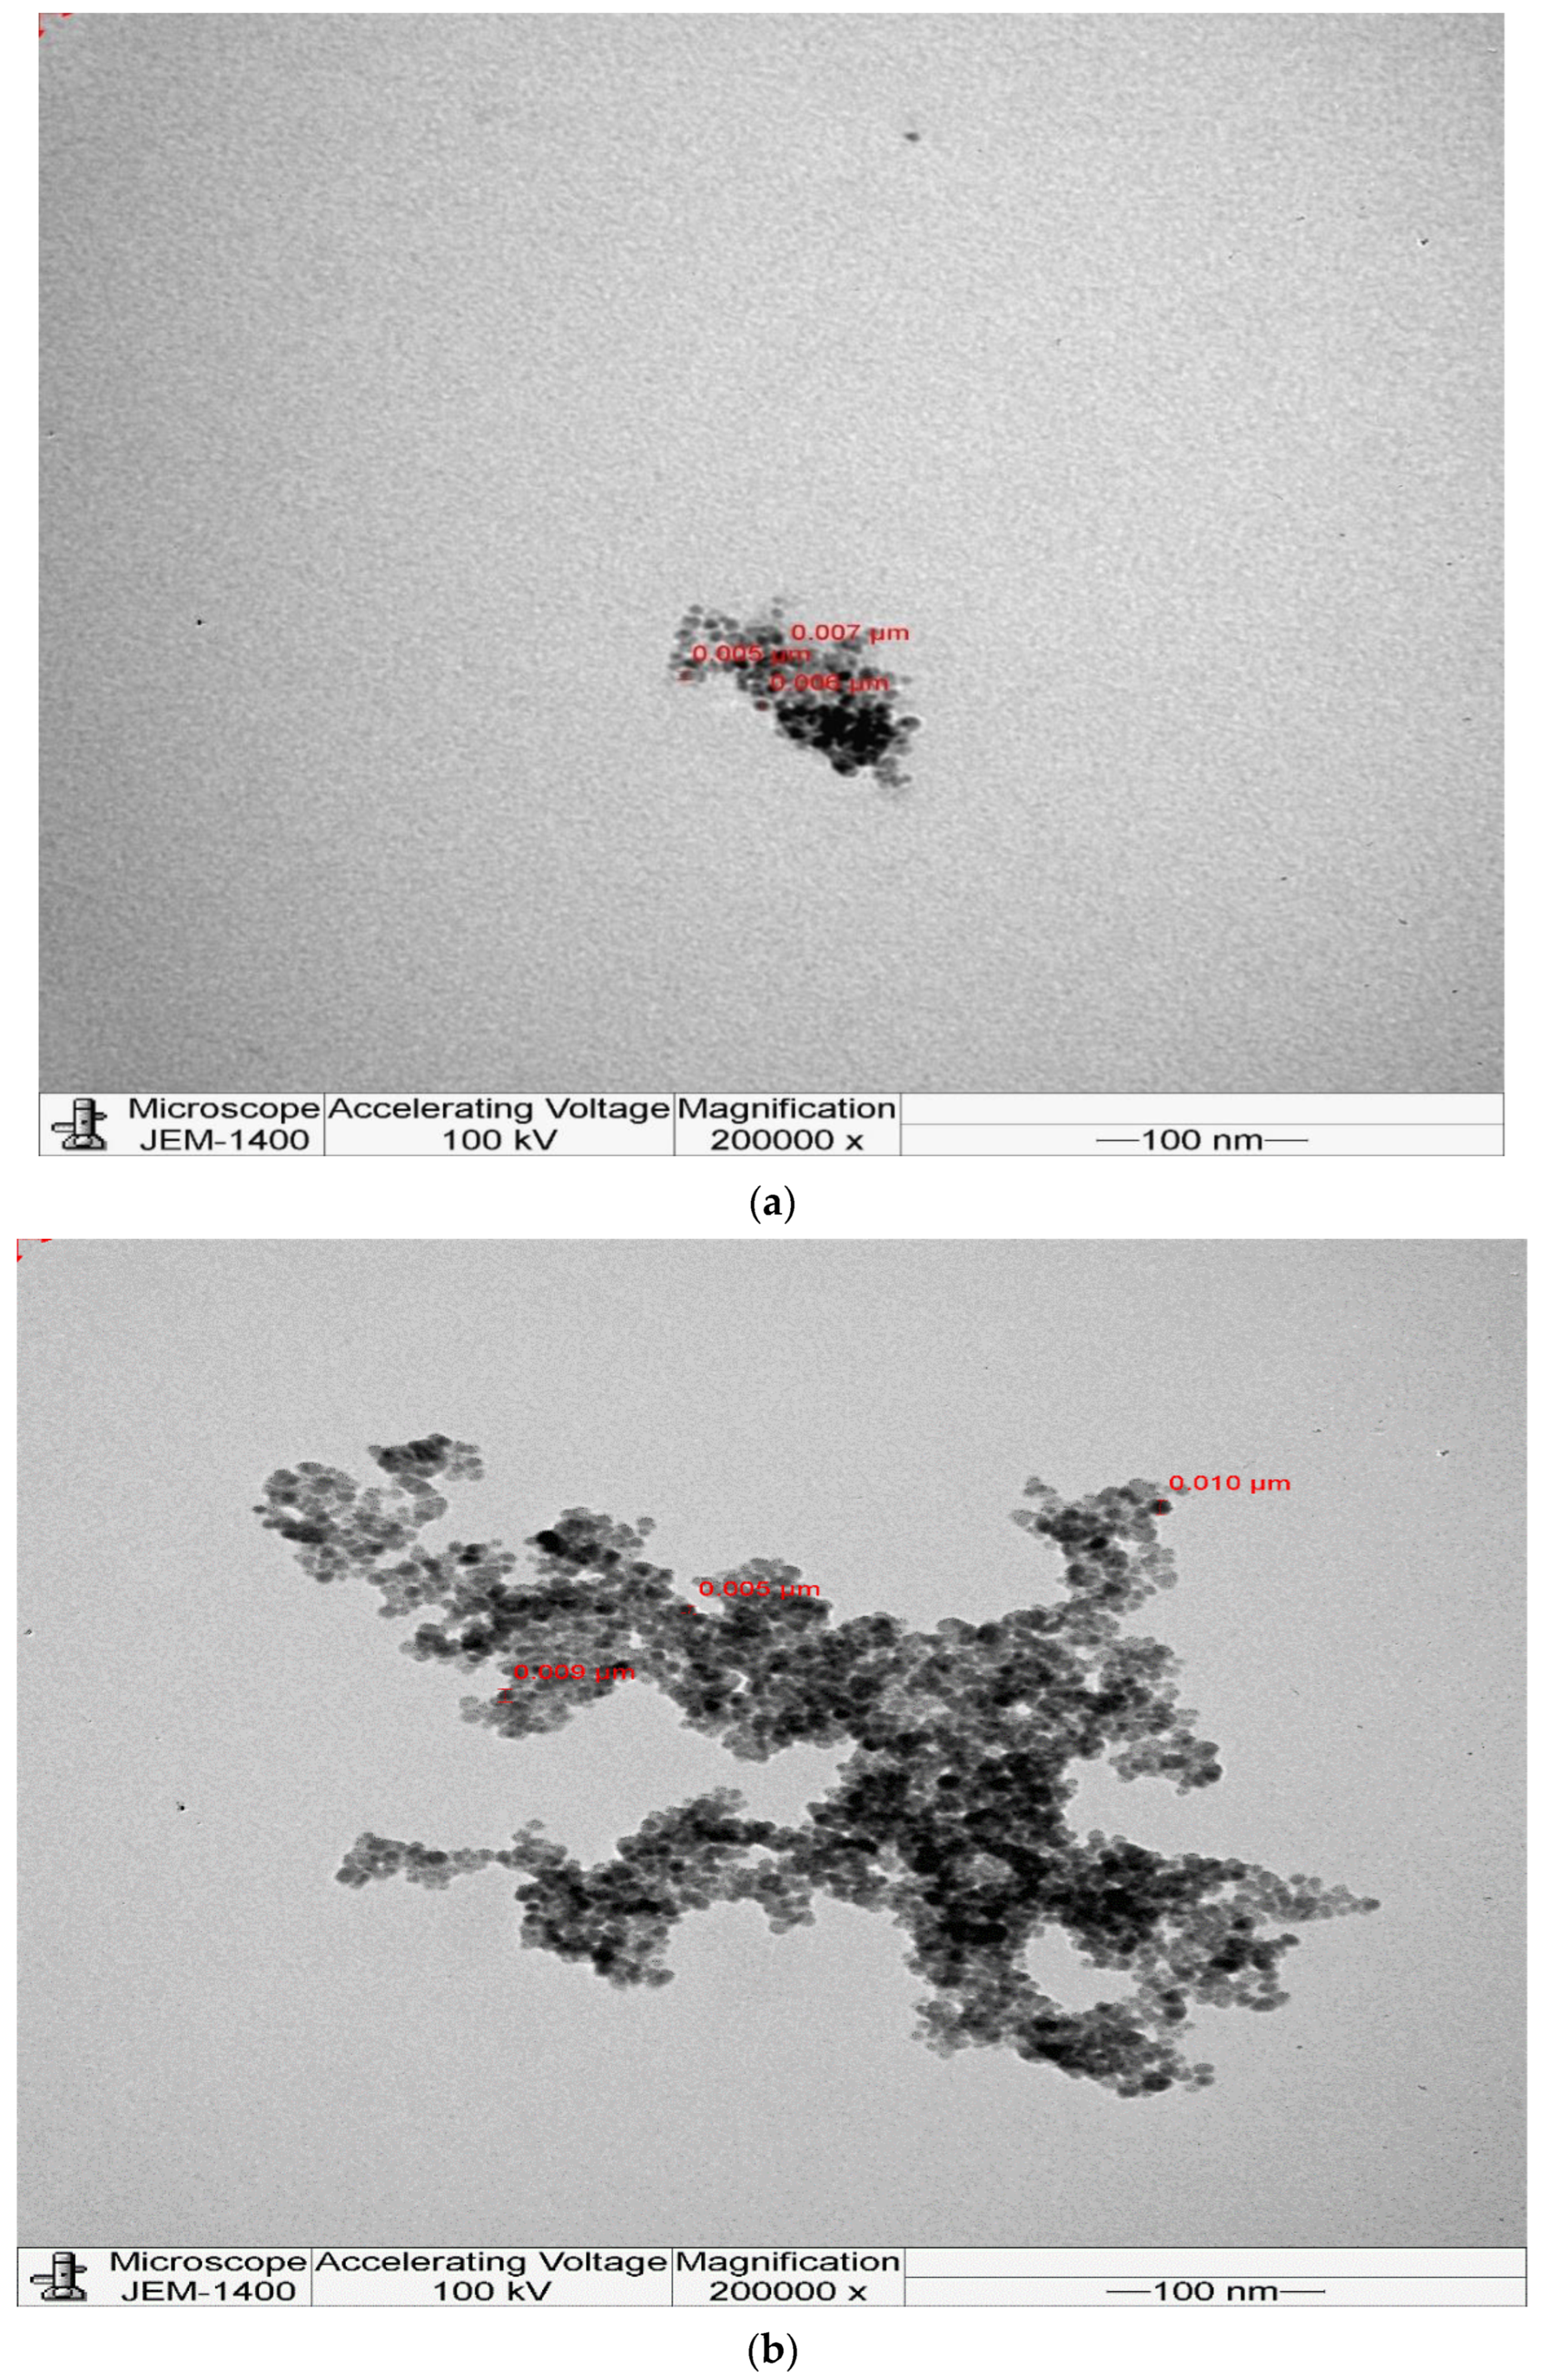
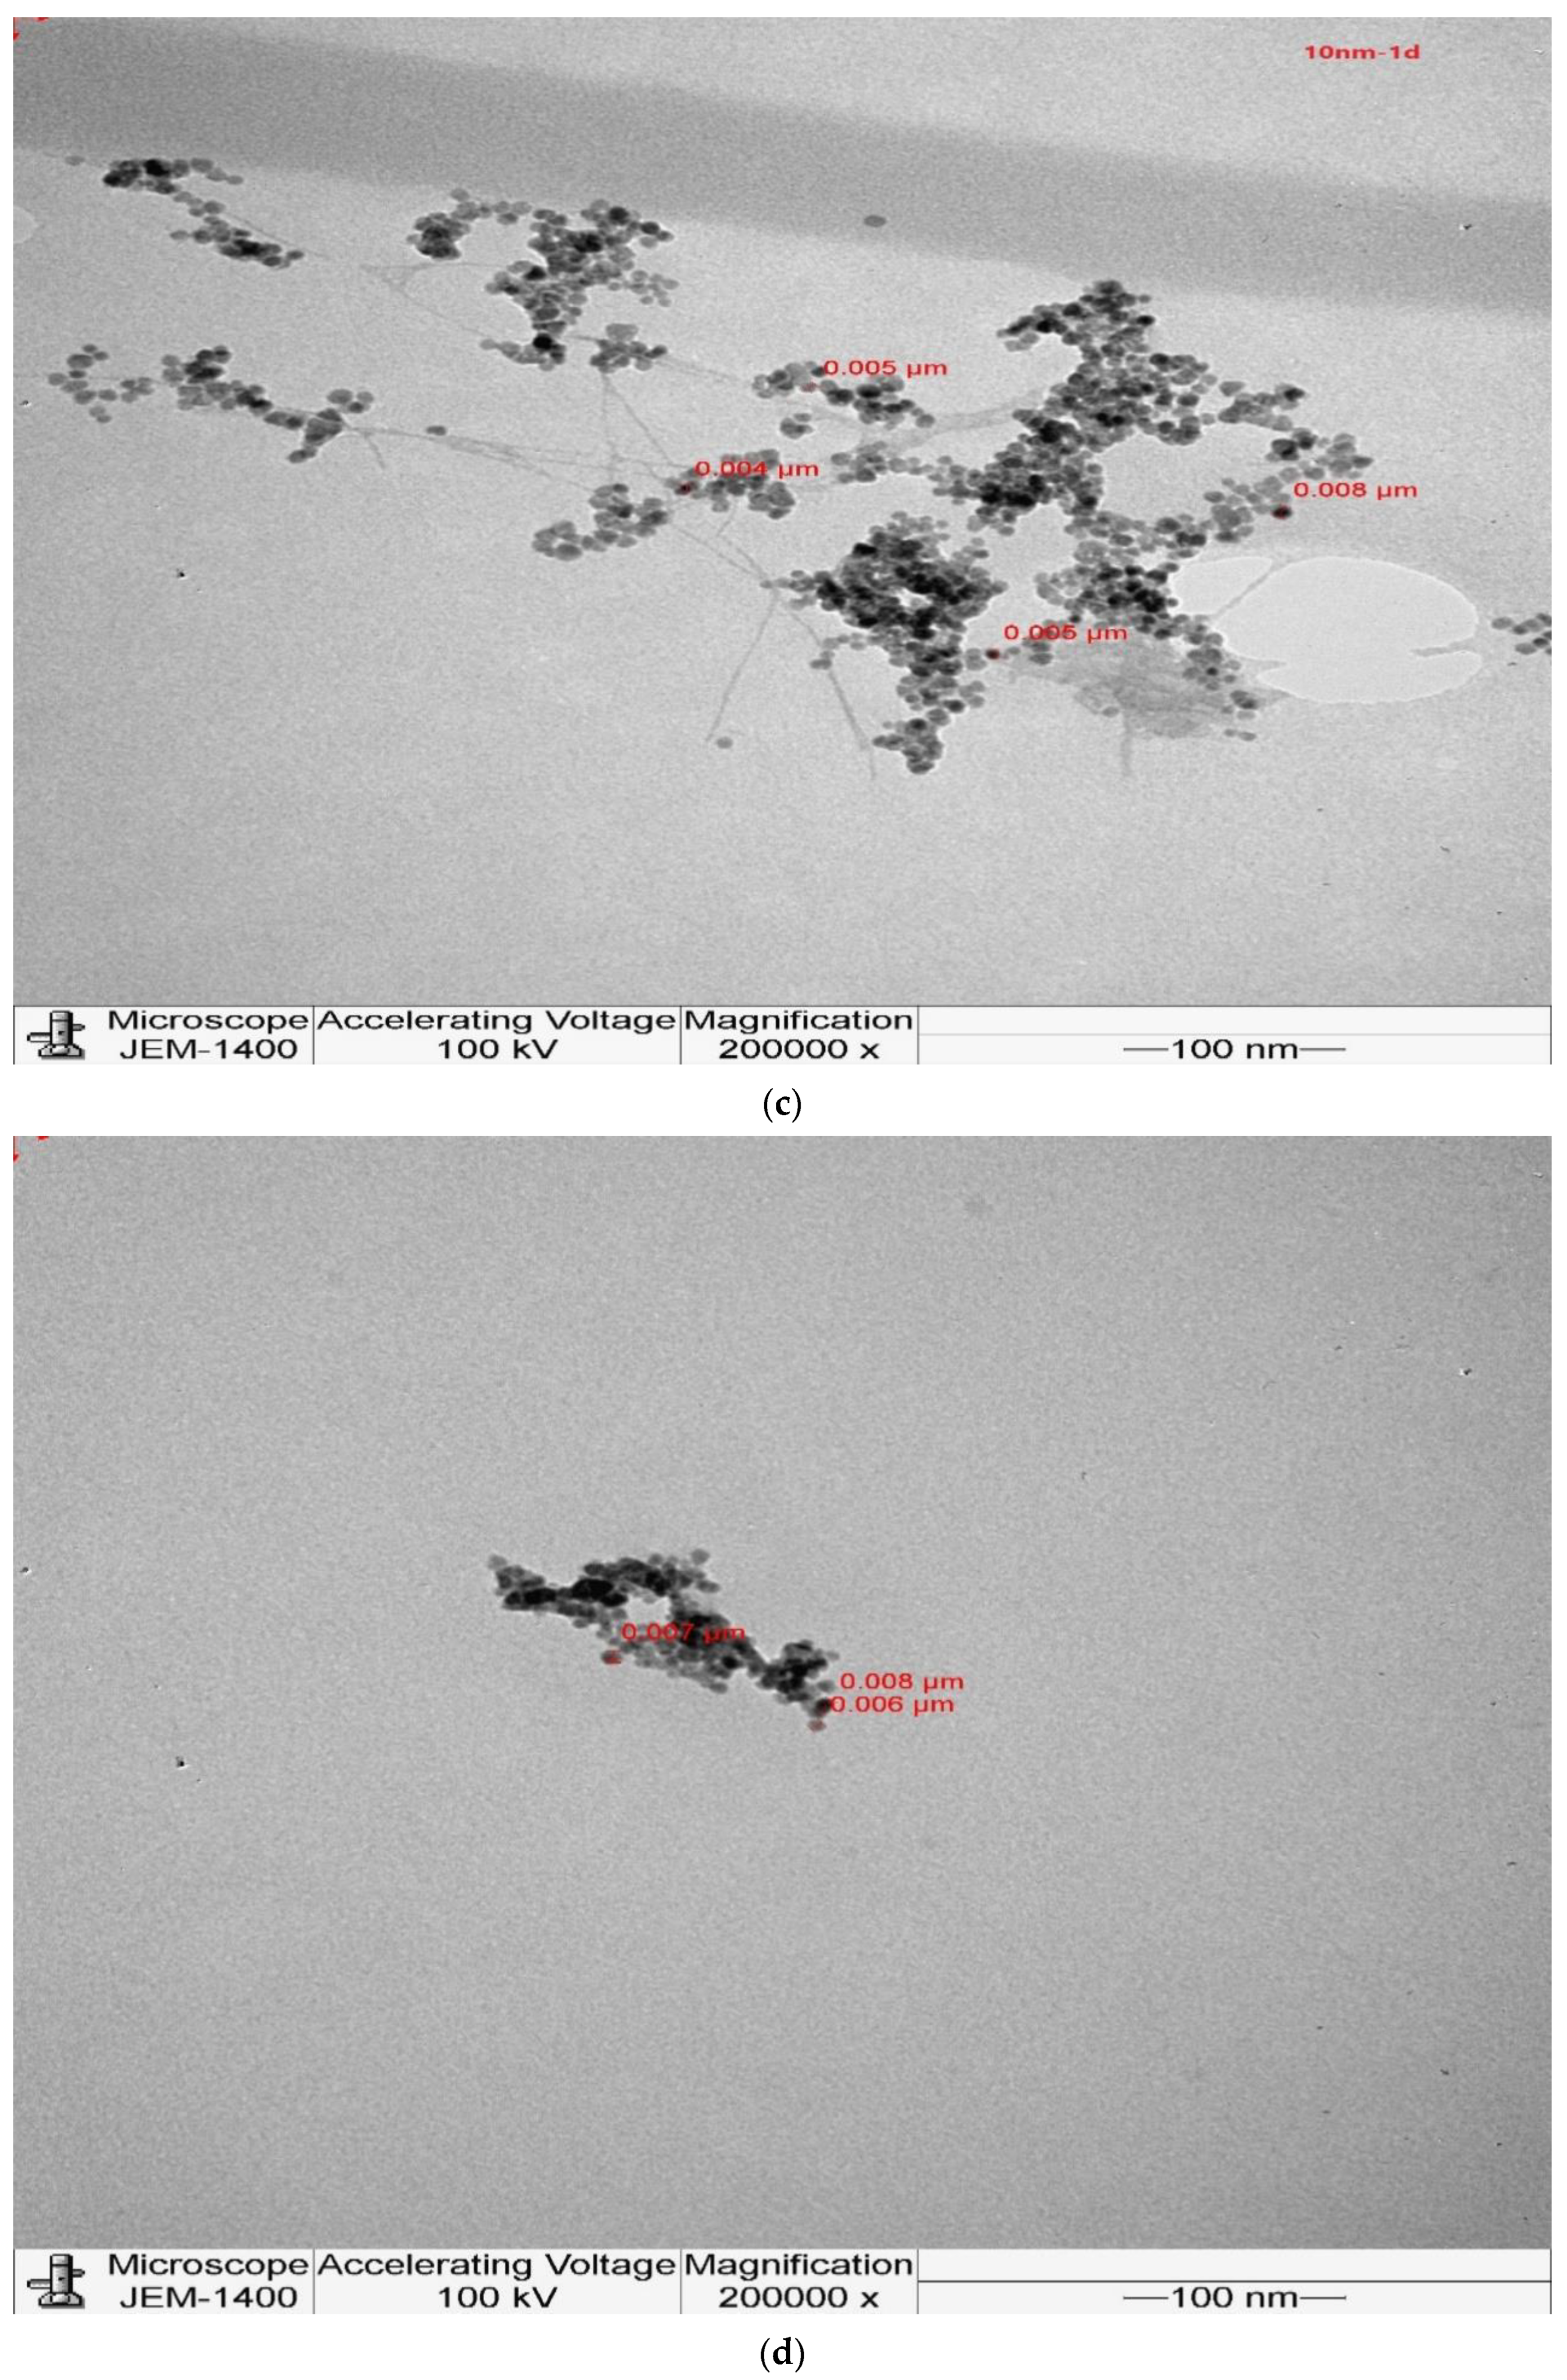
2.3. TEM Images
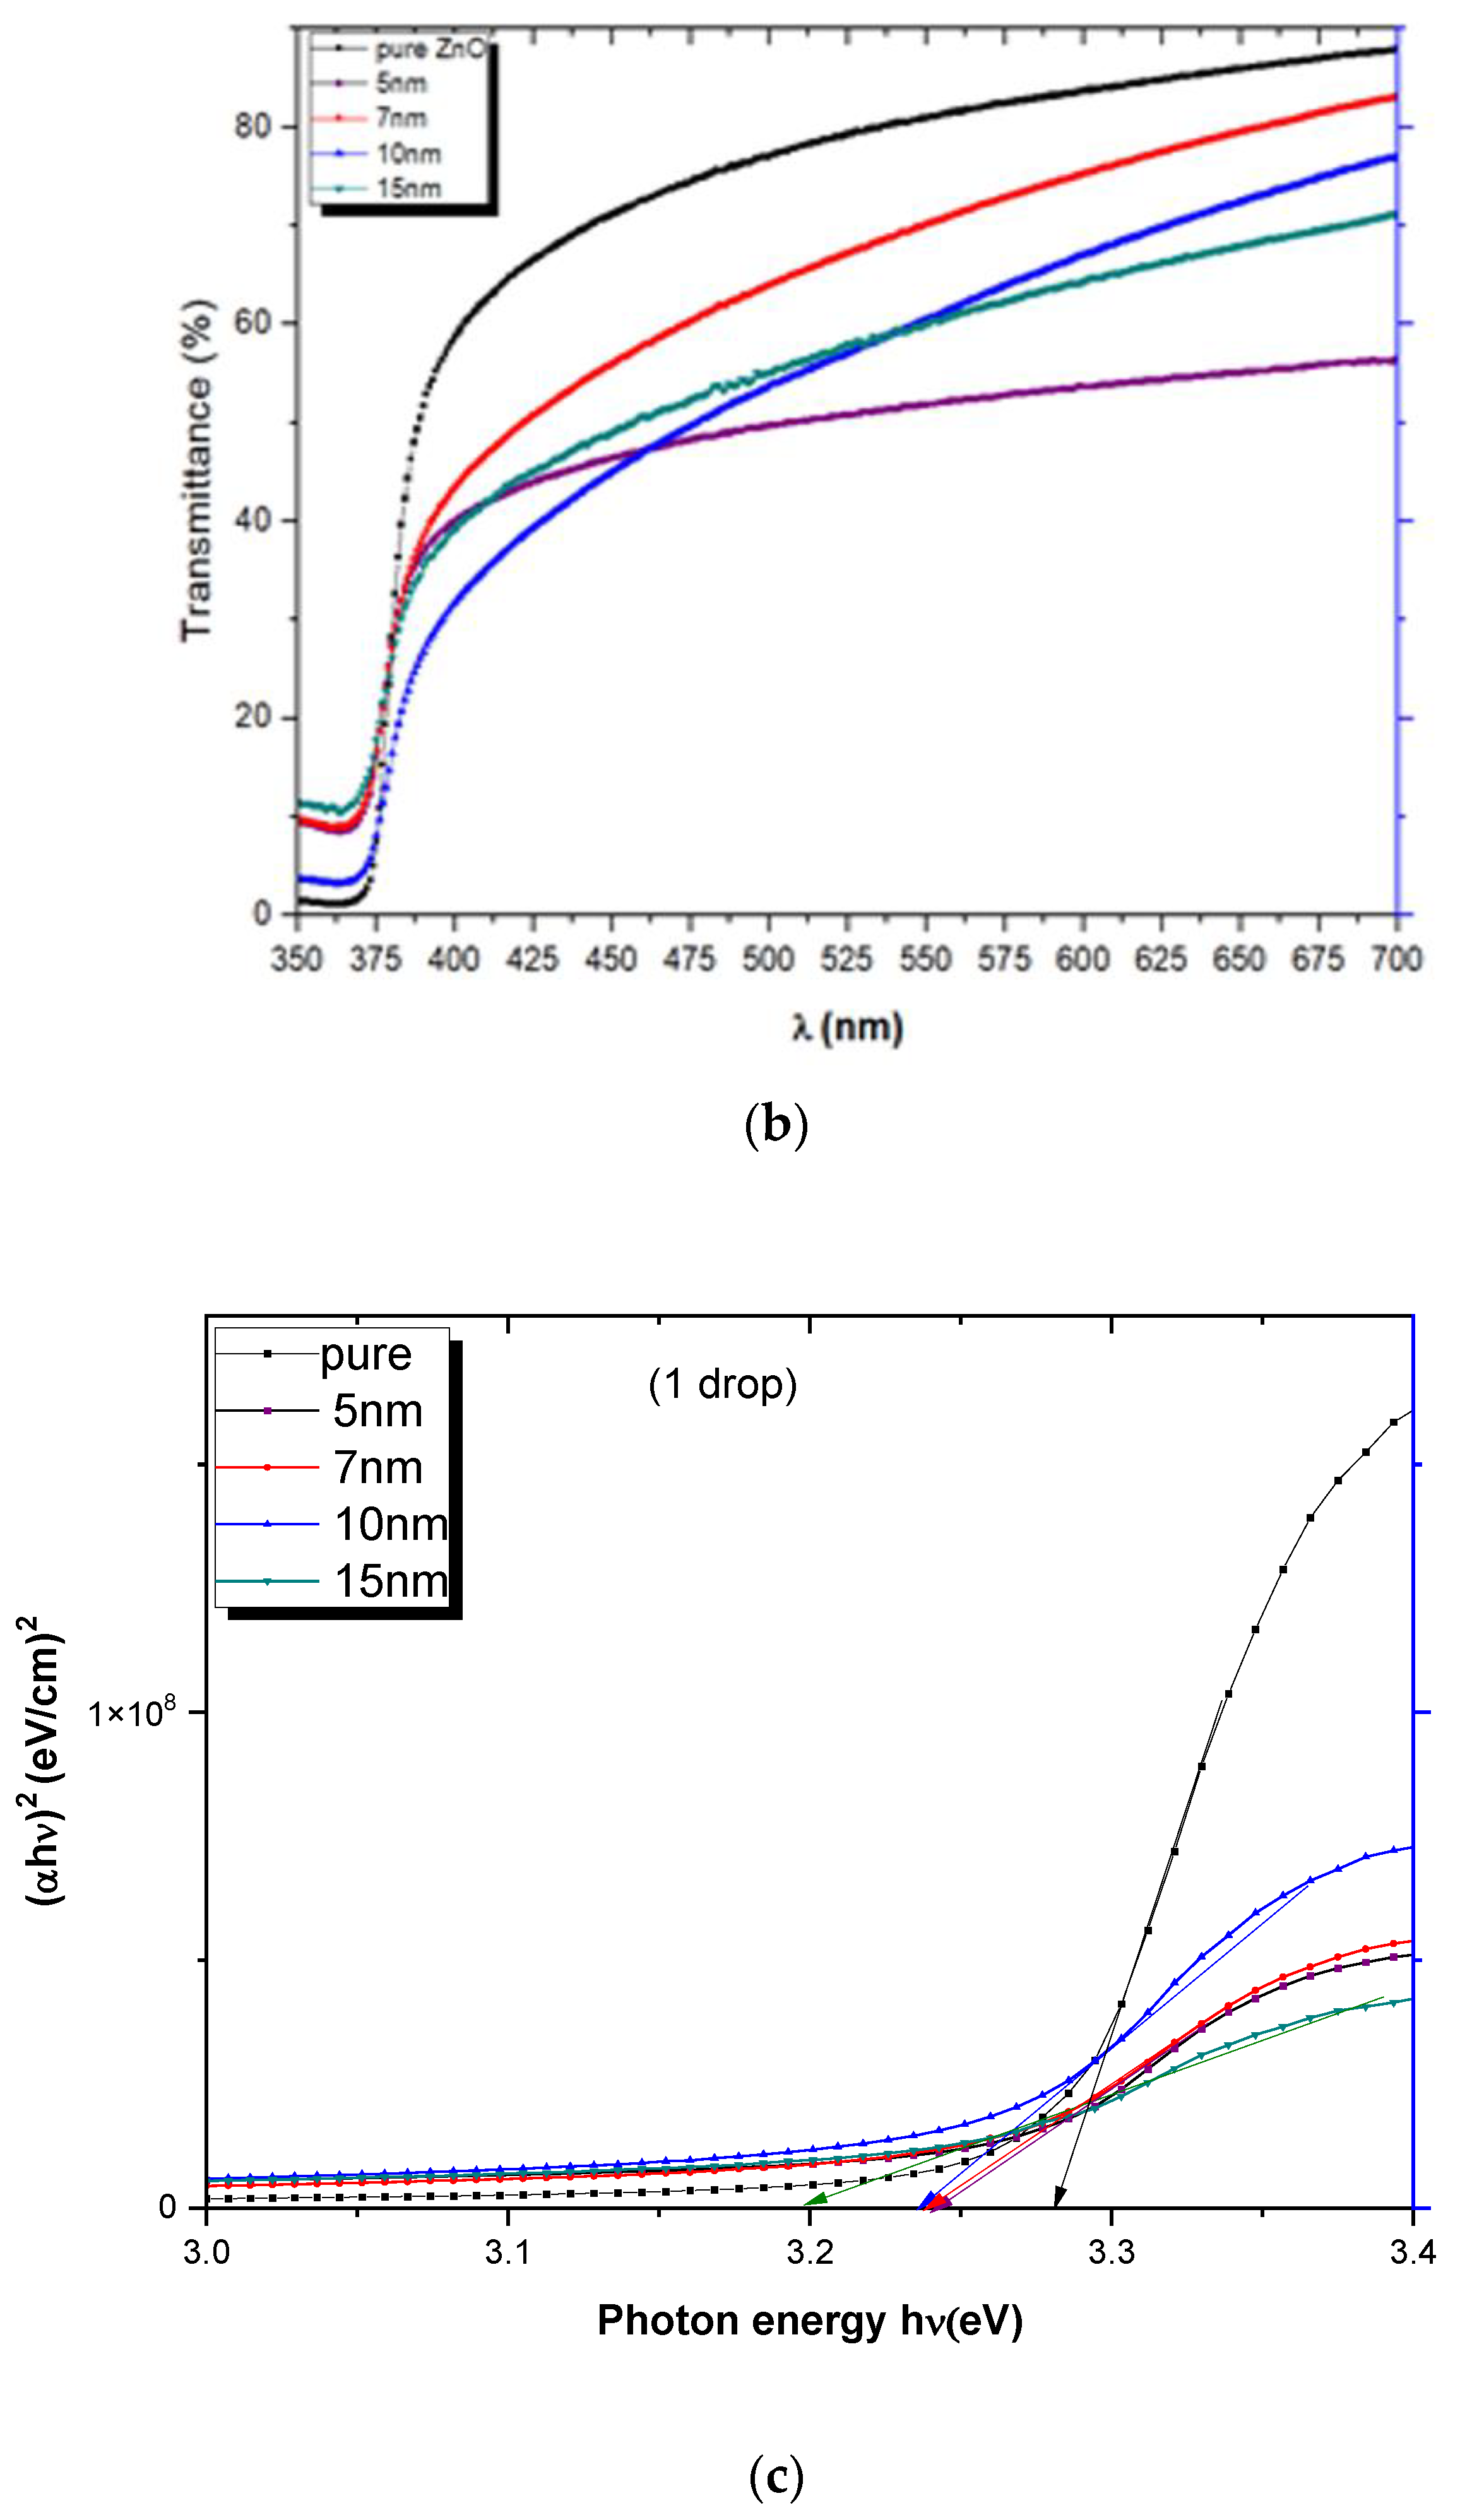
2.4. UV-Visible Absorption and Transmission Spectra
2.5. The Band Gap and Tauc’s Plot
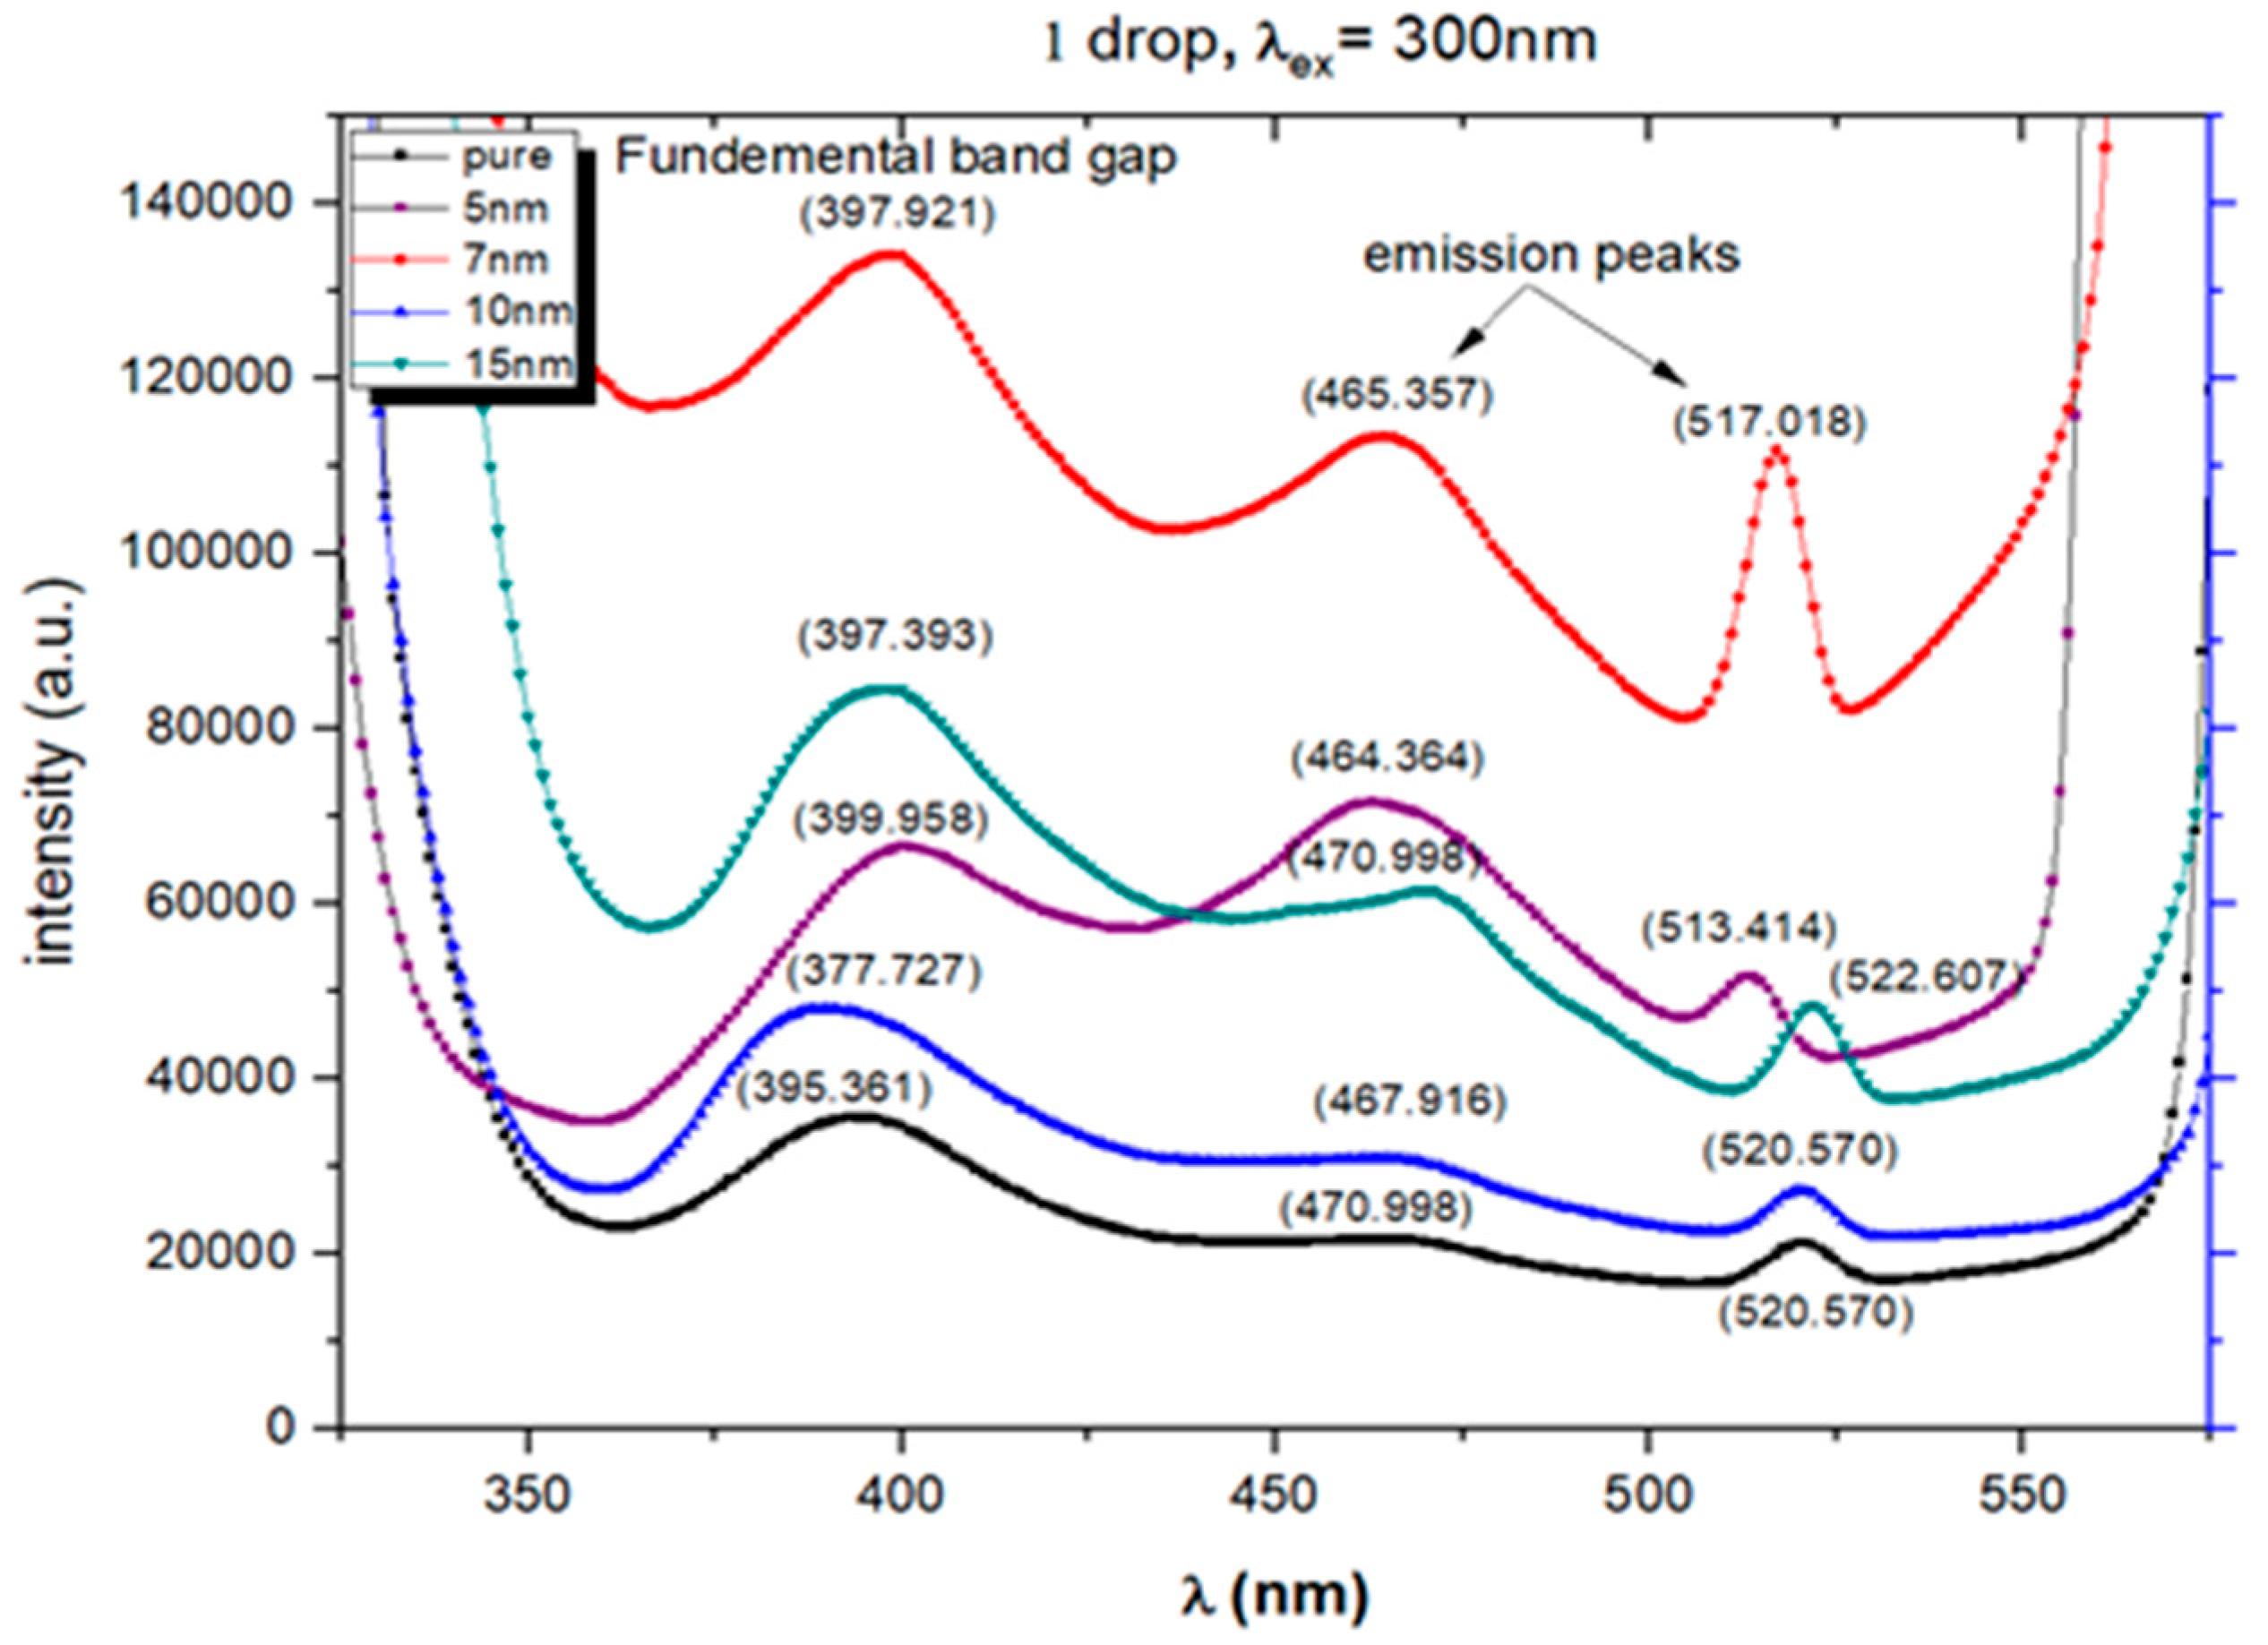
2.6. Photoluminescence Studies (PL)
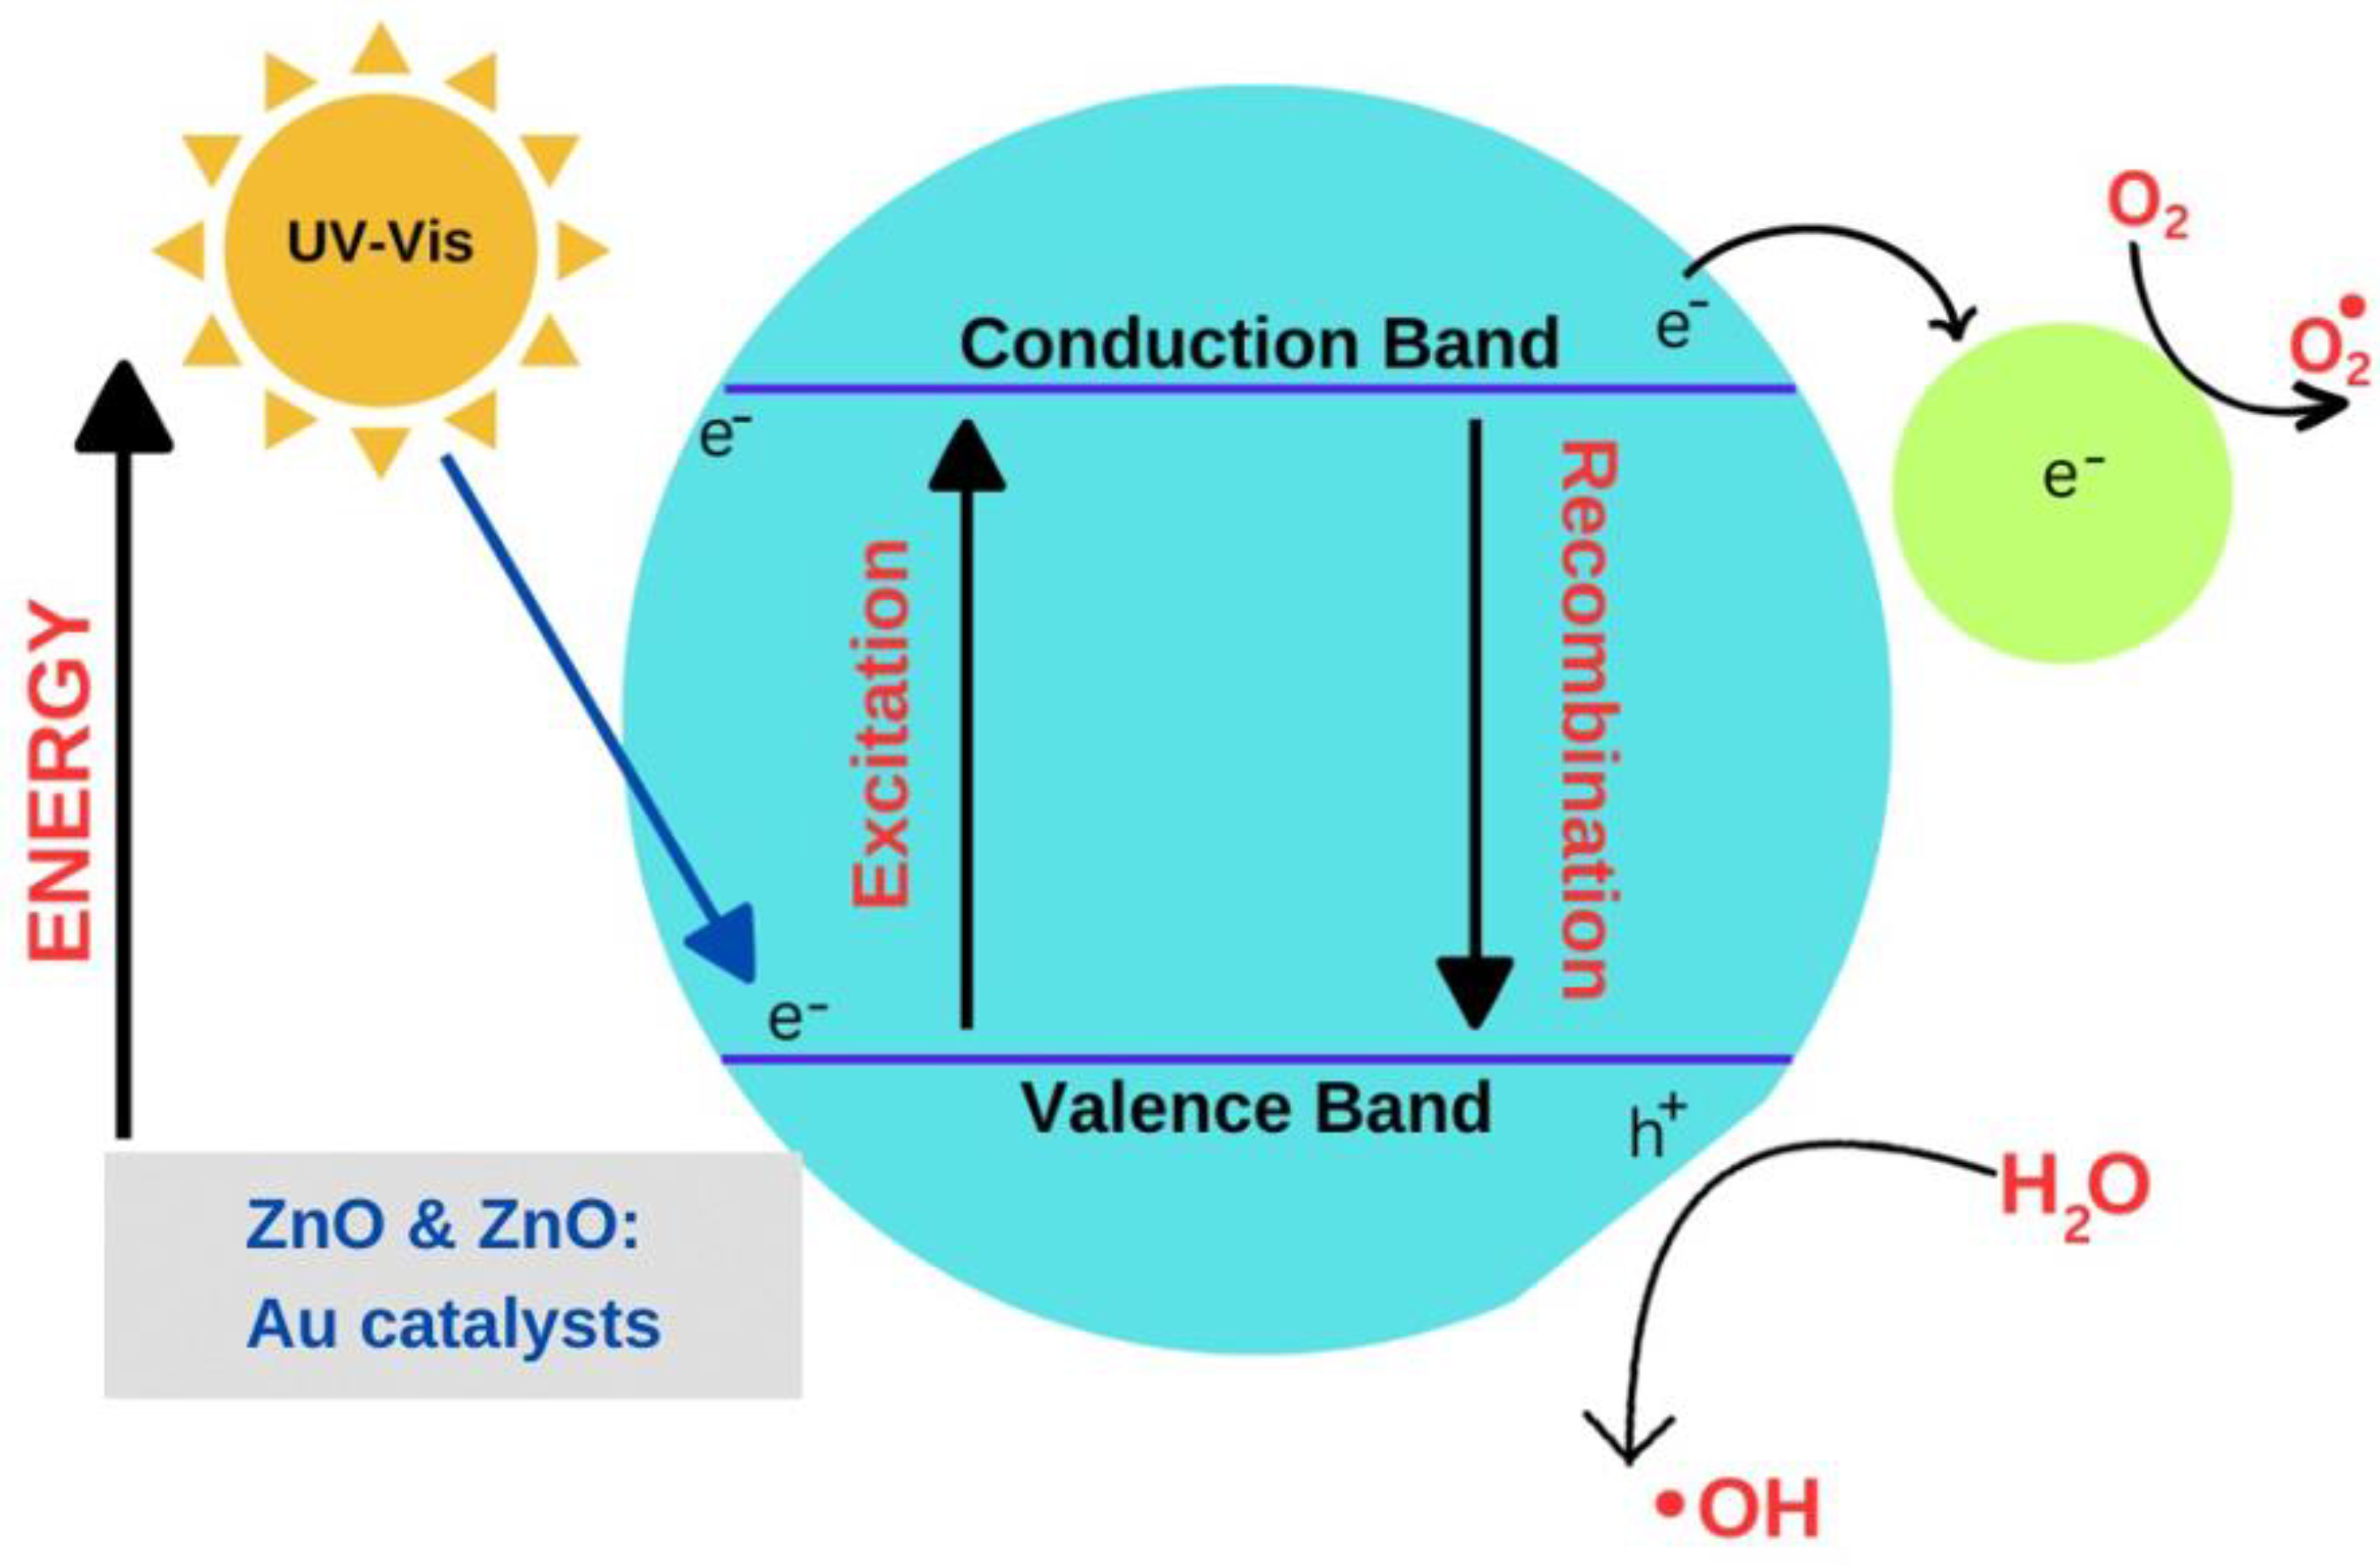
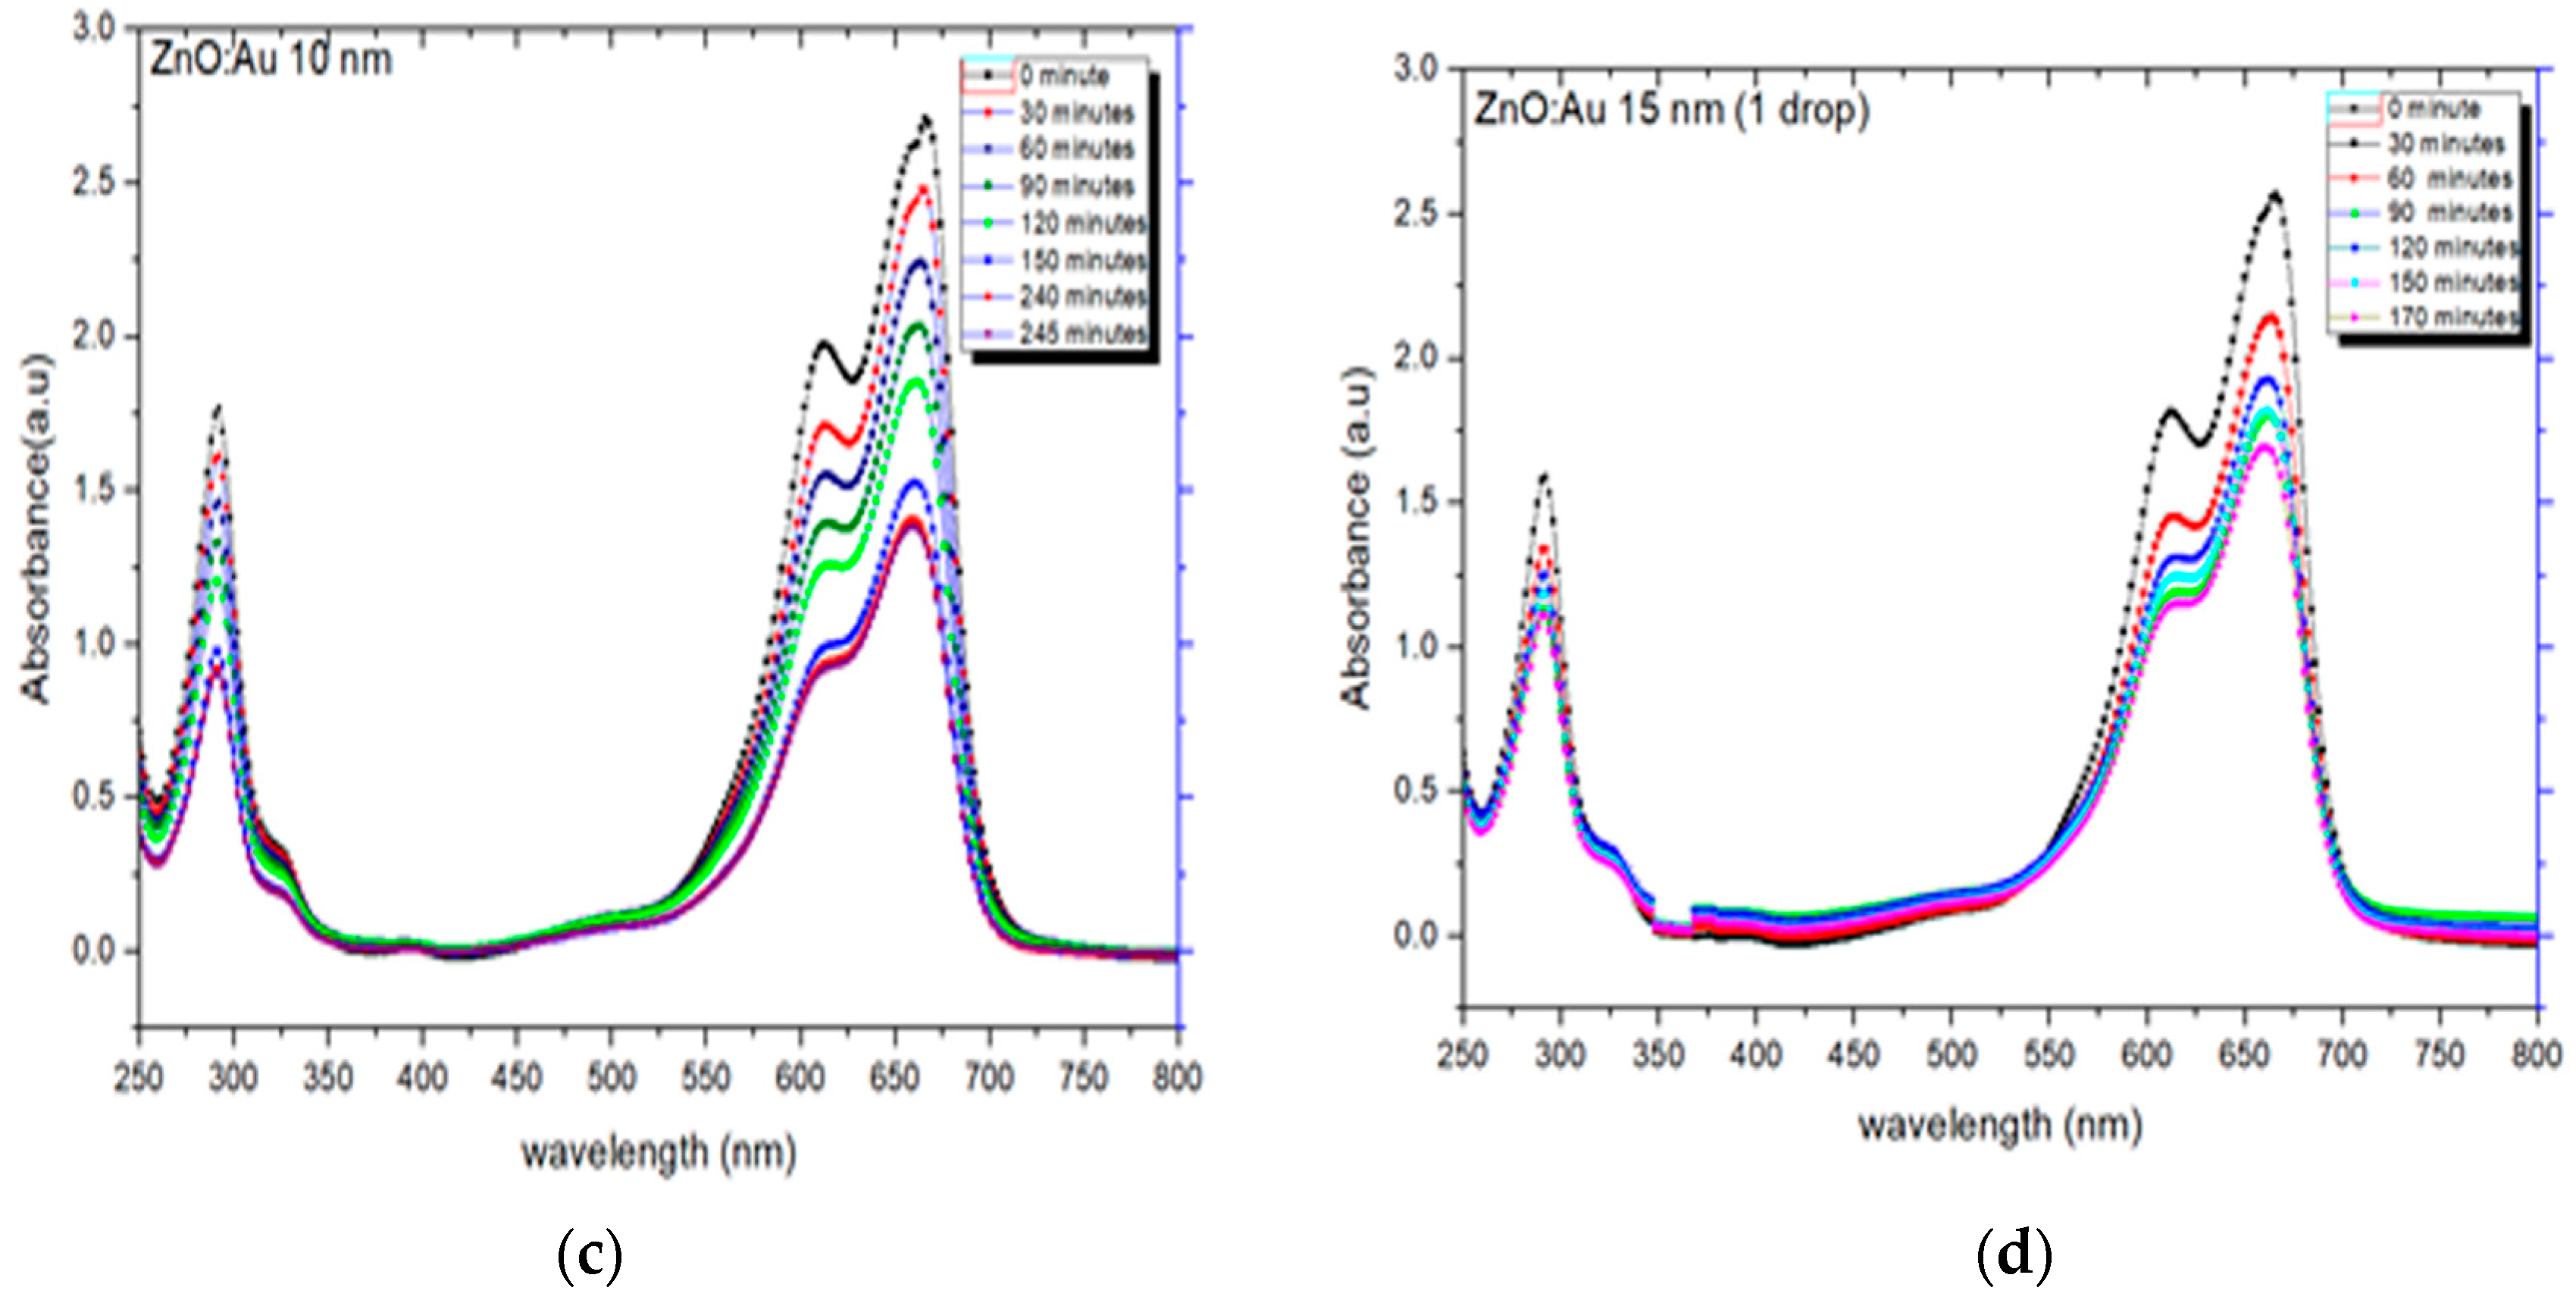
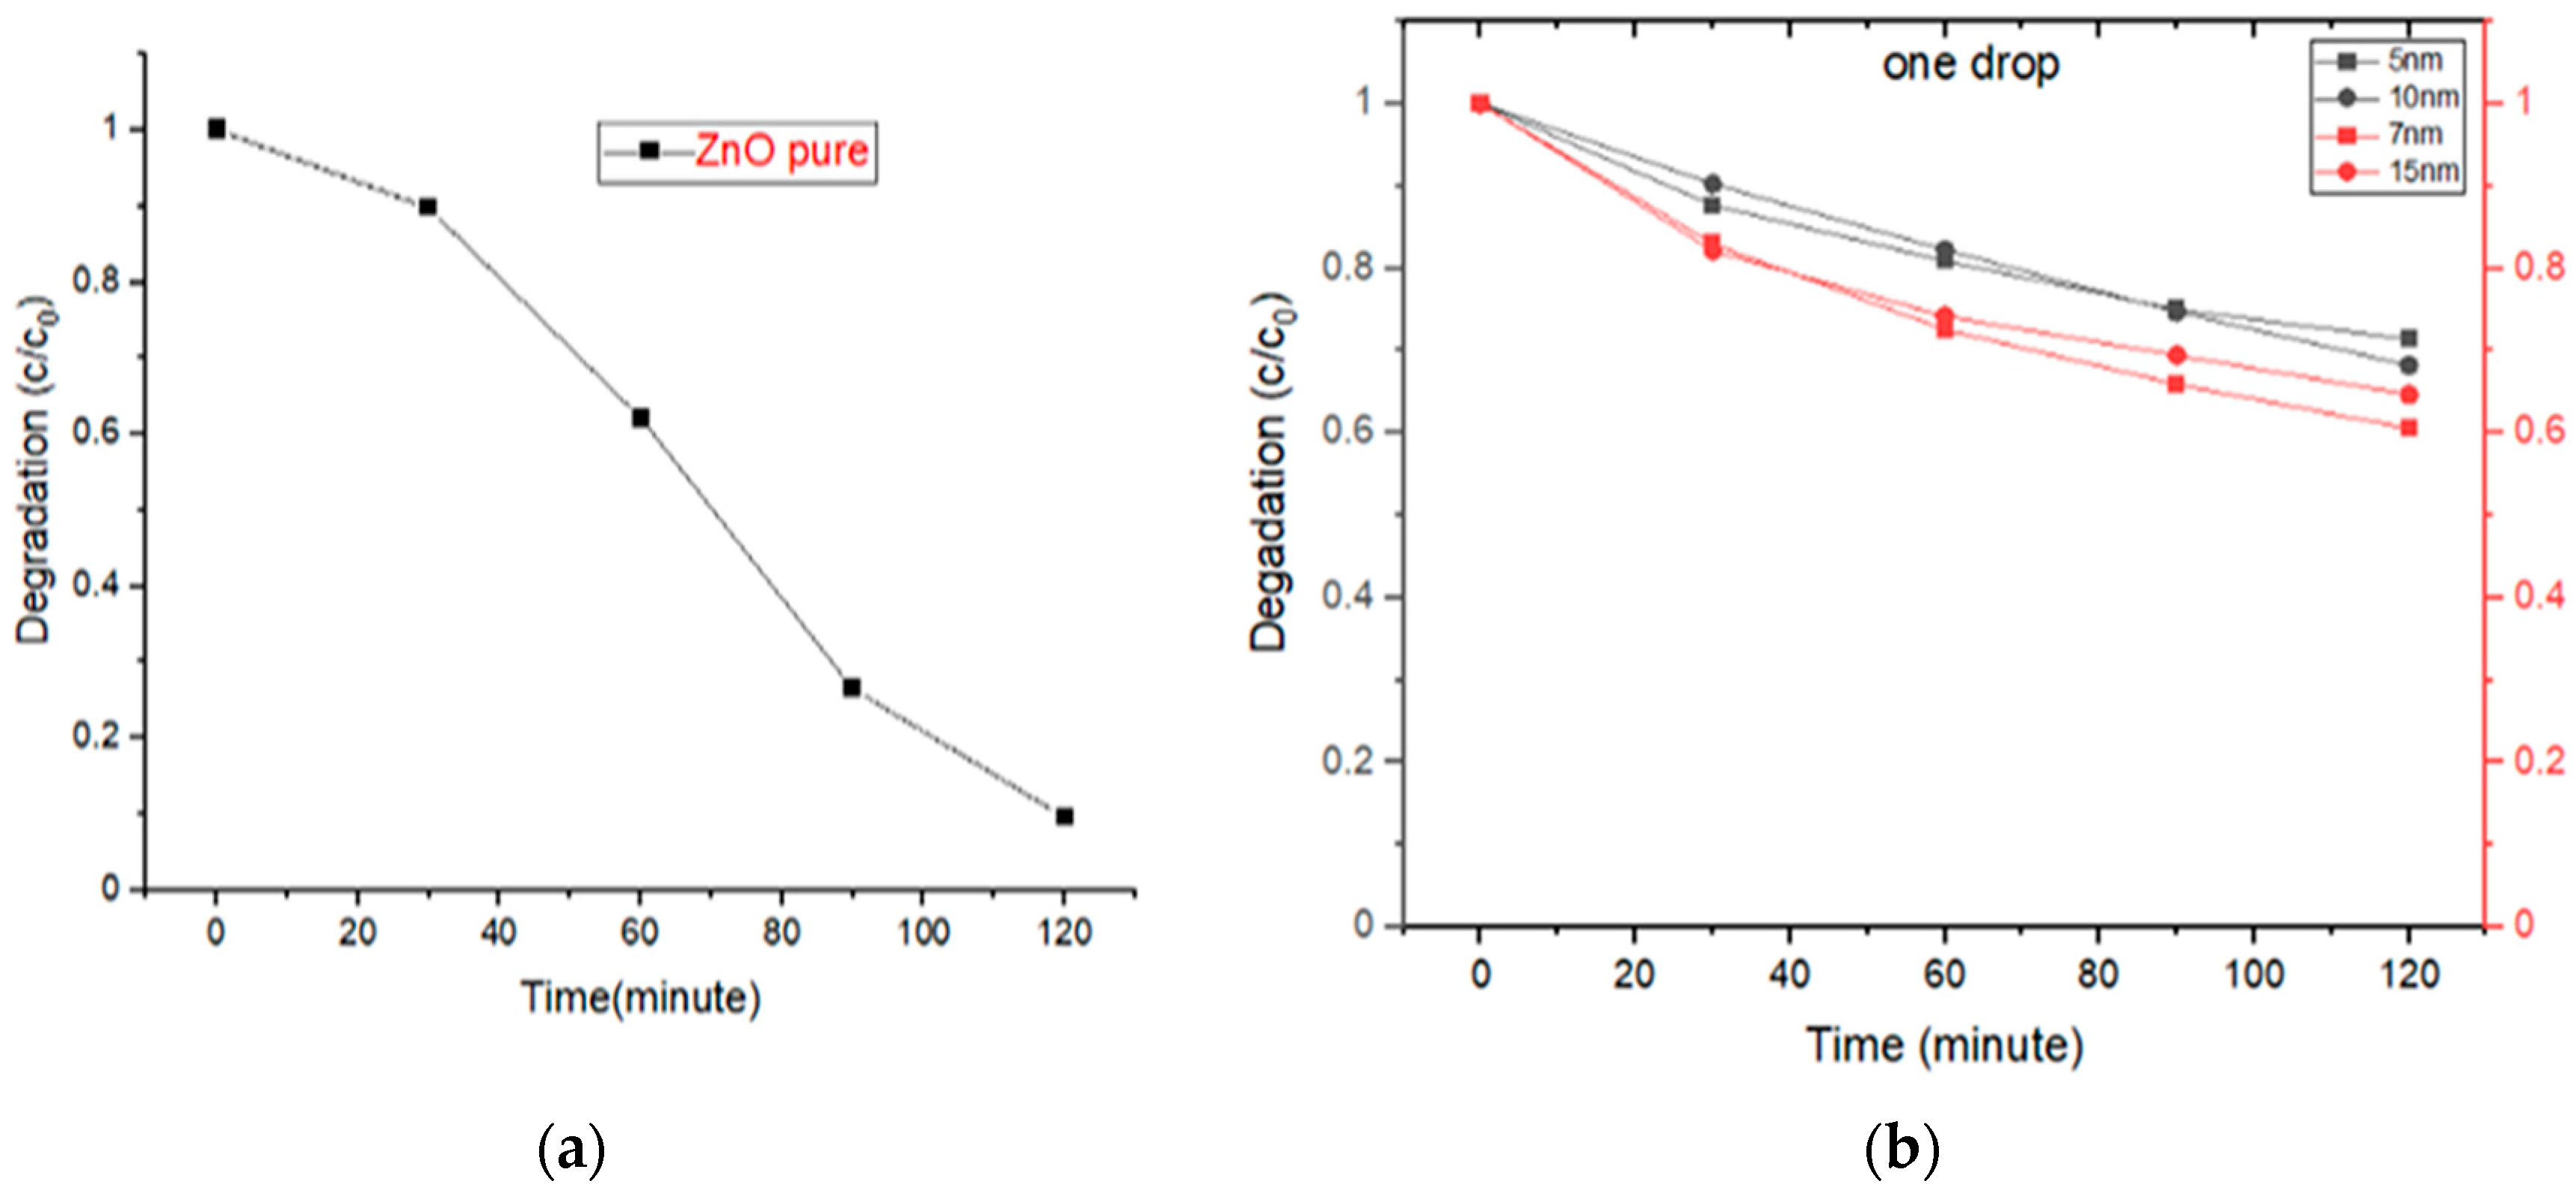
2.7. Photocatalytic Dye Degradation Studies
3. Experimental Details
3.1. Materials
3.2. Preparation of ZnO Quantum Dots
3.3. Preparation of ZnO Thick Films by Dr. Blade Technique
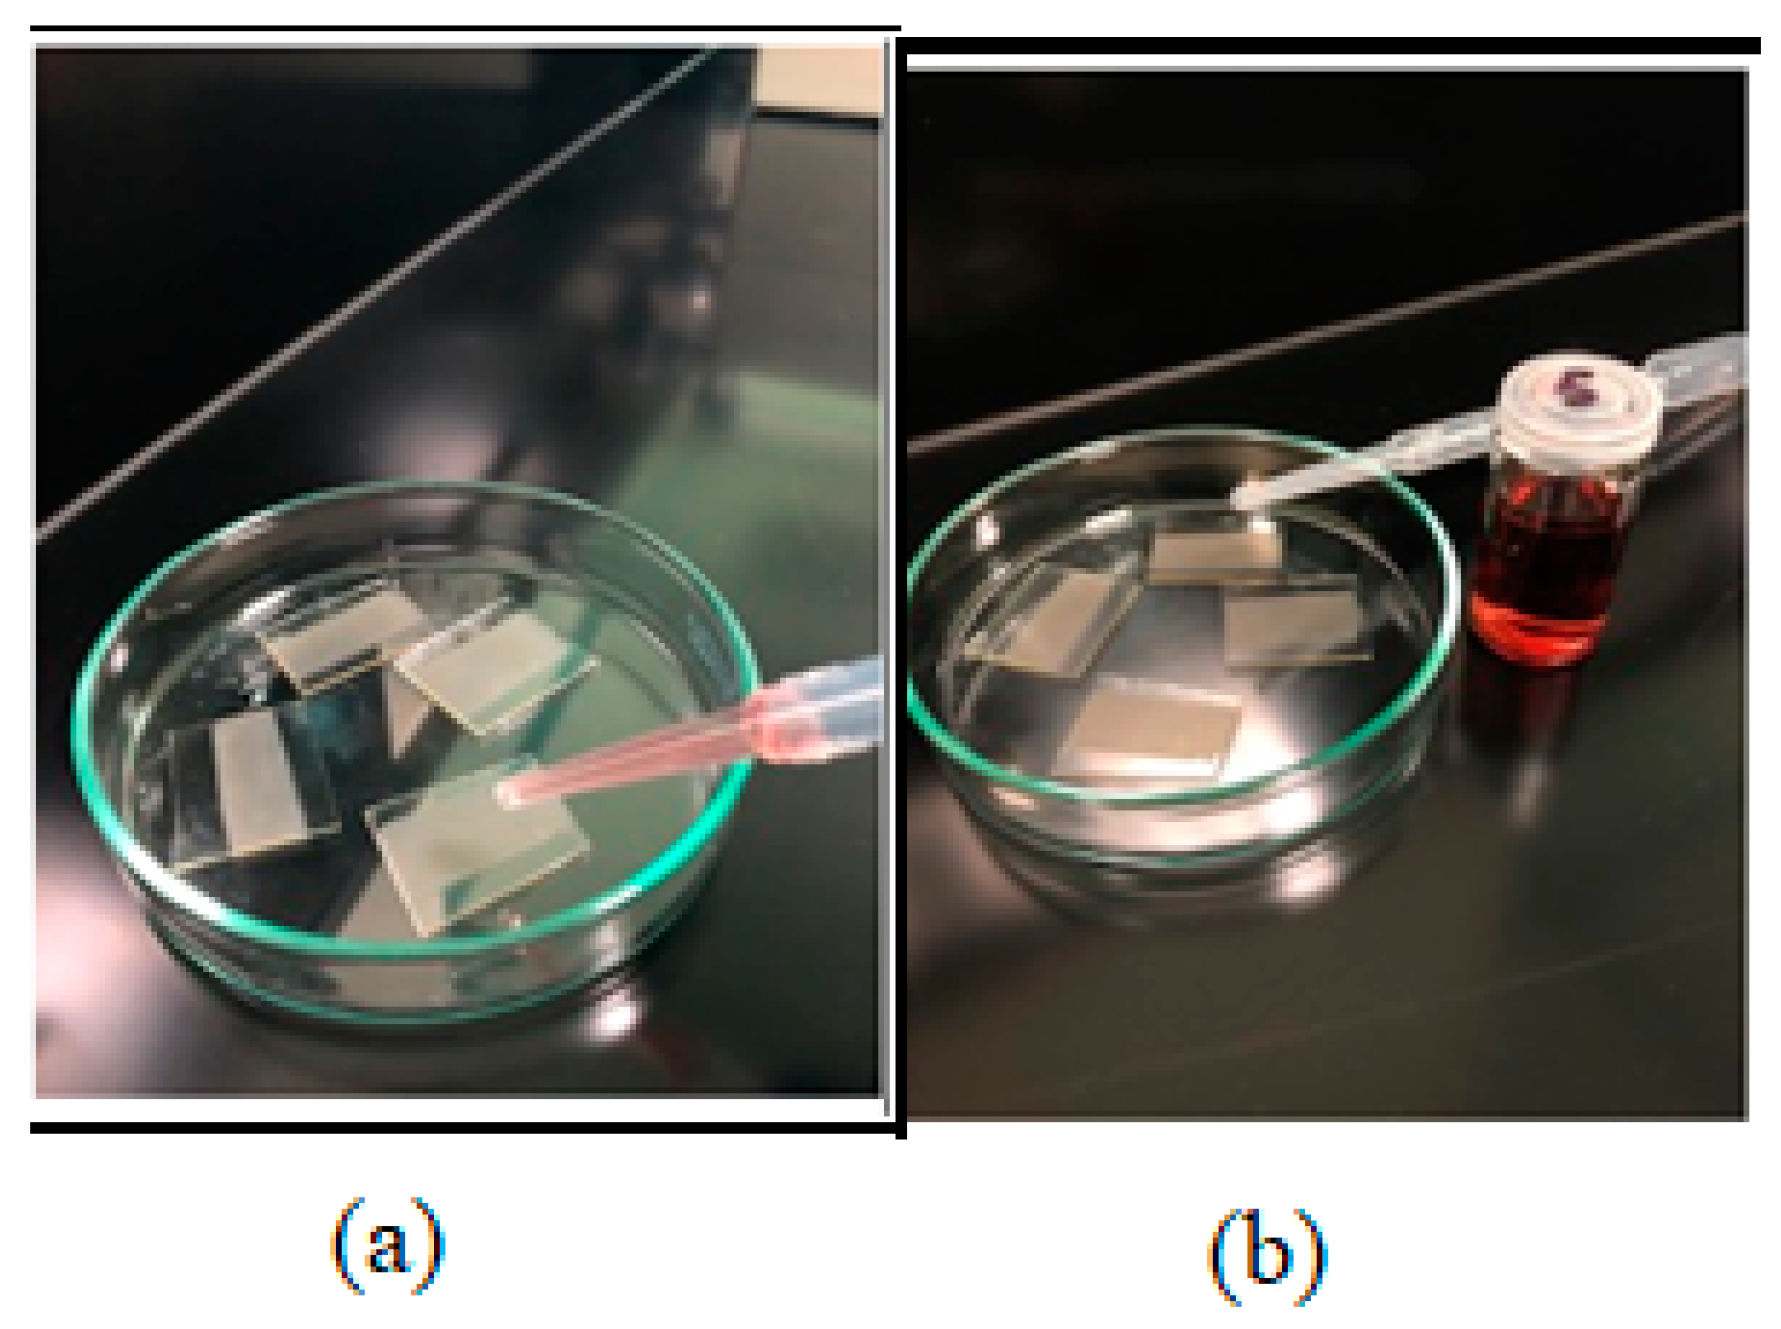
3.4. Decoration of ZnO Films with Au via the Drop-Casting Process
3.5. Physico-Chemical Characterization of Au-Decorated ZnO Thick Films
3.6. Photocatalytic Dye Degradation Studies
4. Conclusions
Author Contributions
Funding
Data Availability Statement
Acknowledgments
Conflicts of Interest
Sample Availability
References
- Roest, A.L.; Kelly, J.J.; Vanmaekelbergh, D.; Meulenkamp, E.A. Staircase in the Electron Mobility of a ZnO Quantum Dot Assembly due to Shell Filling. Phys. Rev. Lett. 2002, 89, 036801. [Google Scholar] [CrossRef] [PubMed] [Green Version]
- Ozgür, Ü.; Alivov, Y.I.; Liu, C.; Teke, A.; Reshchikov, M.A.; Doğan, S.; Avrutin, V.; Cho, S.-J.; Morkoç, H. A comprehensive review of ZnO materials and devices. J. Appl. Phys. 2005, 98, 041301. [Google Scholar] [CrossRef] [Green Version]
- Joshi, N.; Da Silva, L.F.; Shimizu, F.M.; Mastelaro, V.R.; M’peko, J.-C.; Lin, L.; Oliveira, O.N. UV-assisted chemiresistors made with gold-modified ZnO nanorods to detect ozone gas at room temperature. Microchim. Acta 2019, 186, 418. [Google Scholar] [CrossRef] [PubMed]
- Bousiakou, L.G.; Ganetsos, T.; Qindeel, R.; Farooq, W.A.; Fatehmulla, A.; Alia, S.M. Characterization of multilayer TiO2/ZnO nanostructured thin films using Raman spectroscopy. Optoelectron. Adv. Mater. Rapid Commun. 2015, 9, 782–787. [Google Scholar]
- Fonoberov, V.A.; Balandin, A.A. ZnO Quantum Dots: Physical Properties and Optoelectronic Applications. J. Nanoelectron. Optoelectron. 2006, 1, 19–38. [Google Scholar] [CrossRef] [Green Version]
- Rahman, F. Zinc oxide light-emitting diodes: A review. Opt. Eng. 2019, 58, 010901. [Google Scholar] [CrossRef] [Green Version]
- Vaseem, M.; Umar, A.; Hahn, Y. ZnO Nanoparticles: Growth, Properties, and Applications. Met. Oxide Nanostruct. Appl. 2010, 5, 10–20. [Google Scholar]
- Lee, C.-T. Fabrication Methods and Luminescent Properties of ZnO Materials for Light-Emitting Diodes. Materials 2010, 3, 2218–2259. [Google Scholar] [CrossRef] [Green Version]
- Kołodziejczak-Radzimska, A.; Jesionowski, T. Zinc Oxide—From Synthesis to Application: A Review. Materials 2014, 7, 2833–2881. [Google Scholar] [CrossRef] [Green Version]
- Farooq, W.A.; Ali, S.M.; Tawfik, W.; Fatehmulla, A.; Aslam, M.; Al-Dwayyan, A.S.; AlSalhi, M. Influence of laser irradiation on the optical properties of nano-sized powder of metal oxide. Russ. J. Phys. Chem. A 2014, 88, 2446–2450. [Google Scholar] [CrossRef]
- Razzaq, Z.; Hamayun, M.; Murtaza, S.; Kausar, S.; Altaf, A.A.; Khan, R.U.; Javaid, T. Removal of As(V) and Cr(VI) with Low-Cost Novel Virgin and Iron-Impregnated Banana Peduncle-Activated Carbons. ACS Omega 2023, 8, 2098–2111. [Google Scholar] [CrossRef] [PubMed]
- Shahzad, K.; Hussain, S.; Nazir, M.A.; Jamshaid, M.; Rehman, A.U.; Alkorbi, A.S.; Alsaiari, R.; Alhemiary, N.A. Versatile Ag2O and ZnO nanomaterials fabricated via annealed Ag-PMOS and ZnO-PMOS: An efficient photocatalysis tool for azo dyes. J. Mol. Liq. 2022, 356, 119036. [Google Scholar] [CrossRef]
- Kumar, O.P.; Shahzad, K.; Nazir, M.A.; Farooq, N.; Malik, M.; Shah, S.S.A.; Ur Rehman, A. Photo-Fenton activated C3N4x/[email protected] dual s-scheme heterojunction towards degra-dation of organic pollutants. Opt. Mater. 2022, 126, 112199. [Google Scholar] [CrossRef]
- Jamshaid, M.; Nazir, M.A.; Najam, T.; Shah, S.S.A.; Khan, H.M.; Ur Rehman, A. Facile synthesis of Yb3+-Zn2+ substituted M type hexaferrites: Structural, electric and photocatalytic properties under visible light for methylene blue removal. Chem. Phys. Lett. 2022, 805, 139939. [Google Scholar] [CrossRef]
- Cao, J.; Sun, S.; Li, X.; Yang, Z.; Xiong, W.; Wu, Y.; Jia, M.; Zhou, Y.; Zhou, C.; Zhang, Y. Efficient charge transfer in aluminum-cobalt layered double hydroxide derived from Co-ZIF for enhanced catalytic degradation of tetracycline through peroxymonosulfate activation. Chem. Eng. J. 2019, 382, 122802. [Google Scholar] [CrossRef]
- Nakata, K.; Fujishima, A. TiO2 photocatalysis: Design and applications. J. Photochem. Photobiol. C Photochem. Rev. 2012, 13, 169–189. [Google Scholar] [CrossRef]
- Hamza, M.; Altaf, A.A.; Kausar, S.; Murtaza, S.; Rasool, N.; Gul, R.; Badshah, A.; Zaheer, M.; Shah, S.A.A.; Zakaria, Z.A. Catalytic Removal of Alizarin Red Using Chromium Manganese Oxide Nanorods: Degradation and Kinetic Studies. Catalysts 2020, 10, 1150. [Google Scholar] [CrossRef]
- Kausar, S.; Altaf, A.A.; Hamayun, M.; Danish, M.; Zubair, M.; Naz, S.; Muhammad, S.; Zaheer, M.; Ullah, S.; Badshah, A. Soft template-based bismuth doped zinc oxide nanocomposites for photocatalytic depolymerization of lignin. Inorg. Chim. Acta 2019, 502, 119390. [Google Scholar] [CrossRef]
- Kasap, S.; Capper, P. Handbook of Electronic and Photonic Material; Springer: Berlin/Heidelberg, Germany, 2017; pp. 1–21. [Google Scholar]
- Lupan, O.; Postica, V.; Pauporté, T.; Hoppe, M.; Adelung, R. UV nanophotodetectors: A case study of individual Au-modified ZnO nanowires. Sens. Actuators A Phys. 2019, 296, 400–408. [Google Scholar] [CrossRef]
- Le, C.H.; Nguyen, O.T.T.; Nguyen, H.S.; Pham, L.D.; Hoang, C.V. Controllable synthesis and visible-active photocatalytic properties of Au nanoparticles decorated urchin-like ZnO nanostructures. Curr. Appl. Phys. 2017, 17, 1506–1512. [Google Scholar] [CrossRef]
- Wongchoosuk, C.; Choopun, S.; Tuantranont, A.; Kerdcharoen, T. Au-doped zinc oxide nanostructure sensors for detection and discrimination of volatile organic compounds. Mater. Res. Innov. 2009, 13, 185–188. [Google Scholar] [CrossRef]
- Chen, L.; Tran, T.T.; Huang, C.; Li, J.; Yuan, L.; Cai, Q. Synthesis and photocatalytic application of Au/Ag nanoparticle-sensitized ZnO films. Appl. Surf. Sci. 2013, 273, 82–88. [Google Scholar] [CrossRef]
- Nakate, U.; Bulakhe, R.; Lokhande, C.; Kale, S. Au sensitized ZnO nanorods for enhanced liquefied petroleum gas sensing properties. Appl. Surf. Sci. 2016, 371, 224–230. [Google Scholar] [CrossRef]
- Saleem, M.; Irshad, K.; Rehman, S.U.; Javed, M.S.; Hasan, M.A.; Ali, H.M.; Ali, A.; Malik, M.Z.; Islam, S. Characteristics and Photovoltaic Applications of Au-Doped ZnO–Sm Nanoparticle Films. Nanomaterials 2021, 11, 702. [Google Scholar] [CrossRef]
- Yu, S.; Zhang, H.; Chen, C.; Lin, C. Investigation of humidity sensor based on Au modified ZnO nanosheets via hydrother-mal method and first principle. Sens. Actuators B Chem. 2019, 287, 526–534. [Google Scholar] [CrossRef]
- Li, Y.; Liao, C.; Tjong, S.C. Recent Advances in Zinc Oxide Nanostructures with Antimicrobial Activities. Int. J. Mol. Sci. 2020, 21, 8836. [Google Scholar] [CrossRef]
- Shao, D.; Gao, J.; Chow, P.; Sun, H.; Xin, G.; Sharma, P.; Lian, J.; Koratkar, N.A.; Sawyer, S. Organic–Inorganic Heterointerfaces for Ultrasensitive Detection of Ultraviolet Light. Nano Lett. 2015, 15, 3787–3792. [Google Scholar] [CrossRef]
- Sharma, S.; Bhandari, S.C.; Shrestha, S.P.; Joshi, L.P. Synthesis and study of zinc oxide nanoparticles for dye sensitized solar cell. Res. J. Phys. Sci. 2017, 5, 6–10. [Google Scholar]
- Sarkar, K. Nanostructured Zinc Oxide Films for Application in Photovoltaics. Ph.D. Thesis, Technische Universität München, München, Germany, 2014. [Google Scholar]
- Shameem, A.; Devendran, P.; Siva, V.; Raja, M.; Bahadur, S.A.; Manikandan, A. Preparation and Characterization Studies of Nanostructured CdO Thin Films by SILAR Method for Photocatalytic Applications. J. Inorg. Organometallic Polym. Mater. 2017, 27, 692–699. [Google Scholar] [CrossRef]
- Shaban, M.; Zayed, M.; Hamdy, H. Nanostructured ZnO thin films for self-Cleaning applications. RSC Adv. 2017, 7, 617–631. [Google Scholar] [CrossRef]
- Vorokh, A. Scherrer formula: Estimation of error in determining small nanoparticle size. Nanosyst. Phys. Chem. Math. 2018, 9, 364–369. [Google Scholar] [CrossRef] [Green Version]
- Hirsch, P.B. Elements of X-ray Diffraction. Phys. Bull. 1957, 8, 237–238. [Google Scholar] [CrossRef]
- Hanif, H.; Murtaza, G.; Arif, H.S. Investigation of Structural, Morphological, Electronic and Optical Properties of Au Irradiated Ni Doped ZnO Thin Films prepared by Pulsed Laser Deposition. Int. J. Magn. Nucl. Sci. 2016, 2, 24–32. [Google Scholar] [CrossRef]
- Stokes, A.R.; Wilson, A.J.C. The diffraction of X rays by distorted crystal aggregates—I. Proc. Phys. Soc. 1944, 56, 174–181. [Google Scholar] [CrossRef]
- Stefani, D. Growth and Characterization of Nanostructured Au Doped Zinc Oxide Thin Films by RF Magnetron Co-Sputtering. Master’s Thesis, Università degli Studi di Padova, Padova, Italy, 2015. [Google Scholar]
- Perumal, V.; Hashim, U.; Gopinath, S.C.; Haarindraprasad, R.; Liu, W.W.; Poopalan, P.; Balakrishnan, S.R.; Thivina, V.; Ruslinda, A.R. Thickness dependent nanostructural, Morphological, Optical and impedometric analyses of zinc oxide-Gold hybrids: Nanoparticle to thin film. PLoS ONE 2015, 10, e0144964. [Google Scholar] [CrossRef]
- Aydogu, S.; Sendil, O.; Coban, M.B. Deposited by the Spray Pyrolysis Technique. Chin. J. Phys. 2012, 50, 89–100. [Google Scholar]
- Williamson, G.K.; Smallman, R.E., III. Dislocation densities in some annealed and cold-worked metals from measurements on the X-ray debye-scherrer spectrum. Philos. Mag. J. Theor. Exp. Appl. Phys. 1956, 1, 34–46. [Google Scholar] [CrossRef]
- Della Gaspera, E.; Guglielmi, M.; Martucci, A.; Giancaterini, L.; Cantalini, C. Enhanced optical and electrical gas sensing response of sol-gel based NiO-Au and ZnO-Au nanostructured thin films. Sens. Actuators B Chem. 2012, 164, 54–63. [Google Scholar] [CrossRef]
- Kang, Z.; Yan, X.; Zhao, L.; Liao, Q.; Zhao, K.; Du, H.; Zhang, X.; Zhang, X.; Zhang, Y. Gold nanoparticle/ZnO nanorod hybrids for enhanced reactive oxygen species generation and photodynamic therapy. Nano Res. 2015, 8, 2004–2014. [Google Scholar] [CrossRef]
- Peralta, M.D.L.R.; Pal, U.; Zeferino, R.S. Photoluminescence (PL) Quenching and Enhanced Photocatalytic Activity of Au-Decorated ZnO Nanorods Fabricated through Microwave-Assisted Chemical Synthesis. ACS Appl. Mater. Interfaces 2012, 4, 4807–4816. [Google Scholar] [CrossRef]
- Viter, R.; Balevicius, Z.; Chaaya, A.A.; Baleviciute, I.; Tumenas, S.; Mikoliunaite, L.; Ramanavicius, A.; Gertnere, Z.; Zalesska, A.; Vataman, V.; et al. The influence of localized plasmons on the optical properties of Au/ZnO nanostructures. J. Mater. Chem. C 2015, 3, 6815–6821. [Google Scholar] [CrossRef]
- Chamorro, W.; Ghanbaja, J.; Battie, Y.; Naciri, A.E.; Soldera, F.; Mücklich, F.; Horwat, D. Local Structure-Driven Localized Surface Plasmon Absorption and Enhanced Photoluminescence in ZnO-Au Thin Films. J. Phys. Chem. C 2016, 120, 29405–29413. [Google Scholar] [CrossRef] [Green Version]
- Peh, C.; Ke, L.; Ho, G. Modification of ZnO nanorods through Au nanoparticles surface coating for dye-sensitized solar cells applications. Mater. Lett. 2010, 64, 1372–1375. [Google Scholar] [CrossRef]
- Tauc, J.; Grigorovici, R.; Vancu, A. Optical Properties and Electronic Structure of Amorphous Germanium. Phys. Status Solidi B 1966, 15, 627–637. [Google Scholar] [CrossRef]
- Najim, S.A.; Jamil, N.Y.; Muhammed, K.M. Effect of Au Dopant on the Structural and Optical Properties of ZnO Thin Films Prepared by CVD. J. Nano-Electron. Phys. 2019, 11, 020031. [Google Scholar] [CrossRef]
- Karki, B.; Nakarmi, J.J.; Singh, R.B.; Banerjee, M. Fabrication of Au: ZnO thin films by a solution-assisted route for application in photo-electrocatalytic degradation of methylene blue (MB). Adv. Mater. Proc. 2017, 2, 575–580. [Google Scholar]
- Stefan, M.; Popa, A.; Toloman, D.; Leostean, C.; Barbu-Tudoran, L.; Falamas, A. Enhanced Plasmonic Photocatalysis of Au-Decorated ZnO Nanocomposites. Inorganics 2023, 11, 157. [Google Scholar] [CrossRef]
- Sahu, D.; Panda, N.R.; Acharya, B.S.; Panda, A.K. Enhanced UV absorbance and photoluminescence properties of ultra-sound assisted synthesized gold doped ZnO nanorods. Opt. Mater. 2014, 36, 1402–1407. [Google Scholar] [CrossRef]
- Geng, J.; Song, G.-H.; Jia, X.-D.; Cheng, F.-F.; Zhu, J.-J. Fast One-Step Synthesis of Biocompatible ZnO/Au Nanocomposites with Hollow Doughnut-Like and Other Controlled Morphologies. J. Phys. Chem. C 2012, 116, 4517–4525. [Google Scholar] [CrossRef]
- Fatehmulla, A.; AlDawood, I.A.; Qindeel, R.; Aldhafiri, A.M.; Albassam, A.A.; Shahabuddin, M.; Fraooq, Q.A.; Yakuphanoglu, F. Bandgap Tuning and Blue-Green Band Emissions of Sol–Gel Synthesized ZnO Films by High Cu Doping. J. Nanosci. Nanotechnol. 2020, 20, 5217–5222. [Google Scholar] [CrossRef]
- Khan, M.M.; Pradhan, D.; Sohn, Y. (Eds.) Nanocomposites for Visible Light-Induced Photocatalysis; Springer International Publishing: Cham, Switzerland, 2017; Volume 101. [Google Scholar]
- Mondal, C.; Pal, J.; Ganguly, M.; Sinha, A.K.; Jana, J.; Pal, T. A one pot synthesis of Au–ZnO nanocomposites for plasmon-enhanced sunlight driven photocatalytic activity. New J. Chem. 2014, 38, 2999–3005. [Google Scholar] [CrossRef]
- Verma, S.; Rao, B.T.; Singh, R.; Kaul, R. Photocatalytic degradation kinetics of cationic and anionic dyes using Au–ZnO nanorods: Role of pH for selective and simultaneous degradation of binary dye mixtures. Ceram. Int. 2021, 47, 34751–34764. [Google Scholar] [CrossRef]


| Au NP Size (nm) | Average Crystallite Size from XRD (nm) | Lattice Strain (%) | Dislocation Density (nm−2) |
|---|---|---|---|
| 0 nm | 30.56 | 5.78 × 10⁻³ | 0.001998596 |
| 5 nm | 89.32 | 4.86 × 10⁻³ | 0.002493226 |
| 7 nm | 54.37 | 3.76 × 10⁻³ | 0.000962403 |
| 10 nm | 47.49 | 3.15 × 10⁻³ | 0.000535229 |
| 15 nm | 112.88 | 3.40 × 10⁻³ | 0.000785233 |
| Pure ZnO | ZnO: Au (5 nm) | ZnO: Au (7 nm) | ZnO: Au (10 nm) | ZnO: Au (15 nm) | ||||||
|---|---|---|---|---|---|---|---|---|---|---|
| Weight% | Atomic% | Weight% | Atomic% | Weight% | Atomic% | Weight% | Atomic% | Weight% | Atomic% | |
| Zn | 60.89 | 27.59 | 70.25 | 35.99 | 67.35 | 34.36 | 70.50 | 37.09 | 72.22 | 30.34 |
| O | 39.11 | 72.41 | 30.65 | 64.16 | 31.38 | 65.42 | 29.25 | 62.87 | 27.21 | 60.56 |
| Au | 0 | 0 | −0.91 | −0.15 | 1.27 | 0.22 | 0.25 | 0.04 | 0.58 | 0.10 |
| Total | 100 | 100 | 100 | 100 | 100 | 100 | 100 | 100 | 100 | 100 |
| Characterizations | Pure ZnO | ZnO: Au (5 nm) | ZnO: Au (7 nm) | ZnO: Au (10 nm) | ZnO: Au (15 nm) |
|---|---|---|---|---|---|
| FESEM average Particle size (nm) | 34.39 | 63.13 | 62.22 | 71.48 | 76.17 |
| HRTEM average Particle size (nm) | 9.00 | 6.00 | 8.00 | 5.00 | 6.00 |
| Au Concentration | Band Gap (eV) |
|---|---|
| 0 nm | 3.280 |
| 5 nm | 3.245 |
| 7 nm | 3.241 |
| 10 nm | 3.238 |
| 15 nm | 3.200 |
| S. No. | Catalyst with MB | Overlap Time Degradation in the Spectrum Efficiency (Minutes) (%) |
|---|---|---|
| 1 | Pure ZnO | 120 90.2 |
| 2 | ZnO: Au 5 nm | 245 74.5 |
| 3 | ZnO: Au 7 nm | 240 63.8 |
| 4 | ZnO: Au 10 nm | 240 49.6 |
| 5 | ZnO: Au 15 nm | 170 34 |
Disclaimer/Publisher’s Note: The statements, opinions and data contained in all publications are solely those of the individual author(s) and contributor(s) and not of MDPI and/or the editor(s). MDPI and/or the editor(s) disclaim responsibility for any injury to people or property resulting from any ideas, methods, instructions or products referred to in the content. |
© 2023 by the authors. Licensee MDPI, Basel, Switzerland. This article is an open access article distributed under the terms and conditions of the Creative Commons Attribution (CC BY) license (https://creativecommons.org/licenses/by/4.0/).
Share and Cite
Fatehmulla, A.; Shamsan, B.A.; El-Naggar, A.M.; Aldhafiri, A.M.; Qureshi, N.; Kim, T.; Atif, M.; Mahmood, A.; Asif, M. Physical Characteristics, Blue-Green Band Emission and Photocatalytic Activity of Au-Decorated ZnO Quantum Dots-Based Thick Films Prepared Using the Doctor Blade Technique. Molecules 2023, 28, 4644. https://doi.org/10.3390/molecules28124644
Fatehmulla A, Shamsan BA, El-Naggar AM, Aldhafiri AM, Qureshi N, Kim T, Atif M, Mahmood A, Asif M. Physical Characteristics, Blue-Green Band Emission and Photocatalytic Activity of Au-Decorated ZnO Quantum Dots-Based Thick Films Prepared Using the Doctor Blade Technique. Molecules. 2023; 28(12):4644. https://doi.org/10.3390/molecules28124644
Chicago/Turabian StyleFatehmulla, Amanullah, Belqes A. Shamsan, Ahmed M. El-Naggar, Abdullah M. Aldhafiri, Nilam Qureshi, Taesung Kim, Muhammad Atif, Asif Mahmood, and Mohammad Asif. 2023. "Physical Characteristics, Blue-Green Band Emission and Photocatalytic Activity of Au-Decorated ZnO Quantum Dots-Based Thick Films Prepared Using the Doctor Blade Technique" Molecules 28, no. 12: 4644. https://doi.org/10.3390/molecules28124644