
Production of Sorbitol via Hydrogenation of Glucose over Ruthenium Coordinated with Amino Styrene-co-maleic Anhydride Polymer Encapsulated on Activated Carbon (Ru/ASMA@AC) Catalyst
Abstract
:1. Introduction
2. Results and Discussion
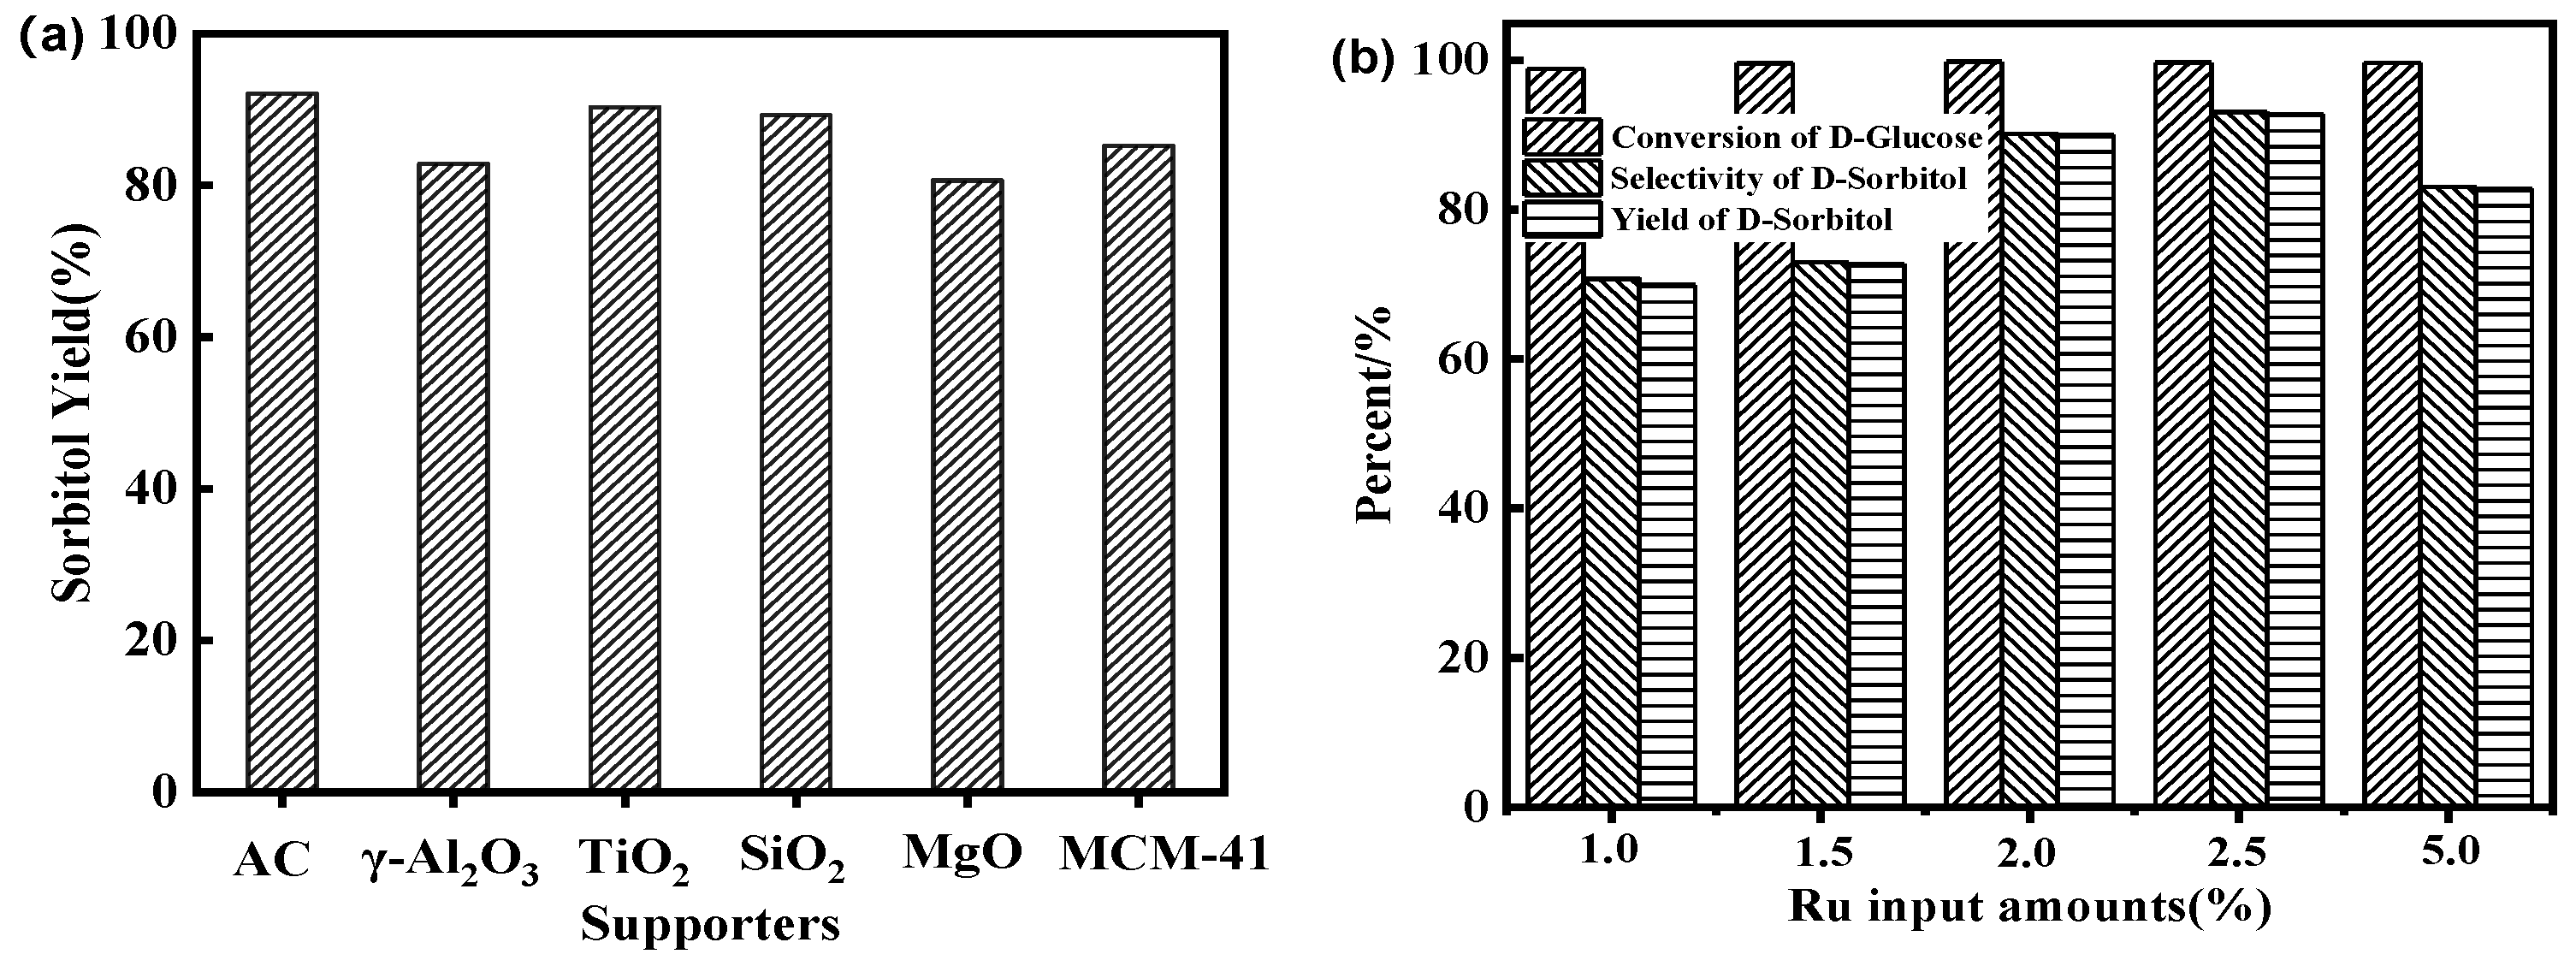
2.1. Effects of Catalyst Preparation on Glucose Hydrogenation
2.2. Catalyst Characterization
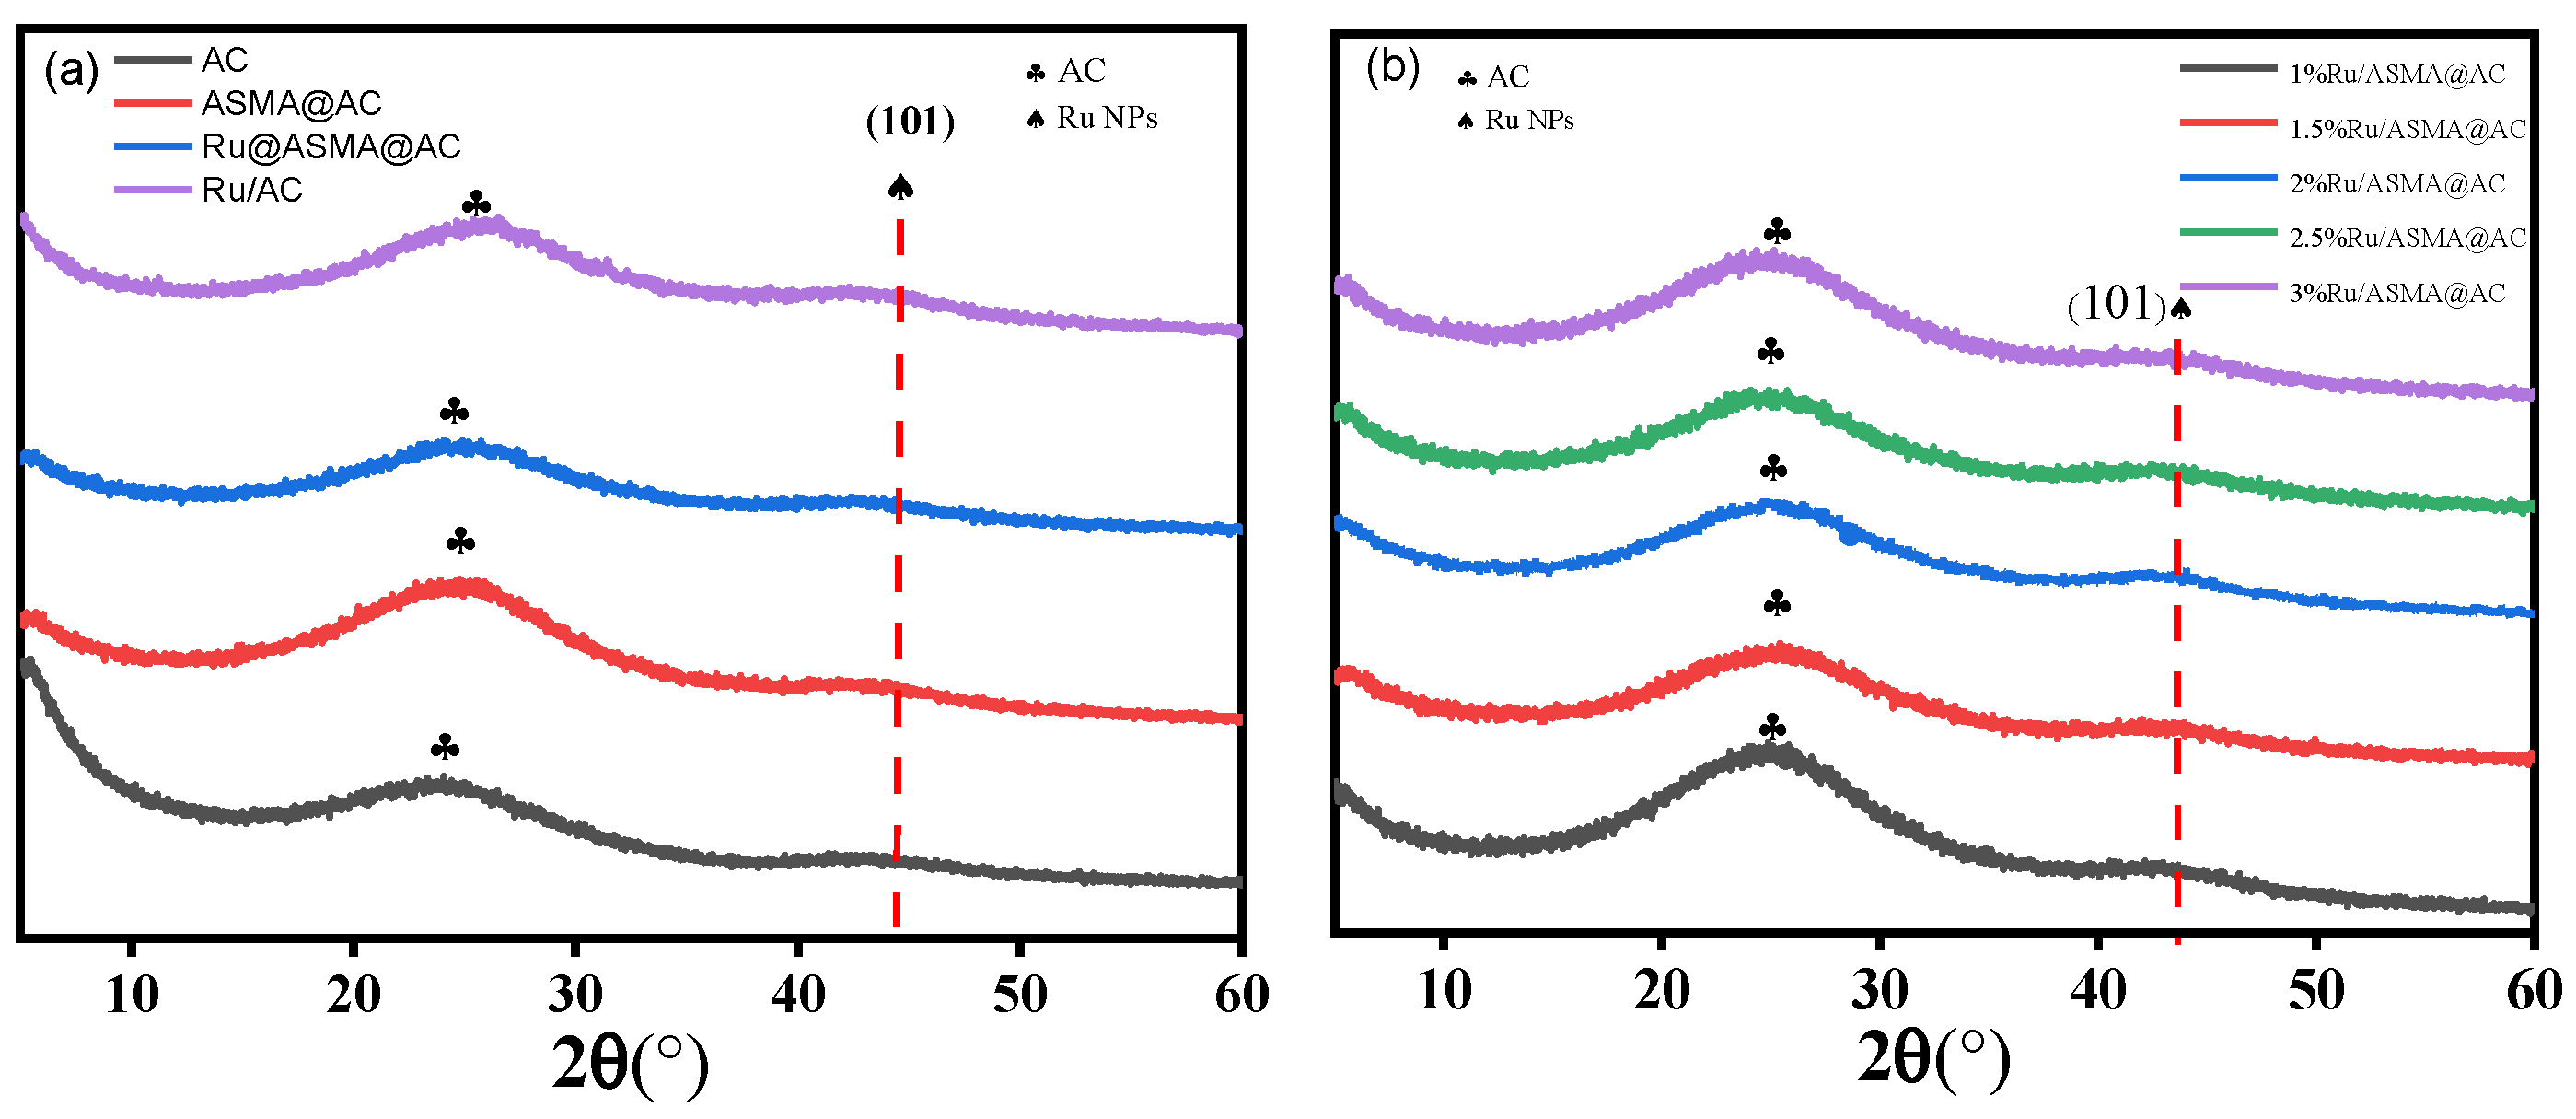
2.2.1. XRD Results
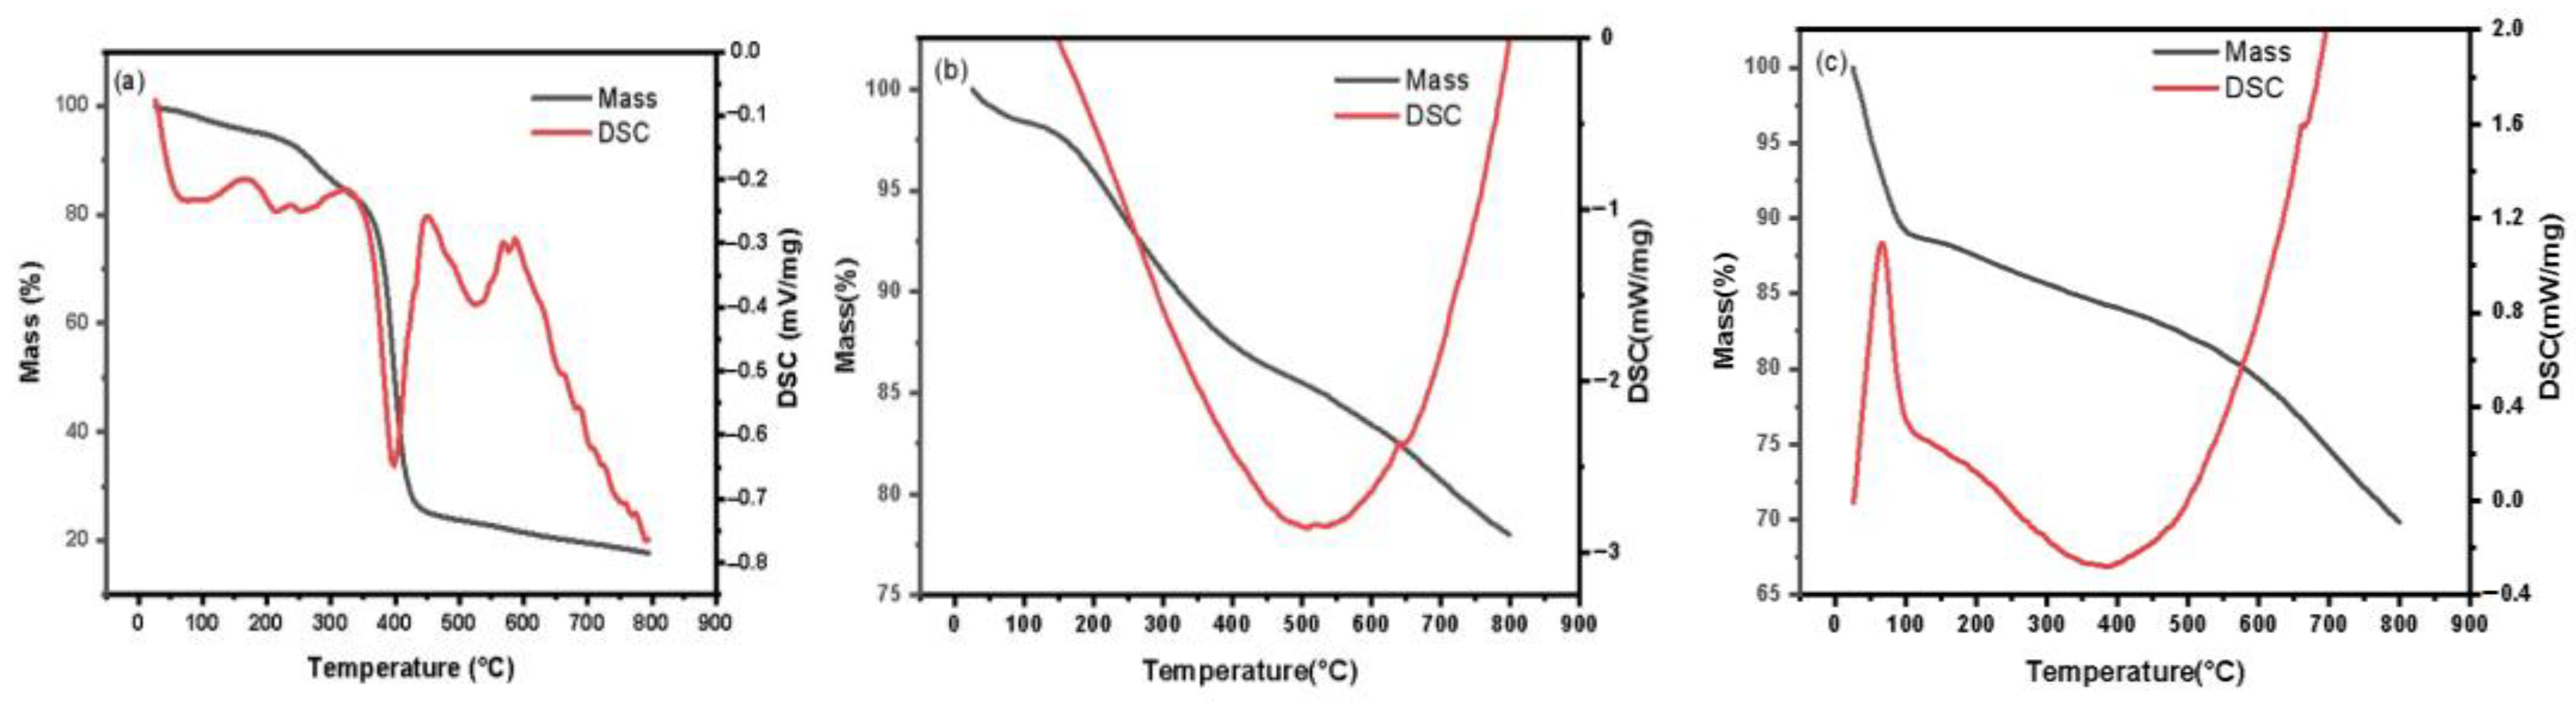
2.2.2. TGA–DSC Results
2.2.3. N2-Adsorption and Desorption Results
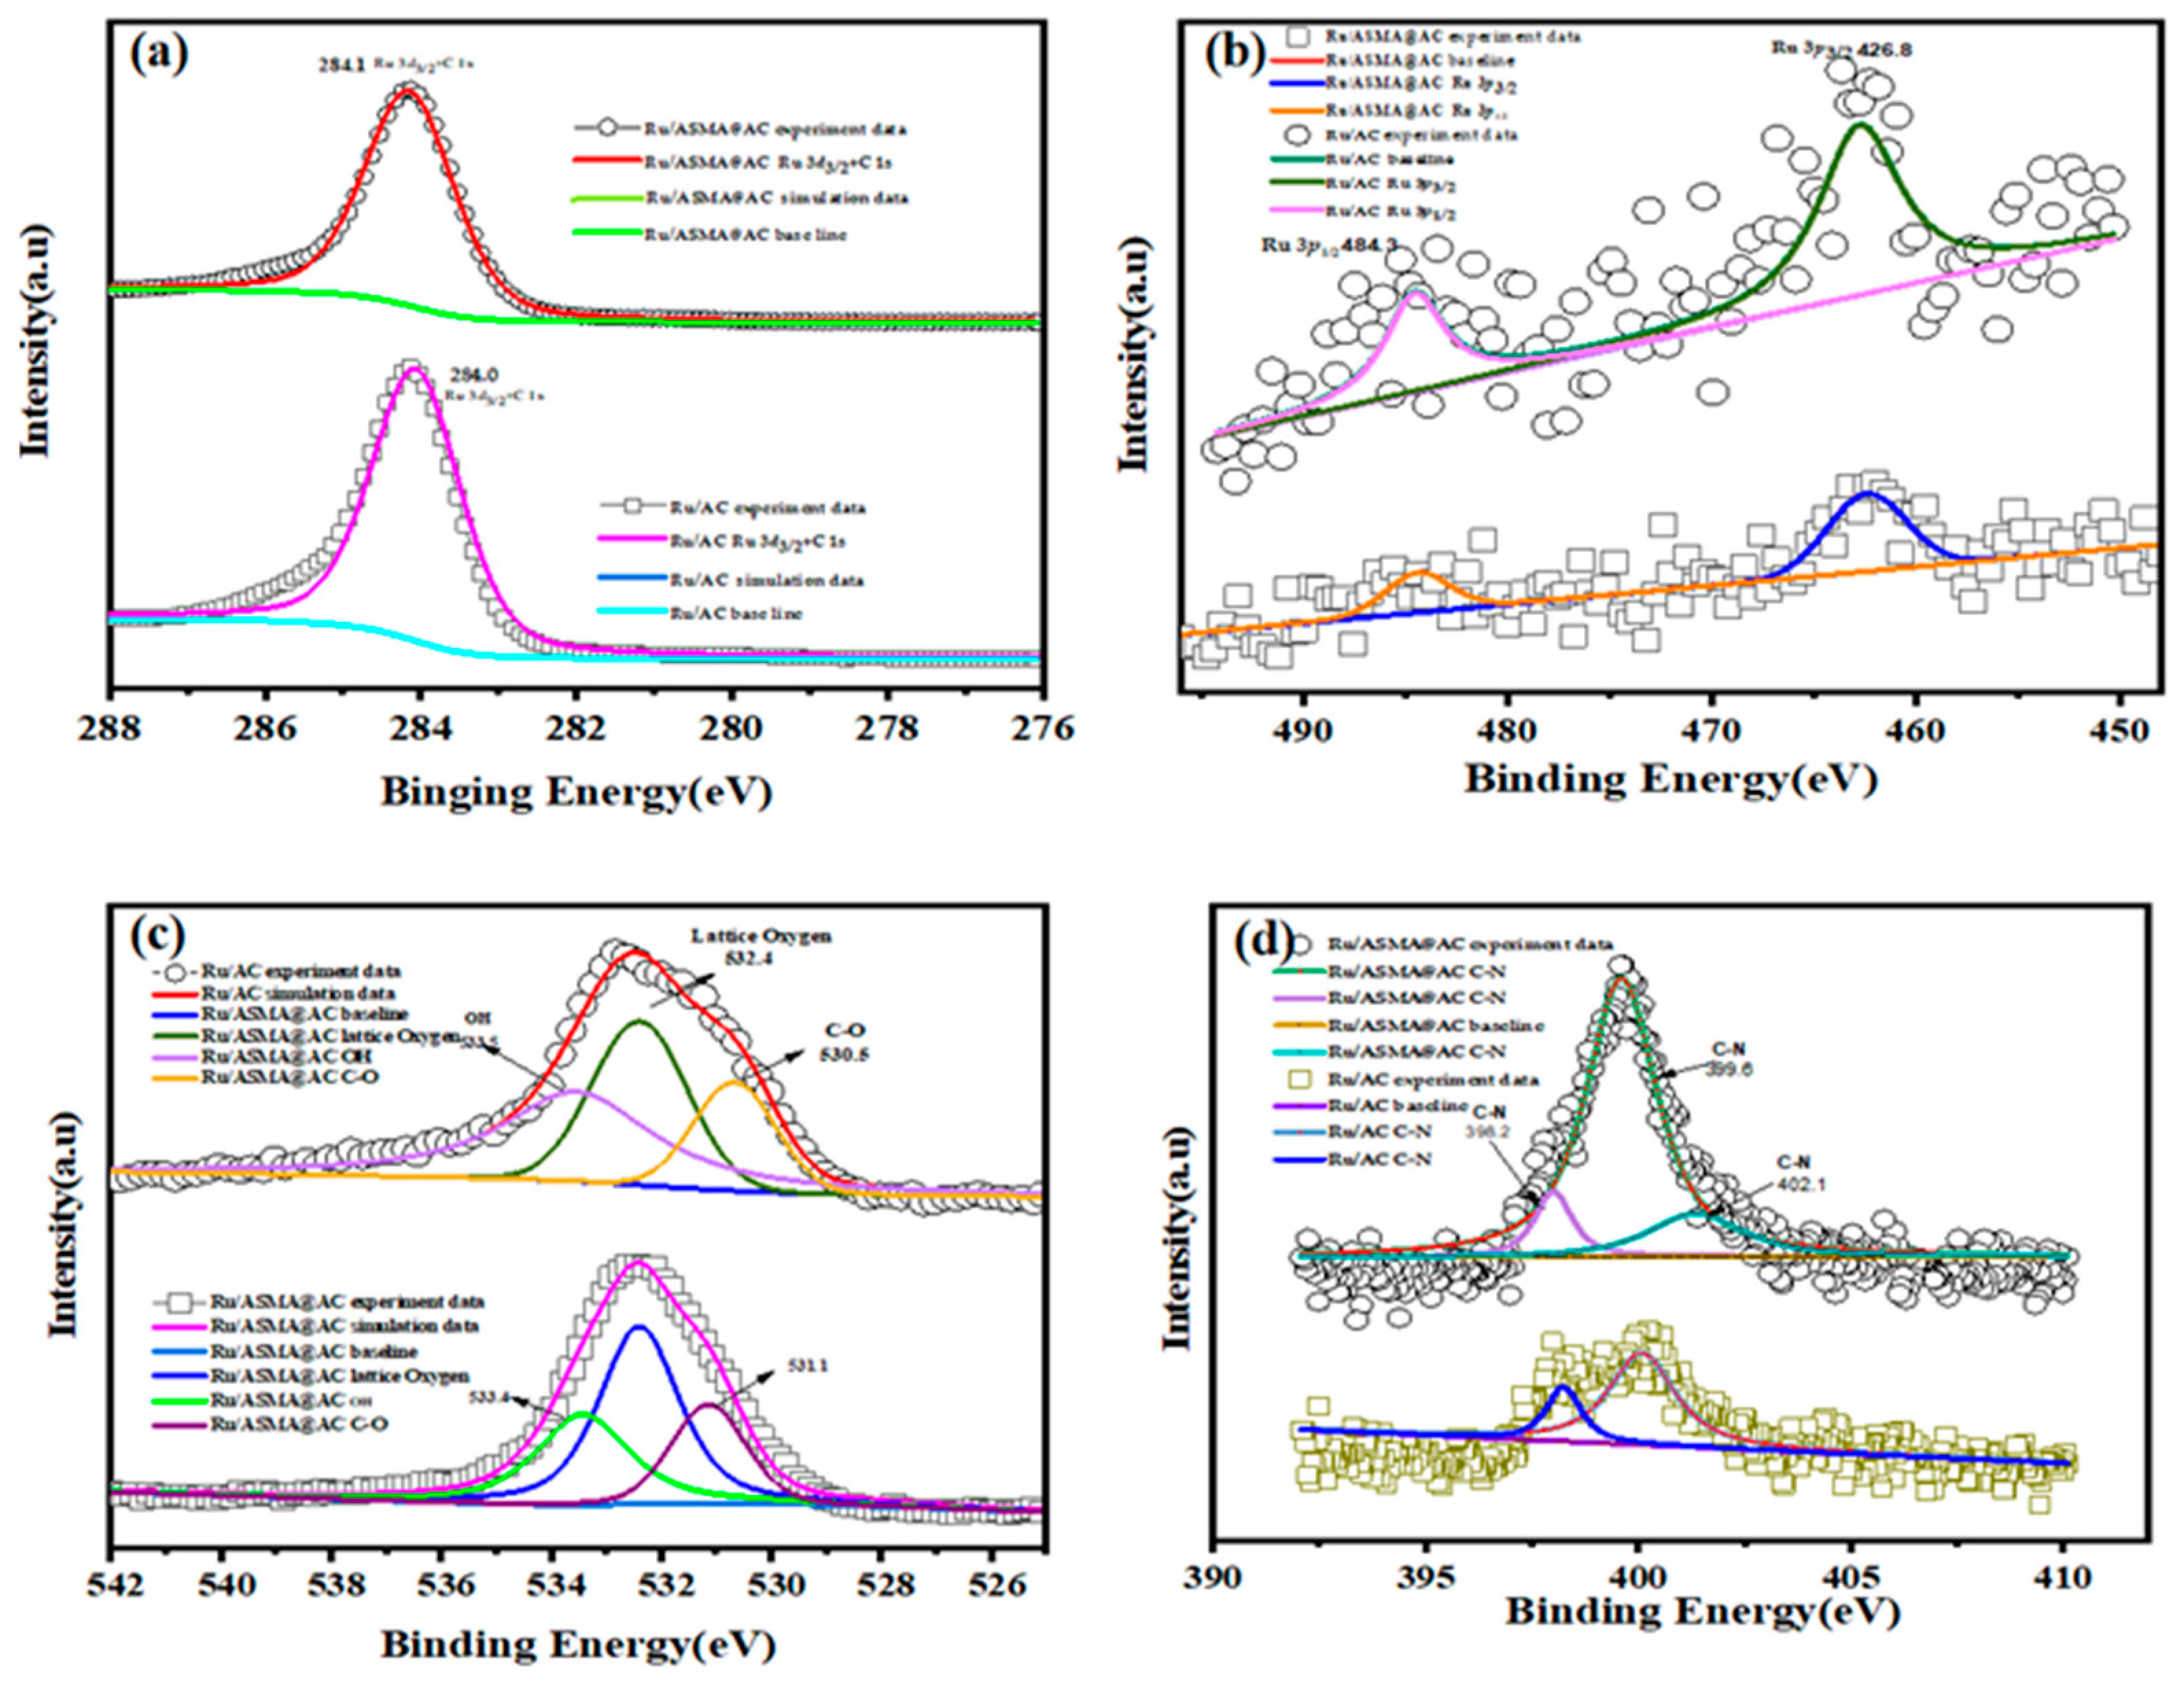
2.2.4. XPS Results
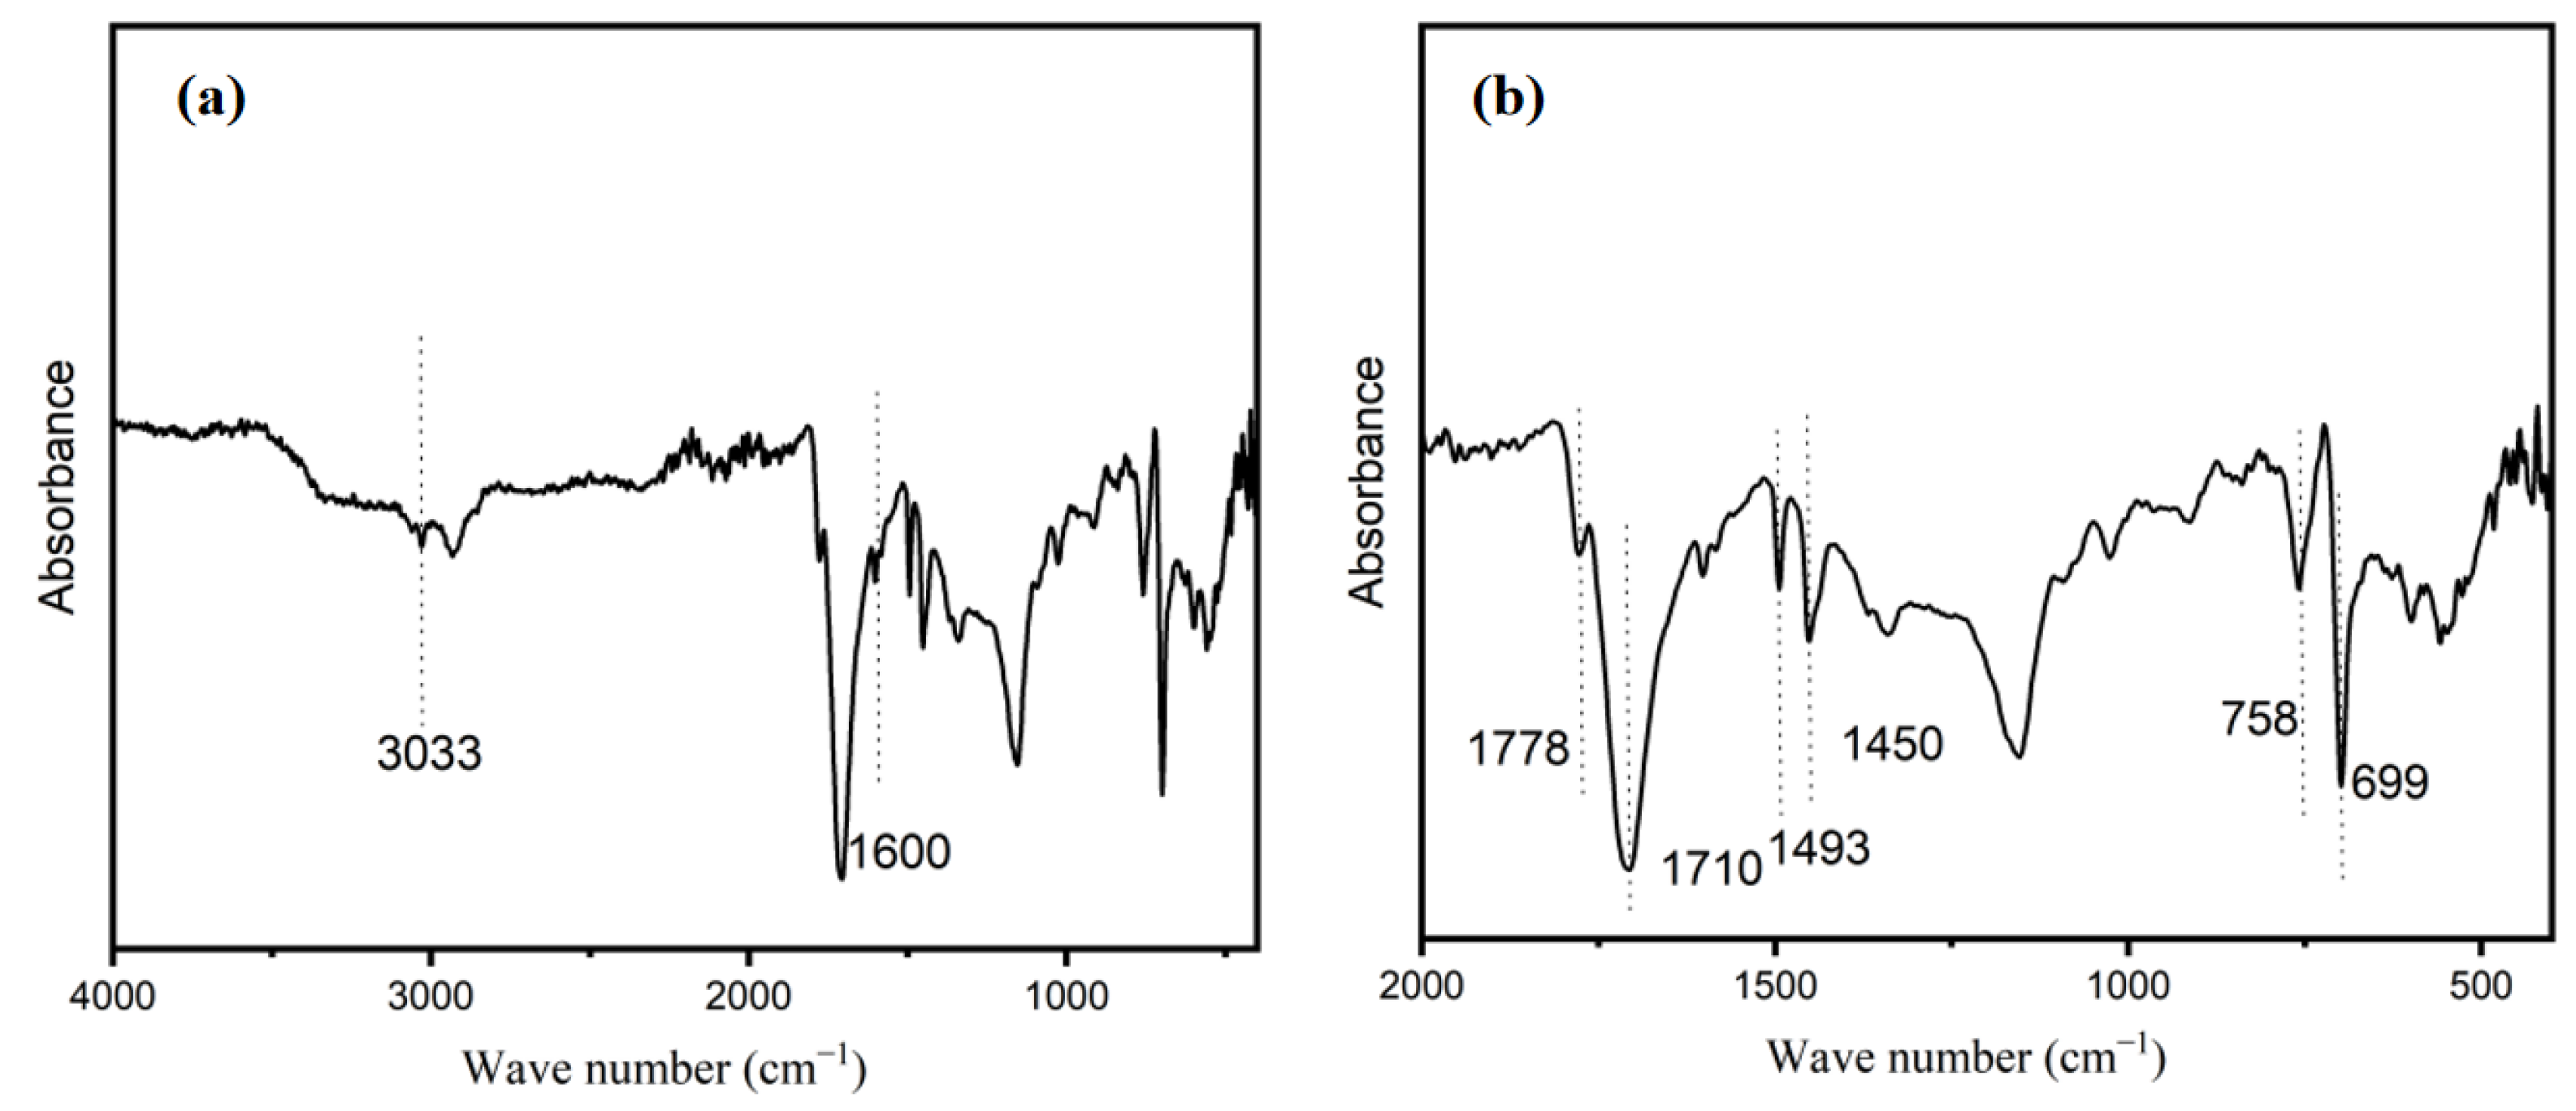
2.2.5. FTIR Results
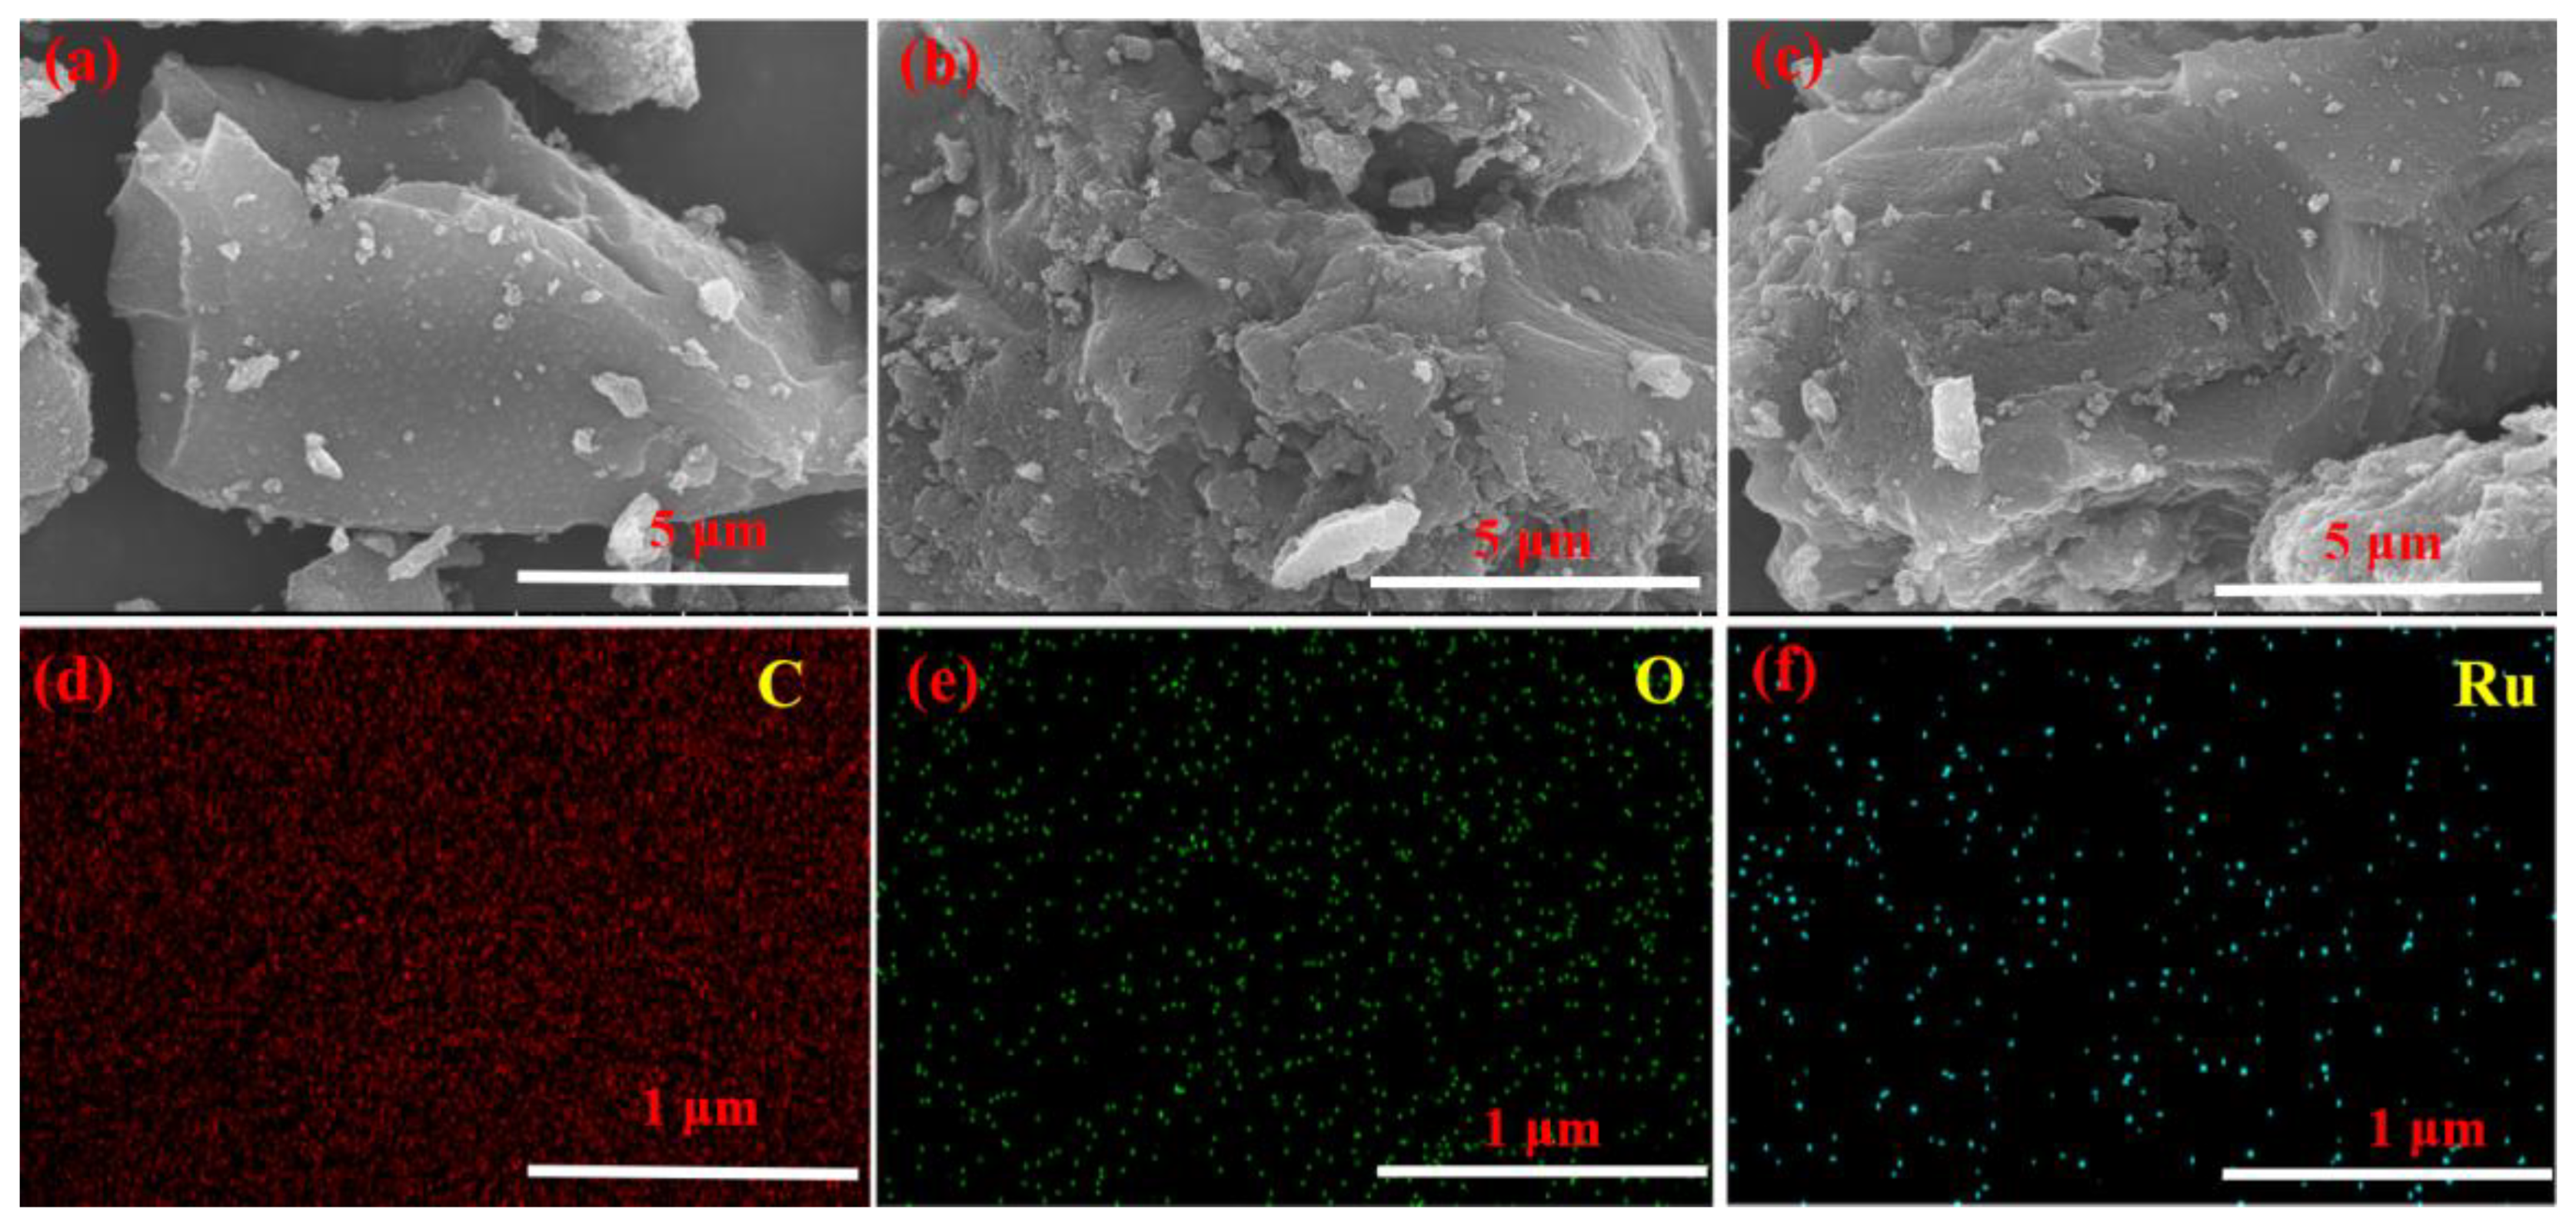
2.2.6. SEM Results
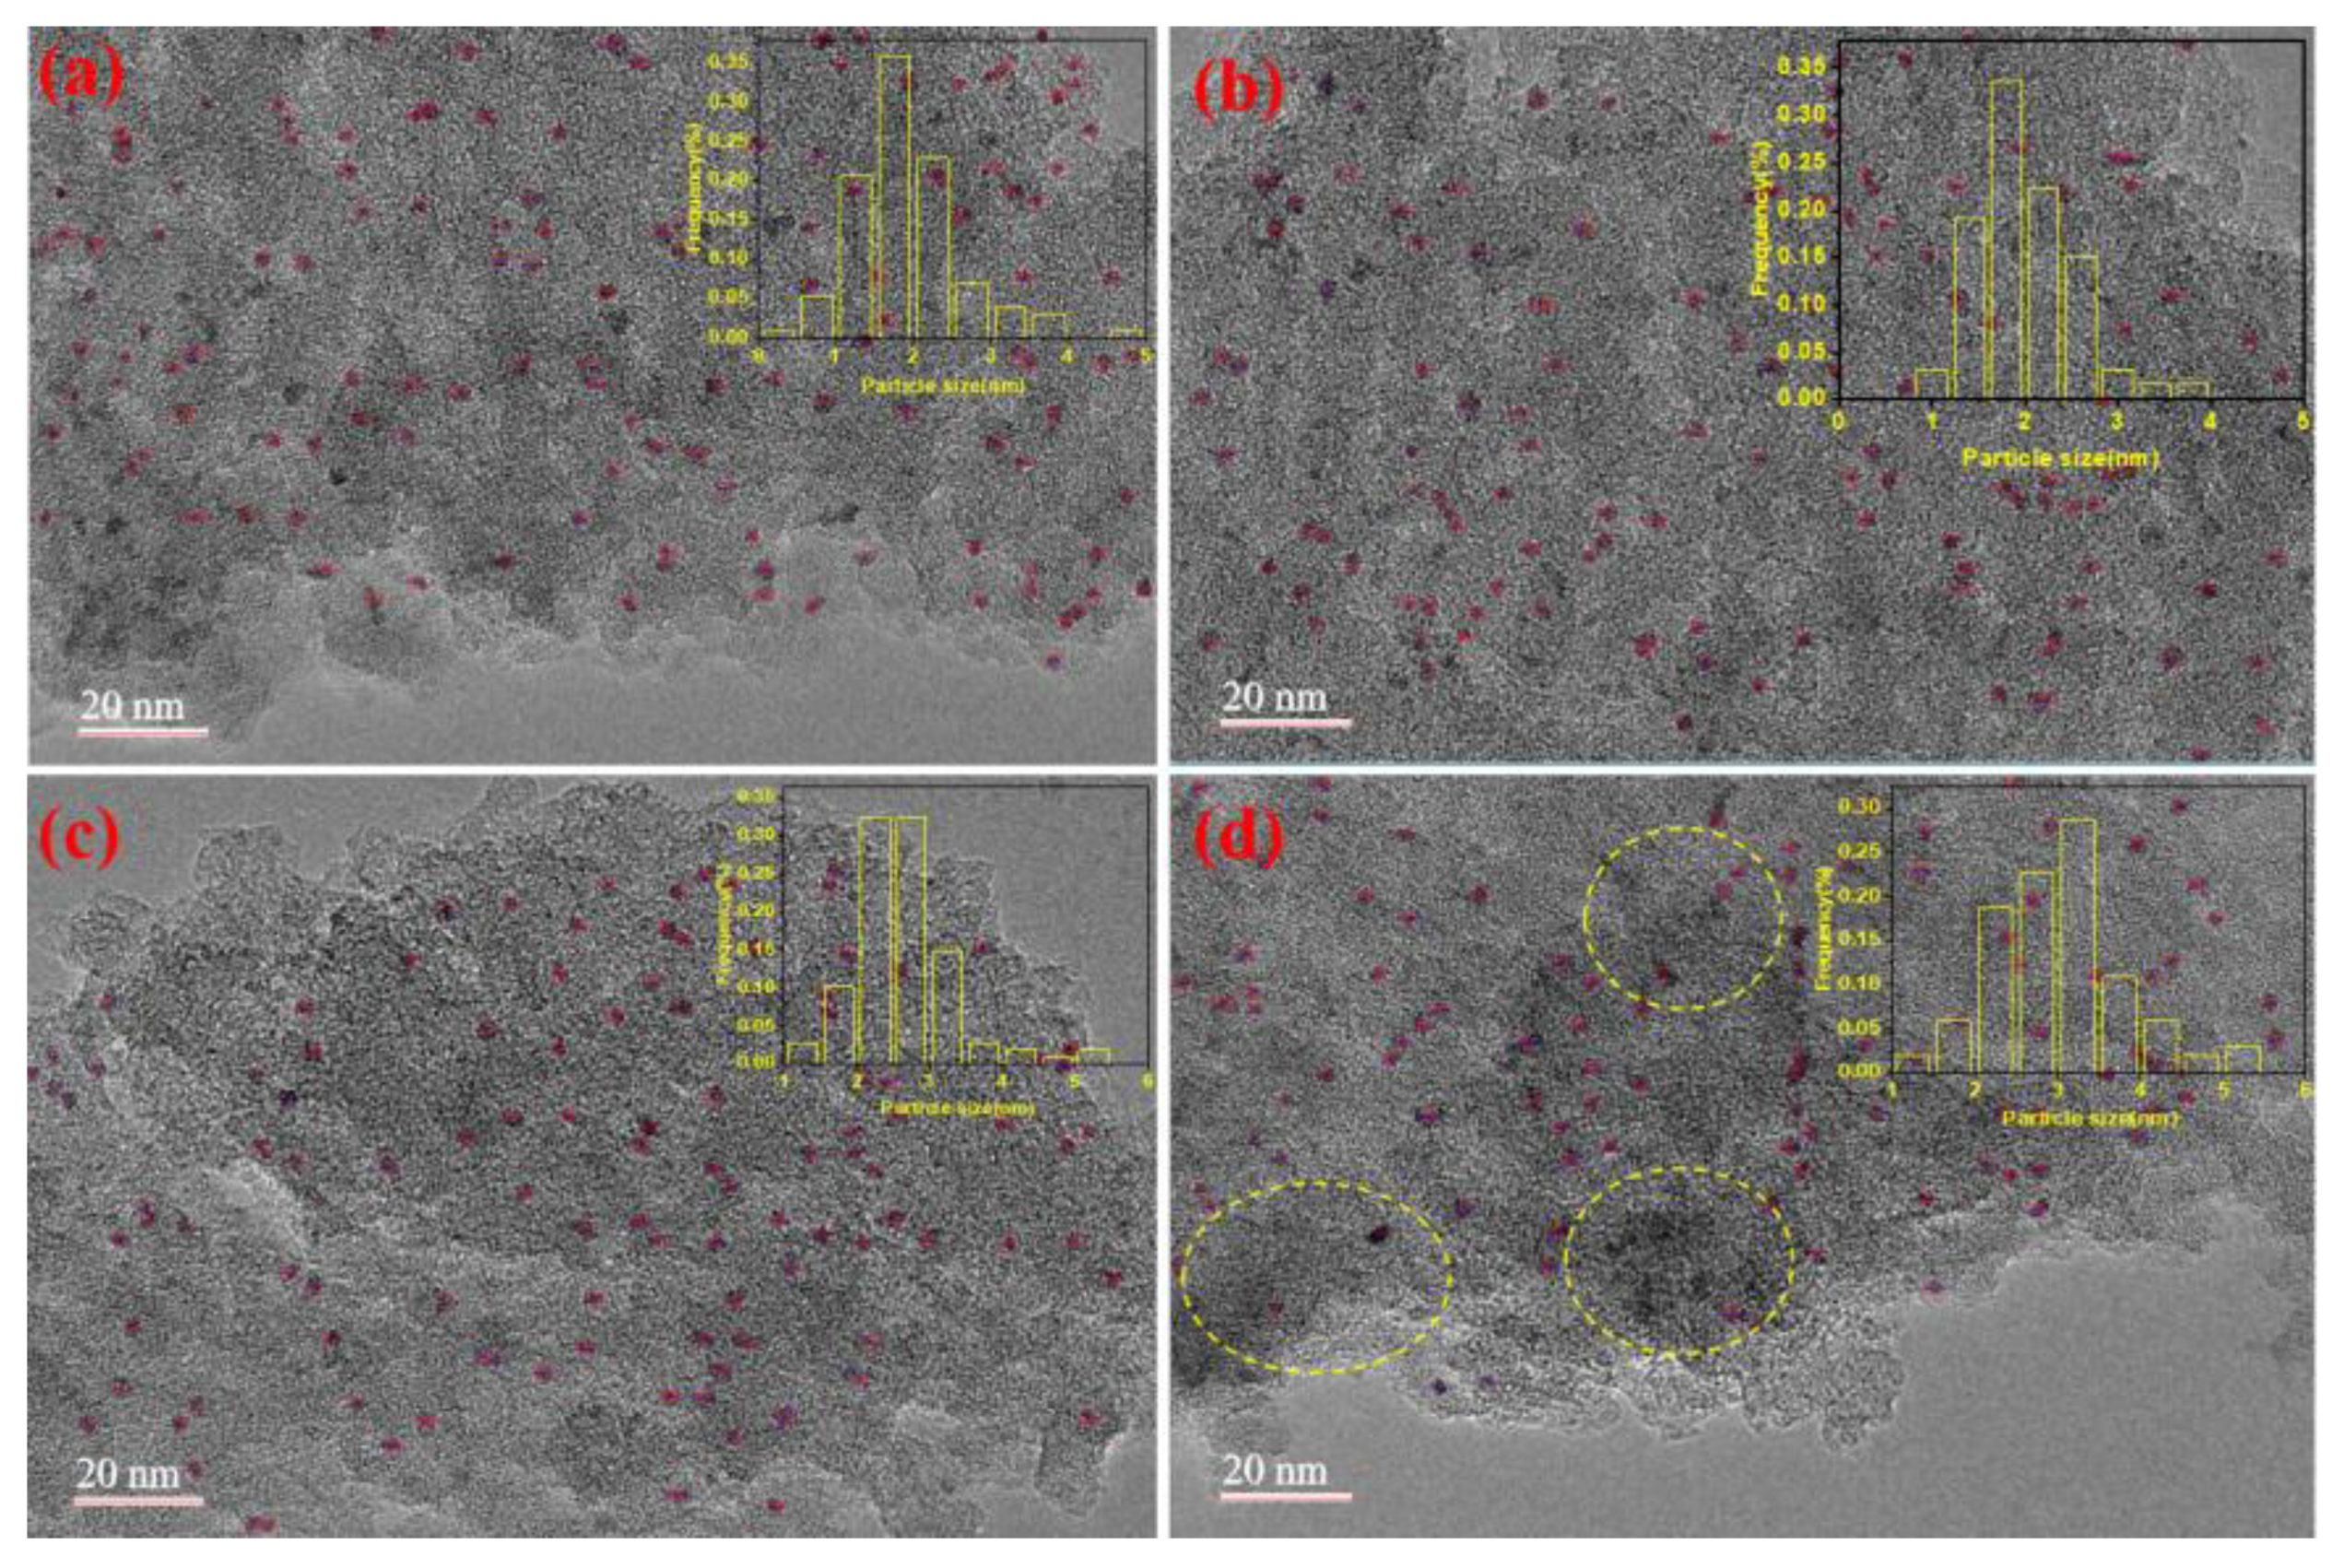
2.2.7. TEM Results
2.3. Ru/ASMA@AC Catalyst Ability
2.4. Study on Catalytic Reaction Kinetics
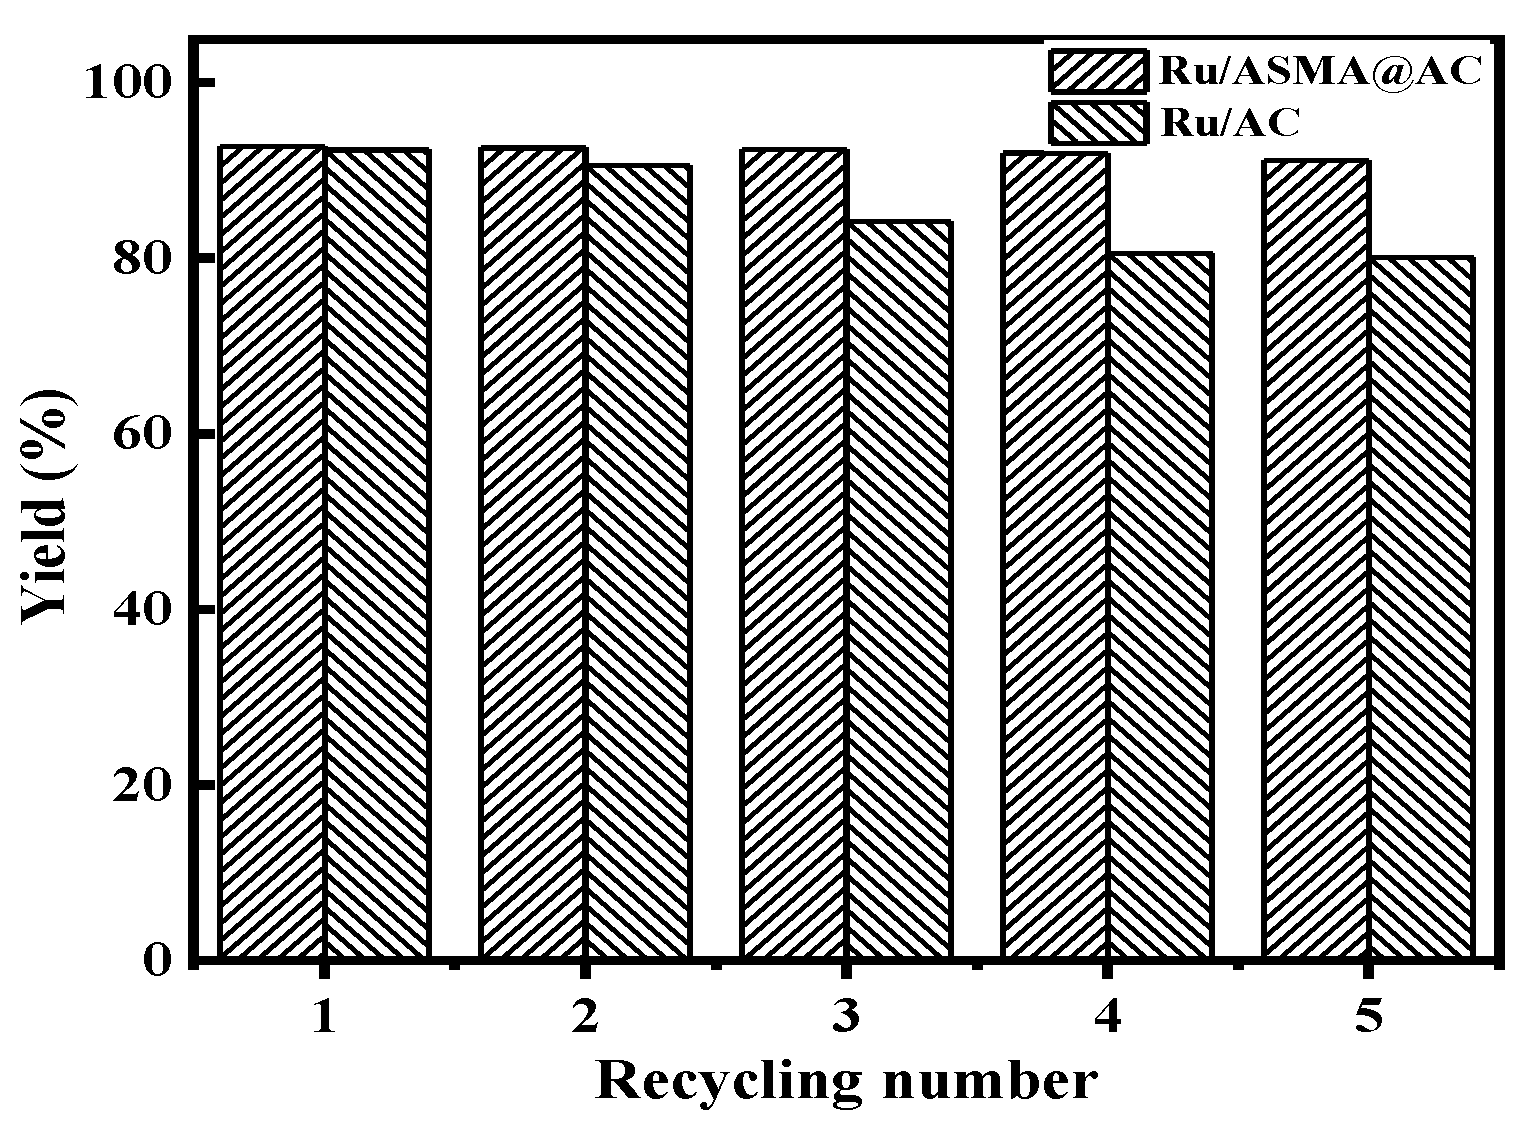
2.5. Catalyst Reuse Test
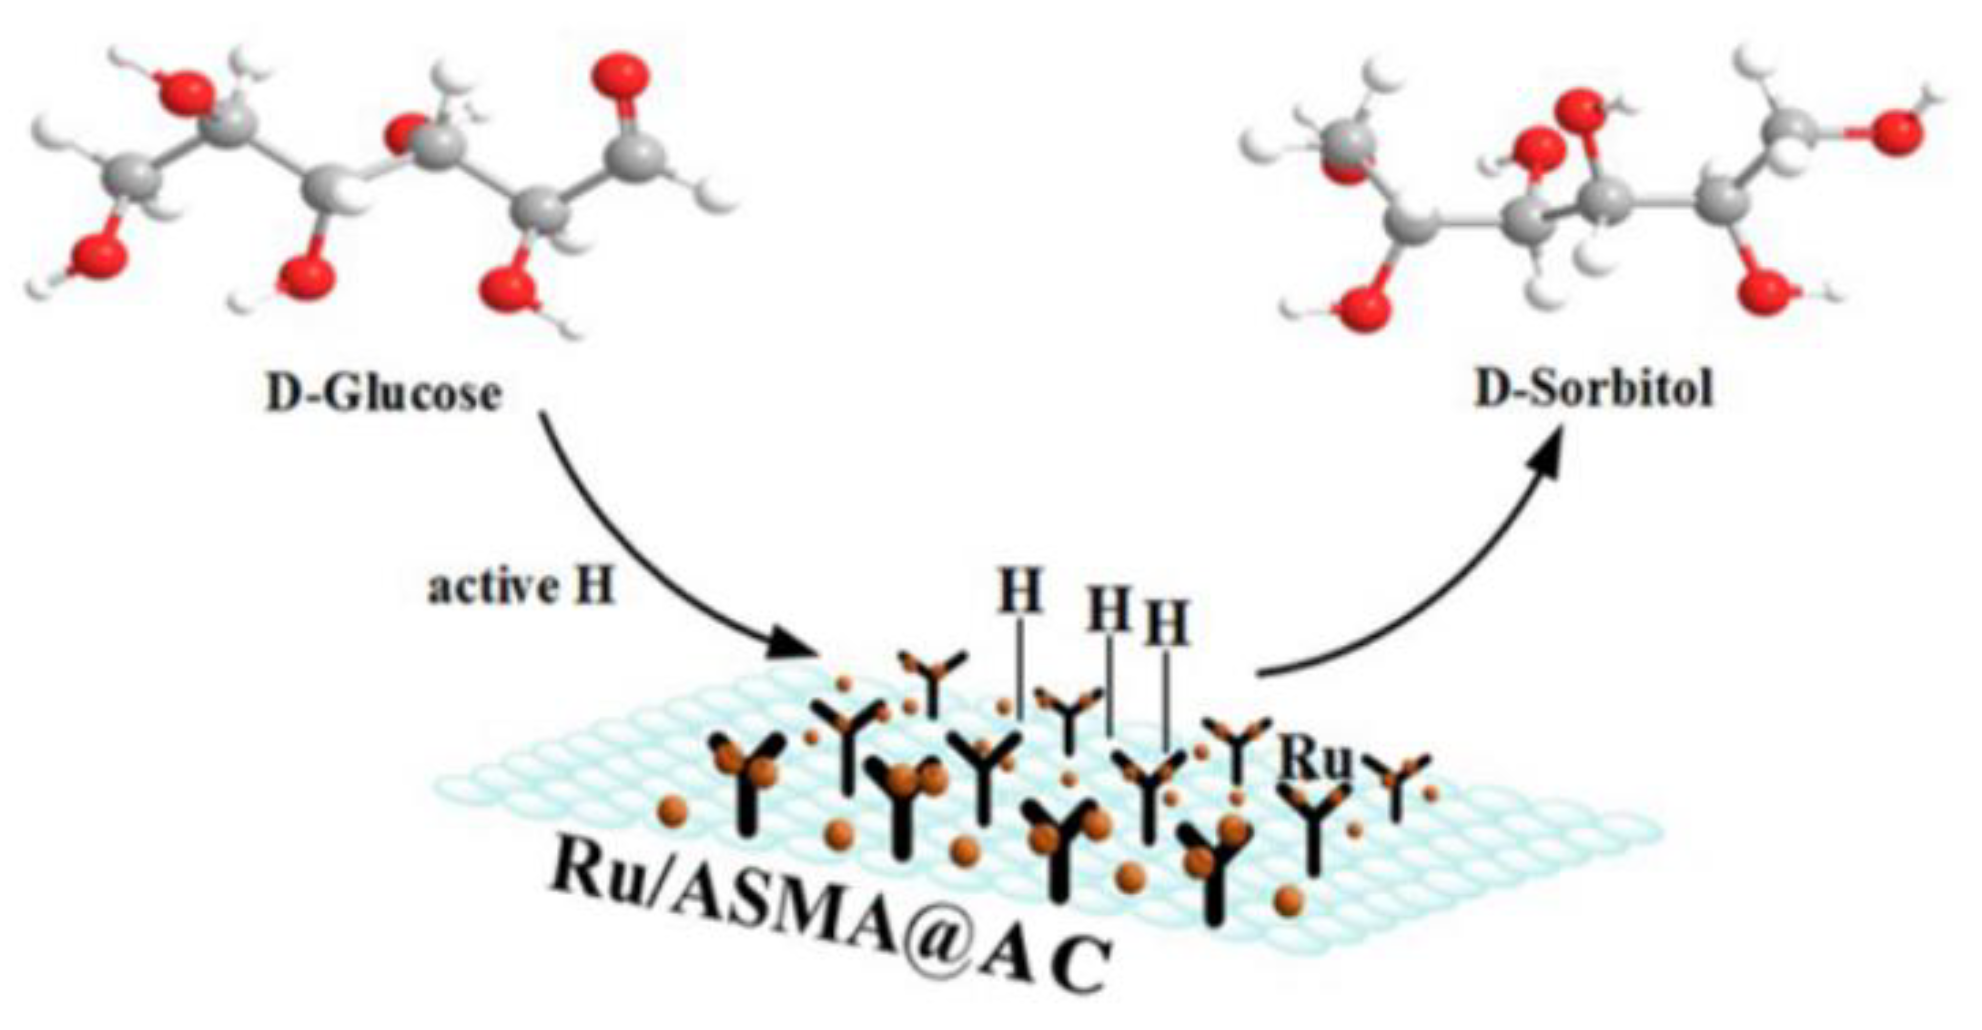
2.6. Reaction Mechanism
3. Materials and Methods
3.1. Materials
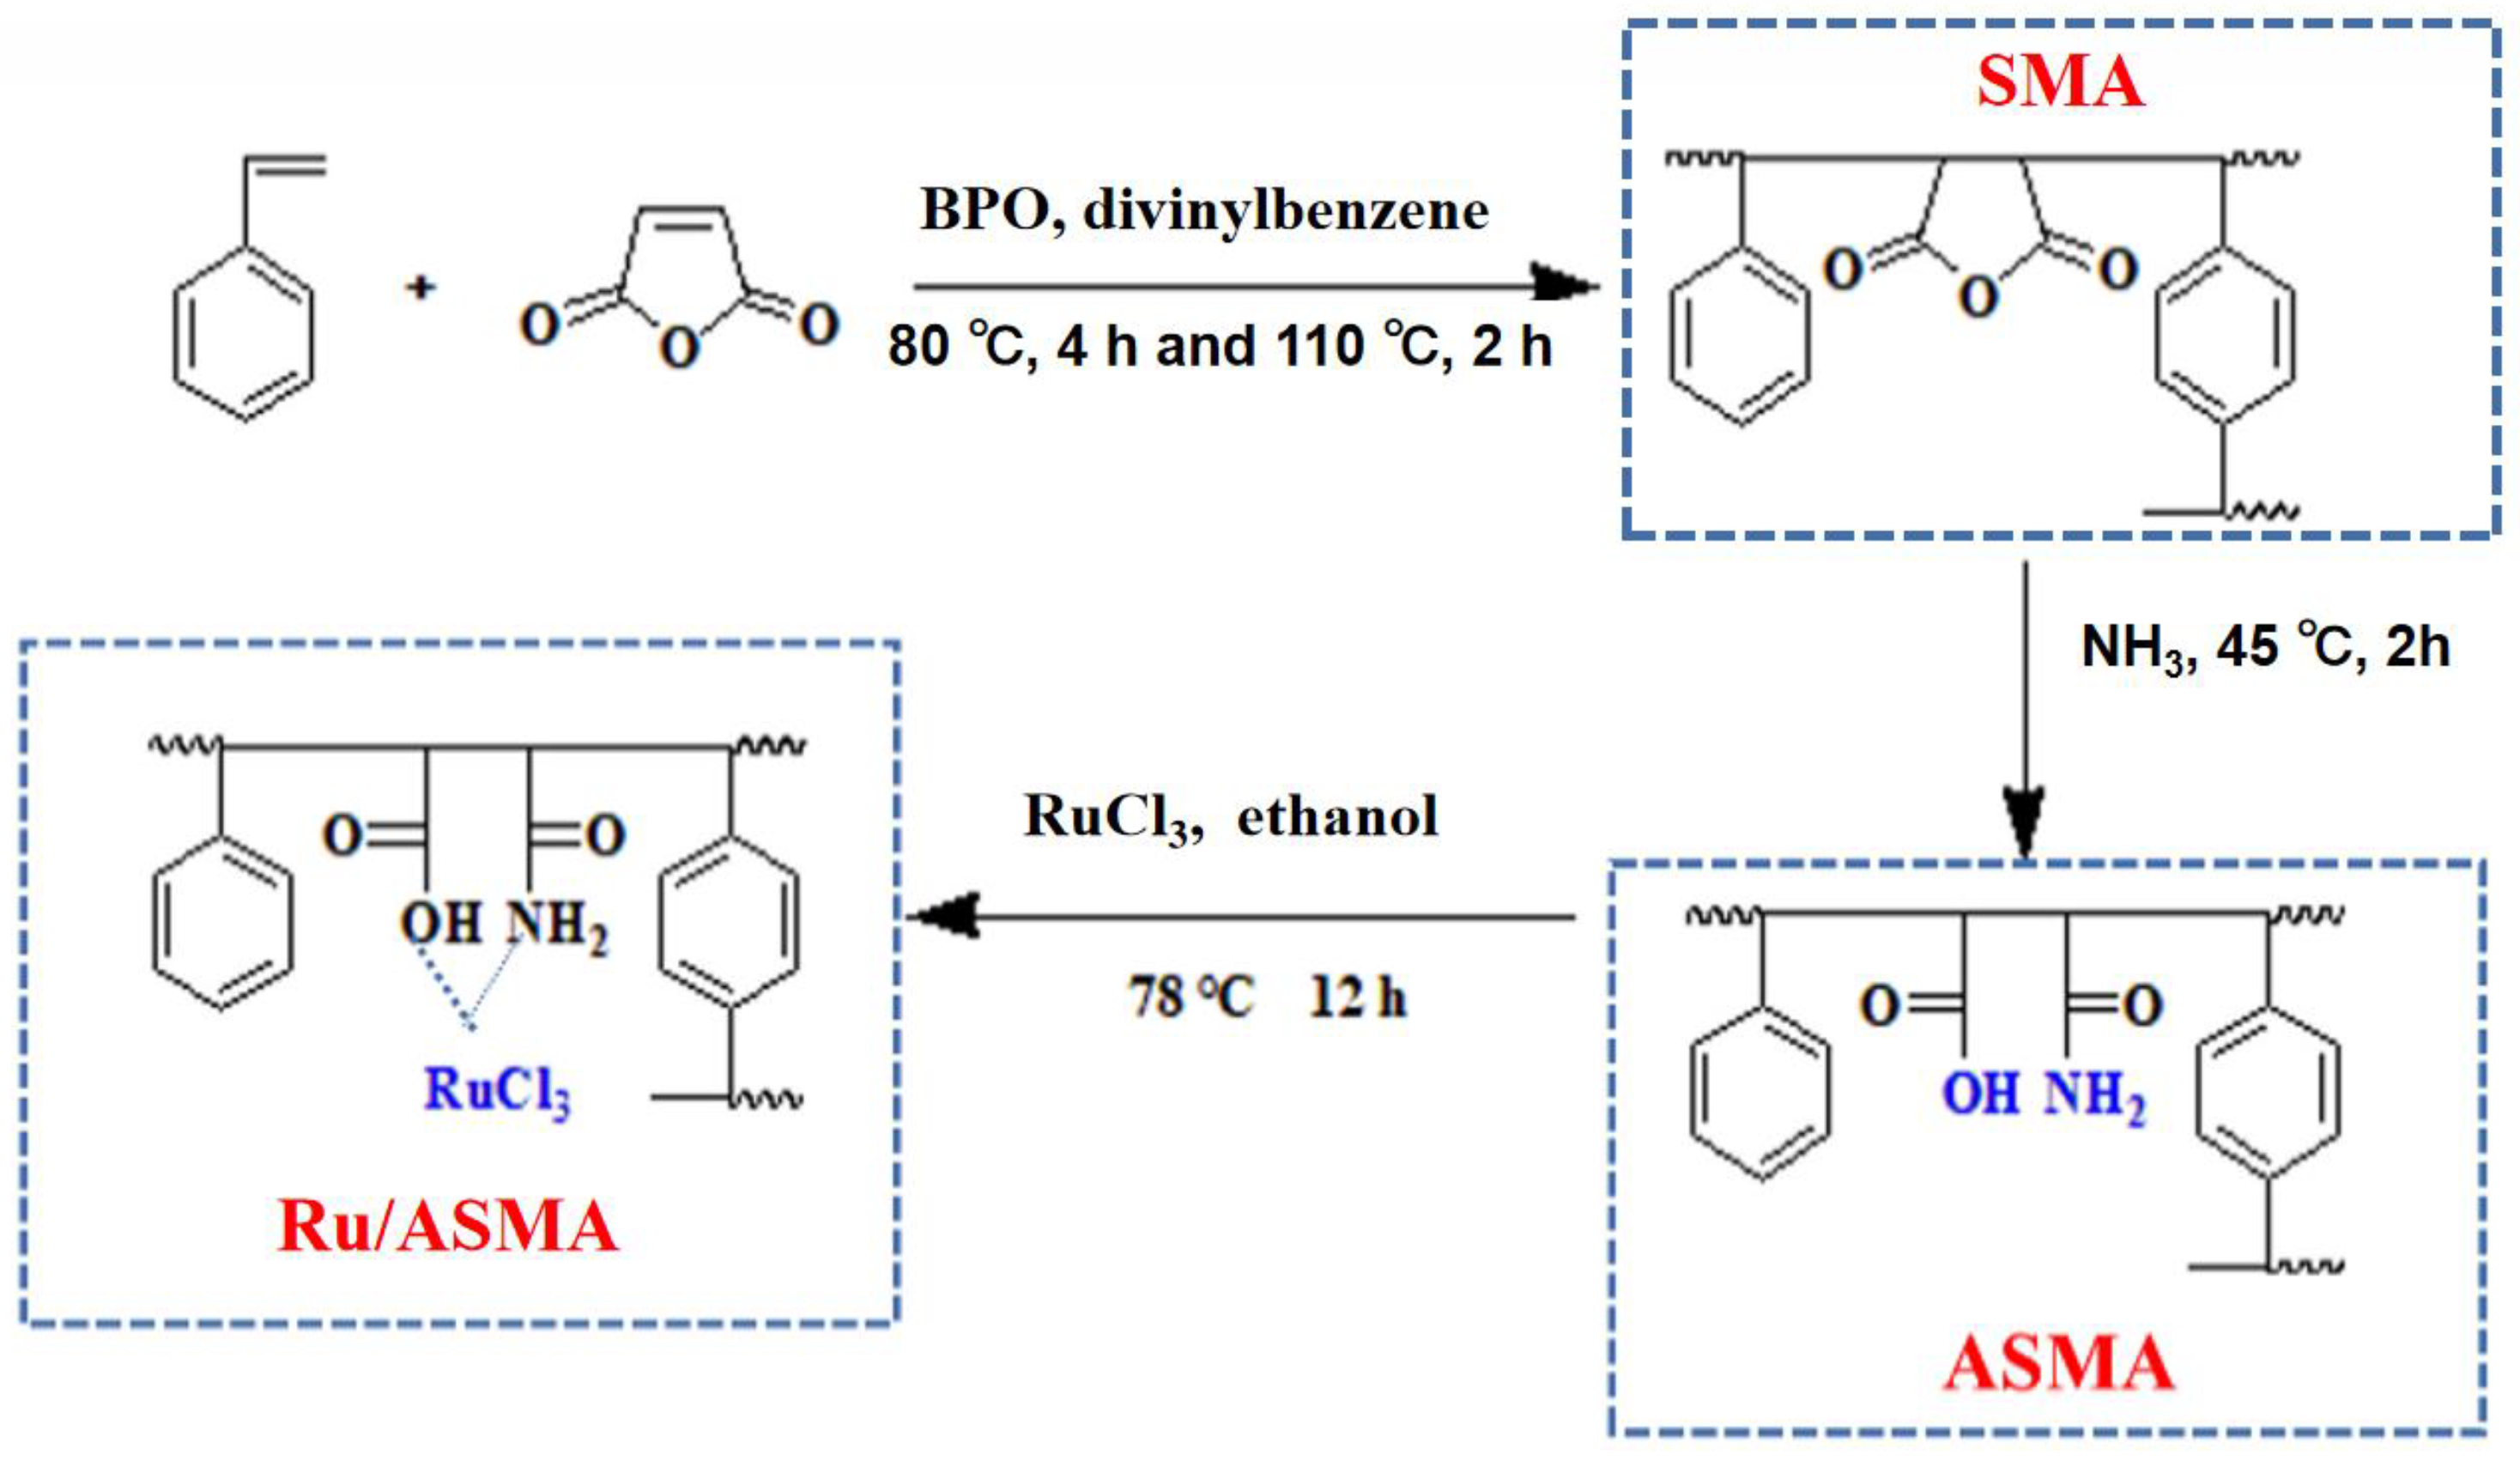
3.2. Catalysts Preparation
3.3. Conversion of Glucose into Sorbitol
3.4. Catalyst Characterization
3.4.1. XRD
3.4.2. SEM
3.4.3. TEM
3.4.4. N2-Adsorption and Desorption
3.4.5. XPS
3.4.6. FTIR
3.4.7. TGA-DSC
3.4.8. ICP-OES
4. Conclusions
Author Contributions
Funding
Institutional Review Board Statement
Informed Consent Statement
Data Availability Statement
Conflicts of Interest
Sample Availability
References
- Silva, J.G.A.B.S.; Santos, R.C.; Rodríguez Castell’on, E.; Teixeira, L.S.G.; Pontes, L.A.M. Catalytic conversion of glucose into sorbitol over niobium oxide supported Ru catalysts. Mol. Catal. 2021, 507, 111567. [Google Scholar] [CrossRef]
- Ahmed, M.J.; Hameed, B.H. Hydrogenation of glucose and fructose into hexitols over heterogeneous catalysts: A review. J. Taiwan Inst. Chem. E. 2019, 96, 341–352. [Google Scholar] [CrossRef]
- Li, Z.Y.; Liu, Y.; Liu, C.F.; Wu, S.B.; Wei, W.Q. Direct conversion of cellulose into sorbitol catalyzed by a bifunctional catalyst. Bioresour. Technol. 2019, 274, 190–197. [Google Scholar] [CrossRef] [PubMed]
- Inan, A.; Sünbül, A.B.; Caylar, M.; Uruş, S.; Orhan, Z.; Köse, M.; Ispir, E. Highly effective aldose reductase mimetics. J. Mol. Struct. 2023, 1277, 134844. [Google Scholar] [CrossRef]
- Zhang, Y.; Zhang, G.; Chen, T. Efficient one-pot conversion of cellulose to sorbitol over Ni-based carbon. Fuel 2023, 339, 127447. [Google Scholar] [CrossRef]
- Liang, P.; Cao, M.; Li, J.; Wang, Q.; Dai, Z. Expanding sugar alcohol industry: Microbial production of sugar alcohols and associated chemocatalytic derivatives. Biotechnol. Adv. 2023, 64, 108105. [Google Scholar] [CrossRef]
- Galán, G.; Martín, M.; Grossmann, I.E. Integrated renewable production of sorbitol and xylitol from switchagrass. Ind. Eng. Chem. Res. 2021, 60, 5558–5573. [Google Scholar] [CrossRef]
- Arcaño, Y.D.; García, O.D.V.; Mandelli, D.; Carvalho, W.A.; Pontes, L.A.M. Xylitol: A review on the progress and challenges of its production by chemical route. Catal. Today 2020, 344, 2–14. [Google Scholar] [CrossRef]
- Annuar, N.H.R.; Alexzman, Z.A.; Daud, A.R.M.; Alias, A.F.N.; Hairi, H.M.; Setiabudi, H.D. A review on hydrogenolysis of sorbitol over heterogeneous catalysts. J. Environ. Chem. Eng. 2022, 10, 107229. [Google Scholar] [CrossRef]
- Gumina, B.; Mauriello, F.; Pietropaolo, R.; Galvagno, S.; Espro, C. Hydrogenolysis of sorbitol into valuable C3–C2 alcohols at low H2 pressure promoted by the heterogeneous Pd/Fe3O4 catalyst. Mol. Catal. 2018, 446, 152–160. [Google Scholar] [CrossRef]
- Yuan, D.; Xiao, F.; Zhao, N.; Deng, C.; Huang, X.; Zhang, H.; Yang, Q.; Qiao, Y. Mesoporous poly(ionic liquid) solid acid for sequential dehydration of sorbitol to isosorbide. Chem. Eng. J. 2023, 260, 141780. [Google Scholar] [CrossRef]
- Uruş, S.; Eskalen, H.; Çaylar, M.; Akbulut, M. Highly effective aldose reductase mimetics: Microwave-assisted catalytic transfer hydrogenation of D-glucose to D-sorbitol with magnetically recoverable aminomethylphosphine–Ru(II) and Ni(II) complexes. J. Mol. Struct. 2021, 1237, 130313. [Google Scholar] [CrossRef]
- Erian, A.M.; Sauer, M. Utilizing yeasts for the conversion of renewable feedstocks to sugar alcohols–A review. Bioresour. Technol. 2022, 346, 126296. [Google Scholar] [CrossRef]
- Guo, X.C.; Wang, X.C.; Guan, J.; Chen, X.F.; Qin, Z.F.; Mu, X.D.; Xian, M. Selective hydrogenation of D-glucose to D-sorbitol over Ru/ZSM-5 catalysts. Chin. J. Catal. 2014, 35, 733–740. [Google Scholar] [CrossRef]
- Wang, S.L.; Wei, W.; Zhao, Y.; Li, H.; Hui, L. Ru–B amorphous alloy deposited on mesoporous Silica nanospheres: An efficient catalyst for D–glucose hydrogenation to D–sorbitol. Catal. Today 2015, 258, 327–336. [Google Scholar] [CrossRef]
- Li, Z.; Lan, W.; Liu, C. Biomass derived bifunctional catalyst for the conversion of cassava dreg. Ind. Crop. Prod. 2023, 197, 116493. [Google Scholar] [CrossRef]
- Chen, M.; Wang, Y.; Lu, J.; Du, J.; Tao, Y.; Cheng, Y.; Li, Q.; Wang, H. Combinatorial pretreatments of reed straw using liquid hot water and lactic acid for fermentable sugar production. Fuel 2023, 331, 125916. [Google Scholar] [CrossRef]
- Romero, A.; Nieto–Márquez, A.; Alonso, E. Bimetallic Ru:Ni/MCM–48 catalysts for the effective hydrogenation of d–glucose into sorbitol. Appl. Catal. A Gen. 2017, 529, 49–59. [Google Scholar] [CrossRef] [Green Version]
- Romero, A.; Alonso, E.; Sastre, Á.; Nieto–Márquez, A. Conversion of biomass into sorbitol: Cellulose hydrolysis on MCM–48 and D–Glucose hydrogenation on Ru/MCM–48. Microporous Mesoporous Mater. 2016, 224, 1–8. [Google Scholar] [CrossRef]
- Liu, X.; Liu, X.; Li, N.; Ma, P.; Zhang, Y. Direct synthesis of hexitols from microcrystalline cellulose and birch over zirconium(iv) phosphate supported nickel catalysts and the mechanism study. Green Chem. 2021, 23, 1353–1360. [Google Scholar] [CrossRef]
- Liu, Y.; Chen, L.; Zhang, W.; Liu, H. Recyclable Cu salt-derived brønsted acids for hydrolytic hydrogenation of cellulose on Ru catalyst. CCS Chem. 2021, 3, 3419–3426. [Google Scholar] [CrossRef]
- Chamnipa, N.; Klanrit, P.; Thanonkeo, S.; Thanonkeo, P. Sorbitol production from a mixture of sugarcane bagasse and cassava pulp. Ind. Crop. Prod. 2022, 188, 115741. [Google Scholar] [CrossRef]
- Musci, J.J.; Montaña, M.; Rodríguez–Castellón, E.; Lick, I.D.; Casella, M.L. Selective aqueous-phase hydrogenation of glucose and xylose over ruthenium-based catalysts: Influence of the support. Mol. Catal. 2020, 495, 111150. [Google Scholar] [CrossRef]
- Du, H.; Ma, X.Y.; Jiang, M.; Yan, P.F.; Zhao, Y.; Zhang, Z.C. Efficient Ni/SiO2 catalyst derived from nickel phyllosilicate for xylose hydrogenation to xylitol. Catal. Today 2021, 365, 265–273. [Google Scholar] [CrossRef]
- Mishra, D.K.; Dabbawala, A.A.; Park, J.J.; Jhung, S.H.; Hwang, J.S. Selective hydrogen-ation of d–glucose to d–sorbitol over HY zeolite supported ruthenium nanoparticles catalysts. Catal. Today 2014, 232, 99–107. [Google Scholar] [CrossRef]
- Silvester, L.; Ramos, F.; Thuriot–Roukos, J.; Heyte, S.; Araque, M.; Paul, S.; Wojcieszak, R. Fully integrated high-throughput methodology for the study of Ni- and Cu-supported catalysts for glucose hydrogenation. Catal. Today 2019, 338, 72–80. [Google Scholar] [CrossRef]
- Carlier, S.; Gripekoven, J.; Philippo, M.; Hermans, S. Ru on N-doped carbon supports for the direct hydrogenation of cellobiose into sorbitol. Appl. Catal. B–Environ. 2021, 282, 119515. [Google Scholar] [CrossRef]
- Okolie, A.J. Insights on production mechanism and industrial applications of renewable propylene glycol. iScience 2022, 25, 104903. [Google Scholar] [CrossRef]
- Ribeiro, L.S.; Pires, A.L.F.; de Melo Órfão, J.J.; Pereira, M.F.R. Paving the way towards an eco- and budget-friendly one-pot catalytic conversion of cellulose and lignocellulosic residues into ethylene glycol over Ni–W/CNT catalysts. Renew. Energy 2022, 200, 1008–1022. [Google Scholar] [CrossRef]
- Redina, E.; Tkachenko, O.; Salni, T. Recent advances in C5 and C6 sugar alcohol synthesis by hydrogenation of monosaccharides and cellulose hydrolytic hydrogenation over non-noble metal catalysts. Molecules 2022, 27, 1353. [Google Scholar] [CrossRef]
- Gromov, N.V.; Medvedeva, T.B.; Rodikova, Y.A.; Timofeeva, M.N.; Panchenko, V.N.; Taran, O.P.; Kozhevnikov, I.V.; Parmon, V.N. One-pot synthesis of sorbitol via hydrolysis-hydrogenation of cellulose in the presence of Ru-containing composites. Bioresour. Technol. 2021, 319, 124122. [Google Scholar] [CrossRef] [PubMed]
- Melero, J.A.; Moreno, J.; Iglesias, J.; Morales, G.; Fierro, J.L.G.; Sánchez–Vázqueza, R.; Cubo, A.; Garcíaa, B. Ru–ZrO2–SBA–15 as efficient and robust catalyst for the aqueous phase hydrogenation of glucose to sorbitol. Mol. Catal. 2020, 484, 110802. [Google Scholar] [CrossRef]
- Singh, H.; Rai, A.; Yadav, R.; Sinha, A.K. Glucose hydrogenation to sorbitol over unsupported mesoporous Ni/NiO catalyst. Mol. Catal. 2018, 451, 186–191. [Google Scholar] [CrossRef]
- Tangale, N.P.; Niphadkar, P.S.; Joshi, P.N.; Dhepe, P.L. Hierarchical K/LTL zeolite as solid base for aqueous phase hydrogenation of xylose to xylitol. Microporous Mesoporous Mater. 2019, 27, 70–80. [Google Scholar] [CrossRef]
- Zhao, J.; Yang, X.R.; Wang, W.; Liang, J.H.; Orooji, Y.; Dai, C.W.; Fu, X.M.; Yang, Y.S.; Xu, W.L.; Zhu, J.L. Efficient sorbitol producing process through glucose hydrogenation catalyzed by Ru supported amino poly (styrene-co-maleic) polymer (ASMA) encapsulated on γ-Al2O3. Catalysts 2020, 10, 1068. [Google Scholar] [CrossRef]
- Wang, W.; Xu, W.L.; Thapa, K.; Yang, X.R.; Liang, J.H.; Zhu, L.Y.; Zhu, J.L. Morpholine-modified Pd/γ–Al2O3@ASMA Pellet catalyst with excellent catalytic selectivity in the hydrogenation of p–Chloronitrobenzene to p–Chloroaniline. Catalysts 2017, 7, 292. [Google Scholar] [CrossRef] [Green Version]
- Li, L.L.; Cai, J.H.; Liu, Y.; Ni, J.; Liang, L. Zeolite-seed-directed Ru nanoparticles highly resistant against sintering for efficient nitrogen activation to ammonia. Sci. Bull. 2020, 65, 1085–1093. [Google Scholar] [CrossRef]
- Kim, S.J.; Nguyen, T.S.; Mahmood, J.; Yavuz, C.T. Sintering-free catalytic ammonia cracking by vertically standing 2D porous framework supported Ru nanocatalysts. Chem. Eng. J. 2023, 463, 142474. [Google Scholar] [CrossRef]
- Konwar, L.J.; Mikkola, J.P. Carbon support effects on metal (Pd, Pt and Ru) catalyzed hydrothermal decarboxylation/ deoxygenation of triglycerides. Appl. Catal. A–Gen. 2022, 638, 118611. [Google Scholar] [CrossRef]
- Jalalah, M.; Han, H.; Nayak, A.K.; Harraz, F.A. Biomass-derived metal-free porous carbon electrocatalyst for efficient oxygen reduction reactions. J. Taiwan Inst. Chem. Eng. 2023, 147, 104905. [Google Scholar] [CrossRef]
- Zhang, Y.Y.; Zhang, M.Y.; Zhou, Y.L.; Yang, L.L.; Lin, B.Y.; Ni, J.; Zheng, L.R.; Wang, X.Y.; Au, C.T.; Jiang, L.L. Insight into the critical role of strong interaction between Ru and Co in RuCo single-atom alloy structure for significant enhancement of ammonia synthesis performance. J. Catal. 2022, 410, 256–265. [Google Scholar] [CrossRef]
- Samadi, N.; Ansari, R.; Khodavirdilo, B. Synthesized nano particle derivation of poly (styrene-co-maleic anhydride) and sour cherry rock for removing nickel (II) ion from aqueous solutions. Toxicol. Rep. 2019, 6, 590–597. [Google Scholar] [CrossRef] [PubMed]
- Liu, S.D.; Yang, Y.; Liu, T.H.; Wu, W.S. Recovery of uranium(VI) from aqueous solution by 2-picolylamine functionalized poly(styrene-co-maleic anhydride) resin. J.Colloid Interf. Sci. 2017, 497, 385–392. [Google Scholar] [CrossRef] [PubMed]
- Zhang, X.G.; Wilson, K.; Lee, A.F. Heterogeneously catalyzed hydrothermal processing of C5–C6 sugars. Chem. Rev. 2016, 116, 12328–12368. [Google Scholar] [CrossRef] [PubMed] [Green Version]
- Graça, I.; Bacariza, M.C.; Fernandes, A.; Chadwick, D. Desilicated NaY zeolites impregnated with magnesium as catalysts for glucose isomerisation into fructose. Appl. Catal. B–Environ. 2018, 224, 660–670. [Google Scholar] [CrossRef]
- Qiu, S.B.; Wang, T.J.; Fang, Y.X. High-efficient preparation of gasoline-ranged C5–C6 alkanes from biomass-derived sugar polyols of sorbitol over Ru–MoO3–x/C catalyst. Fuel Process. Technol. 2019, 183, 19–26. [Google Scholar] [CrossRef]
- Chu, D.; Zhao, C. Reduced oxygen-deficient CuWO4 with Ni catalyzed selective hydrogenolysis of cellulose to ethylene glycol. Catal. Today 2020, 351, 125–132. [Google Scholar] [CrossRef]
- Dabbawala, A.A.; Mishra, D.K.; Hwang, J.S. Selective hydrogenation of d-glucose using amine functionalized nanoporous polymer supported Ru nanoparticles based catalyst. Catal. Today 2016, 265, 163–173. [Google Scholar] [CrossRef]
- Lazaridis, P.A.; Karakoulia, S.; Delimitis, A.; Coman, S.M.; Parvulescu, V.I.; Triantafyllidis, K.S. d-Glucose hydrogenation/hydrogenolysis reactions on noble metal (Ru, Pt)/activated carbon supported catalysts. Catal. Today 2015, 257, 281–290. [Google Scholar] [CrossRef]
- Brandi, F.; Bumel, M.; Molinari, V.; Shekova, I.; Lauermann, I.; Heil, T.; Antonietti, M.; Al-Naji, M. Nickel on nitrogen-doped carbon pellets for continuous flow catalytic hydrogenation of biomass-derived compounds in water. Green Chem. 2020, 22, 2755–2766. [Google Scholar] [CrossRef] [Green Version]
- Amirilargani, M.; Merlet, R.B.; Chu, L.Y.; Nijmeijer, A.; Winnubst, L.; de Smet, L.C.P.M.; Sudhölter, E.J.R. Molecular separation using poly (styrene-co-maleic anhydride) grafted to γ–alumina: Surface versus pore modification. J. Membr. Sci. 2019, 582, 298–306. [Google Scholar] [CrossRef]


| Samples | BET Specific Surface Area (m2/g) | Pore Size (nm) | Pore Volume (cm3/g) |
|---|---|---|---|
| Pure AC | 1064.83 | 3.44 | 0.60 |
| ASMA@AC | 507.99 | 4.47 | 0.35 |
| Ru/AC | 602.13 | 4.50 | 0.47 |
| Ru/ASMA@AC | 431.60 | 3.15 | 0.26 |
Disclaimer/Publisher’s Note: The statements, opinions and data contained in all publications are solely those of the individual author(s) and contributor(s) and not of MDPI and/or the editor(s). MDPI and/or the editor(s) disclaim responsibility for any injury to people or property resulting from any ideas, methods, instructions or products referred to in the content. |
© 2023 by the authors. Licensee MDPI, Basel, Switzerland. This article is an open access article distributed under the terms and conditions of the Creative Commons Attribution (CC BY) license (https://creativecommons.org/licenses/by/4.0/).
Share and Cite
Yang, X.; Li, X.; Zhao, J.; Liang, J.; Zhu, J. Production of Sorbitol via Hydrogenation of Glucose over Ruthenium Coordinated with Amino Styrene-co-maleic Anhydride Polymer Encapsulated on Activated Carbon (Ru/ASMA@AC) Catalyst. Molecules 2023, 28, 4830. https://doi.org/10.3390/molecules28124830
Yang X, Li X, Zhao J, Liang J, Zhu J. Production of Sorbitol via Hydrogenation of Glucose over Ruthenium Coordinated with Amino Styrene-co-maleic Anhydride Polymer Encapsulated on Activated Carbon (Ru/ASMA@AC) Catalyst. Molecules. 2023; 28(12):4830. https://doi.org/10.3390/molecules28124830
Chicago/Turabian StyleYang, Xiaorui, Xiaotong Li, Jing Zhao, Jinhua Liang, and Jianliang Zhu. 2023. "Production of Sorbitol via Hydrogenation of Glucose over Ruthenium Coordinated with Amino Styrene-co-maleic Anhydride Polymer Encapsulated on Activated Carbon (Ru/ASMA@AC) Catalyst" Molecules 28, no. 12: 4830. https://doi.org/10.3390/molecules28124830