
Comparing the Colloidal Stabilities of Commercial and Biogenic Iron Oxide Nanoparticles That Have Potential In Vitro/In Vivo Applications

 , , and
Abstract
: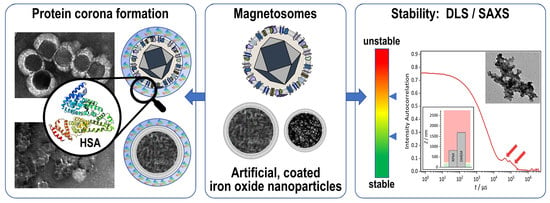
1. Introduction
2. Results and Discussion
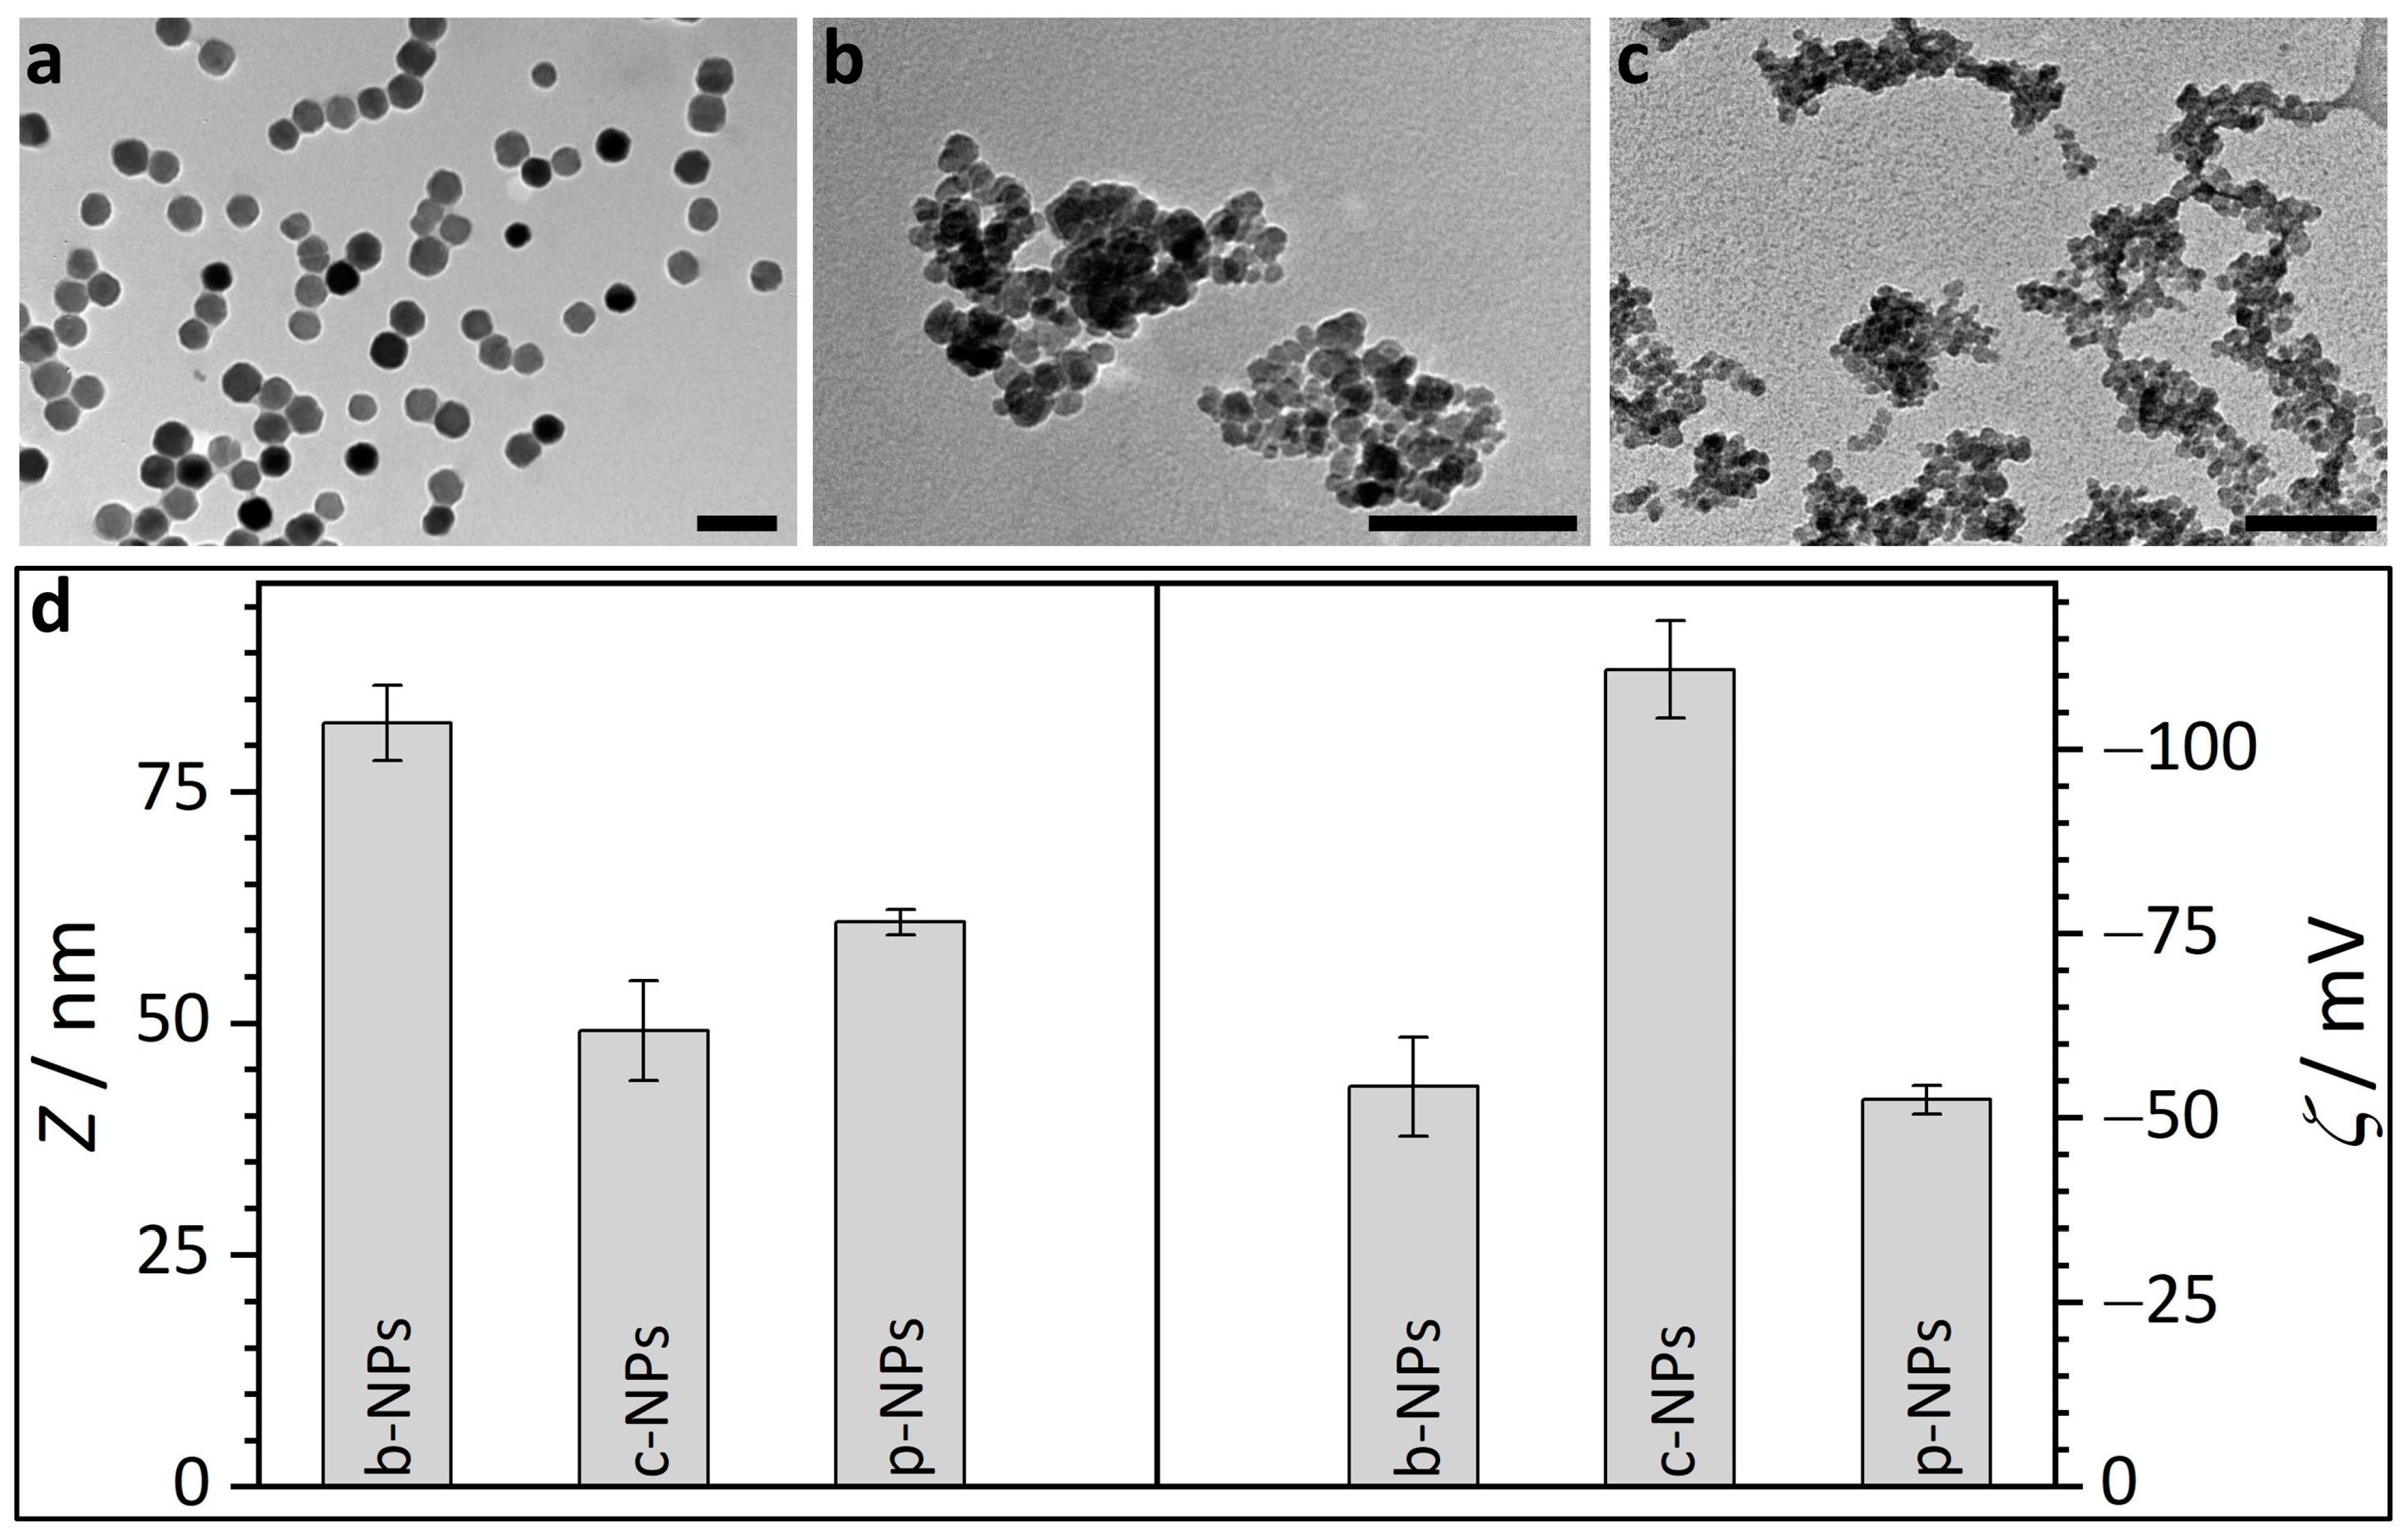
2.1. Size and Size Distribution of Iron Oxide Core Nanoparticles
2.2. Stability Comparison of Commercial and Biogenic Iron Oxide Nanoparticles
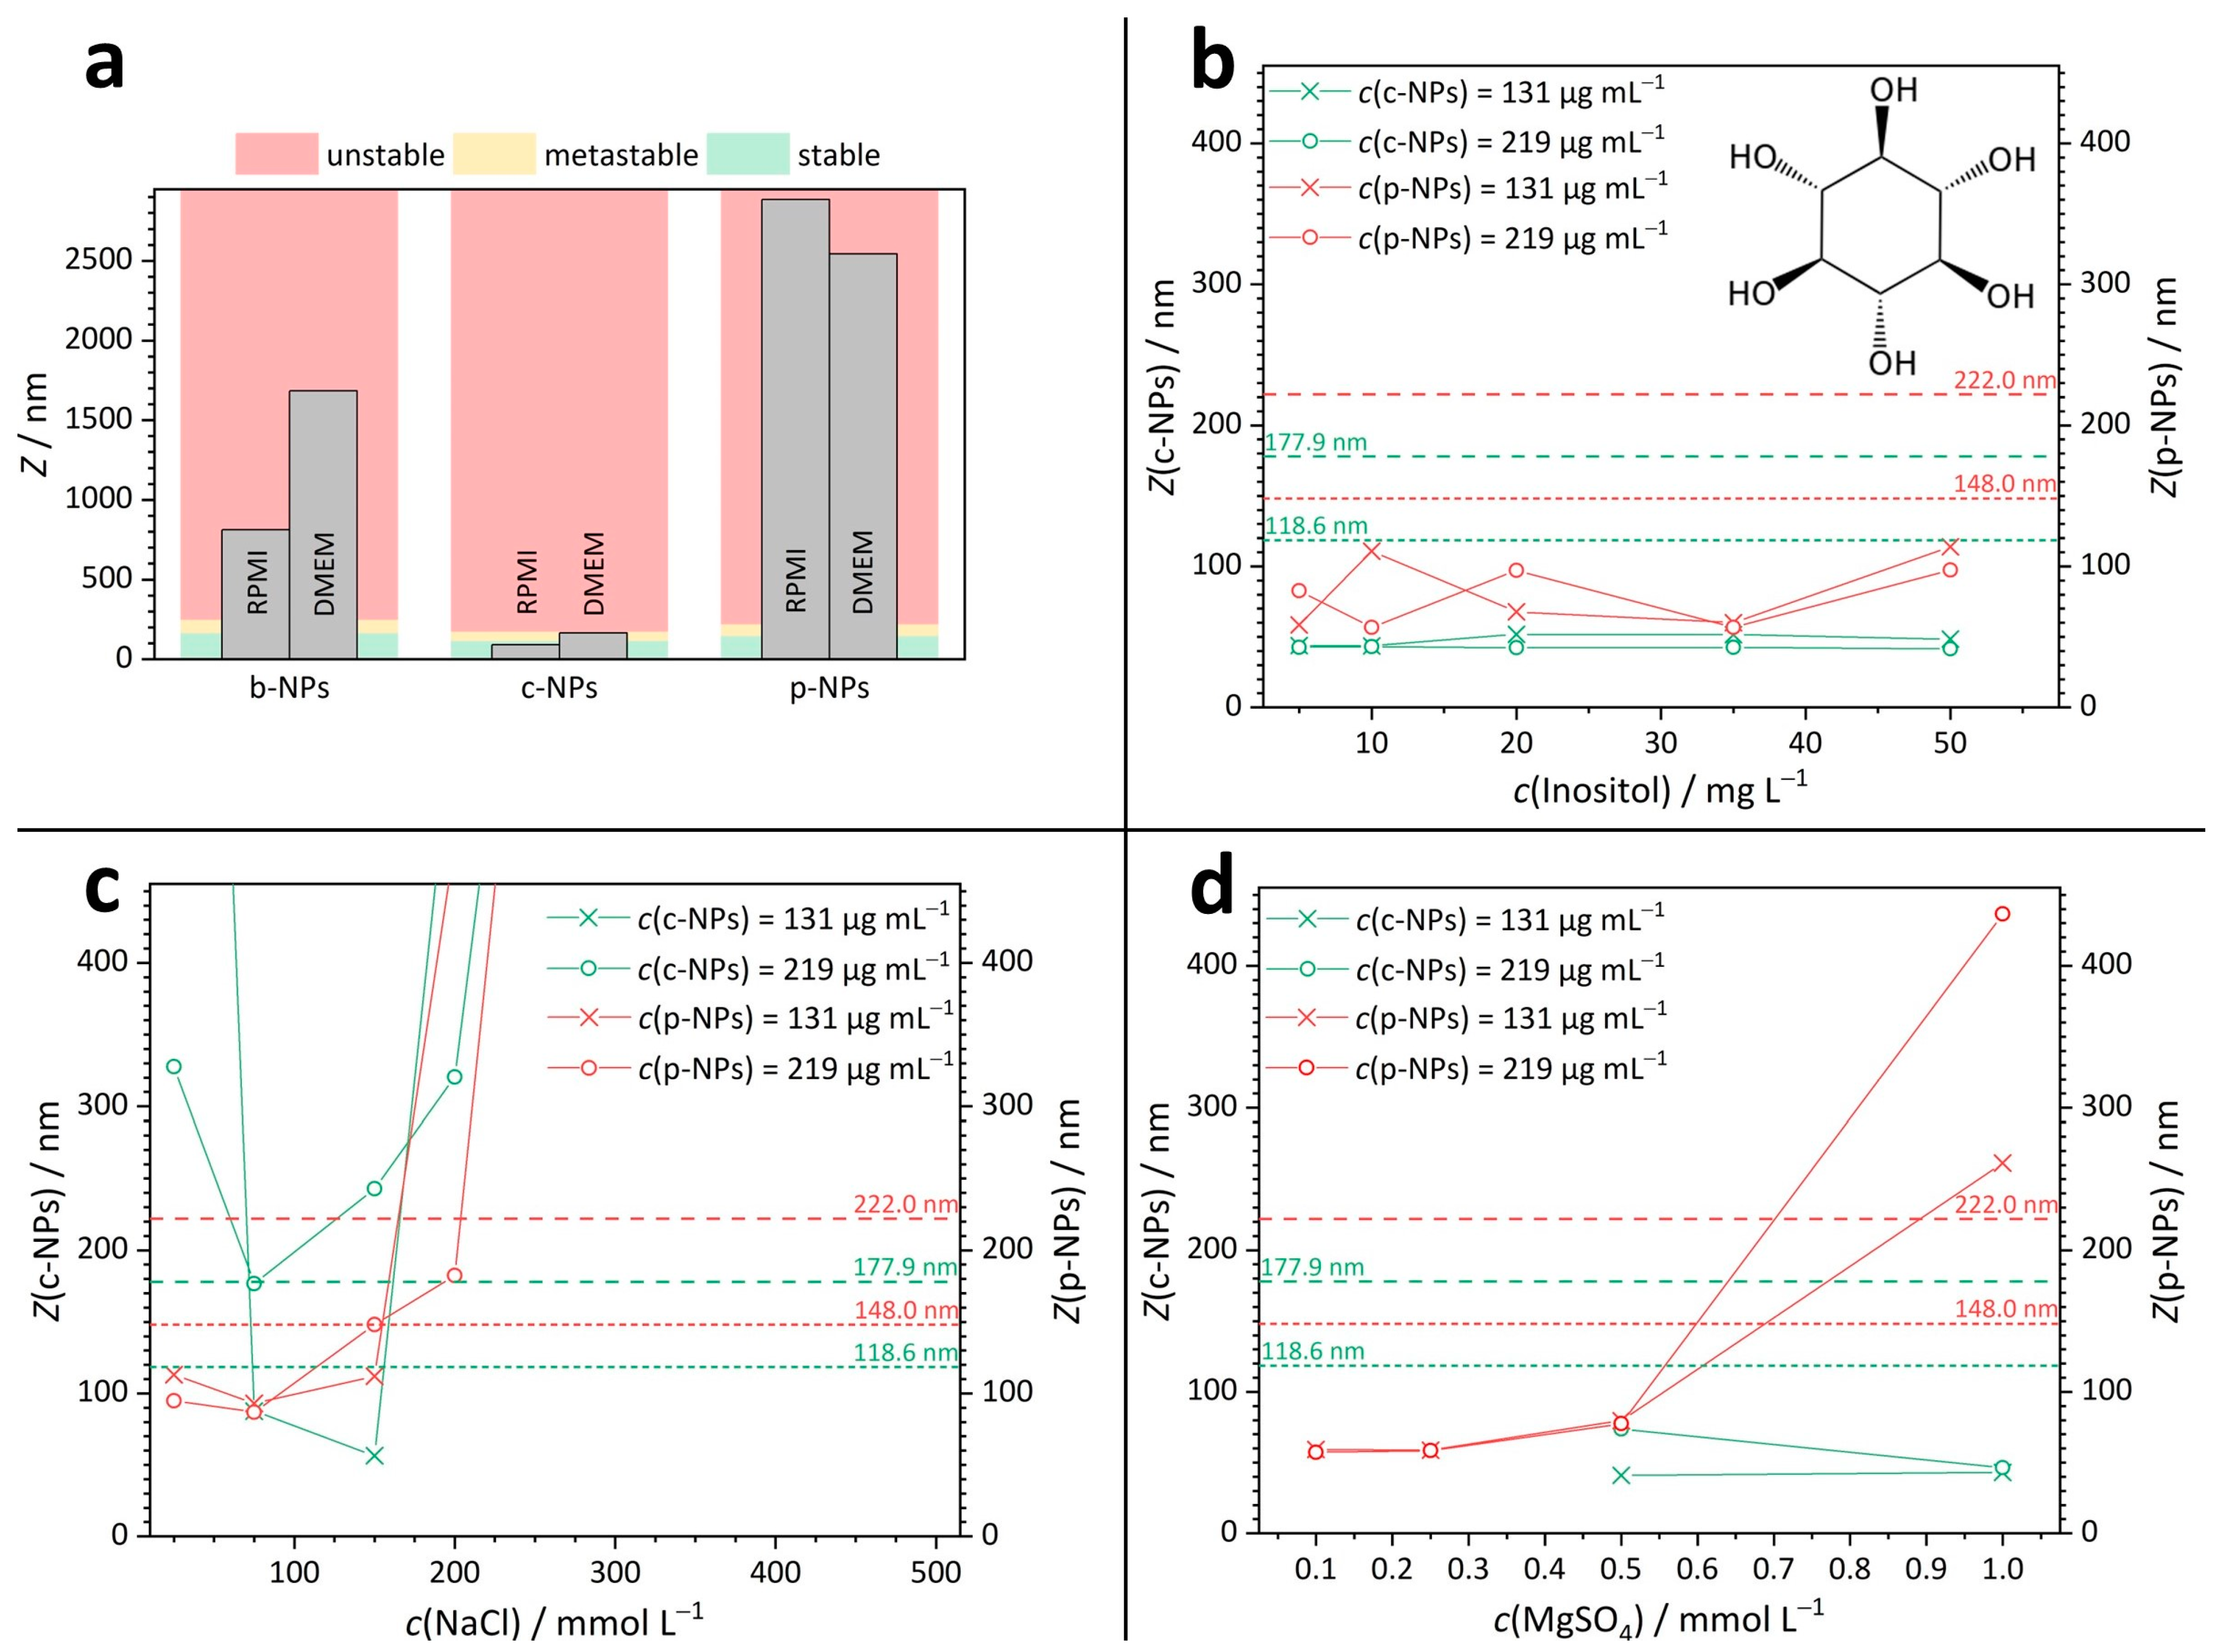
2.2.1. Stability in Culture Media
- p-NPs and c-NPs in inositol solutions
- p-NPs in salt solutions
- c-NPs in salt solutions
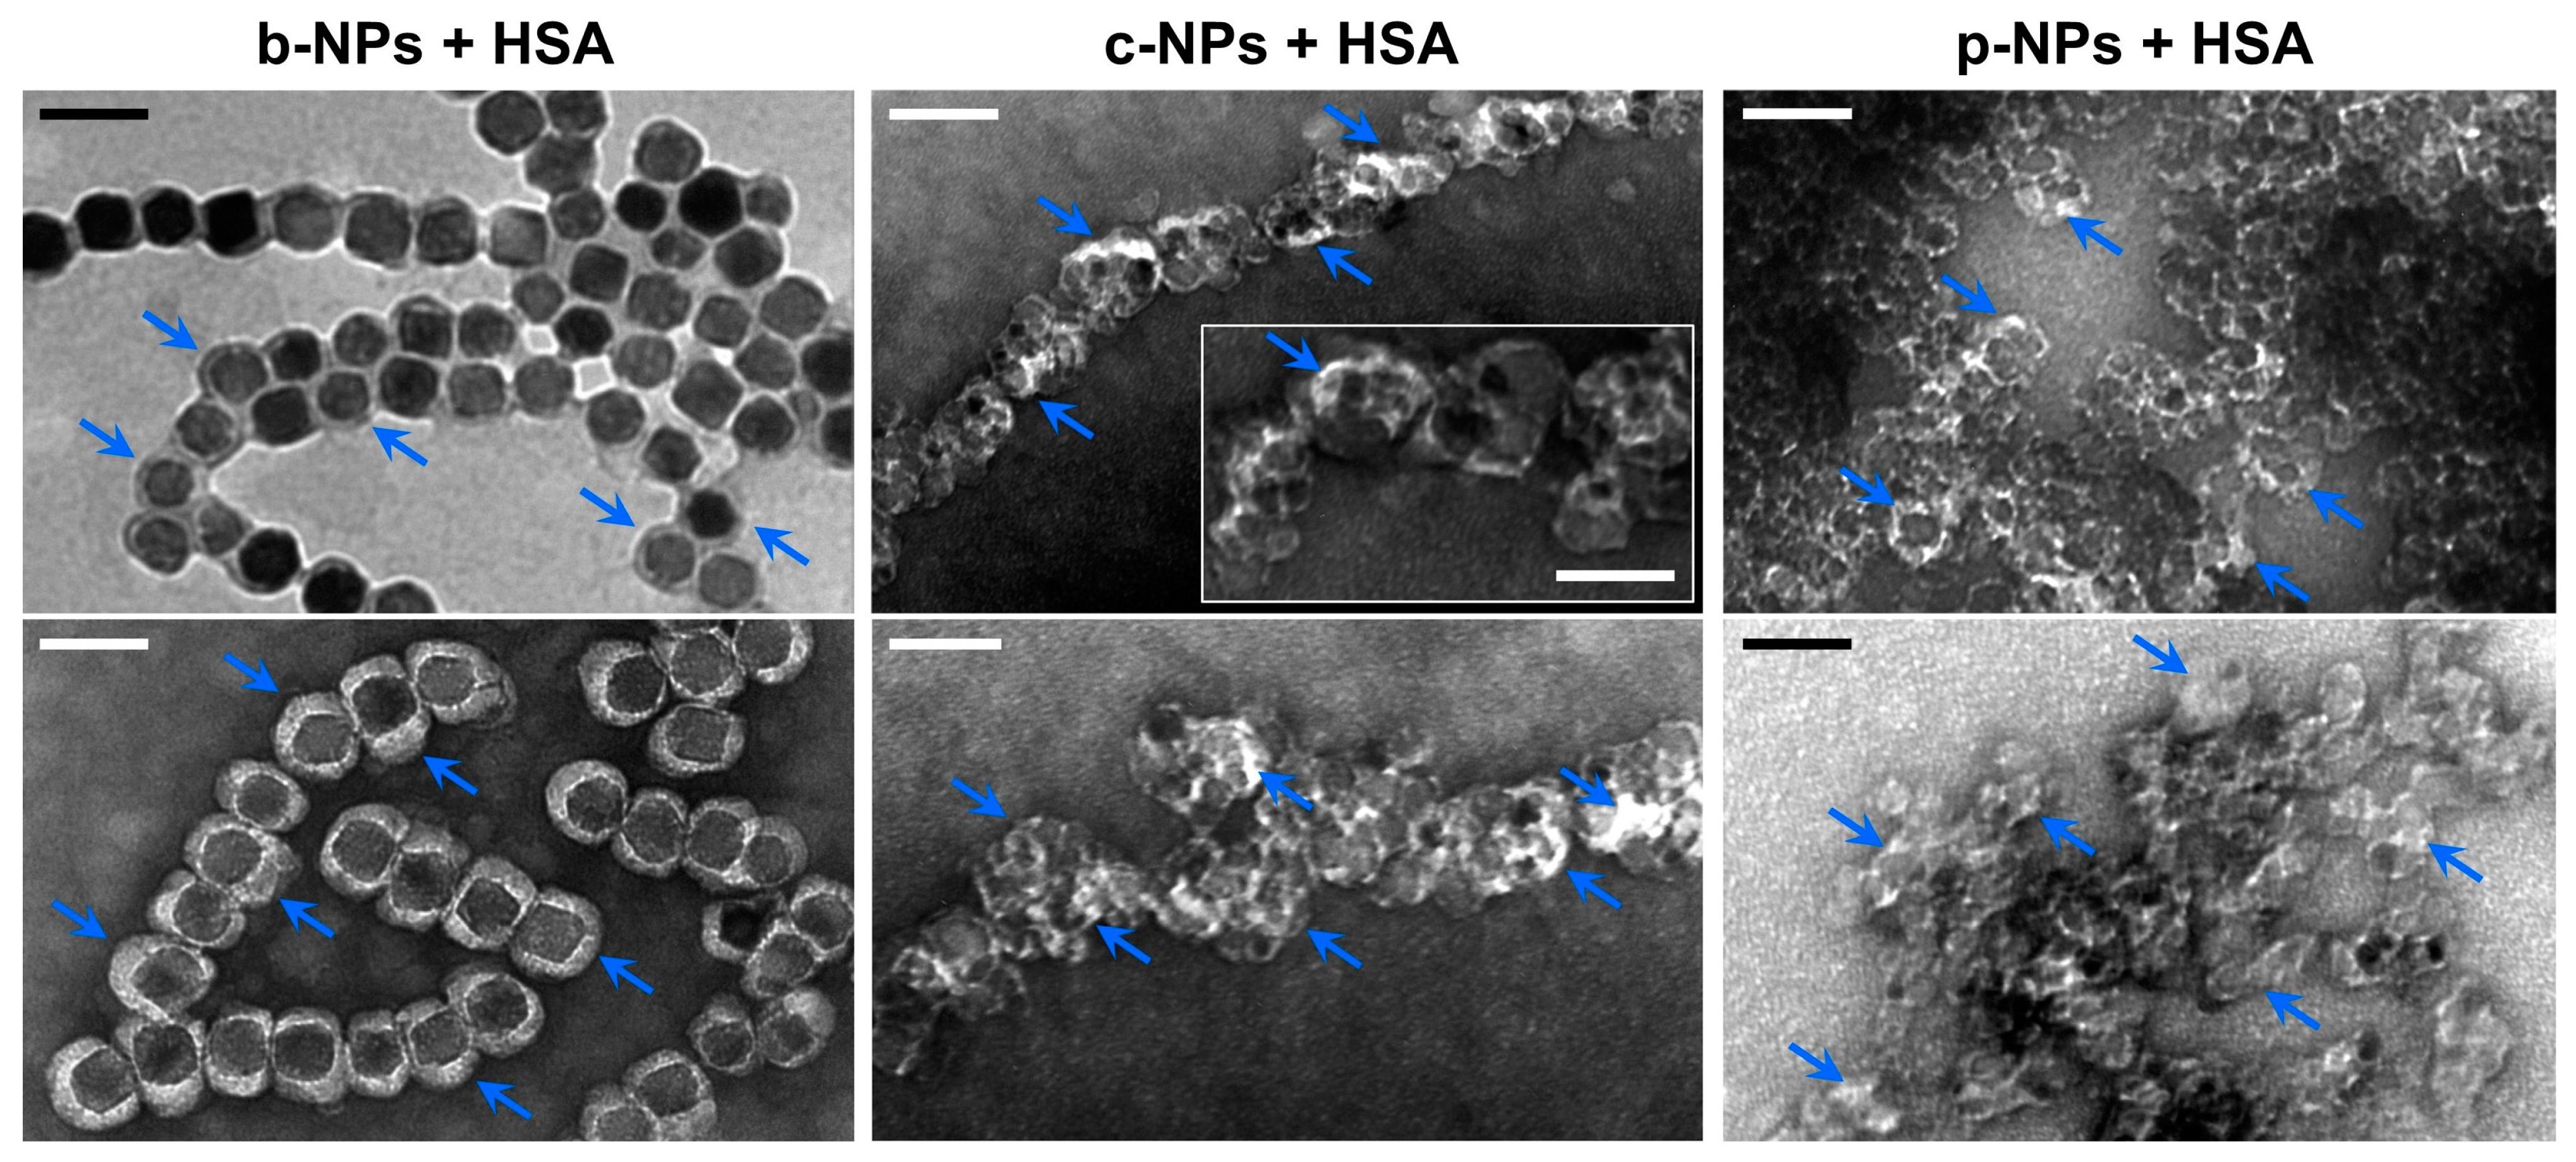
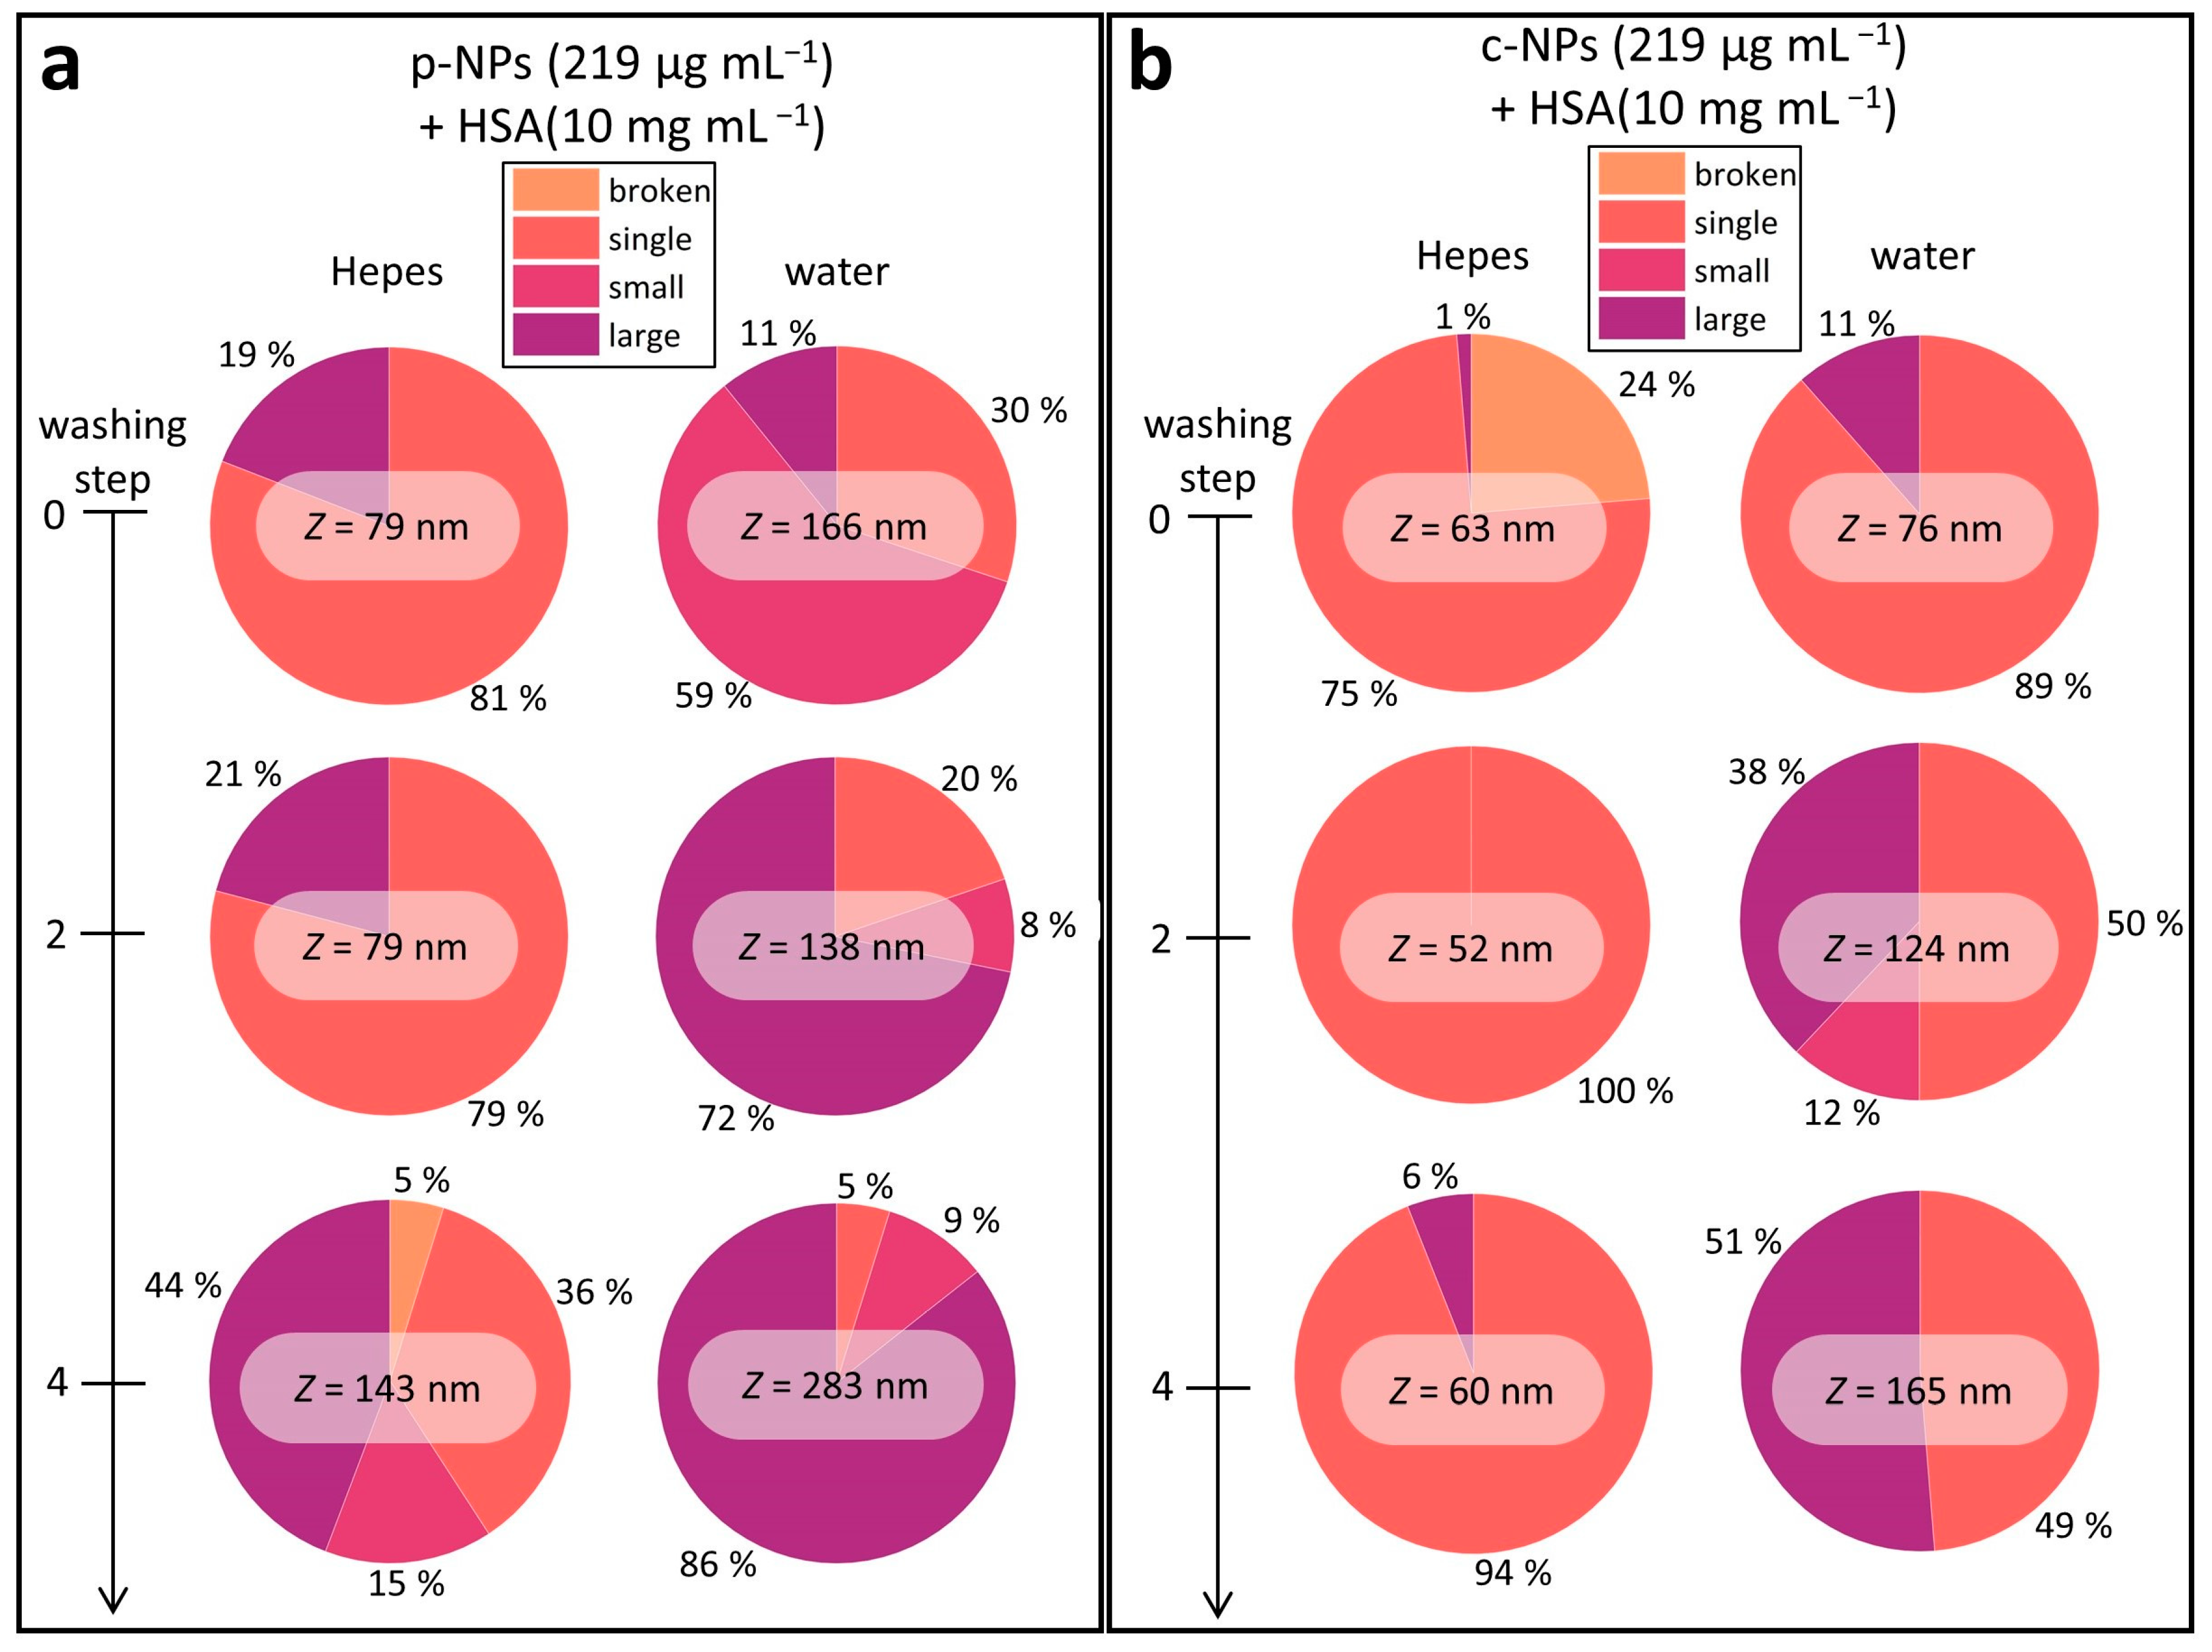
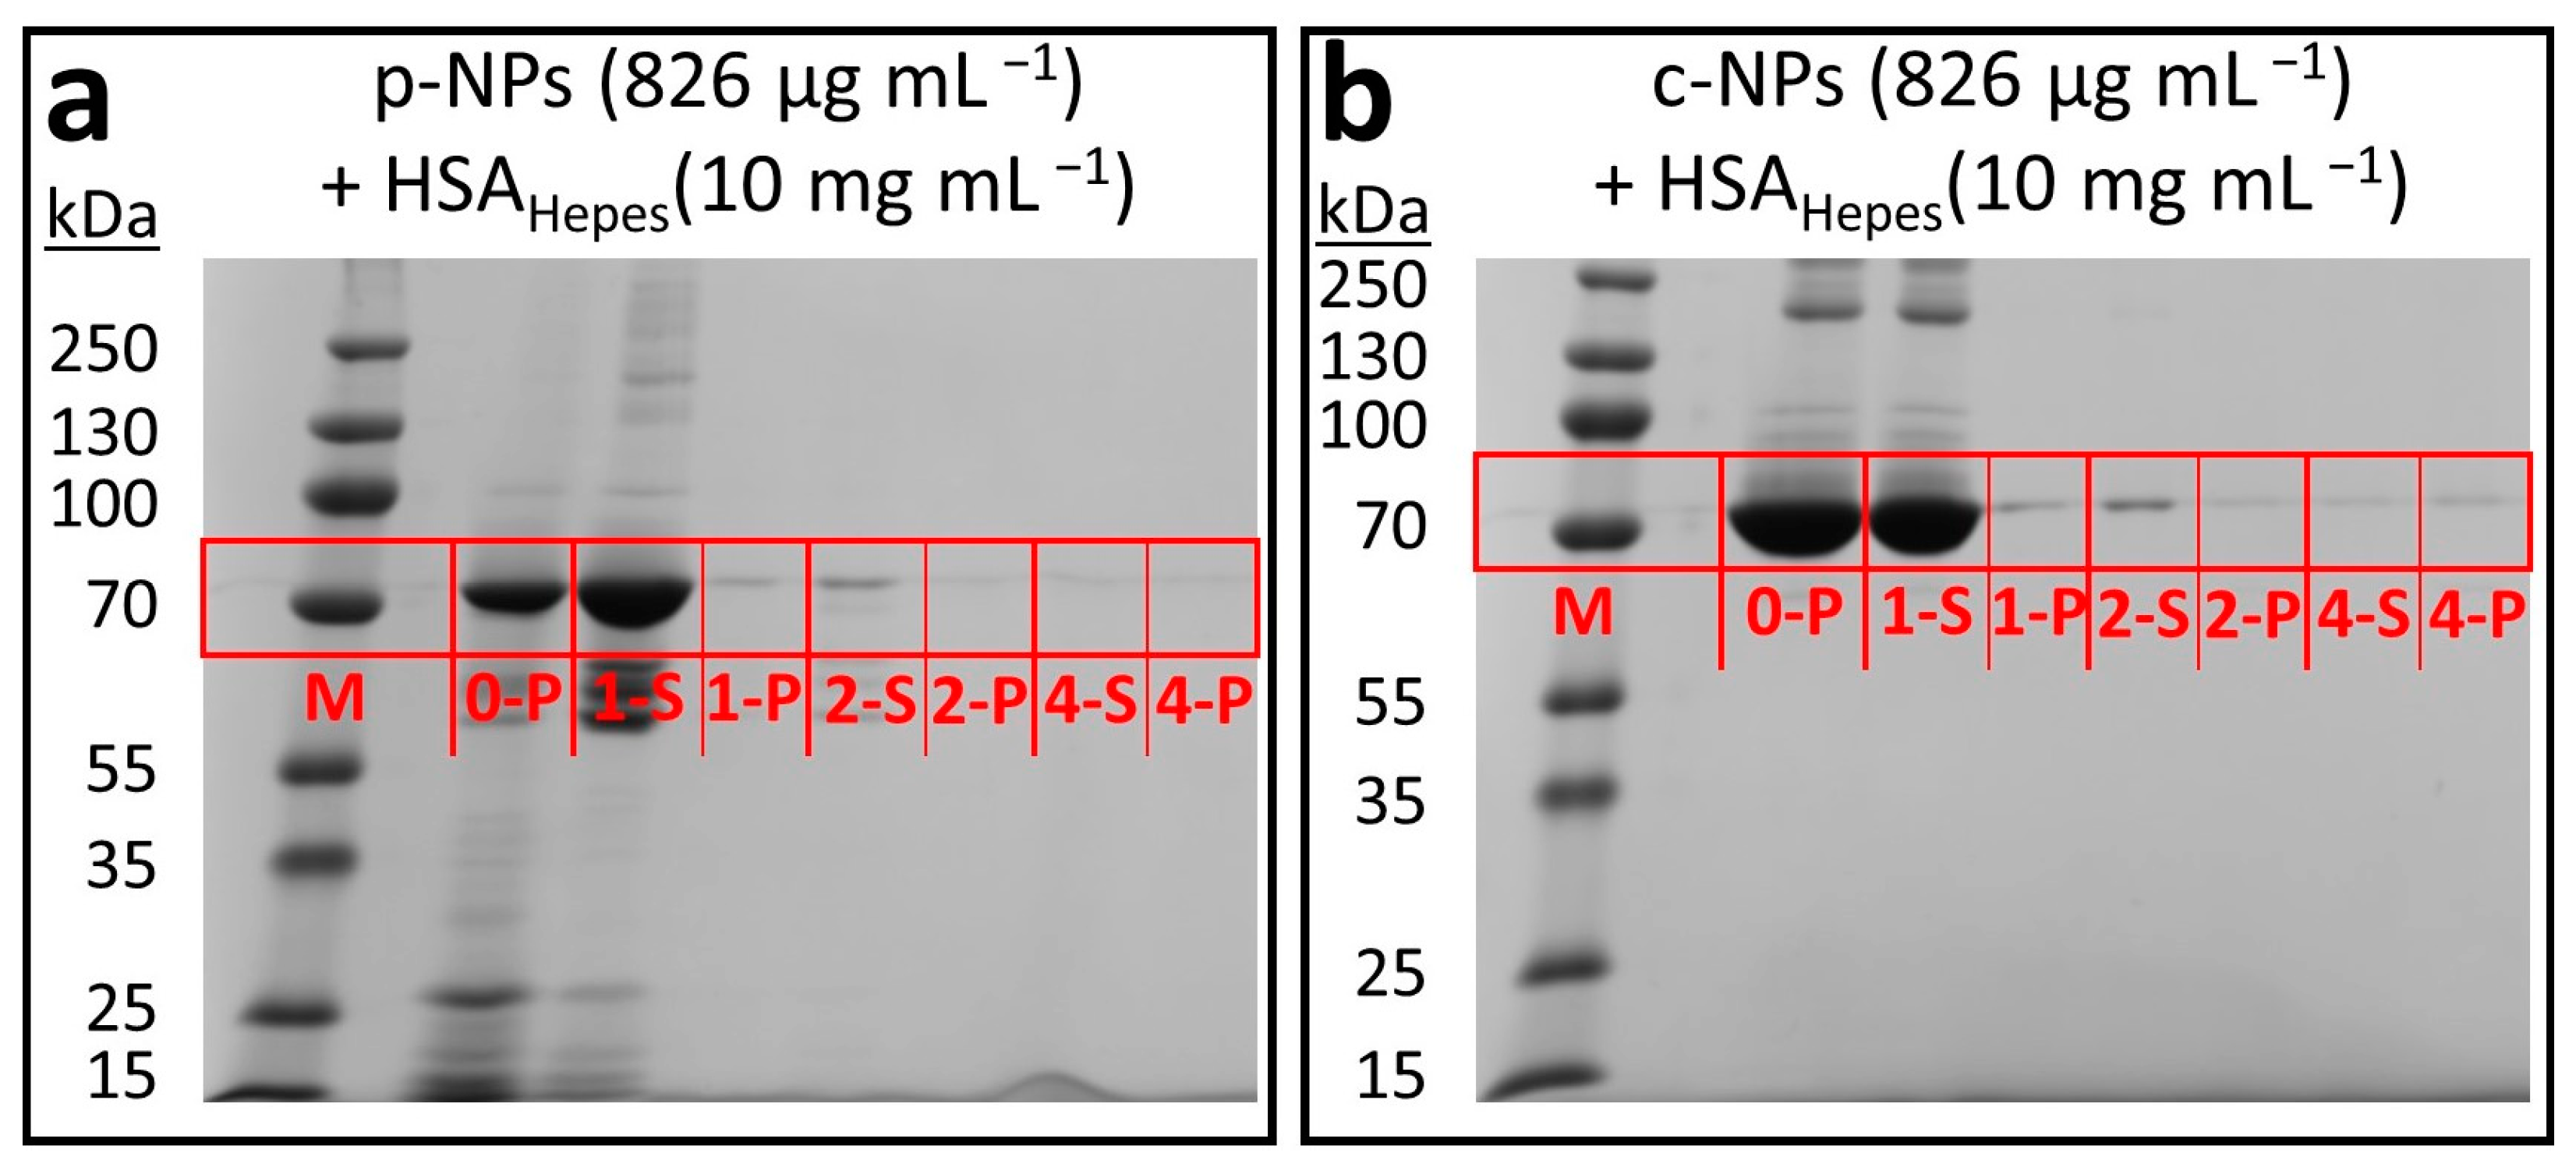
2.2.2. Influence of the Biological Shell
- TEM Studies
- DLS Studies
3. Materials and Methods
3.1. Chemicals and Materials
3.2. Cultivation of M. gryphiswaldense
3.3. Magnetosome Purification
3.4. Structural and Compositional Characterization of Nanoparticles
4. Conclusions
Supplementary Materials
Author Contributions
Funding
Institutional Review Board Statement
Informed Consent Statement
Data Availability Statement
Acknowledgments
Conflicts of Interest
Sample Availability
References
- Yildiz, I.; Sizirici Yildiz, B. Applications of Thermoresponsive Magnetic Nanoparticles. J. Nanomater. 2015, 2015, 350596. [Google Scholar] [CrossRef] [Green Version]
- Denkbaş, E.B.; Çelik, E.; Erdal, E.; Kavaz, D.; Akbal, Ö.; Kara, G.; Bayram, C. Magnetically Based Nanocarriers in Drug Delivery; Elsevier: Amsterdam, The Netherlands, 2016; ISBN 9780323428897. [Google Scholar]
- Mosayebi, J.; Kiyasatfar, M.; Laurent, S. Synthesis, Functionalization, and Design of Magnetic Nanoparticles for Theranostic Applications; WILEY-VCH Verlag: Weinheim, Germany, 2017; Volume 6, ISBN 5756151818. [Google Scholar]
- El-Boubbou, K. Magnetic Iron Oxide Nanoparticles as Drug Carriers: Clinical Relevance. Nanomedicine 2018, 13, 953–971. [Google Scholar] [CrossRef] [PubMed]
- Teja, A.S.; Koh, P.Y. Synthesis, Properties, and Applications of Magnetic Iron Oxide Nanoparticles. Prog. Cryst. Growth Charact. Mater. 2009, 55, 22–45. [Google Scholar] [CrossRef]
- Rosenfeldt, S.; Förster, S.; Friedrich, T.; Rehberg, I.; Weber, B. Self-Assembly of Magnetic Iron Oxide Nanoparticles into Cuboidal Superstructures. In Novel Magnetic Nanostructures: Unique Properties and Applications; Elsevier: Amsterdam, The Netherlands, 2018; pp. 165–189. ISBN 9780128135945. [Google Scholar]
- Uebe, R.; Schüler, D. Magnetosome Biogenesis in Magnetotactic Bacteria. Nat. Rev. Microbiol. 2016, 14, 621–637. [Google Scholar] [CrossRef]
- Lohße, A.; Borg, S.; Raschdorf, O.; Kolinko, I.; Tompa, É.; Pósfai, M.; Faivre, D.; Baumgartner, J.; Schülera, D. Genetic Dissection of the MamAB and Mms6 Operons Reveals a Gene Set Essential for Magnetosome Biogenesis in Magnetospirillum Gryphiswaldense. J. Bacteriol. 2014, 196, 2658–2669. [Google Scholar] [CrossRef] [Green Version]
- Grünberg, K.; Müller, E.C.; Otto, A.; Reszka, R.; Linder, D.; Kube, M.; Reinhardt, R.; Schüler, D. Biochemical and Proteomic Analysis of the Magnetosome Membrane in Magnetospirillum Gryphiswaldense. Appl. Environ. Microbiol. 2004, 70, 1040–1050. [Google Scholar] [CrossRef] [Green Version]
- Raschdorf, O.; Bonn, F.; Zeytuni, N.; Zarivach, R.; Becher, D.; Schüler, D. A Quantitative Assessment of the Membrane-Integral Sub-Proteome of a Bacterial Magnetic Organelle. J. Proteom. 2018, 172, 89–99. [Google Scholar] [CrossRef] [Green Version]
- Mickoleit, F.; Jérôme, V.; Freitag, R.; Schüler, D. Bacterial Magnetosomes as Novel Platform for the Presentation of Immunostimulatory, Membrane-Bound Ligands in Cellular Biotechnology. Adv. Biosyst. 2020, 4, e1900231. [Google Scholar] [CrossRef]
- Mickoleit, F.; Borkner, C.B.; Toro-Nahuelpan, M.; Herold, H.M.; Maier, D.S.; Plitzko, J.M.; Scheibel, T.; Schüler, D. In Vivo Coating of Bacterial Magnetic Nanoparticles by Magnetosome Expression of Spider Silk-Inspired Peptides. Biomacromolecules 2018, 19, 962–972. [Google Scholar] [CrossRef]
- Xu, J.; Liu, L.; He, J.; Ma, S.; Li, S.; Wang, Z.; Xu, T.; Jiang, W.; Wen, Y.; Li, Y.; et al. Engineered Magnetosomes Fused to Functional Molecule (Protein A) Provide a Highly Effective Alternative to Commercial Immunomagnetic Beads. J. Nanobiotechnol. 2019, 17, 37. [Google Scholar] [CrossRef] [Green Version]
- Mickoleit, F.; Lanzloth, C.; Schüler, D. A Versatile Toolkit for Controllable and Highly Selective Multifunctionalization of Bacterial Magnetic Nanoparticles. Small 2020, 16, 1906922. [Google Scholar] [CrossRef] [PubMed]
- Staniland, S.; Ward, B.; Harrison, A.; Van Der Laan, G.; Telling, N. Rapid Magnetosome Formation Shown by Real-Time x-Ray Magnetic Circular Dichroism. Proc. Natl. Acad. Sci. USA 2007, 104, 19524–19528. [Google Scholar] [CrossRef] [PubMed] [Green Version]
- Staniland, S.S.; Rawlings, A.E. Crystallizing the Function of the Magnetosome Membrane Mineralization Protein Mms6. Biochem. Soc. Trans. 2016, 44, 883–890. [Google Scholar] [CrossRef] [Green Version]
- Alphandéry, E. Applications of Magnetosomes Synthesized by Magnetotactic Bacteria in Medicine. Front. Bioeng. Biotechnol. 2014, 2, 5. [Google Scholar] [CrossRef] [PubMed]
- Mickoleit, F.; Schüler, D. Generation of Multifunctional Magnetic Nanoparticles with Amplified Catalytic Activities by Genetic Expression of Enzyme Arrays on Bacterial Magnetosomes. Adv. Biosyst. 2018, 2, 1700109. [Google Scholar] [CrossRef]
- Rosenfeldt, S.; Mickoleit, F.; Jörke, C.; Clement, J.H.; Markert, S.; Jérôme, V.; Schwarzinger, S.; Freitag, R.; Schüler, D.; Uebe, R.; et al. Towards Standardized Purification of Bacterial Magnetic Nanoparticles for Future in Vivo Applications. Acta Biomater. 2021, 120, 293–303. [Google Scholar] [CrossRef]
- Vargas, G.; Cypriano, J.; Correa, T.; Leão, P.; Bazylinski, D.A.; Abreu, F. Applications of Magnetotactic Bacteria, Magnetosomes and Magnetosome Crystals in Biotechnology and Nanotechnology: Mini-Review. Molecules 2018, 23, 2438. [Google Scholar] [CrossRef] [Green Version]
- Majewski, P.; Thierry, B. Functionalized Magnetite Nanoparticles–Synthesis, Properties, and Bio-Applications. Crit. Rev. Solid State Mater. Sci. 2007, 32, 203–215. [Google Scholar] [CrossRef]
- Tartaj, P.; Morales, M.P.; González-Carreño, T.; Veintemillas-Verdaguer, S.; Serna, C.J. Advances in Magnetic Nanoparticles for Biotechnology Applications. J. Magn. Magn. Mater. 2005, 290–291 Pt 1, 28–34. [Google Scholar] [CrossRef]
- Zavisova, V.; Koneracka, M.; Kovac, J.; Kubovcikova, M.; Antal, I.; Kopcansky, P.; Bednarikova, M.; Muckova, M. The Cytotoxicity of Iron Oxide Nanoparticles with Different Modifications Evaluated In Vitro. J. Magn. Magn. Mater. 2015, 380, 85–89. [Google Scholar] [CrossRef]
- Fischer, A.; Schmitz, M.; Aichmayer, B.; Fratzl, P.; Faivre, D. Structural Purity of Magnetite Nanoparticles in Magnetotactic Bacteria. J. R. Soc. Interface 2011, 8, 1011–1018. [Google Scholar] [CrossRef] [PubMed]
- Mickoleit, F.; Jörke, C.; Richter, R.; Rosenfeldt, S.; Markert, S.; Rehberg, I.; Schenk, A.S.; Bäumchen, O.; Schüler, D.; Clement, J.H. Long-Term Stability, Biocompatibility and Magnetization of Suspensions of Isolated Bacterial Magnetosomes. Small 2023, 19, e2206244. [Google Scholar] [CrossRef] [PubMed]
- Rosenfeldt, S.; Riese, C.N.; Mickoleit, F.; Schüler, D.; Schenk, A.S. Probing the Nanostructure and Arrangement of Bacterial Magnetosomes by Small-Angle X-Ray Scattering. Appl. Environ. Microbiol. 2019, 85, e01513-19. [Google Scholar] [CrossRef] [Green Version]
- Obaidat, I.M.; Issa, B.; Haik, Y. Magnetic Properties of Magnetic Nanoparticles for Efficient Hyperthermia. Nanomaterials 2015, 5, 63–89. [Google Scholar] [CrossRef] [PubMed] [Green Version]
- Mickoleit, F.; Rosenfeldt, S.; Toro-Nahuelpan, M.; Schaffer, M.; Schenk, A.S.; Plitzko, J.M.; Schüler, D. High-Yield Production, Characterization, and Functionalization of Recombinant Magnetosomes in the Synthetic Bacterium Rhodospirillum Rubrum “Magneticum”. Adv. Biol. 2021, 5, e2101017. [Google Scholar] [CrossRef]
- Hergt, R.; Hiergeist, R.; Zeisberger, M.; Schüler, D.; Heyen, U.; Hilger, I.; Kaiser, W.A. Magnetic Properties of Bacterial Magnetosomes as Potential Diagnostic and Therapeutic Tools. J. Magn. Magn. Mater. 2005, 293, 80–86. [Google Scholar] [CrossRef]
- Taukulis, R.; Widdrat, M.; Kumari, M.; Heinke, D.; Rumpler, M.; Tompa, É.; Uebe, R.; Kraupner, A.; Cebers, A.; Schüler, D.; et al. Magnetic Iron Oxide Nanoparticles as MRI Contrast Agents–A Comprehensive Physical and Theoretical Study. Magnetohydrodynamics 2015, 51, 721–748. [Google Scholar] [CrossRef] [Green Version]
- Kumari, M.; Hirt, A.M.; Uebe, R.; Schüler, D.; Tompa, É.; Pósfai, M.; Lorenz, W.; Ahrentorp, F.; Jonasson, C.; Johansson, C. Experimental Mixtures of Superparamagnetic and Single-Domain Magnetite with Respect to Day-Dunlop Plots. Geochem. Geophys. Geosyst. 2015, 16, 1739–1752. [Google Scholar] [CrossRef] [Green Version]
- Schuerle, S.; Furubayashi, M.; Soleimany, A.P.; Gwisai, T.; Huang, W.; Voigt, C.; Bhatia, S.N. Genetic Encoding of Targeted Magnetic Resonance Imaging Contrast Agents for Tumor Imaging. ACS Synth. Biol. 2020, 9, 392–401. [Google Scholar] [CrossRef]
- Kraupner, A.; Eberbeck, D.; Heinke, D.; Uebe, R.; Schüler, D.; Briel, A. Bacterial Magnetosomes-Nature’s Powerful Contribution to MPI Tracer Research. Nanoscale 2017, 9, 5788–5793. [Google Scholar] [CrossRef]
- Magdalena, A.G.; Silva, I.M.B.; Marques, R.F.C.; Pipi, A.R.F.; Lisboa-Filho, P.N.; Jafelicci, M. EDTA-Functionalized Fe3O4 Nanoparticles. J. Phys. Chem. Solids 2018, 113, 5–10. [Google Scholar] [CrossRef] [Green Version]
- Abu Mukh-Qasem, R.; Gedanken, A. Sonochemical Synthesis of Stable Hydrosol of Fe3O4 Nanoparticles. J. Colloid Interface Sci. 2005, 284, 489–494. [Google Scholar] [CrossRef] [PubMed]
- Cabrera, D.; Coene, A.; Leliaert, J.; Artés-Ibáñez, E.J.; Dupré, L.; Telling, N.D.; Teran, F.J. Dynamical Magnetic Response of Iron Oxide Nanoparticles Inside Live Cells. ACS Nano 2018, 12, 2741–2752. [Google Scholar] [CrossRef]
- Lartigue, L.; Hugounenq, P.; Alloyeau, D.; Clarke, S.P.; Lévy, M.; Bacri, J.C.; Bazzi, R.; Brougham, D.F.; Wilhelm, C.; Gazeau, F. Cooperative Organization in Iron Oxide Multi-Core Nanoparticles Potentiates Their Efficiency as Heating Mediators and MRI Contrast Agents. ACS Nano 2012, 6, 10935–10949. [Google Scholar] [CrossRef] [PubMed]
- Yao, T.; Asayama, Y. Animal-Cell Culture Media: History, Characteristics, and Current Issues. Reprod. Med. Biol. 2017, 16, 99–117. [Google Scholar] [CrossRef] [PubMed] [Green Version]
- Cedervall, T.; Lynch, I.; Lindman, S.; Berggård, T.; Thulin, E.; Nilsson, H.; Dawson, K.A.; Linse, S. Understanding the Nanoparticle-Protein Corona Using Methods to Quntify Exchange Rates and Affinities of Proteins for Nanoparticles. Proc. Natl. Acad. Sci. USA 2007, 104, 2050–2055. [Google Scholar] [CrossRef] [Green Version]
- Winzen, S.; Schoettler, S.; Baier, G.; Rosenauer, C.; Mailaender, V.; Landfester, K.; Mohr, K. Complementary Analysis of the Hard and Soft Protein Corona: Sample Preparation Critically Effects Corona Composition. Nanoscale 2015, 7, 2992–3001. [Google Scholar] [CrossRef] [Green Version]
- Monopoli, M.P.; Åberg, C.; Salvati, A.; Dawson, K.A. Biomolecular Coronas Provide the Biological Identity of Nanosized Materials. Nat. Nanotechnol. 2012, 7, 779–786. [Google Scholar] [CrossRef]
- Nguyen, V.H.; Lee, B.J. Protein Corona: A New Approach for Nanomedicine Design. Int. J. Nanomed. 2017, 12, 3137–3151. [Google Scholar] [CrossRef] [Green Version]
- Fanali, G.; Di Masi, A.; Trezza, V.; Marino, M.; Fasano, M.; Ascenzi, P. Human Serum Albumin: From Bench to Bedside. Mol. Asp. Med. 2012, 33, 209–290. [Google Scholar] [CrossRef]
- Lundqvist, M.; Stigler, J.; Cedervall, T.; Berggård, T.; Flanagan, M.B.; Lynch, I.; Elia, G.; Dawson, K. The Evolution of the Protein Corona around Nanoparticles: A Test Study. ACS Nano 2011, 5, 7503–7509. [Google Scholar] [CrossRef] [PubMed]
- Gräfe, C.; Weidner, A.; Lühe, M.V.D.; Bergemann, C.; Schacher, F.H.; Clement, J.H.; Dutz, S. Intentional Formation of a Protein Corona on Nanoparticles: Serum Concentration Affects Protein Corona Mass, Surface Charge, and Nanoparticle-Cell Interaction. Int. J. Biochem. Cell Biol. 2016, 75, 196–202. [Google Scholar] [CrossRef] [PubMed]
- Glancy, D.; Zhang, Y.; Wu, J.L.Y.; Ouyang, B.; Ohta, S.; Chan, W.C.W. Characterizing the Protein Corona of Sub-10 nm Nanoparticles. J. Control. Release 2019, 304, 102–110. [Google Scholar] [CrossRef] [PubMed]
- Zeytuni, N.; Uebe, R.; Maes, M.; Davidov, G.; Baram, M.; Raschdorf, O.; Friedler, A.; Miller, Y.; Schüler, D.; Zarivach, R. Bacterial Magnetosome Biomineralization–A Novel Platform to Study Molecular Mechanisms of Human CDF-Related Type-II Diabetes. PLoS ONE 2014, 9, e97154. [Google Scholar] [CrossRef] [PubMed]
- Lang, C.; Schüler, D. Expression of Green Fluorescent Protein Fused to Magnetosome Proteins in Microaerophilic Magnetotactic Bacteria. Appl. Environ. Microbiol. 2008, 74, 4944–4953. [Google Scholar] [CrossRef] [Green Version]
- Barber-Zucker, S.; Uebe, R.; Davidov, G.; Navon, Y.; Sherf, D.; Chill, J.H.; Kass, I.; Bitton, R.; Schüler, D.; Zarivach, R. Disease-Homologous Mutation in the Cation Diffusion Facilitator Protein Mamm Causes Single-Domain Structural Loss and Signifies Its Importance. Sci. Rep. 2016, 6, 31933. [Google Scholar] [CrossRef] [Green Version]
- Laemmli, U.K. Cleavage of Structural Proteins during the Assembly of the Head of Bacteriophage T4. Nature 1970, 227, 680–685. [Google Scholar] [CrossRef]
- Fling, S.P.; Gregerson, D.S. Peptide and Protein Molecular Weight Determination by Electrophoresis Using a High-Molarity Tris Buffer System without Urea. Anal. Biochem. 1986, 155, 83–88. [Google Scholar] [CrossRef]
- Parthasarathy, L.K.; Ratnam, L.; Seelan, S.; Tobias, C.; Casanova, M.F.; Parthasarathy, R.N. Mammalian Inositol 3-Phosphate Synthase: Its Role in the Biosynthesis of Brain Inositol and Its Clinical Use as a Psychoactive Agent. In Biology of Inositols and Phosphoinositides; Springer: Berlin/Heidelberg, Germany, 2006; pp. 293–314. [Google Scholar]
- Vogler, E.A. Protein Adsorption in Three Dimensions. Biomaterials 2012, 33, 1201–1237. [Google Scholar] [CrossRef] [Green Version]
- Lesniak, A.; Campbell, A.; Monopoli, M.P.; Lynch, I.; Salvati, A.; Dawson, K.A. Serum Heat Inactivation Affects Protein Corona Composition and Nanoparticle Uptake. Biomaterials 2010, 31, 9511–9518. [Google Scholar] [CrossRef]
- Liu, Z.; Zhan, X.; Yang, M.; Yang, Q.; Xu, X.; Lan, F.; Wu, Y.; Gu, Z. A Magnetic-Dependent Protein Corona of Tailor-Made Superparamagnetic Iron Oxides Alters Their Biological Behaviors. Nanoscale 2016, 8, 7544–7555. [Google Scholar] [CrossRef] [PubMed]
- Schöttler, S.; Klein, K.; Landfester, K.; Mailänder, V. Protein Source and Choice of Anticoagulant Decisively Affect Nanoparticle Protein Corona and Cellular Uptake. Nanoscale 2016, 8, 5526–5536. [Google Scholar] [CrossRef] [PubMed] [Green Version]
- Lai, W.; Li, D.; Wang, Q.; Nan, X.; Xiang, Z.; Ma, Y.; Liu, Y.; Chen, J.; Tian, J.; Fang, Q. A Protein Corona Adsorbed to a Bacterial Magnetosome Affects Its Cellular Uptake. Int. J. Nanomed. 2020, 15, 1481–1498. [Google Scholar] [CrossRef] [PubMed] [Green Version]
- Ma, S.; Gu, C.; Xu, J.; He, J.; Li, S.; Zheng, H.; Pang, B.; Wen, Y.; Fang, Q.; Liu, W.; et al. Strategy for Avoiding Protein Corona Inhibition of Targeted Drug Delivery by Linking Recombinant Affibody Scaffold to Magnetosomes. Int. J. Nanomed. 2022, 17, 665–680. [Google Scholar] [CrossRef]
- ISO/TC 24/SC 4 ISO 22412; Technical Committee. Particle Size Analysis—Dynamic Light Scattering (DLS), 2nd ed. International Organization for Standardization: Geneva, Switzerland, 2017.
- The SasView Project Mass Fractal Model. Available online: https://www.sasview.org/docs/user/models/mass_fractal.html (accessed on 21 April 2023).
- The SasView Project Sphere Model. Available online: https://www.sasview.org/docs/user/models/sphere.html (accessed on 21 April 2023).
- Carter, D.C.; Ho, J.X. Adv. Structure of serum albumin. Adv. Protein Chem. 1994, 45, 153–176. [Google Scholar]
- Micromod Partikeltechnologie GmbH Iron Oxide Particles 45-111-701. Available online: www.micromod.de/wp-content/uploads/datasheets/45-111-701_tds_de.pdf (accessed on 19 September 2022).
- Chemicell GmbH fluidMAG-CT 4122-5. Available online: www.chemicell.com/products/nanoparticles/docs/PI_fluidMAG-CT_4122.pdf (accessed on 19 September 2022).

| Broken | Single | Small | Large | |
|---|---|---|---|---|
| c-NPs | <20 nm | 20–100 nm | 100–400 nm | >400 nm |
| p-NPs | <40 nm | 40–140 nm | 140–500 nm | >500 nm |
Disclaimer/Publisher’s Note: The statements, opinions and data contained in all publications are solely those of the individual author(s) and contributor(s) and not of MDPI and/or the editor(s). MDPI and/or the editor(s) disclaim responsibility for any injury to people or property resulting from any ideas, methods, instructions or products referred to in the content. |
© 2023 by the authors. Licensee MDPI, Basel, Switzerland. This article is an open access article distributed under the terms and conditions of the Creative Commons Attribution (CC BY) license (https://creativecommons.org/licenses/by/4.0/).
Share and Cite
Schwan, J.; Markert, S.; Rosenfeldt, S.; Schüler, D.; Mickoleit, F.; Schenk, A.S. Comparing the Colloidal Stabilities of Commercial and Biogenic Iron Oxide Nanoparticles That Have Potential In Vitro/In Vivo Applications. Molecules 2023, 28, 4895. https://doi.org/10.3390/molecules28134895
Schwan J, Markert S, Rosenfeldt S, Schüler D, Mickoleit F, Schenk AS. Comparing the Colloidal Stabilities of Commercial and Biogenic Iron Oxide Nanoparticles That Have Potential In Vitro/In Vivo Applications. Molecules. 2023; 28(13):4895. https://doi.org/10.3390/molecules28134895
Chicago/Turabian StyleSchwan, Jonas, Simon Markert, Sabine Rosenfeldt, Dirk Schüler, Frank Mickoleit, and Anna S. Schenk. 2023. "Comparing the Colloidal Stabilities of Commercial and Biogenic Iron Oxide Nanoparticles That Have Potential In Vitro/In Vivo Applications" Molecules 28, no. 13: 4895. https://doi.org/10.3390/molecules28134895